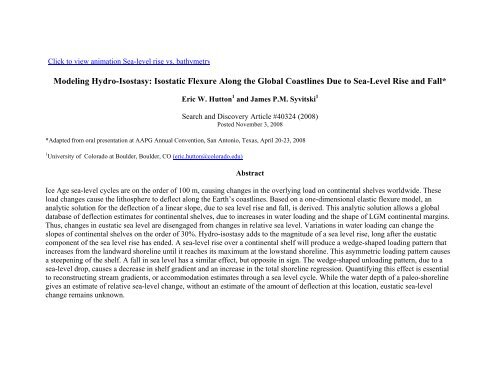
Modeling Hydro-Isostasy - Search and Discovery
Modeling Hydro-Isostasy - Search and Discovery
Modeling Hydro-Isostasy - Search and Discovery

Create successful ePaper yourself
Turn your PDF publications into a flip-book with our unique Google optimized e-Paper software.
(Click to view animation Sea-level rise vs. bathymetry)<br />
<strong>Modeling</strong> <strong>Hydro</strong>-<strong>Isostasy</strong>: Isostatic Flexure Along the Global Coastlines Due to Sea-Level Rise <strong>and</strong> Fall*<br />
Eric W. Hutton 1 <strong>and</strong> James P.M. Syvitski 1<br />
<strong>Search</strong> <strong>and</strong> <strong>Discovery</strong> Article #40324 (2008)<br />
Posted November 3, 2008<br />
*Adapted from oral presentation at AAPG Annual Convention, San Antonio, Texas, April 20-23, 2008<br />
1 University of Colorado at Boulder, Boulder, CO (eric.hutton@colorado.edu)<br />
Abstract<br />
Ice Age sea-level cycles are on the order of 100 m, causing changes in the overlying load on continental shelves worldwide. These<br />
load changes cause the lithosphere to deflect along the Earth’s coastlines. Based on a one-dimensional elastic flexure model, an<br />
analytic solution for the deflection of a linear slope, due to sea level rise <strong>and</strong> fall, is derived. This analytic solution allows a global<br />
database of deflection estimates for continental shelves, due to increases in water loading <strong>and</strong> the shape of LGM continental margins.<br />
Thus, changes in eustatic sea level are disengaged from changes in relative sea level. Variations in water loading can change the<br />
slopes of continental shelves on the order of 30%. <strong>Hydro</strong>-isostasy adds to the magnitude of a sea level rise, long after the eustatic<br />
component of the sea level rise has ended. A sea-level rise over a continental shelf will produce a wedge-shaped loading pattern that<br />
increases from the l<strong>and</strong>ward shoreline until it reaches its maximum at the lowst<strong>and</strong> shoreline. This asymmetric loading pattern causes<br />
a steepening of the shelf. A fall in sea level has a similar effect, but opposite in sign. The wedge-shaped unloading pattern, due to a<br />
sea-level drop, causes a decrease in shelf gradient <strong>and</strong> an increase in the total shoreline regression. Quantifying this effect is essential<br />
to reconstructing stream gradients, or accommodation estimates through a sea level cycle. While the water depth of a paleo-shoreline<br />
gives an estimate of relative sea-level change, without an estimate of the amount of deflection at this location, eustatic sea-level<br />
change remains unknown.
<strong>Modeling</strong> <strong>Hydro</strong>-<strong>Isostasy</strong>: Isostatic Flexure along the Global<br />
Coastlines Due to Sea-Level Rise <strong>and</strong> Fall<br />
Eric W.H. Hutton & James P.M. Syvitski<br />
CSDMS S Integration Facility<br />
INSTAAR, U. Colorado—Boulder<br />
Hutton & Syvitski, AAPG/SEPM, San Antonio, 2008<br />
Community Surface dynamics<br />
CSDMS<br />
<strong>Modeling</strong> system
Outline<br />
• Present an analytical method for the deflection of a continental shelf<br />
due to hydro-isostasy given 1) a change in eustatic sea level rise or fall,<br />
2) the shape of LGM continental margins, <strong>and</strong> 3) estimates of<br />
lithospheric thickness<br />
• Apply the model at the global scale<br />
• Discuss the implications for this model development <strong>and</strong> application<br />
Primer<br />
<strong>Hydro</strong> <strong>Isostasy</strong> is the crustal deflection related to load change from a<br />
fluctuation in sea level.<br />
The flexural response takes thous<strong>and</strong>s of years (E-folding ≈2500y) to<br />
complete because the viscous asthenosphere has to flow out of the way<br />
before the lithosphere can deflect.<br />
Isostatic displacements extend over a region much larger than the<br />
area directly affected by the load change due to the regional elastic<br />
lithosphere thickness.<br />
Hutton & Syvitski, AAPG/SEPM, San Antonio, 2008<br />
CSDMS
The flexure equation can be used to predict the<br />
deflection due to sea-level rise <strong>and</strong> fall<br />
Governing Equation D N w<br />
q(<br />
x)<br />
or<br />
4<br />
d w<br />
4<br />
dx<br />
4w<br />
4q<br />
if<br />
d<br />
4<br />
dx<br />
w<br />
2<br />
x x ,<br />
d<br />
2<br />
dx<br />
w<br />
2<br />
w w, q q , 4D<br />
4 , N 0<br />
q 0<br />
q 0<br />
<br />
New water load<br />
Sea Level<br />
Subsidence, w(x)<br />
w = deflection, x = distance perpendicular to loading, D = flexural rigidity, N = interpolate<br />
force, q = load distribution, specific gravity difference of the mantle <strong>and</strong> the added (or<br />
removed) material, <strong>and</strong> q 0 is the maximum load due to some sea-level rise or fall.<br />
Hutton & Syvitski, AAPG/SEPM, San Antonio, 2008<br />
CSDMS
Notes by Presenter: where e is the half-width of the impulse function, xbar is x/alpha or<br />
distance/flexural parameter, w = deflection
The change in shelf gradient is a function of initial<br />
gradient <strong>and</strong> sea-level change<br />
Sea-Level Rise<br />
S1<br />
<br />
S <br />
1<br />
r<br />
e<br />
S0 2<br />
xe<br />
S 0 2xx<br />
0<br />
Sea-Level Fall<br />
r<br />
1<br />
f<br />
F<br />
( x ) 1<br />
1<br />
F<br />
( x ) 1<br />
2x<br />
<br />
0<br />
0<br />
Hutton & Syvitski, AAPG/SEPM, San Antonio, 2008<br />
CSDMS
Water loading increases both shoreline transgression <strong>and</strong><br />
regression<br />
Deflections due to a change in water loading will act to augment either<br />
the normal shoreline transgression or regression.<br />
Shelf slope<br />
0.01<br />
0.001<br />
0.0001<br />
Hutton & Syvitski, AAPG/SEPM, San Antonio, 2008<br />
CSDMS
Crust t20i 2.0 is a global lcrustal model at t2° 2°×2° resolution<br />
Hutton & Syvitski, AAPG/SEPM, San Antonio, 2008<br />
CSDMS
General Bathymetric Chart of the Oceans provides<br />
global bathymetry at 2’ × 2’ resolution<br />
Hutton & Syvitski, AAPG/SEPM, San Antonio, 2008<br />
CSDMS
Measure shelf width <strong>and</strong> gradient for Earth’s shelves<br />
using GEBCO data<br />
Shelf widths form<br />
Shelf gradients are<br />
Over half the shelves<br />
an exponential ≈ lognormal with have an R 2 >0.8 to a<br />
density function mean of -3.3<br />
linear regression.<br />
Hutton & Syvitski, AAPG/SEPM, San Antonio, 2008<br />
CSDMS
Largest changes are with shelf gradient along passive margins<br />
when applied to shelves with a R 2 >0.8 to a linear regression<br />
Hutton & Syvitski, AAPG/SEPM, San Antonio, 2008<br />
CSDMS
If continental shelves are less steep during lowered sea-level,<br />
then the fluvial l bedload d would be smaller <strong>and</strong> finer grained.<br />
Bagnold (1966) calculated bedload Q b as:<br />
Q b<br />
<br />
s<br />
gQSe b<br />
s<br />
tan <br />
when u u cr<br />
s <strong>and</strong> sediment <strong>and</strong> water density respectively,<br />
g: gravity, S: surface gradient, e b : bedload efficiency,<br />
: limiting angle of repose of sediment grains lying on a river<br />
bed,<br />
u cr : critical stream velocity below which no bedload transport<br />
occurs.<br />
A 30% decrease in surface slope would have a 30%<br />
decrease in bedload<br />
Hutton & Syvitski, AAPG/SEPM, San Antonio, 2008<br />
CSDMS
B<br />
Highst<strong>and</strong> shoreline<br />
Dfl Deflection is a function of sea-level l curve <strong>and</strong> lithospheric h i relaxation time.<br />
(A) Deflection history at three points along a shelf given constant sea level<br />
rise. The lowst<strong>and</strong> shoreline subsides nearly linearly from the onset.<br />
(B) Deflection (solid line) lags the forcing (dotted line) <strong>and</strong> is attenuated.<br />
Hutton & Syvitski, AAPG/SEPM, San Antonio, 2008<br />
CSDMS
Po valley<br />
Numerical solution to the water load related to sea level rise in the Adriatic<br />
since the Last Glacial Maximum (21 Kyr) plus 10 Kyr into the future. Time<br />
step is 100 yr.<br />
Hutton & Syvitski, AAPG/SEPM, San Antonio, 2008<br />
CSDMS
Conclusions<br />
o Relative Sea Level (RSL) contributions related to hydro-isostasy y can be<br />
disengaged from eustatic sea level fluctuations.<br />
o Variations in water loading can change the slopes of continental shelves on<br />
the order of 30%.<br />
o <strong>Hydro</strong>-isostasy adds to the magnitude of a sea level rise, long after the<br />
eustatic component of the sea level rise has ended.<br />
o The wedge-shaped water loading during sea level rise causes a steepening<br />
of the shelf, <strong>and</strong> contributes to coastal retreat.<br />
o The unloading pattern, due to a sea-level drop, causes a decrease in shelf<br />
gradient <strong>and</strong> an increase in the total shoreline regression.<br />
o <strong>Hydro</strong>-isostasy is important for reconstructing stream gradients, or<br />
determining accommodation space through a sea level cycle.<br />
o While the water depth of a paleo-shoreline gives an estimate of relative<br />
sea-level change, without an estimate of the amount of deflection at this<br />
location, eustatic sea-level change remains unknown.<br />
Hutton & Syvitski, AAPG/SEPM, San Antonio, 2008<br />
CSDMS