view poster presentation, from AAPG ICE, 2009 - Search and ...
view poster presentation, from AAPG ICE, 2009 - Search and ...
view poster presentation, from AAPG ICE, 2009 - Search and ...

You also want an ePaper? Increase the reach of your titles
YUMPU automatically turns print PDFs into web optimized ePapers that Google loves.
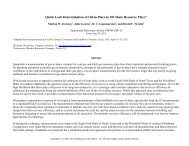
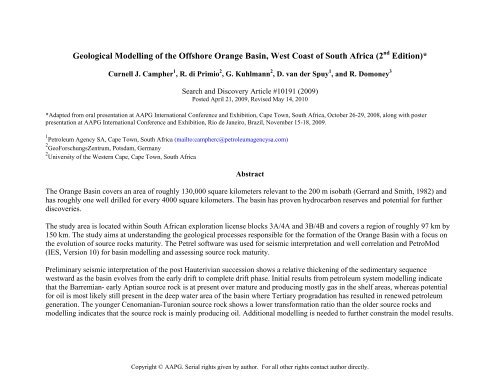
Geological Modelling of the Offshore Orange Basin, West Coast of South Africa (2 nd Edition)*<br />
Curnell J. Campher 1 , R. di Primio 2 , G. Kuhlmann 2 , D. van der Spuy 1 , <strong>and</strong> R. Domoney 3<br />
<strong>Search</strong> <strong>and</strong> Discovery Article #10191 (<strong>2009</strong>)<br />
Posted April 21, <strong>2009</strong>, Revised May 14, 2010<br />
*Adapted <strong>from</strong> oral <strong>presentation</strong> at <strong>AAPG</strong> International Conference <strong>and</strong> Exhibition, Cape Town, South Africa, October 26-29, 2008, along with <strong>poster</strong><br />
<strong>presentation</strong> at <strong>AAPG</strong> International Conference <strong>and</strong> Exhibition, Rio de Janeiro, Brazil, November 15-18, <strong>2009</strong>.<br />
1 Petroleum Agency SA, Cape Town, South Africa (mailto:campherc@petroleumagencysa.com)<br />
2 GeoForschungsZentrum, Potsdam, Germany<br />
2 University of the Western Cape, Cape Town, South Africa<br />
Abstract<br />
The Orange Basin covers an area of roughly 130,000 square kilometers relevant to the 200 m isobath (Gerrard <strong>and</strong> Smith, 1982) <strong>and</strong><br />
has roughly one well drilled for every 4000 square kilometers. The basin has proven hydrocarbon reserves <strong>and</strong> potential for further<br />
discoveries.<br />
The study area is located within South African exploration license blocks 3A/4A <strong>and</strong> 3B/4B <strong>and</strong> covers a region of roughly 97 km by<br />
150 km. The study aims at underst<strong>and</strong>ing the geological processes responsible for the formation of the Orange Basin with a focus on<br />
the evolution of source rocks maturity. The Petrel software was used for seismic interpretation <strong>and</strong> well correlation <strong>and</strong> PetroMod<br />
(IES, Version 10) for basin modelling <strong>and</strong> assessing source rock maturity.<br />
Preliminary seismic interpretation of the post Hauterivian succession shows a relative thickening of the sedimentary sequence<br />
westward as the basin evolves <strong>from</strong> the early drift to complete drift phase. Initial results <strong>from</strong> petroleum system modelling indicate<br />
that the Barremian- early Aptian source rock is at present over mature <strong>and</strong> producing mostly gas in the shelf areas, whereas potential<br />
for oil is most likely still present in the deep water area of the basin where Tertiary progradation has resulted in renewed petroleum<br />
generation. The younger Cenomanian-Turonian source rock shows a lower transformation ratio than the older source rocks <strong>and</strong><br />
modelling indicates that the source rock is mainly producing oil. Additional modelling is needed to further constrain the model results.<br />
Copyright © <strong>AAPG</strong>. Serial rights given by author. For all other rights contact author directly.
U<br />
Part 1<br />
R<br />
F<br />
A<br />
A<br />
IC<br />
N<br />
AGENCY FO<br />
R<br />
P<br />
R<br />
O<br />
M<br />
H<br />
T<br />
O<br />
T<br />
SO<br />
IO<br />
N<br />
N<br />
OF PET<br />
IO<br />
RO<br />
T<br />
A<br />
IT<br />
LO<br />
P<br />
X<br />
E<br />
D<br />
N<br />
A<br />
ION<br />
T<br />
A<br />
R<br />
LO<br />
P<br />
X<br />
E<br />
M<br />
L<br />
E<br />
U<br />
R<br />
e<br />
s p<br />
i c<br />
e<br />
P<br />
r<br />
o<br />
c<br />
i<br />
s p<br />
e<br />
Geological Modeling of the Offshore<br />
Orange Basin, West Coast of South Africa<br />
by: Curnell Campher<br />
1 2<br />
2 3<br />
Supervisors: D. Van der Spuy, G. Kulmann, R.di Primio, <strong>and</strong> R. Domoney<br />
1<br />
1<br />
2<br />
3<br />
Petroleum Agency, PO Box 1174, Parow 7499, South Africa.<br />
GeoForschungs Zentrum, Telegrafenberg, 14473 Potsdam, Germany.<br />
University of the Western Cape Private Bag X17, Bellville 7535, South Africa.<br />
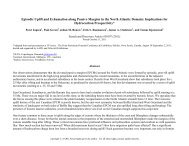
Introduction<br />
The Orange Basin is the largest <strong>and</strong> youngest of the offshore the potential multi-trillion cubic feet of natural gas reserves. 10 for basin modeling. The aim was to reconstruct the<br />
South African basins (Figure 1A) <strong>and</strong> covers an area of roughly This <strong>poster</strong> presents results <strong>and</strong> conclusions of the basin geological history including the basin formation, heat-flow<br />
130 000 square kilometres relevant to the 200m isobaths modeling conducted in the study area located within the South regimes over time, sequence stratigraphy, depositional<br />
(Gerrard <strong>and</strong> Smith, 1982). The basin is classified as under- African exploration blocks 3A/4A <strong>and</strong> 3B/4B (Figure 1B) regimes <strong>and</strong> the subsequent maturity evolution of two<br />
explored with one well drilled for every 4000 square kilometres. covering an area of roughly 97 kilometres by 150 kilometres. identified post-rift source rocks in the Orange Basin namely,<br />
Despite this, the basin has confirmed hydrocarbon reserves in The methods followed included the use of Petrel for seismic the older Barremian to Early Aptian, <strong>and</strong> the younger<br />
the form of large gas fields (Ibhubesi <strong>and</strong> Kudu gas fields) with interpretation <strong>and</strong> well correlation <strong>and</strong> PetroMod IES version Cenomanian to Turonian source rock.<br />
K-H1<br />
K-F1<br />
A-l1<br />
A-L1<br />
A-A1<br />
N<br />
Block 3B/4B<br />
Block 3A/4A<br />
X'<br />
X<br />
N<br />
Figure 1 (A): Location of the Orange Basin with exploration license blocks 3A/4A <strong>and</strong> 3B/4B<br />
Figure 1 (B): Location of the Study Area with well locations in exploration<br />
license blocks 3A/4A <strong>and</strong> 3B/4B<br />
Rifting<br />
Km<br />
0<br />
5<br />
10<br />
SW<br />
X<br />
C<br />
(Jungslager 1999)<br />
4<br />
Tert iary<br />
Ca m -<br />
Maas<br />
Seismic gas chimneys<br />
<strong>and</strong> seeps<br />
3<br />
K/T<br />
Santonian - Coniacian<br />
F l<br />
u<br />
F l<br />
u<br />
80 Ma<br />
Flu<br />
Turonian<br />
Cen<br />
m - u Alb<br />
67 Ma<br />
u A<br />
pt - l Alb<br />
13At1<br />
+<br />
+<br />
93<br />
Ma<br />
103 Ma<br />
3<br />
+<br />
22At1<br />
+<br />
+<br />
+<br />
Medial<br />
Hinge<br />
17At1<br />
+<br />
1<br />
+<br />
4<br />
4<br />
2<br />
+<br />
15At1<br />
14At1<br />
+<br />
+<br />
?<br />
+<br />
+<br />
6At 1<br />
1At1<br />
1<br />
+<br />
2<br />
+<br />
+<br />
+<br />
+<br />
+<br />
+<br />
+<br />
1<br />
+<br />
2<br />
+<br />
+<br />
+<br />
+<br />
Gas<br />
seep<br />
+<br />
NE<br />
+<br />
Margin<br />
Hinge<br />
Hauterivian<br />
RIFTED<br />
CONTINENTAL CRUST<br />
T<br />
A-J<br />
Graben<br />
X'<br />
Time<br />
Drifting<br />
• Onset of full drift signified by<br />
13At1 unconformity<br />
(Brown et al 1995)<br />
• Sequence described as thick<br />
Sedimentary wedge<br />
• Contain large growth, slump<br />
Structures <strong>and</strong> associated toe<br />
Thrusts along shelf edge<br />
Early Drift<br />
• Between Mid Aptian- Early<br />
Aptian (Brown et al 1995)<br />
• Corresponding to<br />
unconformities 6At1 <strong>and</strong> 13At1<br />
• Classified as<br />
intermediate succession.<br />
• Barremian-Early Aptian<br />
source.<br />
• Rifting was initiated along<br />
the west coast during the Late<br />
Jurassic (Muntingh 1993)<br />
• Divergent passive margin<br />
with underlying grabens <strong>and</strong><br />
half grabens.<br />
• Rifting continued until the<br />
Late Hauterivian marked by<br />
the 6At1 unconformity<br />
(Muntingh 1993)<br />
Figure 1C: Generalized cross section through the Orange Basin indicating basin evolution <strong>from</strong> rifting,<br />
early drifting to complete drifting.<br />
• Source rock association with<br />
Global Cenomanian - Turonian<br />
Anoxic event.<br />
Basin evolution<br />
The Orange Basin sediments can be categorised into three phase <strong>and</strong> are later influenced by eustatic sea level change, sedimentation barrier (Figure 2A). The onset of full drift<br />
units, namely the syn-rift, early drift <strong>and</strong> complete drift tectonics <strong>and</strong> sediment influx. The thickness map of the 6A resulted in a northward shift of the depocentre (as indicated<br />
sediments, corresponding to the active rifting, onset of drifting sequence indicates depocentres towards the middle of the on the thickness map of 13A (Figure 2A)) as the affect of<br />
<strong>and</strong> complete drifting phases of the Orange Basin's evolution study area trending sub-parallel with the coast (Figure 2A). basement architecture diminished. The 22A thickness map<br />
(Figure 1C, 2B). Sediment thickness maps indicate the These depocentres can be attributed to basement grabens <strong>and</strong> shows a thin interval on the shelf due to Late Tertiary erosion.<br />
development of depocentres influenced by areas of adequate half grabens which also trend sub-parallel to the west coast of This contributed to the development of a depocentre in the<br />
accommodation space. These depocentres are commonly South Africa. The 6A sequence thins westward due to the distal part of the basin as eroded sediment was redeposited<br />
developed within basement grabens during the initial rifting Agulhas Columbine Arch (basement high) providing a basinward (Figure 2A).<br />
erosion<br />
Two erosional events have been incorporated in the basin illustrated as two erosional maps 17At1 <strong>and</strong> 18At1 indicating over a much larger area as indicated on the 22At1 erosional<br />
model. The first <strong>and</strong> more intense of these occur during the the aerial extent <strong>and</strong> intensity of the erosion (Figure 2C). The map (Figure 2C).<br />
Early Paleogene eroding an estimated thickness of 960 meters second, less intense erosional event of the Early Miocene,<br />
down to the 17A sequence (Figure 2C). This erosional event is eroded an estimated thickness of 420 meters of sediments<br />
Petroleum Agency SA, PO Box 1174, Parow 7499, South Africa<br />
0345
U<br />
Part 2<br />
R<br />
F<br />
A<br />
A<br />
IC<br />
N<br />
AGENCY FO<br />
R<br />
P<br />
R<br />
O<br />
M<br />
H<br />
T<br />
O<br />
T<br />
SO<br />
IO<br />
N<br />
N<br />
OF PET<br />
IO<br />
RO<br />
T<br />
A<br />
IT<br />
LO<br />
P<br />
X<br />
E<br />
D<br />
N<br />
A<br />
ION<br />
T<br />
A<br />
R<br />
LO<br />
P<br />
X<br />
E<br />
M<br />
L<br />
E<br />
U<br />
R<br />
e<br />
s p<br />
i c<br />
e<br />
P<br />
r<br />
o<br />
c<br />
i<br />
s p<br />
e<br />
Isopach Maps indicating the thickness in metres at various<br />
stages in the Orange Basin evolution<br />
St<strong>and</strong>ard<br />
Chronost-<br />
ratigraphy<br />
Time<br />
in SEQUENCE CHRONOSTRATIGRAPHIC FRAMEWORK<br />
Ma DISTAL PROXIMAL<br />
MAIN EVENTS<br />
2B<br />
Erosion maps indicating the amount of sediments<br />
removed in meters<br />
Erosion map of 22A sequence<br />
2C<br />
Meters<br />
2A<br />
QUA-<br />
TER N -<br />
ARY<br />
T E R T I A R Y<br />
S E R I E S<br />
HOLO<br />
PLEI<br />
PL<br />
MI<br />
OL<br />
EO<br />
30<br />
THI N DIAMOND-<br />
BEARING VENEER<br />
WHERE SAMPLED<br />
EPISODIC UPLIFT<br />
OF HINTERLAND<br />
DURING THE<br />
TERTIARY<br />
LATE CRETACEO<br />
US /<br />
EARLY TERTIARY<br />
INTRUSIONS<br />
Meters<br />
Isopach at 22At1 unconformity<br />
U P P E R C R E T A C E O U S<br />
S T A G E S<br />
PA<br />
MA<br />
CA<br />
SA<br />
CO<br />
TU<br />
CE<br />
67<br />
80<br />
93<br />
22At1<br />
17At1<br />
15At1<br />
D R I F T<br />
EN D OF MAIN<br />
FLUVIA L INPUT<br />
GR OWTH FAULTING<br />
A ND TOE-THRUSTING<br />
MAJOR UPLIFT<br />
OF<br />
MARGIN AND<br />
GRAVI TY FAULTING<br />
CANYONING AND<br />
GRAVITY FAULTING<br />
ALONG SHELF EDGE<br />
ATLANTIC<br />
FU LLY OPEN<br />
Erosion map of 18A sequence<br />
Meters<br />
Isopach at 13At1 unconformity<br />
L O W E R C R E T A C E O U S<br />
S T A G E S<br />
AL<br />
AP<br />
BA<br />
HA<br />
VA<br />
BE<br />
103<br />
112<br />
117,5<br />
121<br />
14At1<br />
13At1<br />
6At1<br />
1At1<br />
v v v<br />
v v v v v<br />
v v v v v<br />
v v v v v v v<br />
ONSET OF THERMAL<br />
SAG AND DRIFTING<br />
v v<br />
v v v v v v v v v v<br />
POSSIBLE<br />
RI FT BASINS<br />
BELOW TH E BASALTS<br />
AR E UNKNOWN<br />
?<br />
H<br />
I<br />
N<br />
G<br />
E<br />
S Y N R I F T T -<br />
RANSIT IONAL<br />
I I THERMAL<br />
SUBSIDENC E /<br />
EUSTATI C EFFECTS<br />
REGIONAL<br />
DROWNING<br />
FIRST<br />
MARINE INCURSIONS<br />
BREAK-UP<br />
UNCONFORMITY<br />
TH E CHRONO-<br />
STRATIGRAPHY<br />
BE LOW THE<br />
HAUTERIVIA N STAGE<br />
I S SPECULATIVE<br />
Meters<br />
Erosion map of 17A sequence<br />
Meters<br />
UP PE R JURA S S IC<br />
STAGES<br />
T<br />
PRE-JURASSIC<br />
ONSET OF RIFTING<br />
BASEMENT<br />
v<br />
v<br />
v<br />
DATE OF ONSET<br />
OF RIFTING IS<br />
UNCERTAIN<br />
MAY INCLUDE POSSIBLE<br />
KAROO, CAPE, NAMA AND<br />
MALMESBURY SUPERGROUPS<br />
AND CRYSTALLINE ROCKS<br />
Meters<br />
Isopach at 6At1 unconformity<br />
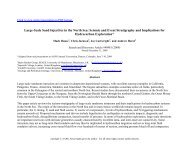
Figure 2A: Modeled depocentre development in the study area after rifting, (2B) shows the chronostratigraphy of the Orange Basin, (2C) erosional events<br />
affecting the Orange Basin in the study area.<br />
3A<br />
3B<br />
3C<br />
Figure 3A: Basin modeling input data showing different lithologies <strong>and</strong> source rock characteristics, (3B) heat flow model incorporated in<br />
basin model, (3C) map <strong>view</strong> of the heat flow trend over study area, (3D) global mean surface temperature for the southern<br />
hemisphere at latitude 33.<br />
Source rock modeling parameters<br />
3D<br />
Heat Flow = 80Mw (Rifting) to 45Mw (Present)<br />
Stretching factor 1.5<br />
Well log Lithologies<br />
Computed sediment water interface temperature<br />
Two erosional events (illustrated in three erosional maps in figure 2C)<br />
Type II source rock for both source intervals<br />
0345
U<br />
Part 3<br />
R<br />
F<br />
A<br />
A<br />
IC<br />
N<br />
AGENCY FO<br />
R<br />
P<br />
R<br />
O<br />
M<br />
H<br />
T<br />
O<br />
T<br />
SO<br />
IO<br />
N<br />
N<br />
OF PET<br />
IO<br />
RO<br />
T<br />
A<br />
IT<br />
LO<br />
P<br />
X<br />
E<br />
D<br />
N<br />
A<br />
ION<br />
T<br />
A<br />
R<br />
LO<br />
P<br />
X<br />
E<br />
M<br />
L<br />
E<br />
U<br />
R<br />
e<br />
s p<br />
i c<br />
e<br />
P<br />
r<br />
o<br />
c<br />
i<br />
s p<br />
e<br />
A-A1<br />
A-L1<br />
Barremian to Early<br />
A p t i a n S o u r c e<br />
Rock<br />
Cenomanian to<br />
Turonian Source<br />
Rock<br />
K-F1<br />
K-H1<br />
A-A1<br />
K-F1<br />
2730 m - 2830 m<br />
A-L1<br />
2961 m - 2987 m<br />
3010 m - 3040 m<br />
3040 m - 3051 m<br />
1616 m - 1634 m<br />
2335 m - 2830 m<br />
(Scattered)<br />
Cenomanian to Turonian<br />
Source Rock<br />
K-H1<br />
2580 m - 2657 m<br />
2657 m - 2697 m<br />
Barremian to early Aptian<br />
Source Rock<br />
4A<br />
4B<br />
4C<br />
Figure 4A: Source rocks in wells A-A1 <strong>and</strong> A-L1 (Barremian to Early Aptian Source Rock), (4B) total organic carbon plotted against depth for both Cenomanian to Turonian source rock, <strong>and</strong> Barremian to Early Aptian source rock.<br />
(4C) source rocks in wells K-F1 <strong>and</strong> K-H1, (Cenomanian to Turonian Source Rock).<br />
Source Rock characterisation: Two main source rock units coast of South Africa. Along the west coast of South Africa the Barremian to reaching 5 percent in well 2012/13 1 (Bray, 1998). In the Bredasdorp Basin<br />
are known to exist in the Orange Basin, the Hauterivian syn-rift source rock Early Aptian source interval has been intersected by several wells. The P-A1 along the south coast of South Africa this source interval is described as<br />
<strong>and</strong> the Barremian to Early Aptian source rock. There is also the potential for well to the south of the study area record total organic carbon (TOC) values having potential for wet gas or oil generation (Davies, 1997). Studying the<br />
a third regionally developed source interval at the Cenomanian to Turonian of 4 percent, the A-C1 to 3 wells record TOC's ranging <strong>from</strong> 2 to 4 percent, TOC plot for the two source rock intervals as intersected by the four wells,<br />
sequence boundary (Barton, 1993). The two source intervals investigated in <strong>and</strong> DSDP 361 well have TOC's ranging <strong>from</strong> 3 to 15 percent for the the Barremian to Early Aptian source rock can be categorised by having<br />
this <strong>poster</strong> are the Barremian to Early Aptian <strong>and</strong> the postulated Barremian to Early Aptian source interval (van der Spuy, 2003). The TOC values ranging <strong>from</strong> 0.6 to 3 percent. The younger Cenomanian to<br />
Cenomanian to Turonian source rocks (Figures 4 A, 4 C). The Barremian to postulated Cenomanian to Turonian source rocks are, immature where Turonian source rocks have a TOC range of between 0.6 <strong>and</strong> 2.3 percent<br />
Early Aptian source rock has been well documented along the southern <strong>and</strong> drilled with a possibility of improving to oil prone quality down dip in the (Figure 4B). The Barremian to Early Aptian <strong>and</strong> the Cenomanin to Turonian<br />
western margins of South Africa with a proven hydrocarbon system (Oribi Orange Basin (Jungslager, 1999). This source rock was intersected in wells source rocks have been respectively classified by (Muntingh 1993) to be<br />
oilfield) in the Bredasdorp Basin in the Southern Outeniqua, along the south further north, in the Namibian section of the Orange Basin with TOC's type II <strong>and</strong> Type II/Type III mixed source rocks in the Orange Basin.<br />
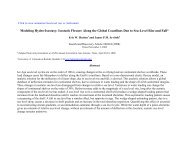
Source Rock burial history: Burial history diagrams of the<br />
K-H1 <strong>and</strong> A-I1 wells (Figure 5A) reveal the evolution of the Barremian to<br />
Early Aptian <strong>and</strong> Cenomanian to Turonian source rocks assuming thermal<br />
maturation for oil is reached at temperature between 60 <strong>and</strong> 120 º C.<br />
K-H1<br />
Investigating the maturation evolution of the Barremian to Early Aptian <strong>and</strong><br />
the Cenomanian to Turonian source rocks at well location K-H1 reveal that<br />
the former is presently found to be thermally overmature at a depth of<br />
approximately 5000 m <strong>and</strong> temperature of between 150 to 165ºC.<br />
This source rock has been matured even more during the Late Cretaceous<br />
to Early Paleogene. A maximum subsidence was then reached for the<br />
Orange Basin with a maximum burial <strong>and</strong> temperature of 5300 m <strong>and</strong> 195 to<br />
210ºC respectively (Figure 5B). The Cenomanian to Turonian source rock<br />
in this area is presently found within the thermally mature stage of 90 to<br />
105ºC. This source rock has also been subjected to slightly deeper burial<br />
<strong>and</strong> higher temperature during maximum burial of 2700 m <strong>and</strong> 120ºC<br />
(Figure 5B).<br />
K-H1<br />
K-F1 A-l1<br />
5A<br />
A-L1<br />
A-A1<br />
A-I1<br />
Investigating the maturation evolution of the Barremian to Early Aptian <strong>and</strong> the<br />
Cenomanian to Turonian source rocks of the A-I1 well reveals that the<br />
Barremian to Early Aptian source rock is presently found at a depth of<br />
approximately 4200 m. This source rock is therefore within the late stage of<br />
thermal maturity ranging <strong>from</strong> 90 to 135ºC (Figure 5C). The source rock has<br />
however, been subjected to deeper burial <strong>and</strong> higher temperatures during the<br />
Late Cretaceous to Early Paleogene, reaching a maximum depth of<br />
approximately 4500 m <strong>and</strong> a maximum temperature of 180ºC. This places it<br />
within the thermal regime of a matured source rock (Figure 5C). The burial<br />
history of the A-I1 well indicates that the Cenomanian to Turonian source rock is<br />
at present found within the very early stages of thermal maturity with<br />
temperature ranging <strong>from</strong> 45 to 60ºC (Figure 5C). This source rock has also<br />
been subjected to higher temperature <strong>and</strong> deeper burial during the Late<br />
Cretaceous to Early Paleogene when maximum burial was reached for the<br />
Orange Basin sediments. The source rock reached thermal maturity during the<br />
Late Cretaceous, reaching a maximum depth <strong>and</strong> temperature of 2400 m <strong>and</strong><br />
90ºC respectively (Figure 5C). Investigating the maturity evolution of both<br />
source rocks of the K-H1 <strong>and</strong> A-I1 wells reveal that the source rocks have<br />
entered thermal maturity earlier at the K-H1 well as compared with the A-I1 well.<br />
5B<br />
5C<br />
Figure 5A: Show study area with well locations, (5B) burial history highlighting source rock maturity evolution at the K-H1 well, (5C) burial history highlighting source rock maturity evolution at the A-I1 well<br />
0345
U<br />
Part 4<br />
R<br />
F<br />
A<br />
A<br />
IC<br />
N<br />
AGENCY FO<br />
R<br />
P<br />
R<br />
O<br />
M<br />
H<br />
T<br />
O<br />
T<br />
SO<br />
IO<br />
N<br />
N<br />
OF PET<br />
IO<br />
RO<br />
T<br />
A<br />
IT<br />
LO<br />
P<br />
X<br />
E<br />
D<br />
N<br />
A<br />
ION<br />
T<br />
A<br />
R<br />
LO<br />
P<br />
X<br />
E<br />
M<br />
L<br />
E<br />
U<br />
R<br />
e<br />
s p<br />
i c<br />
e<br />
P<br />
r<br />
o<br />
c<br />
i<br />
s p<br />
e<br />
Source Rock Transformation Ratio overlay<br />
Cenomanian to Turonian source rock: The transformation ratio overlay on the Cenomanian to Turonian<br />
source rock indicates that most of the source rock is in the oil mature phase with a more mature depocentre<br />
in the middle of the study area (depocentre of the basin) (Figure 6B). Time extractions reveal that the<br />
maximum temperature <strong>and</strong> maturity were also reached during the Late Cretaceous <strong>and</strong> Early Cenozoic<br />
respectively (Figure 6C).<br />
Barremian to Early Aptian source rock: The transformation overlay on the Barremian to Early Aptian source<br />
rock indicates that most of the source rock is overmature <strong>and</strong> is currently producing mainly gas in the central<br />
region. There is potential for oil in the distal areas of the basin (Figure 6D). Time extractions (Figure 6E) reveal<br />
that maximum temperature was reached during the Late Cretaceous <strong>and</strong> subsequent maturity was reached<br />
during the Early Cenozoic.<br />
Temperature evolution<br />
6A<br />
6B<br />
Peak Temperature<br />
6C<br />
Maturation evolution<br />
Peak hydrocarbon generation<br />
Figure 6: (6A) modeled cross section through the Orange Basin,<br />
(6B) three-dimensional source rock surface of the Cenomanian to<br />
Turonian Source Rock with transformation ratio ovelay,<br />
Temperature evolution<br />
(6C) time extractions showing peak temperature <strong>and</strong> maturation for the<br />
Cenomanian to Turonian Source Rock,<br />
(6D) three-dimensional source rock surface of the Barremian to Early<br />
Aptian Source Rock with transformation ratio ovelay,<br />
(6E) time extractions showing peak temperature <strong>and</strong> maturation for the<br />
Barremian to Early Aptian Source Rock.<br />
6D<br />
Peak Temperature<br />
Basin Modeling Calibration<br />
6E<br />
Maturation evolution<br />
Modeled calibration of temperature <strong>and</strong> vitrinite reflectance for wells<br />
K-H1 <strong>and</strong> A-I1 follows a trend that can be closely correlated to the actual<br />
evolution of the Orange Basin sediments with temperatures slightly<br />
higher than actual (Figures 7A & 7B). Comparing the modeled results<br />
with previous basin modeling conducted in the Orange Basin produces<br />
comparable results. This is shown when comparing the maturity<br />
modeling conducted by (Jungslager 1999) on the Barremian to Early<br />
Aptian source rock with the maturity modeling of this study for the same<br />
source rock (Figures 7C & 7D).<br />
Peak hydrocarbon generation<br />
K-H1<br />
A-I1<br />
7C<br />
7A<br />
7B<br />
7D<br />
Figure 7A: Vitrinite reflectance <strong>and</strong> temperature calibration at well location K-H1, (7B) Vitrinite reflectance <strong>and</strong> temperature calibration at well location A-I1, (7C) modeled maturity of the Barremian to Early Aptian Source Rock by Jungslager 1999,<br />
(7D) modeled maturity of this study of the Barremian to Early Aptian Source Rock.<br />
Conclusion<br />
Basin modeling show that both the Barremian to Early Aptian <strong>and</strong> the Cenomanian to Turonian<br />
source rock appeared to have a centrally mature region perhaps due to the thicker overburden<br />
developed over this region. Renewed source rock maturity for both the Barremian to Early<br />
Aptian <strong>and</strong> the Cenomanian to Turonian source rock is possible further basinward where<br />
thicker overburden development due to erosion of the shelf result in redeposition of sediments<br />
in the distal parts of the basin.<br />
Reference<br />
Barton, K.R., Muntingh, A., Noble, R.D.P., (1993), Geophysical <strong>and</strong> Geological studies applied to hydrocarbon exploration on the West Coast Margin of South Africa. Extended abstract of the Third International Congress of the Brazilian Geophysical Society, Rio de Janeiro, Brazil,<br />
Nov. 7-11, 1993<br />
Bray, R., Swart, R., <strong>and</strong> Lawrence, S., (1998). Source rock, maturity data indicate potential off Namibia, National petroleumcorporation of Namibia (Pty.) Ltd. Windhoek, Oil <strong>and</strong> Gas Journal, 84 89.<br />
Brown, L.F., Benson, Jr.J.M., Brink, G.J., Doherty, S., Joll<strong>and</strong>s, A., Jungslager, E.H.A., Keenan, J.H.G., Muntingh, A., <strong>and</strong> van Wyk, N.J.S., (1995). Sequence Stratigraphy in Offshore South African Divergent Basins. In: American Association of Petroleum Geologists, Tulsa,<br />
Oklahoma, Studies in Geology, 41, An Atlas on Exploration for Cretaceous Lowst<strong>and</strong> Traps by Soekor (Pty) Ltd. 139-182.<br />
Davies, C. P. N., (1997). Hydrocarbon Evolution of the Bredasdorp Basin, Offshore South Africa: From Source to Reservoir. Phd, thesis, University of Stellenbosch.<br />
Gerrard, I., Smith,G.C., (1982), Post-Paleozoic Succession <strong>and</strong> Structure of the Southwestern Africa Continental Margin. In: American Association of Petroleum Geologists, p 49 74<br />
Jungslager, E.H.A., (1999), Petroleum habitats of the Atlantic margin of South Africa. In: Cameron, N.R., Bate, R.H & Clure, V.S. (eds), The oil <strong>and</strong> gas habitats of the South Atlantic, Geological Society, London, Special Publication, 153, pg 153 168<br />
Van der Spuy, D., (2003). Aptian source rocks in some South African Cretaceous basins. In: Arthur,T.J., MacGregor, D.S & Cameron, N.R. (eds), Petroleum Geology of Africa: New Themes <strong>and</strong> Developing Technologies. Geological Society, London, Special Publication, 207, 185-<br />
202, The Geological Society of London.<br />
0345