view poster presentation, from AAPG ICE, 2009 - Search and ...
view poster presentation, from AAPG ICE, 2009 - Search and ...
view poster presentation, from AAPG ICE, 2009 - Search and ...

Create successful ePaper yourself
Turn your PDF publications into a flip-book with our unique Google optimized e-Paper software.
U<br />
Part 1<br />
R<br />
F<br />
A<br />
A<br />
IC<br />
N<br />
AGENCY FO<br />
R<br />
P<br />
R<br />
O<br />
M<br />
H<br />
T<br />
O<br />
T<br />
SO<br />
IO<br />
N<br />
N<br />
OF PET<br />
IO<br />
RO<br />
T<br />
A<br />
IT<br />
LO<br />
P<br />
X<br />
E<br />
D<br />
N<br />
A<br />
ION<br />
T<br />
A<br />
R<br />
LO<br />
P<br />
X<br />
E<br />
M<br />
L<br />
E<br />
U<br />
R<br />
e<br />
s p<br />
i c<br />
e<br />
P<br />
r<br />
o<br />
c<br />
i<br />
s p<br />
e<br />
Geological Modeling of the Offshore<br />
Orange Basin, West Coast of South Africa<br />
by: Curnell Campher<br />
1 2<br />
2 3<br />
Supervisors: D. Van der Spuy, G. Kulmann, R.di Primio, <strong>and</strong> R. Domoney<br />
1<br />
1<br />
2<br />
3<br />
Petroleum Agency, PO Box 1174, Parow 7499, South Africa.<br />
GeoForschungs Zentrum, Telegrafenberg, 14473 Potsdam, Germany.<br />
University of the Western Cape Private Bag X17, Bellville 7535, South Africa.<br />
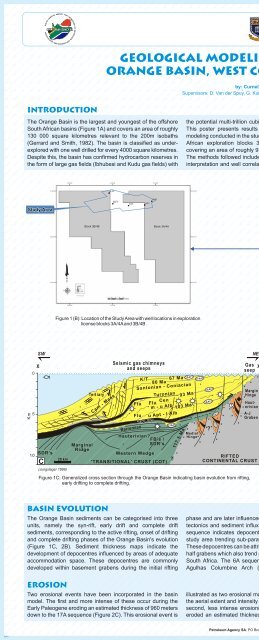
Introduction<br />
The Orange Basin is the largest <strong>and</strong> youngest of the offshore the potential multi-trillion cubic feet of natural gas reserves. 10 for basin modeling. The aim was to reconstruct the<br />
South African basins (Figure 1A) <strong>and</strong> covers an area of roughly This <strong>poster</strong> presents results <strong>and</strong> conclusions of the basin geological history including the basin formation, heat-flow<br />
130 000 square kilometres relevant to the 200m isobaths modeling conducted in the study area located within the South regimes over time, sequence stratigraphy, depositional<br />
(Gerrard <strong>and</strong> Smith, 1982). The basin is classified as under- African exploration blocks 3A/4A <strong>and</strong> 3B/4B (Figure 1B) regimes <strong>and</strong> the subsequent maturity evolution of two<br />
explored with one well drilled for every 4000 square kilometres. covering an area of roughly 97 kilometres by 150 kilometres. identified post-rift source rocks in the Orange Basin namely,<br />
Despite this, the basin has confirmed hydrocarbon reserves in The methods followed included the use of Petrel for seismic the older Barremian to Early Aptian, <strong>and</strong> the younger<br />
the form of large gas fields (Ibhubesi <strong>and</strong> Kudu gas fields) with interpretation <strong>and</strong> well correlation <strong>and</strong> PetroMod IES version Cenomanian to Turonian source rock.<br />
K-H1<br />
K-F1<br />
A-l1<br />
A-L1<br />
A-A1<br />
N<br />
Block 3B/4B<br />
Block 3A/4A<br />
X'<br />
X<br />
N<br />
Figure 1 (A): Location of the Orange Basin with exploration license blocks 3A/4A <strong>and</strong> 3B/4B<br />
Figure 1 (B): Location of the Study Area with well locations in exploration<br />
license blocks 3A/4A <strong>and</strong> 3B/4B<br />
Rifting<br />
Km<br />
0<br />
5<br />
10<br />
SW<br />
X<br />
C<br />
(Jungslager 1999)<br />
4<br />
Tert iary<br />
Ca m -<br />
Maas<br />
Seismic gas chimneys<br />
<strong>and</strong> seeps<br />
3<br />
K/T<br />
Santonian - Coniacian<br />
F l<br />
u<br />
F l<br />
u<br />
80 Ma<br />
Flu<br />
Turonian<br />
Cen<br />
m - u Alb<br />
67 Ma<br />
u A<br />
pt - l Alb<br />
13At1<br />
+<br />
+<br />
93<br />
Ma<br />
103 Ma<br />
3<br />
+<br />
22At1<br />
+<br />
+<br />
+<br />
Medial<br />
Hinge<br />
17At1<br />
+<br />
1<br />
+<br />
4<br />
4<br />
2<br />
+<br />
15At1<br />
14At1<br />
+<br />
+<br />
?<br />
+<br />
+<br />
6At 1<br />
1At1<br />
1<br />
+<br />
2<br />
+<br />
+<br />
+<br />
+<br />
+<br />
+<br />
+<br />
1<br />
+<br />
2<br />
+<br />
+<br />
+<br />
+<br />
Gas<br />
seep<br />
+<br />
NE<br />
+<br />
Margin<br />
Hinge<br />
Hauterivian<br />
RIFTED<br />
CONTINENTAL CRUST<br />
T<br />
A-J<br />
Graben<br />
X'<br />
Time<br />
Drifting<br />
• Onset of full drift signified by<br />
13At1 unconformity<br />
(Brown et al 1995)<br />
• Sequence described as thick<br />
Sedimentary wedge<br />
• Contain large growth, slump<br />
Structures <strong>and</strong> associated toe<br />
Thrusts along shelf edge<br />
Early Drift<br />
• Between Mid Aptian- Early<br />
Aptian (Brown et al 1995)<br />
• Corresponding to<br />
unconformities 6At1 <strong>and</strong> 13At1<br />
• Classified as<br />
intermediate succession.<br />
• Barremian-Early Aptian<br />
source.<br />
• Rifting was initiated along<br />
the west coast during the Late<br />
Jurassic (Muntingh 1993)<br />
• Divergent passive margin<br />
with underlying grabens <strong>and</strong><br />
half grabens.<br />
• Rifting continued until the<br />
Late Hauterivian marked by<br />
the 6At1 unconformity<br />
(Muntingh 1993)<br />
Figure 1C: Generalized cross section through the Orange Basin indicating basin evolution <strong>from</strong> rifting,<br />
early drifting to complete drifting.<br />
• Source rock association with<br />
Global Cenomanian - Turonian<br />
Anoxic event.<br />
Basin evolution<br />
The Orange Basin sediments can be categorised into three phase <strong>and</strong> are later influenced by eustatic sea level change, sedimentation barrier (Figure 2A). The onset of full drift<br />
units, namely the syn-rift, early drift <strong>and</strong> complete drift tectonics <strong>and</strong> sediment influx. The thickness map of the 6A resulted in a northward shift of the depocentre (as indicated<br />
sediments, corresponding to the active rifting, onset of drifting sequence indicates depocentres towards the middle of the on the thickness map of 13A (Figure 2A)) as the affect of<br />
<strong>and</strong> complete drifting phases of the Orange Basin's evolution study area trending sub-parallel with the coast (Figure 2A). basement architecture diminished. The 22A thickness map<br />
(Figure 1C, 2B). Sediment thickness maps indicate the These depocentres can be attributed to basement grabens <strong>and</strong> shows a thin interval on the shelf due to Late Tertiary erosion.<br />
development of depocentres influenced by areas of adequate half grabens which also trend sub-parallel to the west coast of This contributed to the development of a depocentre in the<br />
accommodation space. These depocentres are commonly South Africa. The 6A sequence thins westward due to the distal part of the basin as eroded sediment was redeposited<br />
developed within basement grabens during the initial rifting Agulhas Columbine Arch (basement high) providing a basinward (Figure 2A).<br />
erosion<br />
Two erosional events have been incorporated in the basin illustrated as two erosional maps 17At1 <strong>and</strong> 18At1 indicating over a much larger area as indicated on the 22At1 erosional<br />
model. The first <strong>and</strong> more intense of these occur during the the aerial extent <strong>and</strong> intensity of the erosion (Figure 2C). The map (Figure 2C).<br />
Early Paleogene eroding an estimated thickness of 960 meters second, less intense erosional event of the Early Miocene,<br />
down to the 17A sequence (Figure 2C). This erosional event is eroded an estimated thickness of 420 meters of sediments<br />
Petroleum Agency SA, PO Box 1174, Parow 7499, South Africa<br />
0345