articles - the School of Engineering and Applied Science - University ...
articles - the School of Engineering and Applied Science - University ...
articles - the School of Engineering and Applied Science - University ...

You also want an ePaper? Increase the reach of your titles
YUMPU automatically turns print PDFs into web optimized ePapers that Google loves.
Self-assembly <strong>and</strong> properties <strong>of</strong><br />
diblock copolymers by coarse-grain<br />
molecular dynamics<br />
ARTICLES<br />
GOUNDLA SRINIVAS 1,3 , DENNIS E. DISCHER 2,3 AND MICHAEL L. KLEIN 1,3 *<br />
1<br />
Center for Molecular Modeling,Department <strong>of</strong> Chemistry,<strong>University</strong> <strong>of</strong> Pennsylvania,Philadelphia 19104-6323,USA<br />
2<br />
Department <strong>of</strong> Chemical & Biomolecular <strong>Engineering</strong>,<strong>University</strong> <strong>of</strong> Pennsylvania,Philadelphia 19104-6315,USA<br />
3<br />
Laboratory for Research on <strong>the</strong> Structure <strong>of</strong> Matter,<strong>University</strong> <strong>of</strong> Pennsylvania,Philadelphia 19104-6202,USA<br />
*e-mail: klein@lrsm.upenn.edu<br />
Published online: 8 August 2004; doi:10.1038/nmat1185<br />
Block-copolymer amphiphiles have been observed to<br />
assemble into vesicles <strong>and</strong> o<strong>the</strong>r morphologies long<br />
known for lipids but with remarkably different properties.<br />
Coarse-grain molecular dynamics (CG-MD) is used herein<br />
to elaborate <strong>the</strong> structures <strong>and</strong> properties <strong>of</strong> diblock<br />
copolymer assemblies in water. By varying <strong>the</strong><br />
hydrophilic/hydrophobic ratio <strong>of</strong> <strong>the</strong> copolymer in line<br />
with experiment, bilayer, cylindrical <strong>and</strong> spherical micelle<br />
morphologies spontaneously assemble. Varying <strong>the</strong><br />
molecular weight (MW) with hydrophilic/hydrophobic ratio<br />
appropriate to a bilayer yields a hydrophobic core thickness<br />
that scales for large MW as a r<strong>and</strong>om coil polymer, in<br />
agreement with experiment. The extent <strong>of</strong> hydrophobicsegment<br />
overlap in <strong>the</strong> core increases nonlinearly with MW,<br />
indicative <strong>of</strong> chain entanglements <strong>and</strong> consistent with <strong>the</strong><br />
dramatic decrease reported for lateral mobility in polymer<br />
vesicles. Calculated trends with MW as well as<br />
hydrophilic/hydrophobic ratio thus agree with experiment,<br />
demonstrating that CG-MD simulations provide a rational<br />
design tool for diblock copolymer assemblies.<br />
Diblock copolymer amphiphiles are syn<strong>the</strong>tically diverse <strong>and</strong> can<br />
span molecular weights (MW) orders <strong>of</strong> magnitude greater than<br />
natural surfactants. This allows for fundamentally new insights<br />
into properties <strong>and</strong> design principles <strong>of</strong> micelles <strong>and</strong> biomimetic<br />
membranes. Indeed, amphiphilic diblock copolymers with lipid-like<br />
hydrophilic/hydrophobic proportions are known to self-assemble into<br />
vesicles in water 1–3 . Moreover, many biological membrane processes<br />
such as protein insertion 4 , fusion, DNA encapsulation 5 ,<br />
biocompatibility 6-8 <strong>and</strong> so on. have now been mimicked with syn<strong>the</strong>tic<br />
polymer vesicles. Non-biological but useful functions such as vesicle<br />
degradability for controlled release have also been realized with<br />
hydrolysable <strong>and</strong> oxidizable copolymers 8 . By altering <strong>the</strong> diblock<br />
copolymer hydrophilic/hydrophobic structure, o<strong>the</strong>r morphologies<br />
such as worm-like or spherical micelles can also readily be made 9,10 .<br />
Although a polymer approach to vesicle <strong>and</strong> micelle formation certainly<br />
broadens <strong>the</strong> range <strong>of</strong> achievable properties, <strong>the</strong>re is now an<br />
opportunity, challenge <strong>and</strong> need to provide predictive insight that is<br />
complementary to syn<strong>the</strong>sis <strong>and</strong> characterization.<br />
The use <strong>of</strong> block-copolymer membranes are motivated in part<br />
by <strong>the</strong> fact that lipid membranes are (by nature’s design) limited in<br />
<strong>the</strong>ir stability, which undermines <strong>the</strong>ir utility in applications ranging<br />
from drug delivery to sensor development 11–17 . Whereas any great<br />
increase in hydrophobic fraction <strong>of</strong> a lipid will promote a transition<br />
from membranes to an inverted phase, block copolymers allow one<br />
to maintain critically important proportions <strong>of</strong> hydrophilicity to<br />
hydrophobicity 18,19 . Compared with biomembranes, a higher average<br />
copolymer MW is typical <strong>and</strong> yields hyperthick membranes. Polymer<br />
vesicles or ‘polymersomes’ have thus provided a novel opportunity to<br />
study membrane properties experimentally as a function <strong>of</strong> thickness.<br />
Mechanically, polymersome membranes sustain dilational strains up<br />
to 40–50% compared with ∼5% or less for lipid membranes 1,2,17 .<br />
The aim here is to underst<strong>and</strong> by molecular simulation <strong>the</strong> origin <strong>of</strong><br />
such novel properties <strong>of</strong> polymersomes,as well as <strong>the</strong> microscopic basis<br />
for membrane formation versus o<strong>the</strong>r states <strong>of</strong> aggregation such as<br />
worms or micelles.<br />
nature materials | ADVANCE ONLINE PUBLICATION | www.nature.com/naturematerials 1<br />
© 2004 Nature Publishing Group
ARTICLES<br />
a<br />
b<br />
Increasing hydrophilic fraction (f phil )<br />
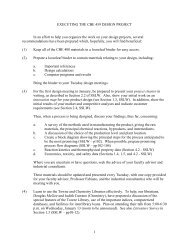
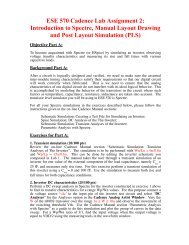
Figure 1 Snap-shots taken from coarse-grain molecular dynamics simulations <strong>of</strong><br />
diblock copolymers in water.Distinct morphologies form spontaneously when <strong>the</strong><br />
diblock copolymers have different hydrophilic fractions (f phil ).a,Bilayer assembly from<br />
30.9% (w/w) hydrophilic moiety,EO 21 EE 37 .b,Cylindrical or worm-like micelle assembled<br />
from 51.1% hydrophilic moiety EO 50 EE 37 .c,Same as in b showing <strong>the</strong> hydrophilic EO<br />
corona but without <strong>the</strong> hydrophobic EE core; <strong>the</strong> cylindrical core extends through <strong>the</strong><br />
periodic boundaries <strong>of</strong> <strong>the</strong> MD simulation cell.d,Spherical micelle formed from 65.6%<br />
hydrophilic moiety EO 92 EE 37 .Colour code:hydrophilic EO,red; hydrophobic EE,yellow;<br />
water,blue.<br />
c<br />
To date <strong>the</strong>re have been no simulation studies <strong>of</strong> blockcopolymer<br />
vesicles <strong>and</strong> micelles that come close to rationalizing <strong>the</strong><br />
experimental findings on structure, dynamics <strong>and</strong> physical<br />
properties. Existing simulation studies have been carried out<br />
using model block copolymers with simplified potentials 20–25 ,<br />
motivating a more rigorous underst<strong>and</strong>ing <strong>of</strong> microscopic details.<br />
Molecular dynamics (MD) simulations on fully atomistic models are<br />
not possible because <strong>the</strong> timescale for spontaneous self-assembly is<br />
too long (microseconds) <strong>and</strong> because <strong>the</strong> system sizes are too large<br />
(many hundreds <strong>of</strong> thous<strong>and</strong>s <strong>of</strong> atoms) to be routinely studied<br />
using currently available computers. On <strong>the</strong> o<strong>the</strong>r h<strong>and</strong>, overly<br />
simplistic polymer models will necessarily lack important details.<br />
Accordingly, in this study we rationally model both <strong>the</strong> blockcopolymer<br />
segments <strong>and</strong> water using a stepwise coarse-grain (CG)<br />
approach that has demonstrated its utility in probing a variety <strong>of</strong> slow<br />
relaxing phenomena, such as surfactant 26 <strong>and</strong> membrane selfassembly<br />
<strong>and</strong> fusion 27–35 . The CG approach used herein allows one to<br />
probe longer length- <strong>and</strong> timescales <strong>of</strong> such systems while making<br />
direct connection to more rigorous atomistic schemes 28–37 . In this<br />
work, we report <strong>the</strong> salient results <strong>of</strong> our extensive CG-MD<br />
simulations <strong>of</strong> diblock copolymer self-assembly in water.<br />
The important morphologies known to arise in diblock copolymer<br />
self-assembly have been observed to arise spontaneously in <strong>the</strong> present<br />
CG simulations (Fig.1).As with experiments 10 ,<strong>the</strong> key is to increase <strong>the</strong><br />
hydrophilic fraction <strong>of</strong> <strong>the</strong> copolymer. Bilayer <strong>and</strong> spherical micelle<br />
formation is observed at lower (f phil < 45%) <strong>and</strong> higher (f phil > 60%)<br />
hydrophilic weight fractions, respectively. Cylindrical (or worm-like)<br />
micelles are observed in a narrow range <strong>of</strong> intermediate hydrophilic<br />
weight fractions (45% < f phil < 55%). The formation <strong>of</strong> a continuous<br />
worm-like micelle is evident from Fig.1c.<br />
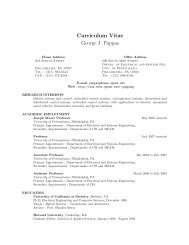
A description <strong>of</strong> <strong>the</strong> CG parameterization is given in <strong>the</strong> Methods<br />
<strong>and</strong> in <strong>the</strong> Supplementary Information, so only <strong>the</strong> salient details are<br />
mentioned here. Figure 2 depicts <strong>the</strong> rational mapping <strong>of</strong> an all-atom<br />
d<br />
polymer onto a CG model. Consecutive monomers in <strong>the</strong> CG polymer<br />
are linked by harmonic bond stretch <strong>and</strong> bend potentials that closely<br />
approximate atomistic bond lengths <strong>and</strong> angles,as shown in <strong>the</strong> insets <strong>of</strong><br />
Fig. 2. The non-bonded interactions among <strong>the</strong> CG hydrophobic sites<br />
are modelled with a Lennard–Jones 9–6 potential, whereas tabulated<br />
potentials are used for <strong>the</strong> hydrophilic sites. Coarse-grain water is<br />
treated as a fluid <strong>of</strong> spherically symmetric p<strong>articles</strong> (W), each<br />
representing a group <strong>of</strong> three water molecules.The relevant parameters<br />
for <strong>the</strong> bonded <strong>and</strong> non-bonded interaction potentials can be found in<br />
<strong>the</strong> Supplementary Information.<br />
For <strong>the</strong> systematic study <strong>of</strong> bilayers as a function <strong>of</strong> MW, <strong>the</strong><br />
CG-MD simulation system is constructed by replicating a basic unit <strong>of</strong><br />
four copolymers plus sufficient W to fully hydrate <strong>the</strong> chains. All such<br />
systems were allowed to relax <strong>and</strong> equilibrate at 298.15 K for 5 ns <strong>of</strong><br />
CG-MD. The stability <strong>of</strong> each bilayer is <strong>the</strong>n monitored for a fur<strong>the</strong>r<br />
5 ns. Each run corresponds roughly to a microsecond <strong>of</strong> all-atom<br />
simulation. Because <strong>the</strong> surface tension is sensitive to <strong>the</strong> area per<br />
polymer 38,39 we used <strong>the</strong> N A PT ensemble 40,41 ,in which box lengths in <strong>the</strong><br />
membrane plane (x, y directions) are held fixed. As a result, <strong>the</strong> normal<br />
pressure (z direction) fluctuates around a mean value, while keeping<br />
<strong>the</strong> area per polymer unchanged.<br />
Goetz <strong>and</strong> Lipowsky 27,42 systematically studied bilayer states with<br />
small negative or positive tensions <strong>and</strong> thus have been able to interpolate<br />
towards tensionless states. By following <strong>the</strong>ir method we have<br />
determined <strong>the</strong> ‘tensionless’ states. To this end, in each case <strong>the</strong> initial<br />
simulation system having area per polymer (A = 113.1 Å 2 ) is both<br />
exp<strong>and</strong>ed (tension increases) <strong>and</strong> compressed (tension decreases) in<br />
<strong>the</strong> xy plane in order to generate a series <strong>of</strong> systems with different A.<br />
The in-plane tension in each system is determined according to 27,42 ,<br />
L z / 2<br />
τ = ∫ dz [ τ T (z) – τ N (z)]<br />
(1)<br />
–L z / 2<br />
where <strong>the</strong> tangential <strong>and</strong> normal components <strong>of</strong> stress tensor are<br />
denoted by τ T <strong>and</strong> τ N , respectively. L z is <strong>the</strong> box length along <strong>the</strong><br />
z direction. Alternately, we have determined tension also by using<br />
<strong>the</strong> formula 43 , τ = 〈(L z /2) [(P zz – (P xx + P yy )/2)]〉, where P ij is <strong>the</strong> ij<br />
component <strong>of</strong> <strong>the</strong> pressure tensor. A simulation cell with zero net<br />
tension is determined <strong>and</strong> <strong>the</strong> properties obtained in that state are<br />
compared with experimental observations.All <strong>the</strong> relevant calculational<br />
details are mentioned in <strong>the</strong> Supplementary Information.<br />
Discher <strong>and</strong> co-workers 1 observed that <strong>the</strong> hydrophobic thickness<br />
(d) <strong>of</strong> polymersome membranes has a power-law dependence<br />
d = Φ(MW phob ) ς , where MW phob is <strong>the</strong> molecular weight <strong>of</strong> <strong>the</strong><br />
hydrophobic moiety,Φis a constant <strong>and</strong> ς≈1/2.This scaling corresponds<br />
to ideal r<strong>and</strong>om-coil behaviour in <strong>the</strong> core.Fully stretched chains would<br />
have given ς = 1, whereas <strong>the</strong> long-established <strong>the</strong>ory <strong>of</strong> strong<br />
segregation predicts ς = 2/3. The latter scaling is readily arrived at by<br />
minimizing (with respect to d) a free energy that contains a simple chainelasticity<br />
term <strong>and</strong> an interfacial energy per chain (~γA). Whereas <strong>the</strong><br />
experimental studies that yield a scaling <strong>of</strong> ς ≈ 1/2 involved vesicle<br />
membranes <strong>of</strong> hydrophobic thickness d ≥ 8 nm <strong>and</strong> copolymers <strong>of</strong><br />
MW ≥ 3 kDa, scaling in simulation here for lower MW chains was also<br />
examined. Six different systems were studied using CG-MD, with MW<br />
ranging from 1 kDa to 7.28 kDa <strong>and</strong> with a nearly constant<br />
hydrophilic/hydrophobic ratio.<br />
Density pr<strong>of</strong>iles <strong>of</strong> hydrophobic segments for all <strong>the</strong> systems (at<br />
τ = 0) are shown in Fig. 3a. As <strong>of</strong> yet, no such experimental<br />
measurements <strong>of</strong> <strong>the</strong> pr<strong>of</strong>iles have been made. However, a logarithmic<br />
relationship between MW phob <strong>and</strong> thickness is shown in Fig. 3b, which<br />
compares <strong>the</strong> simulations directly to experiment.The full line is a linear<br />
fit through both simulation <strong>and</strong> experiment results. The slope <strong>of</strong> <strong>the</strong><br />
scaling curve is obtained by fitting to <strong>the</strong> experimental results <strong>and</strong><br />
simulations systems with d < 7 nm. Information on scaling can also be<br />
obtained by fitting with various cut-<strong>of</strong>f values <strong>of</strong> d. The higher MW<br />
2 nature materials | ADVANCE ONLINE PUBLICATION | www.nature.com/naturematerials<br />
© 2004 Nature Publishing Group
ARTICLES<br />
OA<br />
COE<br />
P ( R ) (a.u.)<br />
P ( R ) (a.u.)<br />
3 4 5<br />
R ( Å )<br />
P ( θ ) (a.u.)<br />
P ( θ ) (a.u.)<br />
CEI<br />
0.5 1 1.5 2 2.5<br />
θ (radians)<br />
2 3<br />
4<br />
R ( Å )<br />
CEM<br />
0<br />
0.5 1 1.5 2 2.5<br />
θ (radians)<br />
CET<br />
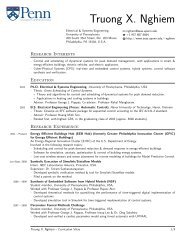
Figure 2 Coarse-graining scheme used to model a PEO-PEE diblock copolymer.The all-atom representation is shown on <strong>the</strong> left h<strong>and</strong> part <strong>of</strong> <strong>the</strong> CG structure is shown on <strong>the</strong> right.<br />
Monomer units EO <strong>and</strong> EE are represented by COE <strong>and</strong> CEM,while CEI represents <strong>the</strong> interfacial unit. End groups,namely tertiary butyl <strong>and</strong> CH 2 -OH are represented by CET <strong>and</strong> OA,<br />
respectively.Colour code for <strong>the</strong> all-atom representation:oxygen,red; carbon,green; <strong>and</strong> hydrogen,white; CG model colour code is similar to that <strong>of</strong> Fig. 1.The inset shows <strong>the</strong> comparison<br />
<strong>of</strong> bond distance <strong>and</strong> bond angle distributions for COE (top) <strong>and</strong> CEM (bottom) units obtained from all-atom (line) <strong>and</strong> CG (symbols) simulations,respectively.a.u.arbitrary units.<br />
polymers yield an exponent ς ≈ 0.5, consistent with <strong>the</strong> experimental<br />
results. In contrast, for <strong>the</strong> lower MW systems (d < 7 nm), simulation<br />
shows ς≈0.82.The latter scaling suggests strong stretching even beyond<br />
<strong>the</strong> strong segregation limit for flexible chains.This finding is consistent<br />
with <strong>the</strong> appearance <strong>of</strong> a ‘methyl trough’ in <strong>the</strong> pr<strong>of</strong>iles <strong>of</strong> <strong>the</strong> smaller<br />
MW polymers. Indeed, <strong>the</strong> density pr<strong>of</strong>ile <strong>of</strong> <strong>the</strong> smallest copolymer<br />
(that is, EO 10 EE 9 ; where EO is ethylene oxide <strong>and</strong> EE is ethyleneethylene)<br />
is strikingly similar to that <strong>of</strong> a common phospholipid<br />
(dimyristoyl phosphatidylcholine) (Fig. 3a). As <strong>the</strong> membrane<br />
becomes thicker, <strong>the</strong> density dip at <strong>the</strong> mid-plane that is typical <strong>of</strong> lipid<br />
bilayers becomes dramatically smoo<strong>the</strong>d. The merging or ‘melting’ <strong>of</strong><br />
<strong>the</strong> two leaflets <strong>of</strong> <strong>the</strong> bilayer presumably results from an effective<br />
increase in chain flexibility that opposes strong segregation <strong>and</strong><br />
stretching due to interfacial tension. The classical strong segregation<br />
limit exponent <strong>of</strong> 2/3 is thus reduced to an exponent <strong>of</strong> 1/2 that is more<br />
typical <strong>of</strong> three-dimensional melts. This insight proves useful to<br />
underst<strong>and</strong>ing distinctions with lipid as well as <strong>the</strong> novel properties <strong>of</strong><br />
high-MW copolymer membranes.<br />
As tension is applied to any membrane, <strong>the</strong> area per molecule<br />
increases, while it is being resisted by interfacial exposure. This increase<br />
in area with tension is shown in Fig. 4 for all six simulated systems.<br />
In each case,calculated values <strong>of</strong> area per polymer (A) corresponding to<br />
τ = 0 are reported in Table 1. The area elastic modulus (k a ) is related<br />
to dilation (α = ∆A/A 0 ,∆A being <strong>the</strong> variation in area) by:<br />
τ = k a (∆A/A 0 ) (2)<br />
where A 0 is identified at τ = 0. In Fig. 4, <strong>the</strong> solid line shows <strong>the</strong><br />
average behaviour <strong>of</strong> all <strong>the</strong> systems. k a is obtained from <strong>the</strong> average fit.<br />
Hence,we conclude that <strong>the</strong> elastic modulus is nearly invariant over <strong>the</strong><br />
nature materials | ADVANCE ONLINE PUBLICATION | www.nature.com/naturematerials 3<br />
© 2004 Nature Publishing Group
ARTICLES<br />
a<br />
0.5<br />
0.4<br />
0.3<br />
0.2<br />
0.1<br />
0<br />
–60 –40 –20 0 20 40 60<br />
Distance from <strong>the</strong> bilayer centre (Å)<br />
b<br />
0.54<br />
Slope = 0.67<br />
Hydrophobic density<br />
10<br />
0.5<br />
EO 10 EE 9<br />
EO 19 EE I8<br />
EO 29 EE 28<br />
EO 40 EE 37<br />
EO 56 EE 60<br />
EO 73 EE 71<br />
Lipid<br />
τ (dyn cm –1 )<br />
20<br />
0<br />
–20<br />
k a ≈ 152<br />
Simulation<br />
EO m EE n<br />
Experiment<br />
m = 10,<br />
m = 29,<br />
m = 40,<br />
m = 56,<br />
m = 73,<br />
m = 30,<br />
m = 80,<br />
m = 150,<br />
Lipid<br />
n = 9<br />
n = 28<br />
n = 37<br />
n = 60<br />
n = 71<br />
n = 40<br />
n = 125<br />
n = 250<br />
–0.1 0 0.1 0.2<br />
∆ A /A O<br />
{<br />
{<br />
d (nm)<br />
1<br />
1<br />
MW phob (kDa)<br />
Experiment<br />
Simulation<br />
Lipid<br />
10<br />
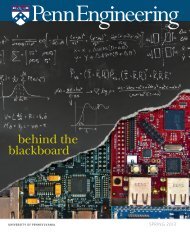
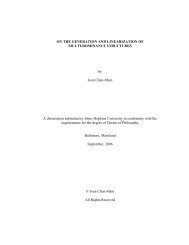
Figure 4 Master plot <strong>of</strong> membrane tension versus dilation curves for a wide range <strong>of</strong><br />
diblock copolymer systems.All <strong>the</strong> six systems studied by CG-MD simulation show<br />
nearly <strong>the</strong> same dilational behaviour as shown by <strong>the</strong> solid line.The slope <strong>of</strong> this line,k a ,<br />
proves to be very close to measurements made on giant vesicles in experiment.<br />
Experimental results for a biological lipid are also shown.The point <strong>of</strong> membrane lysis is<br />
observed in experiments for liposomes <strong>and</strong> select polymersomes as shown here,<br />
respectively,by green <strong>and</strong> red stars.<br />
Figure 3 Membrane core dimensions versus MW phob .a,Density pr<strong>of</strong>iles <strong>of</strong><br />
hydrophobic blocks for six different systems with constant f phil <strong>and</strong> variable MW.<br />
From inside–out <strong>the</strong> pr<strong>of</strong>iles are in increasing order <strong>of</strong> MW.The thickness <strong>of</strong> each system<br />
is determined by calculating <strong>the</strong> peak-to-peak distance at <strong>the</strong> half-height <strong>of</strong> <strong>the</strong> density<br />
pr<strong>of</strong>ile.For comparison,a biological lipid tail density is also shown in <strong>the</strong> same figure.<br />
b,Scaling <strong>of</strong> hydrophobic thickness with MW phob .Symbols show experimental <strong>and</strong><br />
simulation results <strong>and</strong> <strong>the</strong> full line is <strong>the</strong> linear fit.A natural lipid bilayer thickness is also<br />
shown for comparison.Best fit to simulation results yields an exponent value ∼0.5.<br />
simulated thickness range <strong>of</strong> 2–13 nm. As noted by Goetz <strong>and</strong><br />
Lipowsky 27,42 ,in <strong>the</strong> case <strong>of</strong> uncoupled monolayers,free to slide past one<br />
ano<strong>the</strong>r, <strong>the</strong> area elastic modulus (k a ) is related to <strong>the</strong> bending rigidity<br />
(k c ) by <strong>the</strong> following equation:<br />
k c = k a d 2 β (3)<br />
Where β = 1/48. For <strong>the</strong> completely coupled monolayers β = 1/12.<br />
Membrane bending analyses in <strong>the</strong>se copolymer simulation systems are<br />
not possible as <strong>the</strong> total area is too small to even perform a normal mode<br />
analysis <strong>of</strong> <strong>the</strong>rmal undulations 27 . CG lipid simulations 27 as well as<br />
recent experiments 44 on polymersomes show scaling as per equation<br />
(3).This implies that continuum properties such as τ,γ,k a apply to <strong>the</strong>se<br />
nanoscale amphiphilic systems.<br />
Experiment also shows that k a is constant within about 10% over a<br />
fivefold range in MW. A simple area-elasticity calculation 18,45 based on<br />
balancing molecular compression against interfacial energy gives<br />
k a =4γ. Simulations here imply γ ≈ 38 pN nm –1 . For reference, a purely<br />
hydrophobic water interface has γ ~ 52 pN nm –1 (ref.46).The reduction<br />
may be due to <strong>the</strong> hydrophilic (polyEO or PEO) segments at <strong>the</strong><br />
interface. Indeed, <strong>the</strong> interfacial tension has long been <strong>the</strong>orized to<br />
reflect <strong>the</strong> chemistry just at or near <strong>the</strong> interface <strong>and</strong> to obey <strong>the</strong> relation<br />
γ≈√χ,where χis <strong>the</strong> relevant Flory interaction parameter.Changing <strong>the</strong><br />
block-copolymer chemistry (for example, polystyrene or polylactic<br />
acid 5,9 hydrophobic blocks) is <strong>the</strong>refore most likely to influence γ<br />
through χ. Elasticity determinations through simulation as well as<br />
experiment should thus prove particularly revealing <strong>of</strong> <strong>the</strong> interactions<br />
that drive segregation <strong>and</strong> generate <strong>the</strong> interfaces. Likewise, <strong>the</strong> present<br />
simulation results make it relatively clear that lateral interactions<br />
between EO groups do not contribute to γ,because such interactions—<br />
hydrogen bonds, for example—would almost certainly tend to scale<br />
with chain length.<br />
With increased stretching <strong>of</strong> <strong>the</strong> membranes <strong>the</strong> smallest lipid-sized<br />
copolymer proves unable to sustain high strains. The higher-MW<br />
copolymer membranes could, in contrast, withst<strong>and</strong> strains<br />
approaching 20% or more. Despite potential complications <strong>of</strong> strain<br />
rate for rupture,<strong>the</strong> CG-MD simulation findings (Fig. 4) are consistent<br />
with experimental observations that show lipid membranes rupture at<br />
strains <strong>of</strong> ∼5% (green star) or less,whereas <strong>the</strong> much thicker copolymer<br />
membranes rupture at ∼20% strains (red star) or higher (<strong>of</strong>f-scale).<br />
In Fig. 5, separated density pr<strong>of</strong>iles for <strong>the</strong> two leaflets <strong>of</strong> <strong>the</strong><br />
membrane cores are plotted for <strong>the</strong> various polymer membranes.<br />
As shown in <strong>the</strong> left panel, <strong>the</strong> overlap thickness clearly increases with<br />
increasing chain length. This tends to smear out <strong>the</strong> summed density<br />
pr<strong>of</strong>iles as shown in Fig. 3a. The likely basis for this increased<br />
interdigitation <strong>of</strong> chains is shown in <strong>the</strong> right panel where density<br />
distributions for just <strong>the</strong> chain ends <strong>of</strong> PEE are plotted for each leaflet.<br />
With increasing chain length, <strong>the</strong> chain ends increasingly span across<br />
<strong>the</strong> hydrophobic core region. As this interdigitation increases with<br />
chain length,chains extend <strong>and</strong> increasingly entangle.<br />
A quantitative comparison <strong>of</strong> <strong>the</strong> relative extent <strong>of</strong> chain overlap<br />
with experimental measurements <strong>of</strong> diffusivity is shown in Fig. 6 as a<br />
function MW phob . As can be seen, <strong>the</strong> overlap increases rapidly for <strong>the</strong><br />
smaller chains compared with that <strong>of</strong> longer chains. This is consistent<br />
with <strong>the</strong> density pr<strong>of</strong>ile <strong>of</strong> Fig. 3 that suggests low-MW copolymers are<br />
relatively stiff but high-MW copolymers are flexible. Clearly, two<br />
4 nature materials | ADVANCE ONLINE PUBLICATION | www.nature.com/naturematerials<br />
© 2004 Nature Publishing Group
ARTICLES<br />
0.6<br />
0.3<br />
0.2<br />
n = 9<br />
0<br />
0.6<br />
0<br />
0.1<br />
0.3<br />
0.05<br />
18<br />
0<br />
0.6<br />
0<br />
Density<br />
0.3<br />
0.05<br />
28<br />
0<br />
0.6<br />
0<br />
0.05<br />
0.3<br />
0.025<br />
37<br />
0<br />
0.6<br />
0<br />
0.3<br />
0.025<br />
71<br />
0<br />
–45 –30 –15 0 15 30 45<br />
0<br />
–45 –30 –15 0 15 30 45<br />
Distance from <strong>the</strong> bilayer centre ( Å )<br />
Figure 5 Density pr<strong>of</strong>iles revealing <strong>the</strong> chain entanglement <strong>and</strong> interdigitation.Density pr<strong>of</strong>iles <strong>of</strong> hydrophobic segments <strong>of</strong> <strong>the</strong> various polymersomes studied via CG-MD<br />
simulation.The number <strong>of</strong> hydrophobic segments (n ) in <strong>the</strong> corresponding copolymer is indicated in <strong>the</strong> figure.Left panel: Density pr<strong>of</strong>iles <strong>of</strong> hydrophobic blocks in each leaflet <strong>of</strong> <strong>the</strong><br />
corresponding bilayer are drawn in red <strong>and</strong> black,respectively.Right panel: Density pr<strong>of</strong>iles <strong>of</strong> <strong>the</strong> hydrophobic tail ends alone are shown.The left panel shows that <strong>the</strong> extent <strong>of</strong> overlap<br />
or interdigitation <strong>of</strong> hydrophobic segments increases with chain length <strong>and</strong>/or MW; <strong>the</strong> right panel demonstrates that <strong>the</strong> chain entanglement increases in <strong>the</strong> same direction.<br />
distinct regimes exist with an abrupt crossover at a MW phob ≈ 1.7 kDa.<br />
This provides an explanation for <strong>the</strong> experimental measurements <strong>of</strong><br />
copolymer diffusion in polymer vesicle membranes. The experiments<br />
likewise show a crossover from simple Rouse-like lateral mobility to a<br />
more complicated activated reptation for hydrophobic molecular<br />
weights > 2 kDa (refs 47,48).<br />
To generate fur<strong>the</strong>r insight into <strong>the</strong> entanglement mechanism,<br />
configurations <strong>of</strong> individual copolymer chains in <strong>the</strong> simulation were<br />
examined.A typical snapshot <strong>of</strong> two entangled copolymers is shown in<br />
Fig. 6b. Such entanglements are not observed with <strong>the</strong> smaller-MW<br />
block copolymers where <strong>the</strong> chains appear short, stiff <strong>and</strong> straight.<br />
The difference suggests that <strong>the</strong> observed trends in diffusional dynamics<br />
Table 1 Description <strong>of</strong> various copolymers studied in this work.The number <strong>of</strong> water sites (N water ) needed to hydrate a specific number <strong>of</strong> copolymers (N poly ) increases with<br />
increasing chain length.The hydrophilic fraction in each chain is represented by f phil .The molecular weight <strong>of</strong> each chain is denoted by MW while <strong>the</strong> respective hydrophobic<br />
mass is represented by MW phob. The hydrophobic core thickness (d ) <strong>and</strong> area per polymer chain (A ) are listed only for pre-assembled bilayer structures.For <strong>the</strong> worm <strong>and</strong><br />
spherical structures d denotes <strong>the</strong> diameter.<br />
Copolymer N poly /N water f phil MW/MW phob A Morphology d<br />
(%) (kDa) (Å 2 ) (nm)<br />
EO 10 EE 9 108/2,160 45.6% 1.03/0.50 67.07 Bilayer 2.63<br />
EO 19 EE 18 128/4,000 44.8% 1.93/1.00 76.10 Bilayer 4.38<br />
EO 29 EE 28 128/4,265 44.5% 2.93/1.57 94.34 Bilayer 5.99<br />
EO 40 EE 37 128/7,776 45.6% 3.92/2.07 104.2 Bilayer 7.68<br />
EO 57 EE 60 96/8,520 42.6% 5.96/3.36 134.3 Bilayer 8.66<br />
EO 73 EE 71 96/10,368 44.5% 7.28/3.98 146.4 Bilayer 9.79<br />
EO 21 EE 37 100/7,000 30.9% 3.08/2.07 - Bilayer 8.55<br />
EO 50 EE 37 64/7,680 51.1% 4.36/2.07 - Worm 6.01<br />
EO 92 EE 37 48/24,000 65.6% 6.21/2.07 - Spherical 4.83<br />
nature materials | ADVANCE ONLINE PUBLICATION | www.nature.com/naturematerials 5<br />
© 2004 Nature Publishing Group
ARTICLES<br />
a<br />
10<br />
10<br />
b<br />
Relative overlap area (simulation)<br />
Rouse<br />
Interdigitating<br />
Entangled<br />
1<br />
0.1<br />
Experimental diffusivity (µm 2 s –1 )<br />
1<br />
1 10<br />
MW phob (kDa)<br />
0.01<br />
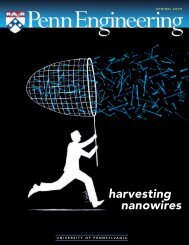
Figure 6 Chain overlap,experimental diffusivity,<strong>and</strong> chain entanglements. a,The extent <strong>of</strong> hydrophobic tail overlap observed in simulations is plotted with lateral diffusion<br />
measurements made as a function <strong>of</strong> MW phob ; <strong>the</strong> diffusion constants at room temperature were corrected to have <strong>the</strong> same monomer friction factor.The region <strong>of</strong> Rouse-like lateral<br />
mobility is also indicated. b,Simulation snapshot <strong>of</strong> two entangled EO m EE n block copolymer chains.For clarity,<strong>the</strong> hydrophobic (EE) blocks <strong>of</strong> two chains are shown in two different colours<br />
(yellow <strong>and</strong> green).<br />
originate in configurational arrangements such as entanglements that<br />
are fostered by increasingly interdigitated <strong>and</strong> flexible chains.<br />
In conclusion, by carrying out CG-MD simulations on diblock<br />
copolymers in water we showed that <strong>the</strong> copolymer hydrophilic fraction<br />
f phil plays a crucial role in determining <strong>the</strong> final morphology <strong>of</strong> <strong>the</strong> selfassembling<br />
system as known experimentally. In addition to providing<br />
molecular-level insight for such observations, <strong>the</strong> present CG<br />
simulation study also complements <strong>the</strong> experiments. For example, <strong>the</strong><br />
MW dependence <strong>of</strong> <strong>the</strong> hydrophobic thickness reveals that only large<br />
MW polymers follow <strong>the</strong> ς≈0.5 trend seen experimentally.Smaller MW<br />
systems (with d < 7 nm) were not explored in experimental studies but<br />
yielded ς ≈ 0.82 in simulation, which indicates more stretched <strong>and</strong><br />
ordered configurations consistent with lipids.The area elastic-modulus<br />
values obtained from <strong>the</strong> CG simulations are in qualitative agreement<br />
with <strong>the</strong> experimental results. Additionally, k a is found to be nearly<br />
invariant with hydrophobic thickness <strong>and</strong> MW. This is in accordance<br />
with recent experiments, which concluded that <strong>the</strong> elastic modulus is<br />
solely determined by <strong>the</strong> chemical composition <strong>of</strong> <strong>the</strong> interfacial units 18 .<br />
The computed density pr<strong>of</strong>iles provide distinctive insight into<br />
polymersome structure. It is observed that unlike lipid bilayers that<br />
show a definitive density depletion (methyl trough) in <strong>the</strong>ir interior,<br />
monodisperse block copolymers show only a minimal density dip<br />
with increasing MW. Neutron scattering <strong>and</strong> o<strong>the</strong>r methods should<br />
be able to probe such trends given a set <strong>of</strong> suitably modified<br />
copolymers. However, it is already clear from pr<strong>of</strong>iles <strong>of</strong> individual<br />
leaflets <strong>of</strong> <strong>the</strong> bilayers that with increasing copolymer MW, <strong>the</strong> core<br />
chain-ends bend <strong>and</strong> localize increasingly at <strong>the</strong> aqueous interface.<br />
Chain entanglement <strong>the</strong>reby combines with chain overlap<br />
(interdigitation) to decrease <strong>the</strong> lateral mobility <strong>of</strong> <strong>the</strong> diblocks in<br />
thicker membranes. Overall, <strong>the</strong> CG simulation results compare<br />
well with <strong>the</strong> many experimental observations on a series <strong>of</strong><br />
PEO–polybutadiene <strong>and</strong> PEO–PEE diblocks,suggestive <strong>of</strong> <strong>the</strong> generic<br />
nature <strong>of</strong> <strong>the</strong> current model. This suggests that although <strong>the</strong> current<br />
CG model is developed based on this chemistry, <strong>the</strong> methods can be<br />
readily extended to study <strong>the</strong> structure <strong>and</strong> properties <strong>of</strong> o<strong>the</strong>r block<br />
copolymers such as PEO–polylactic acid <strong>and</strong> o<strong>the</strong>rs 5 . The CG<br />
approach herein would thus seem to <strong>of</strong>fer a rational design tool for<br />
syn<strong>the</strong>sis <strong>of</strong> novel, block-copolymer architectures.<br />
METHODS<br />
The detailed description <strong>of</strong> CG parameterization 28,38 is described in <strong>the</strong> Supplementary Information, but<br />
<strong>the</strong> necessary details are mentioned briefly in <strong>the</strong> following. To study <strong>the</strong> self-assembly, <strong>the</strong> simulation<br />
system is constructed by initially distributing CG polymer chains on a three-dimensional cubic lattice<br />
<strong>and</strong> hydrating <strong>the</strong> resulting system with sufficient CG water W sites. The resulting simulation system<br />
contains EO/EE copolymers <strong>and</strong> water with <strong>the</strong> ratio shown in Table 1. This system is <strong>the</strong>n equilibrated at<br />
<strong>the</strong> desired <strong>the</strong>rmodynamic state (298.15 K temperature <strong>and</strong> 1 atm. pressure) by keeping <strong>the</strong> polymers<br />
immobile. This results in a suitable initial unbiased lattice configuration. Because we aim to study natural<br />
self-assembly, in order to avoid unwanted compressions/expansions during <strong>the</strong> simulations, an isobaric<br />
NPT ensemble is used. This ensemble isotropically compresses/exp<strong>and</strong>s <strong>the</strong> box lengths, in contrast to<br />
general NPT ensemble.<br />
6 nature materials | ADVANCE ONLINE PUBLICATION | www.nature.com/naturematerials<br />
© 2004 Nature Publishing Group
ARTICLES<br />
On <strong>the</strong> o<strong>the</strong>r h<strong>and</strong>, for <strong>the</strong> pre-assembled cases, <strong>the</strong> simulation system is constructed in a box by<br />
replicating a basic unit containing four polymer chains (two in <strong>the</strong> upper leaflet <strong>and</strong> two in <strong>the</strong> lower<br />
leaflet) with sufficient CG water W sites. Polymer chains are placed in such a way that <strong>the</strong> hydrophobic<br />
tails face each o<strong>the</strong>r, while <strong>the</strong> hydrophilic parts are exposed to water. This system is allowed to relax <strong>and</strong><br />
equilibrate at 298.15 K. We <strong>the</strong>n replicated <strong>the</strong> simulation cell in <strong>the</strong> xy plane to generate polymer<br />
systems with, respectively 8, 16, 32, 64 <strong>and</strong> 128 polymers. After delicate adjustments to remove<br />
overlapping waters, <strong>the</strong> simulation systems resulted in <strong>the</strong> copolymer/water ratios presented in Table 1.<br />
In order to compare our simulation results with <strong>the</strong> experimental results, it is necessary to carry out<br />
MD simulations with constant surface area per polymer (A) that corresponds to zero tension. This is an<br />
important observation because <strong>the</strong> surface/interfacial tension <strong>of</strong> <strong>the</strong> system is very sensitive to <strong>the</strong><br />
quantity A <strong>and</strong> can vary over an order <strong>of</strong> magnitude by moderately changing surface area. Hence, for this<br />
purpose we have chosen an N A PT ensemble. In this ensemble, <strong>the</strong> simulation box length in <strong>the</strong> x <strong>and</strong> y<br />
directions is fixed while it is allowed to vary in <strong>the</strong> z direction. As a result, <strong>the</strong> normal pressure in <strong>the</strong> z<br />
direction fluctuates around a mean (pressure) value, while keeping <strong>the</strong> surface area per polymer<br />
unchanged. More details in this regard are presented in <strong>the</strong> Supplementary Information.<br />
The simulation system in each case was allowed to relax <strong>and</strong> equilibrate at 298.15 K for 5 ns. For <strong>the</strong><br />
next 5 ns, <strong>the</strong> stability <strong>of</strong> <strong>the</strong> system was monitored. As mentioned in earlier studies, <strong>the</strong> CG approach<br />
involves larger size interacting sites <strong>and</strong> s<strong>of</strong>ter potentials, which essentially results in <strong>the</strong> timescales that<br />
are dilated by two orders <strong>of</strong> magnitude larger in comparison with <strong>the</strong> all-atom simulation times. All <strong>of</strong> <strong>the</strong><br />
times reported in this article are <strong>the</strong> actual CG simulation times, <strong>and</strong> not <strong>the</strong> effective simulation times,<br />
which are probably two orders <strong>of</strong> magnitude longer.<br />
Received 17 February 2004; accepted 17 June 2004; published 8 August 2004.<br />
References<br />
1. Discher, B. M. et al. Polymersomes: Tough vesicles made from diblock copolymers. <strong>Science</strong> 284,<br />
1143–1146 (1999).<br />
2. Cornelissen, J. L. M., Fisher, M., Sommerdijk, N. A. J. M. & Nolte R. J. M. Helical superstructures<br />
from charged poly(styrene)-poly(isocyanodipeptide) block copolymers. <strong>Science</strong> 280, 1427–1430<br />
(1998).<br />
3. Meier, W., Nardin, C. & Winterhalter, M. Reconstitution <strong>of</strong> channel proteins in (polymerized) ABA<br />
triblock copolymer membranes. Angew. Chem. Int. Edn 39, 4599–4602 (2000).<br />
4. Nardin, C., Widmer, J., Winterhalter, M. & Meier, W. Amphiphilic block copolymer nanocontainers as<br />
bioreactors. Eur.Phys.J.E4, 403–410 (2001).<br />
5. Okada, J., Cohen, S. & Langer, R. In-vitro evaluation <strong>of</strong> polymerized liposomesas an oral-drug delivery<br />
system. Pharmaceut. Res. 12, 576–582 (1995).<br />
6. Discher, D. E. & Eisenberg, A. Polymer vesicles. <strong>Science</strong> 297, 967–973 (2002).<br />
7. Hamley, I. W. Nanostructure fabrication using block copolymers. Nanotechnology 14, R39–R54<br />
(2003).<br />
8. Napoli, A. V., Valentini, M., Tirelli, N., Müller, M. & Hubbell, J. A. Oxidation-responsive polymeric<br />
vesicles. Nature Mater. 3, 183–189 (2004).<br />
9. Zhang, L. F. & Eisenberg, A. Multiple morphologies <strong>of</strong> crew-cut aggregates <strong>of</strong> polystyrene-Bpoly(acrylic<br />
acid) block-copolymers. <strong>Science</strong> 268, 1728–1731 (1995).<br />
10. Jain, S. & Bates, F. S. On <strong>the</strong> origins <strong>of</strong> morphological complexity in block copolymer surfactants.<br />
<strong>Science</strong> 300, 460–464 (2003).<br />
11. Tew, G. N. et al. De novo design <strong>of</strong> biomimetic antimicrobial polymers. Proc. Natl Acad. Sci. USA 99,<br />
5110–5114 (2002).<br />
12. Lipowsky R, & Sackman, E. (eds) Structure <strong>and</strong> Dynamics <strong>of</strong> Membranes (Elsevier, Amsterdem, 1995).<br />
13. Cevc, G. Phospholipids H<strong>and</strong>book (Marcel Decker, New York, 1993).<br />
14. Chakraborty, A. K. & Golumbfskie, A. J. Polymer adsorption driven self-assembly <strong>of</strong> nanostructures.<br />
Ann. Rev. Phys. Chem. 52, 537–573 (2001).<br />
15. Balsara, N. P., Garetz, B. A., Newstein, M. C., Bauer, B. J. & Prosa, T. J. Evolution <strong>of</strong> microstructure in<br />
<strong>the</strong> liquid <strong>and</strong> crystal directions in a quenched block copolymer melt. Macromolecules 31, 7668–7675<br />
(1998).<br />
16. Forster, S., Zisenis, M., Wenz, E. & Antonietti, M. Micellization <strong>of</strong> strongly segregated block<br />
copolymers. J. Chem. Phys. 104, 9956–9970 (1996).<br />
17. Needham, D. & Zhelev, D. V. The Mechanochemistry <strong>of</strong> Lipid Vesicles Examined by Micropipette<br />
Manipulation Techniques in Vesicles (ed. Ros<strong>of</strong>f, M.) Ch. 9 (Marcel Dekker, New York, 2000).<br />
18. Bermudez, H., Brannan, A. K., Hammer, D. A., Bates, F. S. & Discher, D. E. Molecular weight<br />
dependence <strong>of</strong> polymersome membrane structure, elasticity, <strong>and</strong> stability. Macromolecules 35,<br />
8203–8208 (2002).<br />
19. Hillmyer, M. A. & Bates, F. S. Syn<strong>the</strong>sis <strong>and</strong> characterization <strong>of</strong> model polyalkane-poly(ethylene<br />
oxide) block copolymers. Macromolecules 29, 6994–7002 (1996).<br />
20. Pakula, T., Karatasos, K., Anastasiadis, S. H. & Fytas, G. Computer simulation <strong>of</strong> static <strong>and</strong> dynamic<br />
behavior <strong>of</strong> diblock copolymer melts. Macromolecules 30, 8463–8472 (1997).<br />
21. Schultz, A. J., Hall, C. K. & Genzer, J. Computer simulation <strong>of</strong> copolymer phase behavior. J. Chem. Phys.<br />
117, 10329–10338 (2002).<br />
22. Pastor, R. W., Venable, R. M., Karplus, M. & Szabo, A. A simulation based model <strong>of</strong> nmr T1 relaxation<br />
in lipid bilayer vesicles. J. Chem. Phys. 89, 1128–1140 (1988).<br />
23. Noguchi, H. & Takasu, M. Fusion pathways <strong>of</strong> vesicles: A Brownian dynamics simulation. J. Chem. Phys.<br />
115, 9547–9551 (2001).<br />
24. Noguchi, H. Fusion <strong>and</strong> toroidal formation <strong>of</strong> vesicles by mechanical forces: A Brownian dynamics<br />
simulation. J. Chem. Phys. 117, 8130–8137 (2002).<br />
25. Srinivas, G. & Bagchi, B. Detection <strong>of</strong> collapsed <strong>and</strong> ordered polymer structures by fluorescence<br />
resonance energy transfer in stiff homopolymers: Bimodality in <strong>the</strong> reaction efficiency distribution.<br />
J. Chem. Phys. 116, 837–844 (2002).<br />
26. Smit, B. et al. Structure <strong>of</strong> a water/oil interface in <strong>the</strong> presence <strong>of</strong> micelles: a computer simulation<br />
study. J. Phys. Chem. 95, 6361–6368 (1991).<br />
27. Goetz, R., Gompper, G. & Lipowsky, R. Mobility <strong>and</strong> elasticity <strong>of</strong> self-assembled membranes.<br />
Phys.Rev.Lett.82, 221–224 (1999).<br />
28. Shelley, J. C., Shelley, M. Y., Reeder, R. C., B<strong>and</strong>yopadhyay, S. & Klein, M. L. A coarse grain model for<br />
phospholipid simulations. J. Phys. Chem. B 105, 4464–4470 (2001).<br />
29. Tieleman, D. P. & Marrink, S. J. Potential <strong>of</strong> mean force <strong>of</strong> a lipid in a lipid bilayer. Biophys. J. 84,<br />
368–369 (2003).<br />
30. Tieleman, D. P., Leontiadou, H., Mark, A. E. & Marrink, S. J. Simulation <strong>of</strong> pore formation in lipid<br />
bilayers by mechanical stress <strong>and</strong> electric fields. J. Am. Chem. Soc. 125, 6382–6383 (2003).<br />
31. Marrink, S. J. & Tieleman, D. P. Molecular dynamics simulation <strong>of</strong> a lipid diamond cubic phase.<br />
J. Am. Chem. Soc. 123, 12383–12391 (2001).<br />
32. Marrink, S. J., Lindahl, E., Edholm, O. & Mark, A. E. Simulation <strong>of</strong> <strong>the</strong> spontaneous aggregation <strong>of</strong><br />
phospholipids into bilayers. J. Am. Chem. Soc. 123, 8638–8639 (2001).<br />
33. Marrink, S. J. & Mark, A. E. Effect <strong>of</strong> undulations on surface tension in simulated bilayers. J. Phys.<br />
Chem. B 105, 6122–6127 (2001).<br />
34. Marrink, S. J. & Mark, A. E. Molecular dynamics simulation <strong>of</strong> <strong>the</strong> formation, structure, <strong>and</strong><br />
dynamics <strong>of</strong> small phospholipid vesicles. J. Am. Chem. Soc. 125, 15233–15242 (2003).<br />
35. Nielsen, S. O. & Klein, M. L. Bridging Time Scales: Molecular Simulations for <strong>the</strong> Next Decade (eds<br />
Nielaba, P., Mareschali, M. <strong>and</strong> Ciccotti, G.) 27–63 (Elsevier <strong>Science</strong>, Amsterdam, 2003).<br />
36. Shelley, J. C. et al. Simulations <strong>of</strong> phospholipids using a coarse grain model. J. Phys. Chem. B 105,<br />
9785–9792 (2001).<br />
37. Nielsen, S. O., Lopez, C. F., Moore, P. B., Shelley, J. C. & Klein, M. L. Molecular dynamics<br />
investigations <strong>of</strong> lipid langmuir monolayers using a coarse-grain model. J. Phys. Chem. B 107,<br />
13911–13917 (2003).<br />
38. Srinivas, G., Shelley, J. C., Nielsen, S. O., Discher, D. E. & Klein, M. L. Simulation <strong>of</strong> diblock<br />
copolymer self-assembly using a coarse-grain model. J. Phys. Chem. B 108, 8153–8160 (2004).<br />
39. Lindahl, E. & Edholm, O. Spatial <strong>and</strong> energetic-entropic decomposition <strong>of</strong> surface tension in lipid<br />
bilayers from molecular dynamics simulations. J. Chem. Phys. 113, 3882–3893 (2000).<br />
40. Feller, S. E., Zhang, Y. H. & Pastor, R. W. Computer-simulation <strong>of</strong> liquid/liquid interfaces. 2. Surfacetension<br />
area dependence <strong>of</strong> a bilayer <strong>and</strong> monolayer. J. Chem. Phys. 103, 10267–10276 (1995).<br />
41. Feller, S. E. & Pastor, R. W. Constant surface tension simulations <strong>of</strong> lipid bilayers: The sensitivity <strong>of</strong><br />
surface areas <strong>and</strong> compressibilities. J. Chem. Phys. 111, 1281–1287 (1999).<br />
42. Goetz, R. & Lipowsky, R. Computer simulations <strong>of</strong> bilayer membranes: self-assembly <strong>and</strong> interfacial<br />
tension. J. Chem. Phys. 108, 7397–7409 (1998).<br />
43. Rao, M. & Levesque, D. Surface structure <strong>of</strong> a liquid film. J. Chem. Phys. 65, 3233–3236 (1976).<br />
44. Bermudez, H., Hammer, D. A. & Discher, D. E. Effect <strong>of</strong> bilayer thickness on membrane bending<br />
rigidity. Langmuir 20, 540–543 (2004).<br />
45. Israelachvili, J. N. Intermolecular <strong>and</strong> Surface Forces (Academic, San Diego, California, 1998).<br />
46. Mark, J. E. Physical Properties <strong>of</strong> Polymers H<strong>and</strong>book (AIP Series in Polymers <strong>and</strong> Complex Materials,<br />
AIP, New York, 1996).<br />
47. Lee, J. C. M., Law, R. J. & Discher, D. E. Bending contributions hydration <strong>of</strong> phospholipid <strong>and</strong> block<br />
copolymer membranes: Unifying correlations between probe fluorescence <strong>and</strong> vesicle<br />
<strong>the</strong>rmoelasticity. Langmuir 17, 3592–3597 (2001).<br />
48. Lee, J. C. M., Santore, M., Bates, F. S. & Discher, D. E. From membranes to melts, rouse to reptation:<br />
Diffusion in polymersome versus lipid bilayers. Macromolecules 35, 323–326 (2002).<br />
Acknowledgements<br />
We would like to thank John C. Shelley, Carlos Lopez, Steve Nielsen, Ivaylo Ivanov <strong>and</strong> Preston B. Moore.<br />
This work has been supported by <strong>the</strong> National <strong>Science</strong> Foundation (Pennsylvania <strong>University</strong>’s Materials<br />
Research <strong>Science</strong> <strong>and</strong> <strong>Engineering</strong> Centre) <strong>and</strong> <strong>the</strong> National Institutes <strong>of</strong> Health.<br />
Correspondence <strong>and</strong> requests for materials should be addressed to M.L.K.<br />
Supplementary Information accompanies <strong>the</strong> paper on www.nature.com/naturematerials<br />
Competing financial interests<br />
The authors declare that <strong>the</strong>y have no competing financial interests.<br />
nature materials | ADVANCE ONLINE PUBLICATION | www.nature.com/naturematerials 7<br />
© 2004 Nature Publishing Group