MBS Research - Securitization.Net
MBS Research - Securitization.Net
MBS Research - Securitization.Net

You also want an ePaper? Increase the reach of your titles
YUMPU automatically turns print PDFs into web optimized ePapers that Google loves.
Nomura Fixed Income <strong>Research</strong><br />
<strong>MBS</strong> <strong>Research</strong><br />
Monthly Update on FHA/VA Reperforming Mortgages: Historical<br />
Prepayment Speeds, Default Losses, and Total Returns<br />
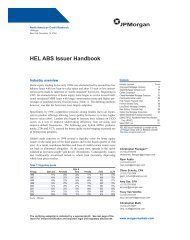
April factors showed mild increases in both 30-year Agency <strong>MBS</strong> and reperforming<br />
FHA/VA collateral. FHA/VA reperforming collateral prepaid at CPRs ranging from<br />
the low-teens to the mid-30s, with a majority in the low-to-mid 20s. GSMPS 1998-5,<br />
a very seasoned deal with a current principal balance of only $43.1 million and an<br />
original WAC of 8.97%, prepaid at 35% CPR, the highest one-month speed we have<br />
seen to date in a fixed-rate tranche. While this may draw some attention from<br />
investors, we believe that 3- and 12-month historical speeds are a better indicator of<br />
prepayment trends in this market. One-month speeds tend to be somewhat<br />
idiosyncratic, especially for small deals with current balances under $100 million.<br />
Overall, these securities continued to provide strong call protection compared to<br />
seasoned and TBA premium agency collateral, as shown in the graph and appendix<br />
attached to this report.<br />
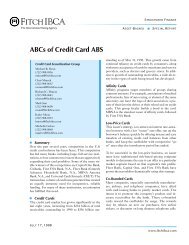
In the table on the following page, we present total return calculations for Nomura<br />
and Nomura/Countrywide underwritten FHA/VA passthroughs. The figures are<br />
tabulated from actual bid-side trader valuations as of the April 30 close, and<br />
benchmarked to FNMA TBA collateral, which is the market convention. All total<br />
return numbers given are actual holding period returns, i.e., they are not annualized.<br />
As expected in the current market environment, with low rates and a high level of<br />
refinancing, FHA/VA reperforming passthroughs outperformed TBA FNMA collateral<br />
by a substantial margin. All Nomura and Nomura/Countrywide underwritten<br />
FHA/VA passthroughs issued three or more months ago have outperformed<br />
comparable TBA FNMAs by over 200 basis points; those outstanding nine or more<br />
months have outperformed by at least 350 basis points. Due to the combination of<br />
muted prepayment speeds and market reaction to these speeds (reflected in higher<br />
price mark-ups from TBA collateral), we expect that FHA/VA reperforming<br />
passthroughs will continue to outperform FNMA TBA collateral as long as the<br />
current low-rate environment endures.<br />
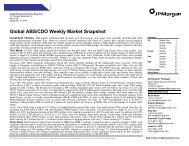
The FHA and VA absorb most of the credit losses on defaulted FHA/VA mortgages.<br />
As a result, default losses on these deals have been relatively small. In the<br />
appendix on page three, we provide the historical losses on GSMPS and<br />
Nomura/Countrywide deals. Losses on FNGT deals, which do not have mezzanine<br />
or subordinate tranches, are not publicly available. Credit losses do not exceed 43<br />
basis points on any deal, and only two deals have losses exceeding 26 basis points.<br />
Credit losses to date on Nomura and Nomura/Countrywide deals, one of which is<br />
now 23 months seasoned, do not exceed 11 basis points.<br />
May 7, 2003<br />
In the midst of the largest<br />
refinancing wave in the history<br />
of the <strong>MBS</strong> market, with today’s<br />
MBAA Refi Index back above<br />
6000, call protection remains a<br />
critical element in the<br />
performance of mortgage<br />
portfolios.<br />
Contacts:<br />
Arthur Q. Frank, CFA<br />
Director, <strong>MBS</strong> <strong>Research</strong><br />
(212) 667-1477<br />
afrank@us.nomura.com<br />
James M. Manzi<br />
Analyst, <strong>MBS</strong> <strong>Research</strong><br />
(212) 667-2231<br />
jmanzi@us.nomura.com<br />
Nomura Securities International, Inc.<br />
Two World Financial Center<br />
Building B<br />
New York, NY 10281<br />
Please read the important disclosures and analyst certifications appearing on the last page.
Nomura Fixed Income <strong>Research</strong><br />
Table: Total Return Comparison Between FHA / VA Reperforming<br />
Passthroughs and FNMA TBA Passthroughs<br />
Total Return Comparison<br />
DEAL Tranche Coupon<br />
FHA/VA<br />
Total<br />
Returns **<br />
Holding<br />
Period<br />
(Months)<br />
FN TBA *<br />
Total<br />
Returns **<br />
Total Return<br />
Outperformance<br />
(bps)<br />
FNW 2003-W1 2A 7.5 2.488% 3 0.274% 221<br />
FSPC T-51 2A 7.5 4.633% 6 0.914% 372<br />
FSPC T-51 1A 6.5 4.201% 6 2.104% 210<br />
FNW 2002-W6 2A 7.5 6.825% 9 1.762% 506<br />
FSPC T-41 3A 7.5 8.489% 11 3.215% 527<br />
FSPC T-41 2A 7 8.354% 11 3.890% 446<br />
FNW 2002-W1 2A 7.5 10.556% 13 5.007% 555<br />
FNW 2001-W3 A 7 11.222% 18 5.949% 527<br />
NAA 2001-R1A A 7 13.632% 21 10.069% 356<br />
* For FN TBAs we used 2000 production on both 7s and 7.5s and 2001 production for 6.5s<br />
** Note that these are actual holding period returns, NOT annualized numbers<br />
Sources: Bloomberg, Nomura<br />
Graph: Prepayment Comparison of Deals Backed by FHA/VA Reperforming<br />
Mortgages and Comparable GNMA Pass-Throughs<br />
3 month CPRs<br />
65%<br />
55%<br />
45%<br />
35%<br />
25%<br />
15%<br />
GNMA (6.5s) GNMA (7s) GNMA (7.5s)<br />
GSMPS Avg<br />
10yr Swap<br />
9.0%<br />
8.5%<br />
8.0%<br />
7.5%<br />
7.0%<br />
6.5%<br />
6.0%<br />
5.5%<br />
5.0%<br />
4.5%<br />
10yr Swap Yield<br />
5%<br />
Sep-98 Feb-99 Jul-99 Dec-99May-00 Oct-00 Mar-01 Aug-01 Jan-02 Jun-02 Nov-02<br />
4.0%<br />
Sources: Bloomberg, Nomura<br />
(2)
Nomura Fixed Income <strong>Research</strong><br />
Credit Losses on Nomura/Countrywide & GSMPS Deals<br />
GSMPS Credit Losses<br />
0.4500%<br />
0.4000%<br />
0.3500%<br />
0.3000%<br />
Loss %<br />
0.2500%<br />
0.2000%<br />
0.1500%<br />
0.1000%<br />
0.0500%<br />
0.0000%<br />
May-98<br />
Jul-98<br />
Sep-98<br />
Nov-98<br />
Jan-99<br />
Mar-99<br />
May-99<br />
Jul-99<br />
Sep-99<br />
Nov-99<br />
Jan-00<br />
Mar-00<br />
May-00<br />
Jul-00<br />
Sep-00<br />
Nov-00<br />
Jan-01<br />
Mar-01<br />
May-01<br />
Jul-01<br />
Sep-01<br />
Nov-01<br />
Jan-02<br />
Mar-02<br />
May-02<br />
Jul-02<br />
Sep-02<br />
Nov-02<br />
Jan-03<br />
Mar-03<br />
1998-1 1998-2 1998-3 1998-4 1998-5 1999-1 1999-2 1999-3 2000-1 2001-2<br />
Nomura & Nomura / Countrywide Credit Losses<br />
0.4500%<br />
0.4000%<br />
0.3500%<br />
0.3000%<br />
0.2500%<br />
0.2000%<br />
0.1500%<br />
0.1000%<br />
0.0500%<br />
0.0000%<br />
Jun-01<br />
Jul-01<br />
Aug-01<br />
Sep-01<br />
Oct-01<br />
Nov-01<br />
Dec-01<br />
Loss %<br />
Jan-02<br />
Feb-02<br />
Mar-02<br />
Apr-02<br />
May-02<br />
Jun-02<br />
Jul-02<br />
Aug-02<br />
Sep-02<br />
Oct-02<br />
Nov-02<br />
Dec-02<br />
Jan-03<br />
Feb-03<br />
Mar-03<br />
Apr-03<br />
NAA 2001-R1A FNW 2001-W3 FNW 2002-W1 (1) FNW 2002-W1 (2) FSPC T-41 (1)<br />
FSPC T-41 (2) FSPC T-41 (3) FNW 2002-W6 (1) FNW 2002-W6 (2) FSPC T-48<br />
Sources: Bloomberg, Nomura<br />
(3)
Nomura Fixed Income <strong>Research</strong><br />
Appendix: Recent Prepayment History<br />
Nomura & Nomura / Countrywide Deals<br />
Updated Pricing Current CPRs<br />
Cum Loss<br />
As of Deal Date WAC WAM Orig Bal 1mo 3mo 12mo Life (% of orig)<br />
Apr-03 NAA 2001-R1 5/23/2001 8.537% 269 $98,915,946 20.9% 18.9% 19.6% 17.0% 0.108%<br />
Apr-03 FNW 2001-W3 10/24/2001 8.305% 286 $443,602,693 21.4% 19.5% 16.9% 14.6% 0.087%<br />
Apr-03 FNW 2002-W1 (I) 2/26/2002 7.211% 307 $153,073,573 27.3% 24.6% 18.9% 18.0% 0.050%<br />
Apr-03 FNW 2002-W1 (II) 2/26/2002 8.546% 298 $409,628,137 22.6% 20.8% 17.4% 16.8% 0.050%<br />
Apr-03 FSPC T-41 (I) 5/17/2002 6.973% 308 $176,560,858 22.0% 18.5% 14.6% 0.024%<br />
Apr-03 FSPC T-41 (II) 5/17/2002 7.484% 304 $176,707,014 29.7% 22.5% 17.4% 0.024%<br />
Apr-03 FSPC T-41 (III) 5/17/2002 8.336% 307 $408,069,358 25.1% 21.4% 17.7% 0.024%<br />
Apr-03 FNW 2002-W6 (I) 7/11/2002 7.348% 309 $482,436,697 23.5% 19.5% 17.6% 0.001%<br />
Apr-03 FNW 2002-W6 (II) 7/11/2002 8.281% 293 $647,760,592 25.3% 21.0% 17.4% 0.001%<br />
Apr-03 FSPC T-48 (1A) 9/5/2002 7.684% 310 $1,344,647,377 21.4% 18.1% 15.4% 0.000%<br />
Apr-03 FSPC T-51 (1A) 10/15/2002 7.498% 313 $310,789,266 15.2% 13.5% 12.5% 0.000%<br />
Apr-03 FSPC T-51 (2A) 10/15/2002 8.807% 297 $145,024,329 16.5% 15.5% 17.2% 0.000%<br />
Apr-03 FSPC T-54 (I) 2/14/2003 6.593% 315 $150,155,939 15.0% 14.1% 0.000%<br />
Apr-03 FSPC T-54 (II) 2/14/2003 7.281% 316 $525,537,433 11.6% 12.4% 0.000%<br />
Apr-03 FSPC T-54 (III) 2/14/2003 8.321% 304 $524,340,988 20.6% 17.5% 0.000%<br />
Apr-03 FNW 2003-W1 (I) 12/10/2002 7.222% 313 $1,155,580,636 15.1% 12.2% 0.000%<br />
Apr-03 FNW 2003-W1 (II) 12/10/2002 8.335% 300 $344,662,348 16.0% 14.9% 0.000%<br />
GNMA March Prepayments<br />
Production Current Balance<br />
Current CPRs<br />
Year / Coupon ($mm) WAC WAM Age 1mo 3mo 12mo<br />
1997 / 7 2822.3 7.50 282 68 56.5 55.2 45.2<br />
1993 / 7 7103.5 7.50 229 116 50.6 48.3 39.0<br />
1993 / 7.5 3442.5 8.00 227 118 50.8 48.7 41.5<br />
1992 / 8 1867.7 8.50 215 130 43.7 42.3 37.4<br />
GSMPS Deals<br />
Updated Pricing Orig Orig Current CPRs<br />
Cum Loss<br />
As of Deal Date WAC WAM Orig Bal 1mo 3mo 12mo Life (% of orig)<br />
Apr-03 GSMPS 1998-1 5/22/1998 9.707% 255 $93,189,873 23.3% 24.7% 23.7% 17.3% 0.212%<br />
Apr-03 GSMPS 1998-2 6/23/1998 9.358% 248 $92,281,528 22.1% 21.2% 23.7% 16.4% 0.194%<br />
Apr-03 GSMPS 1998-3 8/18/1998 9.217% 249 $93,784,603 18.8% 19.7% 20.0% 15.6% 0.228%<br />
Apr-03 GMSPS 1998-4 9/25/1998 9.175% 259 $97,136,002 21.3% 19.5% 20.3% 16.0% 0.423%<br />
Apr-03 GSMPS 1998-5 11/25/1998 8.970% 254 $105,213,634 35.0% 24.5% 23.4% 16.3% 0.175%<br />
Apr-03 GSMPS 1999-1 4/12/1999 8.773% 266 $259,514,267 21.7% 24.9% 22.3% 16.6% 0.151%<br />
Apr-03 GSMPS 1999-2 6/25/1999 9.027% 257 $123,714,221 22.2% 20.7% 22.3% 16.1% 0.383%<br />
Apr-03 GSMPS 1999-3 11/26/1999 8.964% 254 $118,786,745 27.7% 21.5% 23.1% 16.9% 0.253%<br />
Apr-03 GSMPS 2000-1 3/24/2000 9.180% 305 $88,782,171 21.1% 18.4% 21.8% 15.6% 0.226%<br />
Apr-03 GSMPS 2001-2 7/20/2001 8.061% 288 $154,921,545 22.6% 25.0% 23.0% 19.8% 0.036%<br />
Other Deals (Fixed Tranches)<br />
Updated Pricing Orig Orig<br />
Current CPRs<br />
As of Deal Date WAC WAM Orig Bal 1mo 3mo 12mo Life<br />
Apr-03 FNGT 2000-T6 11/15/2000 8.751% 275 $284,565,010 23.9% 24.3% 23.3% 19.0%<br />
Apr-03 FNGT 2001-T1 1/11/2001 8.798% 280 $260,770,309 24.1% 24.5% 23.4% 19.7%<br />
Apr-03 FNGT 2001-T3 2/12/2001 8.375% 292 $238,521,954 31.6% 26.7% 24.5% 20.3%<br />
Apr-03 FNGT 2001-T4 4/13/2001 8.331% 289 $500,179,080 28.4% 26.1% 23.2% 19.8%<br />
Apr-03 FNGT 2001-T8 7/16/2001 8.226% 298 $617,893,700 27.6% 26.2% 25.2% 22.1%<br />
Apr-03 FNGT 2001-T10 10/3/2001 8.115% 305 $1,459,035,651 25.9% 23.7% 22.5% 20.8%<br />
Apr-03 FNGT 2001-T12 10/31/2001 8.039% 314 $712,137,483 23.8% 23.0% 23.4% 21.7%<br />
Apr-03 FNGT 2002-T1 (I) 1/2/2002 7.024% 304 $179,099,938 24.2% 20.2% 16.5% 15.0%<br />
Apr-03 FNGT 2002-T1 (II) 1/2/2002 7.837% 302 $295,436,786 28.0% 24.3% 21.9% 20.6%<br />
Apr-03 FNGT 2002-T1 (III) 1/2/2002 8.794% 304 $276,278,414 24.2% 26.0% 24.8% 23.1%<br />
Apr-03 FNGT 2002-T4 (I) 1/31/2002 7.334% 308 $392,468,624 25.6% 23.9% 22.7% 21.3%<br />
Apr-03 FNGT 2002-T4 (II) 1/31/2002 7.995% 314 $340,097,475 25.5% 24.0% 24.7% 22.9%<br />
Apr-03 FNGT 2002-T4 (III) 1/31/2002 8.827% 304 $504,905,946 26.8% 25.9% 26.1% 24.5%<br />
Apr-03 FNGT 2002-T6 3/14/2002 8.467% 314 $477,498,213 29.9% 27.4% 25.1% 25.1%<br />
Apr-03 FNR 2001-79 11/19/2001 7.709% 301 $453,517,782 22.8% 22.7% 21.2% 18.9%<br />
Apr-03 FNR 2002-33 (VIII) 4/10/2002 8.069% 302 $423,971,164 24.9% 20.3% 15.5%<br />
Apr-03 FSPC T-42 (I) 5/14/2002 7.683% 308 $579,647,086 28.3% 23.9% 21.1%<br />
Apr-03 FSPC T-42 (II) 5/14/2002 8.742% 305 $518,811,837 30.6% 27.1% 22.5%<br />
ARM Tranches<br />
Updated Pricing Orig Orig<br />
Current CPRs<br />
As of Deal Date WAC WAM Orig Bal 1mo 3mo 12mo Life<br />
Apr-03 FNW 2002-W1 2/26/2002 7.338% 285 $93,164,423 12.9% 14.8% 16.4% 15.9%<br />
Apr-03 FNW 2002-W6 7/11/2002 6.712% 297 $102,066,543 25.3% 19.6% 17.7%<br />
Apr-03 FSPC T-48 9/5/2002 6.768% 290 $101,677,489 12.7% 14.0% 15.0%<br />
Apr-03 FSPC T-54 2/14/2003 6.160% 289 $92,279,596 6.4% 12.1%<br />
Apr-03 FNGT 2000-T6 11/15/2000 8.350% 287 $40,238,780 9.6% 11.1% 22.5% 19.4%<br />
Apr-03 FNGT 2001-T1 1/11/2001 8.405% 294 $97,905,518 21.4% 22.8% 22.7% 22.0%<br />
Apr-03 FNGT 2001-T8 7/16/2001 8.157% 294 $68,847,140 26.0% 24.3% 23.3% 23.1%<br />
Apr-03 FNGT 2001-T12 10/31/2001 7.957% 294 $108,685,397 19.8% 21.1% 21.2% 19.9%<br />
Apr-03 FNGT 2002-T6 3/14/2002 7.390% 294 $60,639,607 19.4% 17.3% 18.8% 18.2%<br />
Apr-03 FNR 2002-33 (IX) 4/10/2002 6.331% 314 $137,315,165 15.9% 14.6% 16.6%<br />
Apr-03 FNR 2002-33 (X) 4/10/2002 6.953% 289 $29,735,188 27.8% 30.7% 21.6%<br />
Sources: Bloomberg, Intex, GNMA factor tapes, Nomura<br />
(4)
NEW YORK TOKYO LONDON<br />
Nomura Securities International Nomura Securities Company Nomura International PLC<br />
2 World Financial Center, Building B 2-2-2, Otemachi, Chiyoda-Ku Nomura House<br />
New York, NY 10281 Tokyo, Japan 100-8130 1 St Martin's-le-grand<br />
(212) 667-9300 81 3 3211 1811 London EC1A 4NP<br />
44 207 521 2000<br />
Nomura Fixed Income <strong>Research</strong><br />
New York<br />
David P. Jacob (212) 667 2255 Head of Fixed Income <strong>Research</strong> and Structuring<br />
David Resler (212) 667 2415 Head of U.S. Economic <strong>Research</strong><br />
Mark Adelson (212) 667 2337 <strong>Securitization</strong>/ABS <strong>Research</strong><br />
Arthur Q. Frank (212) 667 1477 <strong>MBS</strong> <strong>Research</strong><br />
Louis (Trey) Ott (212) 667 9521 Corporate Bond <strong>Research</strong><br />
Joshua Phillips (212) 667 2042 C<strong>MBS</strong> <strong>Research</strong><br />
Carol Stone (212) 667 2418 Deputy Chief Economist<br />
Lisle Leonard (212) 667 9076 Analyst<br />
James Manzi (212) 667 2231 Analyst<br />
Javier Villanueva (212) 667 9170 Analyst<br />
Elizabeth Hoyt (212) 667 2339 Analyst<br />
Kumiko Kimura (212) 667 9088 Translator<br />
Michiko Whetten (212) 667 2338 Translator<br />
Tokyo<br />
Nobuyuki Tsutsumi 81 3 3211 1811 ABS <strong>Research</strong><br />
London<br />
John Higgins 44 207 521 2534 Head of Macro Economic <strong>Research</strong>- London<br />
Duncan Sankey 44 207 521 2984 Head of London Credit <strong>Research</strong><br />
© Copyright 2003 Nomura Securities International, Inc.<br />
I, Arthur Q. Frank, a research analyst employed by Nomura Securities International, Inc., hereby certify that all of the views expressed in this<br />
research report accurately reflect my personal views about any and all of the subject securities or issuers discussed herein. In addition, I<br />
hereby certify that no part of my compensation was, is, or will be, directly or indirectly related to the specific recommendations or views that I<br />
have expressed in this research report.<br />
This publication contains material that is: (i) for your private information, and we are not soliciting any action based upon it; (ii) not to be construed as a prospectus or offering<br />
materials of any kind; and (iii) is based upon information that we consider reliable, but we do not represent that it is accurate or complete, and it should not be relied upon as<br />
such. Opinions, forecasts, prices, yields, and other forward looking statements may be based on assumptions which may or may not be accurate, and any such opinions,<br />
forecasts or other information are subject to risks and uncertainties and may differ from actual results. Information provided is current as of the date(s) of issuance and is<br />
subject to change without notice. While we endeavor to update on a reasonable basis the information discussed in this material, there may be regulatory, compliance, or other<br />
reasons to prevent us from doing so. NSI and its affiliates may from time to time perform or solicit investment banking or other services (including acting as advisor, manager<br />
or lender) for, or from, companies or entities mentioned herein. Regarding the companies or entities mentioned herein, NSI, its affiliates, officers, directors, and employees<br />
(including persons involved in the preparation of this material) may, prior to or concurrent with this publication: (i) have long or short positions in, and/or buy or sell (or make a<br />
market in) their securities, or derivatives (including options) thereof; and/or (ii) effect or have effected transactions contrary to NSI’s views contained herein. The securities<br />
described herein may not have been registered under the Securities Act of 1933, and, in such case, may not be offered or sold within the United States or to US persons<br />
unless they are being sold in compliance with an exemption from the registration requirements of such Act. The provision of this research by NSI and its affiliates does not<br />
constitute investment advice, and you should not rely on it as such. Neither NSI nor any of its affiliates makes any representations or warranties with respect to any securities<br />
or investments. You are responsible for exercising your own judgment (either independently or through your investment advisor) and conducting your own due diligence with<br />
respect to investments and their risks and suitability (including reading any relevant final prospectus). NSI and its affiliates are not responsible for any losses that you may<br />
incur as a result of your investment decisions, whether direct, indirect, incidental or consequential. No part of this material may be (1) copied, photographed, or duplicated in<br />
any form, by any means, or (2) redistributed to anyone (including your foreign affiliates) without NSI’s prior written consent. Derivatives and options are not suitable<br />
investments for all investors. Additional information may be provided upon request.<br />
Nomura International plc (NIp) is regulated by the Financial Services Authority. This publication has been approved for distribution in the UK by NIp. This is not intended or<br />
approved for UK Private Investors.