SQUARE Project: Cost/Benefit Analysis Framework for Information ...
SQUARE Project: Cost/Benefit Analysis Framework for Information ...
SQUARE Project: Cost/Benefit Analysis Framework for Information ...

You also want an ePaper? Increase the reach of your titles
YUMPU automatically turns print PDFs into web optimized ePapers that Google loves.
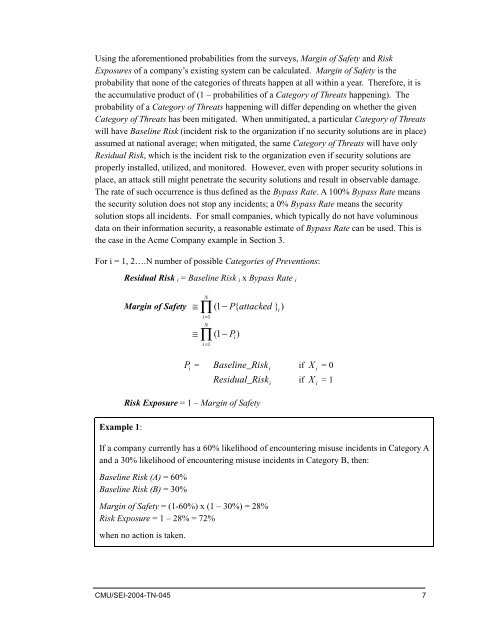
Using the a<strong>for</strong>ementioned probabilities from the surveys, Margin of Safety and Risk<br />
Exposures of a company’s existing system can be calculated. Margin of Safety is the<br />
probability that none of the categories of threats happen at all within a year. There<strong>for</strong>e, it is<br />
the accumulative product of (1 – probabilities of a Category of Threats happening). The<br />
probability of a Category of Threats happening will differ depending on whether the given<br />
Category of Threats has been mitigated. When unmitigated, a particular Category of Threats<br />
will have Baseline Risk (incident risk to the organization if no security solutions are in place)<br />
assumed at national average; when mitigated, the same Category of Threats will have only<br />
Residual Risk, which is the incident risk to the organization even if security solutions are<br />
properly installed, utilized, and monitored. However, even with proper security solutions in<br />
place, an attack still might penetrate the security solutions and result in observable damage.<br />
The rate of such occurrence is thus defined as the Bypass Rate. A 100% Bypass Rate means<br />
the security solution does not stop any incidents; a 0% Bypass Rate means the security<br />
solution stops all incidents. For small companies, which typically do not have voluminous<br />
data on their in<strong>for</strong>mation security, a reasonable estimate of Bypass Rate can be used. This is<br />
the case in the Acme Company example in Section 3.<br />
For i = 1, 2….N number of possible Categories of Preventions:<br />
Residual Risk i = Baseline Risk i x Bypass Rate i<br />
Margin of Safety ≅ (1 − P{<br />
attacked } )<br />
≅<br />
N<br />
∏<br />
i=<br />
1<br />
N<br />
∏<br />
i=<br />
1<br />
( 1−<br />
P i<br />
)<br />
i<br />
P<br />
i<br />
=<br />
Baseline_R iski<br />
if X<br />
i<br />
= 0<br />
Residual_R isk i<br />
if X<br />
i<br />
= 1<br />
Example 1:<br />
Risk Exposure = 1 – Margin of Safety<br />
If a company currently has a 60% likelihood of encountering misuse incidents in Category A<br />
and a 30% likelihood of encountering misuse incidents in Category B, then:<br />
Baseline Risk (A) = 60%<br />
Baseline Risk (B) = 30%<br />
Margin of Safety = (1-60%) x (1 – 30%) = 28%<br />
Risk Exposure = 1 – 28% = 72%<br />
when no action is taken.<br />
CMU/SEI-2004-TN-045 7