SQUARE Project: Cost/Benefit Analysis Framework for Information ...
SQUARE Project: Cost/Benefit Analysis Framework for Information ...
SQUARE Project: Cost/Benefit Analysis Framework for Information ...

You also want an ePaper? Increase the reach of your titles
YUMPU automatically turns print PDFs into web optimized ePapers that Google loves.
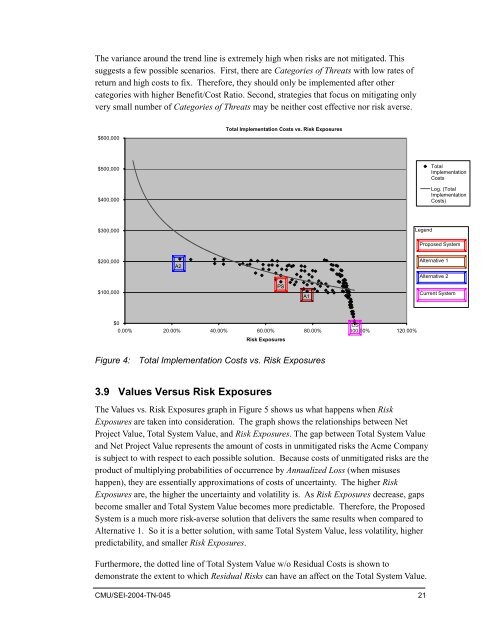
The variance around the trend line is extremely high when risks are not mitigated. This<br />
suggests a few possible scenarios. First, there are Categories of Threats with low rates of<br />
return and high costs to fix. There<strong>for</strong>e, they should only be implemented after other<br />
categories with higher <strong>Benefit</strong>/<strong>Cost</strong> Ratio. Second, strategies that focus on mitigating only<br />
very small number of Categories of Threats may be neither cost effective nor risk averse.<br />
$600,000<br />
Total Implementation <strong>Cost</strong>s vs. Risk Exposures<br />
$500,000<br />
$400,000<br />
Total<br />
Implementation<br />
<strong>Cost</strong>s<br />
Log. (Total<br />
Implementation<br />
<strong>Cost</strong>s)<br />
$300,000<br />
Legend<br />
Proposed System<br />
$200,000<br />
A2<br />
Alternative 1<br />
Alternative 2<br />
$100,000<br />
PS<br />
A1<br />
Current System<br />
$0<br />
CS<br />
0.00% 20.00% 40.00% 60.00% 80.00% 100.00% 120.00%<br />
Risk Exposures<br />
Figure 4: Total Implementation <strong>Cost</strong>s vs. Risk Exposures<br />
3.9 Values Versus Risk Exposures<br />
The Values vs. Risk Exposures graph in Figure 5 shows us what happens when Risk<br />
Exposures are taken into consideration. The graph shows the relationships between Net<br />
<strong>Project</strong> Value, Total System Value, and Risk Exposures. The gap between Total System Value<br />
and Net <strong>Project</strong> Value represents the amount of costs in unmitigated risks the Acme Company<br />
is subject to with respect to each possible solution. Because costs of unmitigated risks are the<br />
product of multiplying probabilities of occurrence by Annualized Loss (when misuses<br />
happen), they are essentially approximations of costs of uncertainty. The higher Risk<br />
Exposures are, the higher the uncertainty and volatility is. As Risk Exposures decrease, gaps<br />
become smaller and Total System Value becomes more predictable. There<strong>for</strong>e, the Proposed<br />
System is a much more risk-averse solution that delivers the same results when compared to<br />
Alternative 1. So it is a better solution, with same Total System Value, less volatility, higher<br />
predictability, and smaller Risk Exposures.<br />
Furthermore, the dotted line of Total System Value w/o Residual <strong>Cost</strong>s is shown to<br />
demonstrate the extent to which Residual Risks can have an affect on the Total System Value.<br />
CMU/SEI-2004-TN-045 21