SQUARE Project: Cost/Benefit Analysis Framework for Information ...
SQUARE Project: Cost/Benefit Analysis Framework for Information ...
SQUARE Project: Cost/Benefit Analysis Framework for Information ...

You also want an ePaper? Increase the reach of your titles
YUMPU automatically turns print PDFs into web optimized ePapers that Google loves.
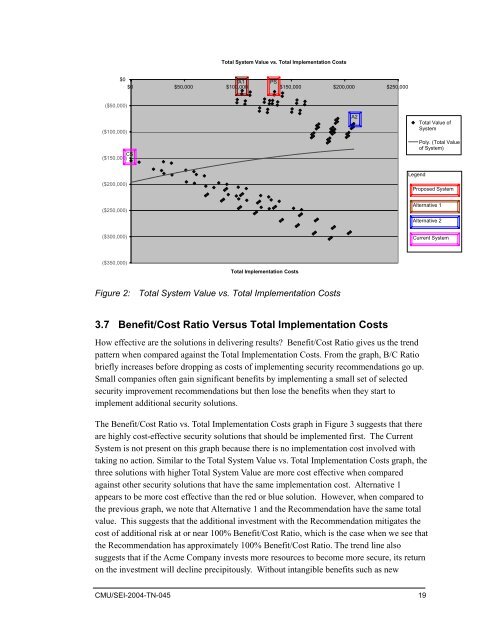
Total System Value vs. Total Implementation <strong>Cost</strong>s<br />
$0<br />
A1 PS<br />
$0 $50,000 $100,000 $150,000 $200,000 $250,000<br />
($50,000)<br />
($100,000)<br />
CS<br />
($150,000)<br />
A2<br />
Total Value of<br />
System<br />
Poly. (Total Value<br />
of System)<br />
($200,000)<br />
Legend<br />
Proposed System<br />
($250,000)<br />
Alternative 1<br />
Alternative 2<br />
($300,000)<br />
Current System<br />
($350,000)<br />
Total Implementation <strong>Cost</strong>s<br />
Figure 2: Total System Value vs. Total Implementation <strong>Cost</strong>s<br />
3.7 <strong>Benefit</strong>/<strong>Cost</strong> Ratio Versus Total Implementation <strong>Cost</strong>s<br />
How effective are the solutions in delivering results? <strong>Benefit</strong>/<strong>Cost</strong> Ratio gives us the trend<br />
pattern when compared against the Total Implementation <strong>Cost</strong>s. From the graph, B/C Ratio<br />
briefly increases be<strong>for</strong>e dropping as costs of implementing security recommendations go up.<br />
Small companies often gain significant benefits by implementing a small set of selected<br />
security improvement recommendations but then lose the benefits when they start to<br />
implement additional security solutions.<br />
The <strong>Benefit</strong>/<strong>Cost</strong> Ratio vs. Total Implementation <strong>Cost</strong>s graph in Figure 3 suggests that there<br />
are highly cost-effective security solutions that should be implemented first. The Current<br />
System is not present on this graph because there is no implementation cost involved with<br />
taking no action. Similar to the Total System Value vs. Total Implementation <strong>Cost</strong>s graph, the<br />
three solutions with higher Total System Value are more cost effective when compared<br />
against other security solutions that have the same implementation cost. Alternative 1<br />
appears to be more cost effective than the red or blue solution. However, when compared to<br />
the previous graph, we note that Alternative 1 and the Recommendation have the same total<br />
value. This suggests that the additional investment with the Recommendation mitigates the<br />
cost of additional risk at or near 100% <strong>Benefit</strong>/<strong>Cost</strong> Ratio, which is the case when we see that<br />
the Recommendation has approximately 100% <strong>Benefit</strong>/<strong>Cost</strong> Ratio. The trend line also<br />
suggests that if the Acme Company invests more resources to become more secure, its return<br />
on the investment will decline precipitously. Without intangible benefits such as new<br />
CMU/SEI-2004-TN-045 19