XRF principle - Seiko Instruments GmbH
XRF principle - Seiko Instruments GmbH
XRF principle - Seiko Instruments GmbH

Create successful ePaper yourself
Turn your PDF publications into a flip-book with our unique Google optimized e-Paper software.
<strong>Seiko</strong> <strong>Instruments</strong> <strong>GmbH</strong><br />
NanoTechnology<br />
X-Ray Fluorescence Analysis<br />
1-1. Descriptions<br />
Here we introduce the <strong>principle</strong> and application examples of X-ray<br />
fluorescence.<br />
1. Principle<br />
X-ray is a type of electromagnetic waves such as visible light ray, but the<br />
key difference is its extremely short wavelength, measuring from 100A to<br />
0.1A. And compared to normal electromagnetic waves, X-ray easily passes<br />
through material and it becomes stronger as the material's atomic number<br />
decreases. X-ray fluorescence analysis is a method that uses the<br />
characteristic X-ray (fluorescent X-ray) that is generated when X-ray is<br />
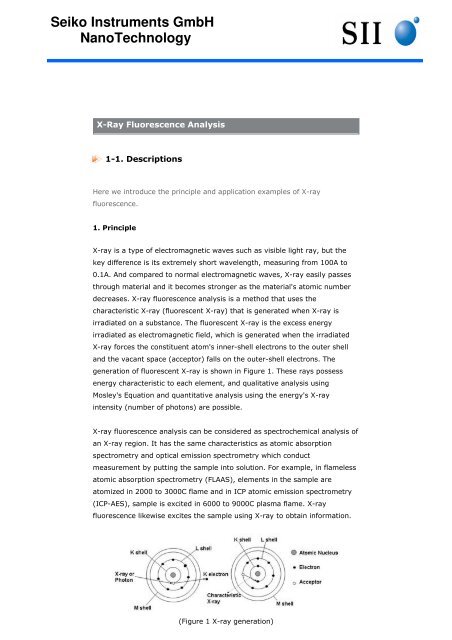
irradiated on a substance. The fluorescent X-ray is the excess energy<br />
irradiated as electromagnetic field, which is generated when the irradiated<br />
X-ray forces the constituent atom's inner-shell electrons to the outer shell<br />
and the vacant space (acceptor) falls on the outer-shell electrons. The<br />
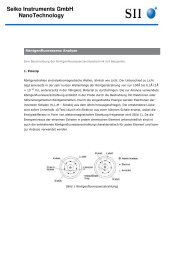
generation of fluorescent X-ray is shown in Figure 1. These rays possess<br />
energy characteristic to each element, and qualitative analysis using<br />
Mosley's Equation and quantitative analysis using the energy's X-ray<br />
intensity (number of photons) are possible.<br />
X-ray fluorescence analysis can be considered as spectrochemical analysis of<br />
an X-ray region. It has the same characteristics as atomic absorption<br />
spectrometry and optical emission spectrometry which conduct<br />
measurement by putting the sample into solution. For example, in flameless<br />
atomic absorption spectrometry (FLAAS), elements in the sample are<br />
atomized in 2000 to 3000C flame and in ICP atomic emission spectrometry<br />
(ICP-AES), sample is excited in 6000 to 9000C plasma flame. X-ray<br />
fluorescence likewise excites the sample using X-ray to obtain information.<br />
(Figure 1 X-ray generation)
2. Device Structure.<br />
X-ray fluorescence analysis devices can be largely categorized into<br />
wavelength-dispersive X-ray spectroscopy (WDX) and energy-dispersive X-<br />
ray spectroscopy (EDX). (Shown in Figure 2.) WDX disperses the fluorescent<br />
X-ray generated in the sample using dispersion crystal and measures it<br />
using a goniometer, resulting in a large size. On the other hand, the detector<br />
in EDX has a superior energy resolution and requires no dispersion system,<br />
which enables downsizing of the device.<br />
(Figure 2 WDX and EDX types)<br />
2-1 X-Ray Generation<br />
X-ray is generated when the X-ray tube (Figure 3) accelerates the electrons<br />
at high voltage and bombards them against the metal anode (anti-cathode).<br />
There are two types of X-ray tubes, side window type and end window type,<br />
and both are designed to irradiate intense X-ray on the sample surface as<br />
evenly as possible.<br />
Beryllium foil is commonly used for the window for retrieving the incident X-<br />
ray. For the anti-cathode, (sometimes referred as gtarget h) tungsten,<br />
rhodium, molybdenum and chrome are used. These anti-cathode are chosen<br />
based on the analysis sample. X-ray tubes with anti-cathode similar to<br />
analysis element are essentially not used.
.<br />
(Figure 3. X-ray tube bulb)<br />
2-2 Detector<br />
Figure 4 shows the basic structure of a Si (Li) device. Si (Li) device features<br />
a p-i-n+structure diode. Diode can only pass electric current in one direction<br />
(rectification mechanism). When voltage is applied against the current<br />
(reverse bias) and light enters in this state, the electrons in the forbidden<br />
band are excited into conductive band and only the current for the excited<br />
electron travel. For X-ray detection, each current pulse corresponding to an<br />
incident X-ray photon is measured one by one. The instantaneous current<br />
value of a single pulse is relative to the incident X-ray energy, so X-ray<br />
energy can be found by measuring the wave height of the current pulse.<br />
Si (Li) semiconductor detector is a diode with Li spread over high-purity<br />
single Si crystal, diameter 3 to 6mm and thickness 3 to 5mm, cooled with<br />
field-effect transistor and liquid nitrogen and maintained in vacuum. When<br />
semiconductor detector was first developed, damage caused by application<br />
of high voltage that resulted from shortage of liquid nitrogen and consequent<br />
temperature rise, was reported. With current devices, the surface<br />
temperature of the detector is monitored and when it rises above a certain<br />
temperature, protection circuit shuts off the high voltage to the detector,<br />
eliminating damage to the detector from accidentally applying high voltage.<br />
At low frequency of use, it can be used about 30 minutes after supplying it<br />
with liquid nitrogen.
(Figure 4. Si (Li) device structure)<br />
2-3 Sample Chamber & Measurement Atmospher<br />
There are two types of sample chambers, top-surface irradiation type that<br />
irradiate X-rays from above, and bottom-surface irradiation type that<br />
irradiate from below. There are not many differences between the two types<br />
in detection concentration, but for sample observation and measurements<br />
conducted while moving the stage, the top-surface irradiation is better.<br />
In most devices, atmosphere in sample chambers can be decompressed.<br />
This is because X-rays are absorbed and lose intensity in atmosphere. For<br />
light element measurements, setting the measurement atmosphere is vital.<br />
2-3. Qualitative Analysis<br />
In defining X-ray fluorescence analysis, the wavelength of the characteristic<br />
X-ray or the regularity of the energy and atomic number are used. Most<br />
devices are equipped with the automatic identification (definition) feature<br />
but it is important to note various interfering spectrums.<br />
Depending on the element types contained in the sample, energy position of<br />
characteristic X-rays may be close to each other or spectrums may overlap.<br />
Figure 5 shows an example with As and Pb spectrums.
(Figure 5 As and Pb Spectrums)<br />
As shown above, if Pb is contained in the sample, the energy position of As's<br />
Kƒ¿ line overlap with Pb's Lƒ¿ line, and would lead to identifying As by<br />
mistake. There are multiple characteristic X-rays of an element, such as Kƒ¿<br />
line, KƒÀ line, Lƒ¿ line, LƒÀ line etc.<br />
In cases such as this, confirmation with a KLM marker shown in Figure 5 is<br />
necessary. A KLM marker compares the intensity and theoretical energy<br />
positions of multiple characteristic X-rays. Figure 6 shows an example with<br />
the KLM marker of Pb displayed on the spectrum.<br />
(Figure 6. Pb KLM marker)<br />
The X-ray intensity of Pb is shown and if the sample contains Pb, a peak<br />
would be present at each energy position at about the same interval as the<br />
KLM marker. If peaks are not present at Pb energy positions other than<br />
Pb fs Lƒ¿ line, it can be judged that Pb does not exist in the sample.<br />
Likewise, if peaks do not exist on the As fs Kƒ¿ line as well as the KƒÀ line,<br />
the sample does not contain As. As above, by displaying the KLM marker<br />
and observing the intensity comparison of multiple characteristic X-rays,<br />
qualitative analysis can be performed accurately.<br />
2-4. Quantitative Analysis<br />
The following is an overview of conducting quantitative analysis using<br />
fluorescent X-ray.
When a sample that contains element A is irradiated primary X-ray,<br />
fluorescent X-ray of element A is generated, but the intensity of this<br />
fluorescent X-ray is dependent on the amount of element A in the sample.<br />
The more element A contained in the sample, the higher the intensity of the<br />
fluorescent X-ray that is generated. Taking this into account, if the<br />
fluorescent X-ray intensity and concentration of an element contained in a<br />
sample is known, then we can go in reverse and find how much element A<br />
contained in another sample by its fluorescent X-ray intensity.<br />
When conducting quantitative analysis with fluorescent X-ray, there are two<br />
basic methods. The first is to create a standard curve. This method involves<br />
measuring several samples with a known element concentration, and finding<br />
the relationship between the intensity of the measured element's fluorescent<br />
X-ray and the concentration. By referring this relationship, element<br />
concentration of unknown sample is obtained only with information on its<br />
fluorescent X-ray intensity.<br />
The other method is known as the fundamental parameter method of<br />
theoretical calculation, or the FP method. With this method, if the type and<br />
properties of all elements that compose a sample are known, then the<br />
intensity of each fluorescent X-ray can be derived theoretically. By utilizing<br />
this method, the composition of unknown sample can be extrapolated by its<br />
fluorescent X-ray intensity of each element.<br />
3. Conclusion<br />
Since X-ray fluorescence analysis can analyze a sample non-destructively<br />
and quickly, it can be applied to a wide range of use such as manufacturing<br />
and quality control. Recently, as techniques for high-sensitivity, technologies<br />
such as filtering and lamination have been applied to eliminate the<br />
interference of background, which made measurement of trace amounts<br />
possible. This analysis method will become more widespread particularly in<br />
measurements of hazardous metals in materials and soil.