Population and Household Estimates for Southeast ... - semcog
Population and Household Estimates for Southeast ... - semcog
Population and Household Estimates for Southeast ... - semcog

You also want an ePaper? Increase the reach of your titles
YUMPU automatically turns print PDFs into web optimized ePapers that Google loves.
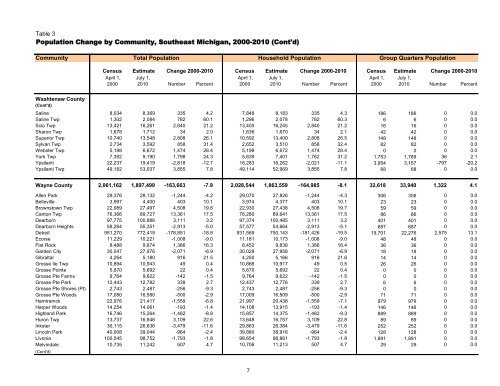
Table 3<br />
<strong>Population</strong> Change by Community, <strong>Southeast</strong> Michigan, 2000-2010 (Cont'd)<br />
Community<br />
Total <strong>Population</strong><br />
<strong>Household</strong> <strong>Population</strong><br />
Group Quarters <strong>Population</strong><br />
Census Estimate Change 2000-2010 Census Estimate Change 2000-2010 Census Estimate Change 2000-2010<br />
April 1, July 1, April 1, July 1, April 1, July 1,<br />
2000 2010 Number Percent 2000 2010 Number Percent 2000 2010 Number Percent<br />
Washtenaw County<br />
(Cont'd)<br />
Saline 8,034 8,369 335 4.2 7,848 8,183 335 4.3 186 186 0 0.0<br />
Saline Twp 1,302 2,084 782 60.1 1,296 2,078 782 60.3 6 6 0 0.0<br />
Scio Twp 13,421 16,261 2,840 21.2 13,405 16,245 2,840 21.2 16 16 0 0.0<br />
Sharon Twp 1,678 1,712 34 2.0 1,636 1,670 34 2.1 42 42 0 0.0<br />
Superior Twp 10,740 13,548 2,808 26.1 10,592 13,400 2,808 26.5 148 148 0 0.0<br />
Sylvan Twp 2,734 3,592 858 31.4 2,652 3,510 858 32.4 82 82 0 0.0<br />
Webster Twp 5,198 6,672 1,474 28.4 5,198 6,672 1,474 28.4 0 0 0 0.0<br />
York Twp 7,392 9,190 1,798 24.3 5,639 7,401 1,762 31.2 1,753 1,789 36 2.1<br />
Ypsilanti 22,237 19,419 -2,818 -12.7 18,283 16,262 -2,021 -11.1 3,954 3,157 -797 -20.2<br />
Ypsilanti Twp 49,182 53,037 3,855 7.8 49,114 52,969 3,855 7.8 68 68 0 0.0<br />
Wayne County 2,061,162 1,897,499 -163,663 -7.9 2,028,544 1,863,559 -164,985 -8.1 32,618 33,940 1,322 4.1<br />
Allen Park 29,376 28,132 -1,244 -4.2 29,070 27,826 -1,244 -4.3 306 306 0 0.0<br />
Belleville 3,997 4,400 403 10.1 3,974 4,377 403 10.1 23 23 0 0.0<br />
Brownstown Twp 22,989 27,497 4,508 19.6 22,930 27,438 4,508 19.7 59 59 0 0.0<br />
Canton Twp 76,366 89,727 13,361 17.5 76,280 89,641 13,361 17.5 86 86 0 0.0<br />
Dearborn 97,775 100,886 3,111 3.2 97,374 100,485 3,111 3.2 401 401 0 0.0<br />
Dearborn Heights 58,264 55,351 -2,913 -5.0 57,577 54,664 -2,913 -5.1 687 687 0 0.0<br />
Detroit 951,270 772,419 -178,851 -18.8 931,569 750,143 -181,426 -19.5 19,701 22,276 2,575 13.1<br />
Ecorse 11,229 10,221 -1,008 -9.0 11,181 10,173 -1,008 -9.0 48 48 0 0.0<br />
Flat Rock 8,488 9,874 1,386 16.3 8,452 9,838 1,386 16.4 36 36 0 0.0<br />
Garden City 30,047 27,976 -2,071 -6.9 30,029 27,958 -2,071 -6.9 18 18 0 0.0<br />
Gibraltar 4,264 5,180 916 21.5 4,250 5,166 916 21.6 14 14 0 0.0<br />
Grosse Ile Twp 10,894 10,943 49 0.4 10,868 10,917 49 0.5 26 26 0 0.0<br />
Grosse Pointe 5,670 5,692 22 0.4 5,670 5,692 22 0.4 0 0 0 0.0<br />
Grosse Pte Farms 9,764 9,622 -142 -1.5 9,764 9,622 -142 -1.5 0 0 0 0.0<br />
Grosse Pte Park 12,443 12,782 339 2.7 12,437 12,776 339 2.7 6 6 0 0.0<br />
Grosse Pte Shores (Pt) 2,743 2,487 -256 -9.3 2,743 2,487 -256 -9.3 0 0 0 0.0<br />
Grosse Pte Woods 17,080 16,580 -500 -2.9 17,009 16,509 -500 -2.9 71 71 0 0.0<br />
Hamtramck 22,976 21,417 -1,559 -6.8 21,997 20,438 -1,559 -7.1 979 979 0 0.0<br />
Harper Woods 14,254 14,061 -193 -1.4 14,108 13,915 -193 -1.4 146 146 0 0.0<br />
Highl<strong>and</strong> Park 16,746 15,264 -1,482 -8.8 15,857 14,375 -1,482 -9.3 889 889 0 0.0<br />
Huron Twp 13,737 16,846 3,109 22.6 13,648 16,757 3,109 22.8 89 89 0 0.0<br />
Inkster 30,115 26,636 -3,479 -11.6 29,863 26,384 -3,479 -11.6 252 252 0 0.0<br />
Lincoln Park 40,008 39,044 -964 -2.4 39,880 38,916 -964 -2.4 128 128 0 0.0<br />
Livonia 100,545 98,752 -1,793 -1.8 98,654 96,861 -1,793 -1.8 1,891 1,891 0 0.0<br />
Melvindale 10,735 11,242 507 4.7 10,706 11,213 507 4.7 29 29 0 0.0<br />
(Cont'd)<br />
7