Table 3 <strong>Population</strong> Change by Community, <strong>Southeast</strong> Michigan, 2000-2010 (Cont'd) Community Total <strong>Population</strong> <strong>Household</strong> <strong>Population</strong> Group Quarters <strong>Population</strong> Census Estimate Change 2000-2010 Census Estimate Change 2000-2010 Census Estimate Change 2000-2010 April 1, July 1, April 1, July 1, April 1, July 1, 2000 2010 Number Percent 2000 2010 Number Percent 2000 2010 Number Percent Washtenaw County (Cont'd) Saline 8,034 8,369 335 4.2 7,848 8,183 335 4.3 186 186 0 0.0 Saline Twp 1,302 2,084 782 60.1 1,296 2,078 782 60.3 6 6 0 0.0 Scio Twp 13,421 16,261 2,840 21.2 13,405 16,245 2,840 21.2 16 16 0 0.0 Sharon Twp 1,678 1,712 34 2.0 1,636 1,670 34 2.1 42 42 0 0.0 Superior Twp 10,740 13,548 2,808 26.1 10,592 13,400 2,808 26.5 148 148 0 0.0 Sylvan Twp 2,734 3,592 858 31.4 2,652 3,510 858 32.4 82 82 0 0.0 Webster Twp 5,198 6,672 1,474 28.4 5,198 6,672 1,474 28.4 0 0 0 0.0 York Twp 7,392 9,190 1,798 24.3 5,639 7,401 1,762 31.2 1,753 1,789 36 2.1 Ypsilanti 22,237 19,419 -2,818 -12.7 18,283 16,262 -2,021 -11.1 3,954 3,157 -797 -20.2 Ypsilanti Twp 49,182 53,037 3,855 7.8 49,114 52,969 3,855 7.8 68 68 0 0.0 Wayne County 2,061,162 1,897,499 -163,663 -7.9 2,028,544 1,863,559 -164,985 -8.1 32,618 33,940 1,322 4.1 Allen Park 29,376 28,132 -1,244 -4.2 29,070 27,826 -1,244 -4.3 306 306 0 0.0 Belleville 3,997 4,400 403 10.1 3,974 4,377 403 10.1 23 23 0 0.0 Brownstown Twp 22,989 27,497 4,508 19.6 22,930 27,438 4,508 19.7 59 59 0 0.0 Canton Twp 76,366 89,727 13,361 17.5 76,280 89,641 13,361 17.5 86 86 0 0.0 Dearborn 97,775 100,886 3,111 3.2 97,374 100,485 3,111 3.2 401 401 0 0.0 Dearborn Heights 58,264 55,351 -2,913 -5.0 57,577 54,664 -2,913 -5.1 687 687 0 0.0 Detroit 951,270 772,419 -178,851 -18.8 931,569 750,143 -181,426 -19.5 19,701 22,276 2,575 13.1 Ecorse 11,229 10,221 -1,008 -9.0 11,181 10,173 -1,008 -9.0 48 48 0 0.0 Flat Rock 8,488 9,874 1,386 16.3 8,452 9,838 1,386 16.4 36 36 0 0.0 Garden City 30,047 27,976 -2,071 -6.9 30,029 27,958 -2,071 -6.9 18 18 0 0.0 Gibraltar 4,264 5,180 916 21.5 4,250 5,166 916 21.6 14 14 0 0.0 Grosse Ile Twp 10,894 10,943 49 0.4 10,868 10,917 49 0.5 26 26 0 0.0 Grosse Pointe 5,670 5,692 22 0.4 5,670 5,692 22 0.4 0 0 0 0.0 Grosse Pte Farms 9,764 9,622 -142 -1.5 9,764 9,622 -142 -1.5 0 0 0 0.0 Grosse Pte Park 12,443 12,782 339 2.7 12,437 12,776 339 2.7 6 6 0 0.0 Grosse Pte Shores (Pt) 2,743 2,487 -256 -9.3 2,743 2,487 -256 -9.3 0 0 0 0.0 Grosse Pte Woods 17,080 16,580 -500 -2.9 17,009 16,509 -500 -2.9 71 71 0 0.0 Hamtramck 22,976 21,417 -1,559 -6.8 21,997 20,438 -1,559 -7.1 979 979 0 0.0 Harper Woods 14,254 14,061 -193 -1.4 14,108 13,915 -193 -1.4 146 146 0 0.0 Highl<strong>and</strong> Park 16,746 15,264 -1,482 -8.8 15,857 14,375 -1,482 -9.3 889 889 0 0.0 Huron Twp 13,737 16,846 3,109 22.6 13,648 16,757 3,109 22.8 89 89 0 0.0 Inkster 30,115 26,636 -3,479 -11.6 29,863 26,384 -3,479 -11.6 252 252 0 0.0 Lincoln Park 40,008 39,044 -964 -2.4 39,880 38,916 -964 -2.4 128 128 0 0.0 Livonia 100,545 98,752 -1,793 -1.8 98,654 96,861 -1,793 -1.8 1,891 1,891 0 0.0 Melvindale 10,735 11,242 507 4.7 10,706 11,213 507 4.7 29 29 0 0.0 (Cont'd) 7
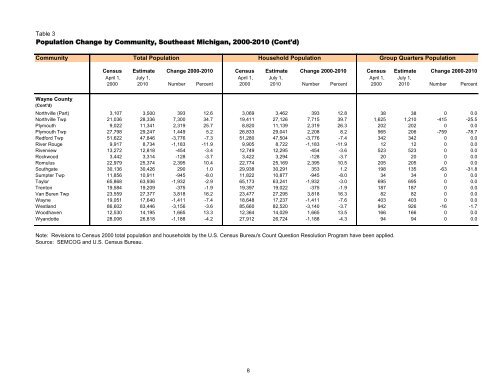
Table 3 <strong>Population</strong> Change by Community, <strong>Southeast</strong> Michigan, 2000-2010 (Cont'd) Community Total <strong>Population</strong> <strong>Household</strong> <strong>Population</strong> Group Quarters <strong>Population</strong> Census Estimate Change 2000-2010 Census Estimate Change 2000-2010 Census Estimate Change 2000-2010 April 1, July 1, April 1, July 1, April 1, July 1, 2000 2010 Number Percent 2000 2010 Number Percent 2000 2010 Number Percent Wayne County (Cont'd) Northville (Part) 3,107 3,500 393 12.6 3,069 3,462 393 12.8 38 38 0 0.0 Northville Twp 21,036 28,336 7,300 34.7 19,411 27,126 7,715 39.7 1,625 1,210 -415 -25.5 Plymouth 9,022 11,341 2,319 25.7 8,820 11,139 2,319 26.3 202 202 0 0.0 Plymouth Twp 27,798 29,247 1,449 5.2 26,833 29,041 2,208 8.2 965 206 -759 -78.7 Red<strong>for</strong>d Twp 51,622 47,846 -3,776 -7.3 51,280 47,504 -3,776 -7.4 342 342 0 0.0 River Rouge 9,917 8,734 -1,183 -11.9 9,905 8,722 -1,183 -11.9 12 12 0 0.0 Riverview 13,272 12,818 -454 -3.4 12,749 12,295 -454 -3.6 523 523 0 0.0 Rockwood 3,442 3,314 -128 -3.7 3,422 3,294 -128 -3.7 20 20 0 0.0 Romulus 22,979 25,374 2,395 10.4 22,774 25,169 2,395 10.5 205 205 0 0.0 Southgate 30,136 30,426 290 1.0 29,938 30,291 353 1.2 198 135 -63 -31.8 Sumpter Twp 11,856 10,911 -945 -8.0 11,822 10,877 -945 -8.0 34 34 0 0.0 Taylor 65,868 63,936 -1,932 -2.9 65,173 63,241 -1,932 -3.0 695 695 0 0.0 Trenton 19,584 19,209 -375 -1.9 19,397 19,022 -375 -1.9 187 187 0 0.0 Van Buren Twp 23,559 27,377 3,818 16.2 23,477 27,295 3,818 16.3 82 82 0 0.0 Wayne 19,051 17,640 -1,411 -7.4 18,648 17,237 -1,411 -7.6 403 403 0 0.0 Westl<strong>and</strong> 86,602 83,446 -3,156 -3.6 85,660 82,520 -3,140 -3.7 942 926 -16 -1.7 Woodhaven 12,530 14,195 1,665 13.3 12,364 14,029 1,665 13.5 166 166 0 0.0 Wy<strong>and</strong>otte 28,006 26,818 -1,188 -4.2 27,912 26,724 -1,188 -4.3 94 94 0 0.0 Note: Revisions to Census 2000 total population <strong>and</strong> households by the U.S. Census Bureau's Count Question Resolution Program have been applied. Source: SEMCOG <strong>and</strong> U.S. Census Bureau. 8