- Page 1 and 2:
U.S. DEPARTMENT OF DEFENSE Environm
- Page 3 and 4:
This page intentionally left blank.
- Page 5 and 6:
In addition NSWC-CD evaluated the p
- Page 7 and 8:
energy. Cost/Benefit Analysis (CBA)
- Page 9 and 10:
3.4. Methodology ..................
- Page 11 and 12:
4.2.6.4. Results of Discontinuities
- Page 13 and 14:
4.3.9. Material Testing Conclusions
- Page 15 and 16:
8.2.1.1. Test Set Up and Parameters
- Page 17 and 18:
Figure 3-16 Surface of Automated ES
- Page 19 and 20:
micrograph confirm this to be the c
- Page 21 and 22:
Figure 4-83 Post-test of Panel S-1
- Page 23 and 24:
Figure 5-17 Optical Macrograph Show
- Page 25 and 26:
Table 3-4 ESD Input Levels in DOE .
- Page 27 and 28:
Controls Immersed in Quiescent, Nat
- Page 29 and 30:
This page intentionally left blank.
- Page 31 and 32:
IARC ID IN625 IN718 IRR JTP kJ ksi
- Page 33 and 34:
ACKNOWLEDGMENTS The financial and p
- Page 35 and 36:
Although results were first reporte
- Page 37 and 38:
• ANAD/ARL - Army components - Ab
- Page 39 and 40:
operations at repair facilities. 1.
- Page 41 and 42:
This page intentionally left blank.
- Page 43 and 44:
Boeing Company, Honeywell Engines a
- Page 45 and 46:
Figure 2-1 RC Circuit in ESD Equipm
- Page 47 and 48:
component surfaces can be reduced f
- Page 49 and 50:
Cadmium Plating and IVD-Aluminum wi
- Page 51 and 52:
inch finish. Applications requiring
- Page 53 and 54: UIT equipment to improve surface fi
- Page 55 and 56: Figure 3-5 Torch-Leading Progressio
- Page 57 and 58: The four-jawed chuck permits specim
- Page 59 and 60: Table 3-1 Phase One Text Matrix of
- Page 61 and 62: Figure 3-13 UIT Treatment Process W
- Page 63 and 64: Weight measurements were not taken
- Page 65 and 66: Table 3-8 DOE Experimental Test Mat
- Page 67 and 68: esidual stresses in metals. It uses
- Page 69 and 70: etween each of the phases (i.e. har
- Page 71 and 72: Table 3-10 Discontinuity Values Cou
- Page 73 and 74: 3.5.1.4. Deposition Rate Results Au
- Page 75 and 76: Table 3-13 Average % Porosity of ES
- Page 77 and 78: ESD/UIT Hardnesses Microhardness (K
- Page 79 and 80: Figure 3-27 Example of 50% Overlap
- Page 81 and 82: ESD/UIT Surface Roughness after Fin
- Page 83 and 84: Figure 3-31 Effect of Input Paramet
- Page 85 and 86: Figure 3-34 Statistical Interaction
- Page 87 and 88: Figure 3-38 and BL) Residual Stress
- Page 89 and 90: Residual Stress of ESD/UIT on IN718
- Page 91 and 92: Table 3-21 Combined (UIT Number) (E
- Page 93 and 94: At the conclusion of this work two
- Page 95 and 96: This page intentionally left blank.
- Page 97 and 98: evaluated are shown in Table 4-1. T
- Page 99 and 100: Figure 4-4 Type 1 Defect in Coupon
- Page 101 and 102: (UIT) as described in Section 3, wh
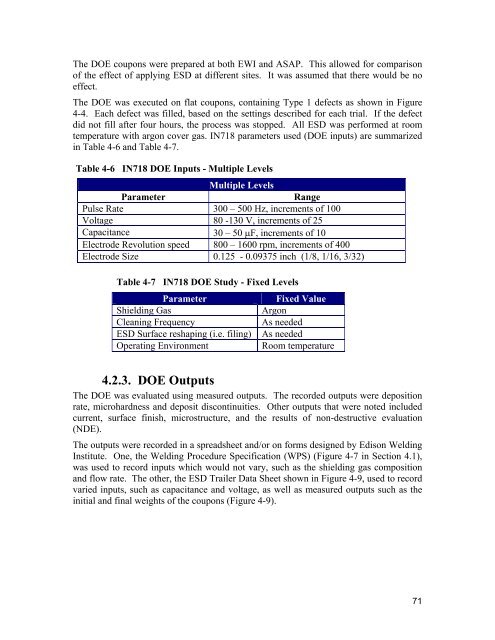
- Page 103: Several types of DOE approaches wer
- Page 107 and 108: Figure 4-10 Location of Microhardne
- Page 109 and 110: Energy Input of DOE Coupons vs. Val
- Page 111 and 112: Table 4-10 ASAP and EWI Hardness an
- Page 113 and 114: Microhardness in the DOE Coupons (A
- Page 115 and 116: Discontinuities in the DOE Coupons
- Page 117 and 118: Figure 4-21 Coupon #36. FPI Indicat
- Page 119 and 120: Figure 4-23 Coupon #45. FPI indicat
- Page 121 and 122: Validation of Total Weld Time Depos
- Page 123 and 124: Discontinuities = - 5.86 - 0.00417(
- Page 125 and 126: The statistical software can be use
- Page 127 and 128: Table 4-14 Minitab Four-Output Opti
- Page 129 and 130: 4.2.6.9. Parameters Selected for Te
- Page 131 and 132: Figure 4-34 Fatigue Specimen Specif
- Page 133 and 134: 4.3.2.4. Test Methodology The fatig
- Page 135 and 136: Table 4-19 Equations for Fatigue Li
- Page 137 and 138: Fatigue Stress vs. Cycles to Failur
- Page 139 and 140: specimen with no visible defective
- Page 141 and 142: Table 4-22 Tensile Test Matrix for
- Page 143 and 144: 174 Yield Strength Average Yield St
- Page 145 and 146: Baseline with Defect (All 6) 250 St
- Page 147 and 148: Bead On Plate (All 3) 250 Stress (K
- Page 149 and 150: Figure 4-59 Typical Fracture of Bas
- Page 151 and 152: 0.125”-thick disks were used in t
- Page 153 and 154: Figure 4-67 Implant Sciences Corp.
- Page 155 and 156:
To generate a deeper groove and ext
- Page 157 and 158:
Figure 4-70 Wear Groove in Disk Bas
- Page 159 and 160:
It was possible to hear a differenc
- Page 161 and 162:
Figure 4-74 Hamilton Sundstrand Wea
- Page 163 and 164:
Figure 4-77 Hamilton Sundstrand Wea
- Page 165 and 166:
Load Pin 3000 lb. capacity Flat Cou
- Page 167 and 168:
Figure 4-81 Test 1, Panel S-1 and E
- Page 169 and 170:
Figure 4-87 illustrates (both in da
- Page 171 and 172:
Stroking Wear Testing of IN718 and
- Page 173 and 174:
when a higher energy setting (and c
- Page 175 and 176:
Figure 4-92 Corrosion Specimens 11-
- Page 177 and 178:
Figure 4-94 Corrosion Specimens 20-
- Page 179 and 180:
Figure 4-97 Digital Height Gauge fo
- Page 181 and 182:
ASTM C 633. Per ASTM C 633, ESD is
- Page 183 and 184:
4.3.9. Material Testing Conclusions
- Page 185 and 186:
Table 4-36 Candidate Components Ima
- Page 187 and 188:
the repair and dimensional restorat
- Page 189 and 190:
Figure 4-103 Excavate Damages Area
- Page 191 and 192:
The microhardness of the deposit wa
- Page 193 and 194:
Figure 4-110 10-12 Stator Segment F
- Page 195 and 196:
A metallurgical evaluation was perf
- Page 197 and 198:
Figure 4-117 Hot Air Erosion Defect
- Page 199 and 200:
This page intentionally left blank.
- Page 201 and 202:
Figure 5-2 Cannon Cradle Disassembl
- Page 203 and 204:
Figure 5-4 Porosity Around the ESD
- Page 205 and 206:
Knoop microhardness measurements (w
- Page 207 and 208:
Since the approval of the ESD repai
- Page 209 and 210:
Figure 5-13 Photograph of an M1A1 h
- Page 211 and 212:
Figure 5-15 Test Samples Used for E
- Page 213 and 214:
Figure 5-19 SEM Micrograph of a Cro
- Page 215 and 216:
This page intentionally left blank.
- Page 217 and 218:
Figure 6-3 Steering/Diving Control
- Page 219 and 220:
Figure 6-5 Application of ESD Coati
- Page 221 and 222:
Potential (V vs. Ag/AgCl) -0.020 -0
- Page 223 and 224:
6.3. ESD on Alloy K500 - Component
- Page 225 and 226:
Figure 6-10 Metallographic Cross-Se
- Page 227 and 228:
6.4. ESD Deposition on Alloy 625 -
- Page 229 and 230:
acetone degreased, and then air dri
- Page 231 and 232:
Figure 6-18 Crevice Corrosion Test
- Page 233 and 234:
The E corr data (Figure 6-19) showe
- Page 235 and 236:
this alternative process at OC-ALC.
- Page 237 and 238:
given in subsequent sections of thi
- Page 239 and 240:
Rework as Needed Mask Strip Bake Ou
- Page 241 and 242:
Table 7-7 Baseline Cost Allocations
- Page 243 and 244:
Table 7-8 Annual Operating Costs fo
- Page 245 and 246:
Table 7-10 Data and Assumptions Use
- Page 247 and 248:
Table 7-11 continued MODULE ESD Sho
- Page 249 and 250:
7.4.3. Capital Costs Implementing t
- Page 251 and 252:
guidance on the discount rates to b
- Page 253 and 254:
materials, waste disposal and envir
- Page 255 and 256:
data accumulated. Table 8-1 shows a
- Page 257 and 258:
8.2.1.1. Test Set Up and Parameters
- Page 259 and 260:
8.2.2. Results 8.2.2.1. Summary of
- Page 261 and 262:
2.5 Effect of Audible Feedback Forc
- Page 263 and 264:
was strictly a summation of effects
- Page 265 and 266:
Figure 8-10 Automated Force Control
- Page 267 and 268:
8.3.2.2. Automated Force Control te
- Page 269 and 270:
8.3.3. Conclusions on the Automated
- Page 271 and 272:
Ease of use of the equipment: Accor
- Page 273 and 274:
5 4.5 4 3.5 3 Net Effect of SuSi Th
- Page 275 and 276:
This page intentionally left blank.
- Page 277 and 278:
usually manual, making it difficult
- Page 279 and 280:
applicable to ships and submarines.
- Page 281 and 282:
This page intentionally left blank.
- Page 283 and 284:
16. “Environmental Cost Analysis
- Page 285 and 286:
APPENDIX A 252
- Page 287 and 288:
RECLAMATION PROCEDURE - M1A1 Cannon
- Page 289 and 290:
RECLAMATION PROCEDURE - M1A1 Cannon
- Page 291 and 292:
258
- Page 293 and 294:
M1A1 HELICAL (SUN) GEAR RECLAMATION
- Page 295 and 296:
RECLAMATION PROCEDURE - M1A1 Helica
- Page 297 and 298:
RECLAMATION PROCEDURE - M1A1 Helica
- Page 299:
RECLAMATION PROCEDURE - M1A1 Helica