osta cd-r compatibility study results from phase 2 - OSTA - Optical ...
osta cd-r compatibility study results from phase 2 - OSTA - Optical ...
osta cd-r compatibility study results from phase 2 - OSTA - Optical ...

Create successful ePaper yourself
Turn your PDF publications into a flip-book with our unique Google optimized e-Paper software.
CD-R Compatibility Study – Phase 2<br />
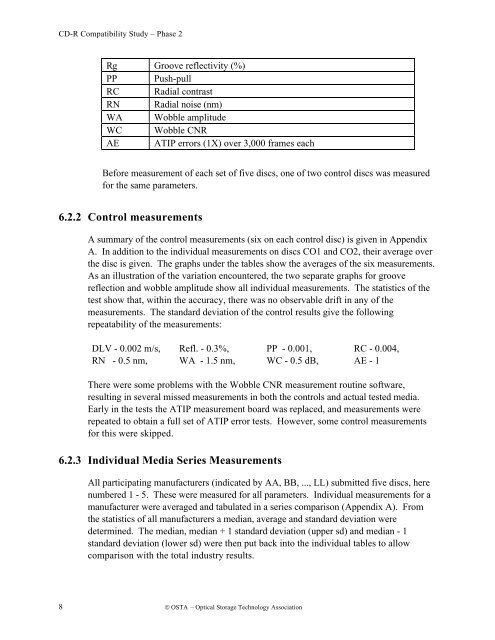
Rg Groove reflectivity (%)<br />
PP Push-pull<br />
RC Radial contrast<br />
RN Radial noise (nm)<br />
WA Wobble amplitude<br />
WC Wobble CNR<br />
AE ATIP errors (1X) over 3,000 frames each<br />
Before measurement of each set of five discs, one of two control discs was measured<br />
for the same parameters.<br />
6.2.2 Control measurements<br />
A summary of the control measurements (six on each control disc) is given in Appendix<br />
A. In addition to the individual measurements on discs CO1 and CO2, their average over<br />
the disc is given. The graphs under the tables show the averages of the six measurements.<br />
As an illustration of the variation encountered, the two separate graphs for groove<br />
reflection and wobble amplitude show all individual measurements. The statistics of the<br />
test show that, within the accuracy, there was no observable drift in any of the<br />
measurements. The standard deviation of the control <strong>results</strong> give the following<br />
repeatability of the measurements:<br />
DLV - 0.002 m/s, Refl. - 0.3%, PP - 0.001, RC - 0.004,<br />
RN - 0.5 nm, WA - 1.5 nm, WC - 0.5 dB, AE - 1<br />
There were some problems with the Wobble CNR measurement routine software,<br />
resulting in several missed measurements in both the controls and actual tested media.<br />
Early in the tests the ATIP measurement board was replaced, and measurements were<br />
repeated to obtain a full set of ATIP error tests. However, some control measurements<br />
for this were skipped.<br />
6.2.3 Individual Media Series Measurements<br />
All participating manufacturers (indicated by AA, BB, ..., LL) submitted five discs, here<br />
numbered 1 - 5. These were measured for all parameters. Individual measurements for a<br />
manufacturer were averaged and tabulated in a series comparison (Appendix A). From<br />
the statistics of all manufacturers a median, average and standard deviation were<br />
determined. The median, median + 1 standard deviation (upper sd) and median - 1<br />
standard deviation (lower sd) were then put back into the individual tables to allow<br />
comparison with the total industry <strong>results</strong>.<br />
8 © <strong>OSTA</strong> – <strong>Optical</strong> Storage Technology Association