

computational investigation of hydro-mechanical effects on ...
computational investigation of hydro-mechanical effects on ...
computational investigation of hydro-mechanical effects on ...

Create successful ePaper yourself
Turn your PDF publications into a flip-book with our unique Google optimized e-Paper software.
PROCEEDINGS, Thirty-Eighth Workshop <strong>on</strong> Geothermal Reservoir Engineering<br />
Stanford University, Stanford, California, February 11-13, 2013<br />
SGP-TR-198<br />
COMPUTATIONAL INVESTIGATION OF HYDRO-MECHANICAL EFFECTS ON<br />
TRANSMISSIVITY EVOLUTION DURING THE INITIAL INJECTION PHASES AT THE<br />
DESERT PEAK EGS PROJECT, NV<br />
Stefano Benato 1 , D<strong>on</strong>ald M. Reeves 1 , Rishi Parashar 1 , Nicholas C. Davatzes 2 , Stephen Hickman 3 , Derek Elsworth<br />
4 , Paul Spielman 5 , Joshua Tar<strong>on</strong> 3<br />
1 - Divisi<strong>on</strong> <str<strong>on</strong>g>of</str<strong>on</strong>g> Hydrologic Sciences, Desert Research Institute, Reno, NV, 89512 USA<br />
2 - Temple University, Philadelphia, PA, 19122 USA<br />
3 - U.S. Geological Survey, Menlo Park, CA, 94025 USA<br />
4 - Pennsylvania State University, University Park, PA, 16802 USA<br />
5 - Ormat Nevada Inc., Reno, NV, 89511 USA<br />
stefano.benato@dri.edu<br />
ABSTRACT<br />
The low-flow-rate injecti<strong>on</strong> phase <str<strong>on</strong>g>of</str<strong>on</strong>g> an Engineered<br />
Geothermal System (EGS) experiment in Desert Peak<br />
well 27-15 produced increased injectivity at wellhead<br />
pressures less than the minimum principal stress,<br />
c<strong>on</strong>sistent with hydraulically induced <str<strong>on</strong>g>mechanical</str<strong>on</strong>g><br />
shear failure in the surrounding rock. We use<br />
statistical fracture analysis and <str<strong>on</strong>g>hydro</str<strong>on</strong>g>-<str<strong>on</strong>g>mechanical</str<strong>on</strong>g><br />
modeling to simulate the observed pressure resp<strong>on</strong>se<br />
during this shear stimulati<strong>on</strong>, to explore <strong>on</strong>e possible<br />
c<strong>on</strong>ceptual framework for the overall Desert Peak<br />
EGS experiment. This is part <str<strong>on</strong>g>of</str<strong>on</strong>g> a l<strong>on</strong>g-term study to<br />
simulate the complete Desert Peak EGS stimulati<strong>on</strong>,<br />
including both shearing and hydraulic fracturing<br />
(tensile) failure.<br />
Discrete fracture network simulati<strong>on</strong>s, based <strong>on</strong><br />
fracture/fault attributes measured downhole and at<br />
the surface, were used to derive equivalent<br />
permeability tensors for comparis<strong>on</strong> with preferred<br />
fluid migrati<strong>on</strong> directi<strong>on</strong>s observed in hydraulic and<br />
tracer tests. FLAC 3D , a <str<strong>on</strong>g>hydro</str<strong>on</strong>g>-<str<strong>on</strong>g>mechanical</str<strong>on</strong>g> simulator,<br />
was used to investigate changes in stress and<br />
displacement according to a Mohr-Coulomb<br />
fricti<strong>on</strong>al model subjected to perturbati<strong>on</strong>s in pore<br />
pressure. Although almost all <str<strong>on</strong>g>of</str<strong>on</strong>g> the seismicity<br />
observed during the EGS stimulati<strong>on</strong> occurred during<br />
the high-flow-rate tensile stimulati<strong>on</strong> phase, we use<br />
this seismicity to illuminate the geometry <str<strong>on</strong>g>of</str<strong>on</strong>g> largescale<br />
geologic structures that could also have served<br />
as preferential flow paths during shear stimulati<strong>on</strong>.<br />
This analysis shows that c<strong>on</strong>diti<strong>on</strong>s for shear failure<br />
during the low-flow-rate shear stimulati<strong>on</strong> could<br />
occur in locati<strong>on</strong>s c<strong>on</strong>sistent with locati<strong>on</strong>s <str<strong>on</strong>g>of</str<strong>on</strong>g> microseismicity<br />
seen during the tensile phase <str<strong>on</strong>g>of</str<strong>on</strong>g> the EGS<br />
experiment, providing a possible <str<strong>on</strong>g>hydro</str<strong>on</strong>g>logic<br />
c<strong>on</strong>necti<strong>on</strong> between EGS well 27-15 and<br />
injecti<strong>on</strong>/producti<strong>on</strong> wells further south-southwest.<br />
This FLAC 3D <str<strong>on</strong>g>hydro</str<strong>on</strong>g>-<str<strong>on</strong>g>mechanical</str<strong>on</strong>g> model will next be<br />
coupled to TOUGHREACT to investigate the nearfield<br />
evoluti<strong>on</strong> <str<strong>on</strong>g>of</str<strong>on</strong>g> reservoir transmissivity associated<br />
with thermal, hydraulic, <str<strong>on</strong>g>mechanical</str<strong>on</strong>g> and chemical<br />
processes during all phases <str<strong>on</strong>g>of</str<strong>on</strong>g> the Desert Peak EGS<br />
stimulati<strong>on</strong>.<br />
1 - INTRODUCTION<br />
The goal <str<strong>on</strong>g>of</str<strong>on</strong>g> an Engineered Geothermal System (EGS)<br />
is to develop a complex and extensive flow path in<br />
hot, but low permeability rocks. The applicati<strong>on</strong> <str<strong>on</strong>g>of</str<strong>on</strong>g><br />
EGS at operating <str<strong>on</strong>g>hydro</str<strong>on</strong>g>thermal reservoirs is intended<br />
to c<strong>on</strong>vert dry or low-permeability unusable wells<br />
into operati<strong>on</strong>al injectors or producers, in an attempt<br />
to increase field productivity. To develop a complex<br />
flow path characterized by large surface area to rock<br />
volume ratios, as needed for optimal heat exchange,<br />
EGS experiments to date (e.g., Soultz-sous-Forêts,<br />
Desert Peak, Newberry, Habanero) have typically<br />
used stimulati<strong>on</strong> techniques that enhance the<br />
permeability <str<strong>on</strong>g>of</str<strong>on</strong>g> existing and naturally tortuous<br />
fracture networks generally found to be ubiquitous<br />
within the crust.<br />
The Desert Peak geothermal field is a successfully<br />
operating geothermal field with an approximate 23<br />
MWe output located in the northern porti<strong>on</strong> <str<strong>on</strong>g>of</str<strong>on</strong>g> the<br />
Hot Springs Mountains <str<strong>on</strong>g>of</str<strong>on</strong>g> northwestern Churchill<br />
County, Nevada, about 100 km northeast <str<strong>on</strong>g>of</str<strong>on</strong>g> Reno.<br />
Well 27-15 was selected to carry out a U.S.<br />
Department <str<strong>on</strong>g>of</str<strong>on</strong>g> Energy supported EGS project with<br />
the intent <str<strong>on</strong>g>of</str<strong>on</strong>g> improving the hydraulic c<strong>on</strong>necti<strong>on</strong> with<br />
the rest <str<strong>on</strong>g>of</str<strong>on</strong>g> the reservoir and enhancing overall<br />
injectivity. Well 27-15 was originally drilled to a<br />
total depth <str<strong>on</strong>g>of</str<strong>on</strong>g> about 1771m. In 2010 it was backfilled<br />
to a total depth <str<strong>on</strong>g>of</str<strong>on</strong>g> about 1067m, with the<br />
completed open-hole secti<strong>on</strong> extending from 914m to<br />
1067m to provide a short interval just below the
casing shoe, but within<br />
the reservoir, to stimulate<br />
through hydraulic and chemical methods [2].<br />
Hydraulic stimulati<strong>on</strong> carried out in Desert Peak welll<br />
27-15 from<br />
September 2010 through April 2011 led<br />
to a nearly<br />
60-fold increase in injectivity [2]. This<br />
stimulati<strong>on</strong><br />
was carried<br />
under two different fluid<br />
pressure c<strong>on</strong>diti<strong>on</strong>s relative to the least principal<br />
stress. An initial period <str<strong>on</strong>g>of</str<strong>on</strong>g> shear stimulati<strong>on</strong>, whichh<br />
increased injectivity by<br />
more than <strong>on</strong>e order <str<strong>on</strong>g>of</str<strong>on</strong>g><br />
magnitude, from ~0.011 to ~0.15 gpm/psi, was<br />
carried out<br />
in a series <str<strong>on</strong>g>of</str<strong>on</strong>g><br />
steps at low fluid pressuress<br />
up to 4.5 MPa well head pressure (WHP). This<br />
maximum WHP was chosen to remain below the<br />
magnitude <str<strong>on</strong>g>of</str<strong>on</strong>g> the least horiz<strong>on</strong>tal principal stresss<br />
(WHP ~5.2<br />
MPa), as measured in this well just below<br />
the casing shoe by a mini-hydraulic<br />
fracturing testt<br />
[15]. This<br />
low-flow-rate phase was<br />
immediately<br />
followed by a large-volume c<strong>on</strong>trolled hydraulic<br />
fracturing operati<strong>on</strong> thatt lasted more than 23 days,<br />
which was<br />
carried out at high injecti<strong>on</strong> rates and<br />
WHP in excess <str<strong>on</strong>g>of</str<strong>on</strong>g> the least principal stress. This<br />
hydraulic fracturing stage resulted in an<br />
additi<strong>on</strong>al 4-<br />
fold increase in injectivity [2]. Temperature-Pressure--<br />
exited and<br />
stimulated well 27-15 at two primary locati<strong>on</strong>s: 1) the<br />
bottom <str<strong>on</strong>g>of</str<strong>on</strong>g> the open-hole secti<strong>on</strong> during<br />
the low-flow--<br />
rate injecti<strong>on</strong> phase and 2) the hydraulic fracture just<br />
below the<br />
casing shoe<br />
during the high-flow-rate<br />
injecti<strong>on</strong> phase.<br />
During the<br />
EGS experiment, a total <str<strong>on</strong>g>of</str<strong>on</strong>g> 42 micro-<br />
earthquakes (MEQs) with magnitudes<br />
ranging from<br />
+0.10 to +0.74 were recorded between<br />
EGS well 27-<br />
15 and injecti<strong>on</strong>/producti<strong>on</strong> wells to the south-<br />
southwest, including in proximity to injecti<strong>on</strong> wells<br />
21-2 and 22-22 (see Figure 2 and Figure 3) [2]. Alll<br />
but <strong>on</strong>e <str<strong>on</strong>g>of</str<strong>on</strong>g> these MEQs occurred<br />
during the<br />
c<strong>on</strong>trolled hydraulic fracturing stimulati<strong>on</strong>, with <strong>on</strong>ly<br />
<strong>on</strong>e event (discussed below) occurring<br />
during shear<br />
stimulati<strong>on</strong>. During all stimulati<strong>on</strong><br />
stages, the<br />
greatest injectivity gains are associated with the<br />
initiati<strong>on</strong> or occurrence <str<strong>on</strong>g>of</str<strong>on</strong>g> these MEQs under either<br />
c<strong>on</strong>stant or<br />
decreasing wellhead pressure (Figure 1) .<br />
Spinner logs show that the injected fluid<br />
This suggests that shear failure (i.e., faulting)<br />
resulting in<br />
the generati<strong>on</strong> <str<strong>on</strong>g>of</str<strong>on</strong>g> MEQs is a key physical<br />
process c<strong>on</strong>trolling the evoluti<strong>on</strong> <str<strong>on</strong>g>of</str<strong>on</strong>g> transmissivity.<br />
Variati<strong>on</strong>s in injecti<strong>on</strong> rate occurred in wells 21-22<br />
and 22-222 at various<br />
times during the EGS<br />
stimulati<strong>on</strong>, especially prior to the c<strong>on</strong>trolled<br />
hydraulic fracturing stage. In some cases, this makes<br />
it difficult to establish a unique correlati<strong>on</strong> between<br />
EGS operati<strong>on</strong>s and the observed seismicity.<br />
However, no significant<br />
variati<strong>on</strong>s in injecti<strong>on</strong> rate<br />
were occurring in wells 21-2 and 22-222 when the first<br />
MEQ was observed <strong>on</strong> Sept 17, 2010, during the low-<br />
flow-rate shear stimulati<strong>on</strong> (Figure 1). As discussedd<br />
below, this<br />
is <strong>on</strong>e reas<strong>on</strong> this stage <str<strong>on</strong>g>of</str<strong>on</strong>g> the Desert Peak<br />
EGS stimulati<strong>on</strong> was selected for analysis in the<br />
present paper.<br />
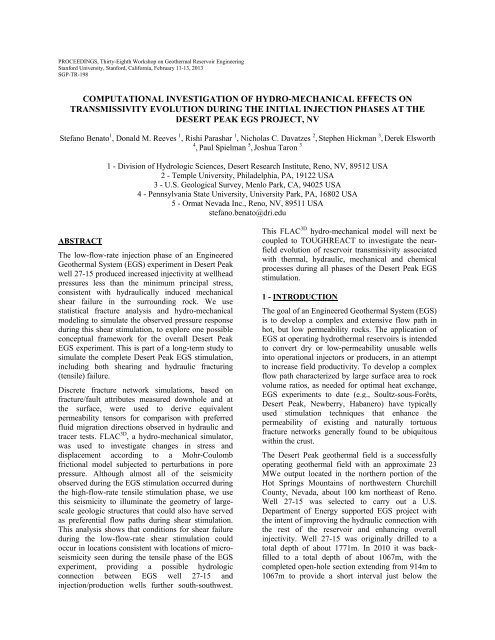
Figure 1: Low-flow rate injecti<strong>on</strong> phase, Sept 2010: well<br />
27-155 well-head pressure (WHP) and injecti<strong>on</strong> rate. The<br />
observed Sept 17 micro-earthquakee (MEQ) occurs after<br />
aboutt 4 days <str<strong>on</strong>g>of</str<strong>on</strong>g> injecti<strong>on</strong> and it is followed by a remarkable<br />
increase in the injecti<strong>on</strong> rate under c<strong>on</strong>stant wellhead<br />
pressure (Figure from<br />
[2]).<br />
Poor r focal sphere coverage and limited c<strong>on</strong>straints <strong>on</strong><br />
the seismic velocity model make it difficult to: (1)<br />
derive the exact source mechanism for these MEQs,<br />
(2) detect events smaller than magnitude M w < +0.1<br />
or (3) define the locati<strong>on</strong> <str<strong>on</strong>g>of</str<strong>on</strong>g> individual events with<br />
precisi<strong>on</strong>. Nevertheless, tensilee failure produces<br />
relatively high frequency signals at the crack<br />
tip –<br />
typically <str<strong>on</strong>g>of</str<strong>on</strong>g> M
Figure 3 – 3D view <str<strong>on</strong>g>of</str<strong>on</strong>g> the 42 MEQs observed throughoutt<br />
the entire EGS experiment. The events appear to be<br />
clustered at<br />
about 1500m depth (Figure from<br />
[2]).<br />
The occurrence <str<strong>on</strong>g>of</str<strong>on</strong>g> MEQs<br />
at any stage <str<strong>on</strong>g>of</str<strong>on</strong>g> the injecti<strong>on</strong>n<br />
phase is critical as: 1) most <str<strong>on</strong>g>of</str<strong>on</strong>g> the observed MEQs<br />
precede str<strong>on</strong>g changes in injectivity<br />
during<br />
otherwise approximately<br />
c<strong>on</strong>stant WHP (indicating<br />
permeability development/enhancement); 2) The<br />
first, and lowest pressure phase <str<strong>on</strong>g>of</str<strong>on</strong>g> injecti<strong>on</strong> is<br />
associated with a single MEQ located below the<br />
injecti<strong>on</strong> interval, but approximately<br />
<strong>on</strong> the same<br />
populati<strong>on</strong><br />
<str<strong>on</strong>g>of</str<strong>on</strong>g> MEQs observed during all stimulati<strong>on</strong><br />
phases. This MEQ also immediately precedes large<br />
gains in injectivity at near c<strong>on</strong>stant WPH in 27-15,<br />
which suggests a c<strong>on</strong>necti<strong>on</strong> between fluid supplied<br />
from 27-15<br />
and the MEQ, and that the MEQ al<strong>on</strong>g<br />
the flow path from 27-15 to the main field is <strong>on</strong>e <str<strong>on</strong>g>of</str<strong>on</strong>g><br />
many shear events that caused a reducti<strong>on</strong> in<br />
resistance to flow (i.e., a gain in permeability) during<br />
the Sept 2010 low-flow-rate injecti<strong>on</strong> phase.<br />
The sec<strong>on</strong>d goal <str<strong>on</strong>g>of</str<strong>on</strong>g> the study is to numerically<br />
simulate whether fluid<br />
pressure changes at the<br />
locati<strong>on</strong> <str<strong>on</strong>g>of</str<strong>on</strong>g><br />
this MEQ, in resp<strong>on</strong>se to low-flow-rate<br />
injecti<strong>on</strong> into 27-15, are sufficient to cause fricti<strong>on</strong>al<br />
failure. This simulati<strong>on</strong><br />
utilizes: (a) injecti<strong>on</strong> rates<br />
into 27-15<br />
during the ow-flow-rate injecti<strong>on</strong> phase<br />
(when the<br />
single MEQ occurred), (b) a statistical<br />
characterizati<strong>on</strong><br />
<str<strong>on</strong>g>of</str<strong>on</strong>g> the fracture<br />
populati<strong>on</strong><br />
surrounding well 27-15,<br />
and (c) the effect <strong>on</strong> fluid<br />
pressure at the MEQ locati<strong>on</strong> due to c<strong>on</strong>current<br />
injecti<strong>on</strong> into well 22-222 to the south. Note that the<br />
underlying<br />
propositi<strong>on</strong> <str<strong>on</strong>g>of</str<strong>on</strong>g> this c<strong>on</strong>sistency test is thatt<br />
the MEQ is causally related to a subsequent change<br />
in injectivity. This is accomplished<br />
by simulating<br />
well-head pressure resp<strong>on</strong>se during the Sept 20100<br />
low-flow-rate EGS injecti<strong>on</strong> phase (Figure 1). The<br />
Sept 2010 stimulati<strong>on</strong> phase is a good<br />
candidate for<br />
our initial model verificati<strong>on</strong> and calibrati<strong>on</strong> because:<br />
a) injecti<strong>on</strong>n during this phase occurred at pressuress<br />
below S hm min, thus <strong>on</strong>ly<br />
shearing processes weree<br />
involved, b) the injecti<strong>on</strong> rate climbs immediately<br />
after a single, yet significant, MEQ event and c)<br />
injecti<strong>on</strong> into nearby wells 22-1 and 22-22 was<br />
2 - RESERVOIR CONCEPTUAL MODEL<br />
relatively steady at t the time this earthquake occurred,<br />
which also coincided with the <strong>on</strong>set <str<strong>on</strong>g>of</str<strong>on</strong>g> the<br />
pr<strong>on</strong>ounced injectivity gain observed in well 27-15<br />
(Figure 1).<br />
Thus, <strong>on</strong>ly shear failure is c<strong>on</strong>sidered and modeled in<br />
this paper, as it is the <strong>on</strong>ly process occurring during<br />
the Sept 2010 injecti<strong>on</strong> phase. Tensile failure likely<br />
occurs during the subsequent medium to high-flow-<br />
secti<strong>on</strong> <str<strong>on</strong>g>of</str<strong>on</strong>g> well 27-15 at Desert<br />
Peak. Such tensile<br />
rate hydraulic fracturing phases around the open-hole<br />
failure is not addressed in this paper and will be part<br />
<str<strong>on</strong>g>of</str<strong>on</strong>g> a future study. . Thermal stresses will also be<br />
c<strong>on</strong>sidered in modeling all stages <str<strong>on</strong>g>of</str<strong>on</strong>g> the Desert Peak<br />
EGS stimulati<strong>on</strong> at t a later date.<br />
This model presented in this paper is not unique but<br />
<str<strong>on</strong>g>of</str<strong>on</strong>g>fers <strong>on</strong>e possiblee explanati<strong>on</strong> for the deep locati<strong>on</strong><br />
<str<strong>on</strong>g>of</str<strong>on</strong>g> MEQs observed during the<br />
Desert Peak<br />
EGS<br />
stimulati<strong>on</strong>. The observed MEQs seem to be<br />
influenced in a complex way by injecti<strong>on</strong> operati<strong>on</strong>s<br />
in both wells 27-15 and 22-22. Although we allow<br />
for some injecti<strong>on</strong> n into well 22-22 in our modeling<br />
(see below), this issue is not addressed in detail here<br />
but will be addressed in detail in a future study.<br />
The Desert Peak geothermal field is located in the<br />
northern porti<strong>on</strong> <str<strong>on</strong>g>of</str<strong>on</strong>g> the Hot Springs Mountains.<br />
Extensive drilling in the Desert Peak geothermal area<br />
has shown that the Hot Springs Mountains are mainly<br />
comprised <str<strong>on</strong>g>of</str<strong>on</strong>g> Tertiary volcanic and sedimentary<br />
rockss that lie directly <strong>on</strong> Mesozoic metamorphic and<br />
granitic basement [10][19]. Intrusive rocks below<br />
depths <str<strong>on</strong>g>of</str<strong>on</strong>g> 2134m<br />
have intruded and c<strong>on</strong>tact-<br />
marine<br />
metamorphosed a Mesozoic sequence <str<strong>on</strong>g>of</str<strong>on</strong>g> metasedimentary and metavolcanic rocks between<br />
about 900m and 2200m depth. A Tertiary volcanic<br />
secti<strong>on</strong> that overlies the pre-Tertiary rocks can be<br />
broken into a lowerr rhyolitic unit<br />
composed primarily<br />
<str<strong>on</strong>g>of</str<strong>on</strong>g> ash-flow tuffs and an upper basaltic unit known as<br />
the Chloropagus Formati<strong>on</strong>. The combined thickness<br />
<str<strong>on</strong>g>of</str<strong>on</strong>g> this volcanic package is between 760m and 920m.<br />
Overlying these volcanic rocks<br />
is a sequence <str<strong>on</strong>g>of</str<strong>on</strong>g><br />
Pliocene, lacustrinee sedimentary rocks known as the<br />
Truckee Formati<strong>on</strong>, which is up to 180m thick in the<br />
vicinity <str<strong>on</strong>g>of</str<strong>on</strong>g> the wells. Quaternary alluvium and layers<br />
<str<strong>on</strong>g>of</str<strong>on</strong>g> windblown sand<br />
cover most <str<strong>on</strong>g>of</str<strong>on</strong>g> the surface area in<br />
the immediate vicinity <str<strong>on</strong>g>of</str<strong>on</strong>g> the well-fields [12]. The<br />
mainn Desert Peak<br />
reservoir resides in pre-Tertiary<br />
rockss [10] (Figure 4).<br />
The Desert Peak geothermal field and the Northern<br />
Hot Springs Mountains lie within the NNE-trending<br />
Humboldt structural z<strong>on</strong>e, whichh is orthog<strong>on</strong>al to the<br />
extensi<strong>on</strong>al directi<strong>on</strong> <str<strong>on</strong>g>of</str<strong>on</strong>g> the Walker Lane. On a large<br />
scale, the Walker Lane is a system <str<strong>on</strong>g>of</str<strong>on</strong>g> dextral faults
that accommodates ~20% <str<strong>on</strong>g>of</str<strong>on</strong>g> the relative moti<strong>on</strong><br />
between the Pacific and North American plates [8].<br />
Figure 4: Well 27-15 WNW-trending geologic cross secti<strong>on</strong><br />
<str<strong>on</strong>g>of</str<strong>on</strong>g> the Northern Hot Spring Mountains. Unit abbreviati<strong>on</strong>s:<br />
Mzu, Mesozoic basement; Jmv, Jls, Jms, Jurassic<br />
metamorphic rocks; Trtu, Oligocene tuffs; Tdt, Trt,<br />
Oligocene ash-flow tuffs; Trdl, Oligo-Miocene rhyolite-<br />
dacite lavas; Trl, Oligo-Miocene rhyolite<br />
lavas; Tt, late<br />
Oligocene-early Miocene tuff; Ta, early to middle Miocenee<br />
andesite-dacite lavas; Ttf, middle Miocene ash-flow tuff; f;<br />
Tbo, older<br />
basalt lavas;<br />
Tbb, basaltic<br />
breccia; Td,<br />
diatomite; Ts, lacustrine sediments; Tb, basalt lavas; Qe,<br />
eolian deposits. (Figure modified from [9]).<br />
The dominant fault pattern trends about N25°E and<br />
appears to<br />
be related to<br />
Basin-and-Range tect<strong>on</strong>icc<br />
stresses. The Humboldt structural z<strong>on</strong>e may reflect<br />
both strain<br />
transfer and extensi<strong>on</strong> related to the<br />
Walker Lane [10]. The most significant fault in the<br />
area is the WNW-dipping Rhyolite Ridge fault z<strong>on</strong>e,<br />
which c<strong>on</strong>sists <str<strong>on</strong>g>of</str<strong>on</strong>g> several<br />
strands and steps to the left,<br />
in the vicinity <str<strong>on</strong>g>of</str<strong>on</strong>g> the Desert Peak geothermal field [9]<br />
(Figure 4 and Figure<br />
5). NW-trending gravity<br />
c<strong>on</strong>tours across the Desert Peak field may reflect a<br />
relay ramp<br />
[18] associated with southward-increasing<br />
displacement <strong>on</strong> the Rhyolite Ridge fault z<strong>on</strong>e [9].<br />
Kinematic data gleaned from fault surfaces indicate<br />
dip-slip normal displacement <strong>on</strong> the NNE striking<br />
faults and<br />
a WNW-trending extensi<strong>on</strong> directi<strong>on</strong>,<br />
which is compatible with: 1) regi<strong>on</strong>al extensi<strong>on</strong>n<br />
directi<strong>on</strong>s inferred from<br />
geodetic data [13]; 2)<br />
borehole tensile failure data and stress magnitudes<br />
from a mini hydraulic fracturing experiment; and 3)<br />
rock densities c<strong>on</strong>sistent with a normal faulting stresss<br />
regime from<br />
wells in the area [3][15] (Figure 5).<br />
The most productive area in the system<br />
occupies left<br />
steps in the NNE-striking, west-dipping normal fault<br />
system. Although left stepping oblique- or strike-slip<br />
faults are not required for the localizati<strong>on</strong> <str<strong>on</strong>g>of</str<strong>on</strong>g> highh<br />
permeability (i.e., interacti<strong>on</strong>s am<strong>on</strong>g<br />
normal-faults<br />
could also<br />
lead to dilatati<strong>on</strong> and locally enhanced<br />
fracture permeability in this regi<strong>on</strong>) the potential for<br />
high fracture density in this step-over<br />
regi<strong>on</strong> could<br />
enhance permeability [9]<br />
(Figure 6) and is c<strong>on</strong>sistentt<br />
with modeled slip <strong>on</strong> the Rhyolite Ridge fault [37].<br />
Figure 5: Desert Peak Geothermal Field: a c<strong>on</strong>sistent<br />
orientati<strong>on</strong> <str<strong>on</strong>g>of</str<strong>on</strong>g> S hmin iss inferred from observati<strong>on</strong>s <str<strong>on</strong>g>of</str<strong>on</strong>g><br />
tensile<br />
fractures in wells 27-15 [3] and 23-1 [31]. Producti<strong>on</strong><br />
wells are shown in orange, injectors in green, EGS well 27-<br />
15 in yellow (Figure modified from [37]). Surface trace <str<strong>on</strong>g>of</str<strong>on</strong>g><br />
the Shearing Target Fault (STF, discussed below) inferred<br />
to intersect wells 22-22 and 27-15 at depth is also shown<br />
with a blue dashed line (see explanati<strong>on</strong> below).<br />
Figure 6: Commercial permeability is encountered<br />
in the<br />
interpreted left-step <str<strong>on</strong>g>of</str<strong>on</strong>g> the Rhyolite Ridge Fault Z<strong>on</strong>e [9],<br />
wheree producti<strong>on</strong> wells are located. Black dots are shown<br />
<strong>on</strong> downthrown sidess <str<strong>on</strong>g>of</str<strong>on</strong>g> normal faults<br />
(Figure from [9]).<br />
Tracer test returnss in producti<strong>on</strong> well 74-21 from<br />
injecti<strong>on</strong> in both 21-2 and 22-22 c<strong>on</strong>firm str<strong>on</strong>g<br />
hydraulic c<strong>on</strong>nectivity in the productive area <str<strong>on</strong>g>of</str<strong>on</strong>g> the<br />
field [32] (Figuree 7). In c<strong>on</strong>trast, tracerr tests<br />
c<strong>on</strong>ducted by injecting in well 27-15 and sampling in<br />
well 74-21 show <strong>on</strong>ly modest c<strong>on</strong>necti<strong>on</strong> between<br />
27-155 and the rest <str<strong>on</strong>g>of</str<strong>on</strong>g> the reservoirr [2].
Figure 7: Hydrologic c<strong>on</strong>necti<strong>on</strong>s (i.e., flow<br />
paths) inferred<br />
in 2009 by injecting tracers in injecti<strong>on</strong> wells 22-22 and<br />
21-2 and sampling in producti<strong>on</strong> wells. Results show str<strong>on</strong>g<br />
returns to nearest producer 74-21, and slower, weaker<br />
returns to other wells. C<strong>on</strong>necti<strong>on</strong> between reservoir and<br />
22-22 occurs through base <str<strong>on</strong>g>of</str<strong>on</strong>g> Rhyolite Unit and STF<br />
(Figure from<br />
[32][7]).<br />
Like many<br />
other fields, the volume<br />
<str<strong>on</strong>g>of</str<strong>on</strong>g> hot rock<br />
surrounding the Desert Peak geothermal field is far<br />
more extensive than the volume <str<strong>on</strong>g>of</str<strong>on</strong>g> hot and permeablee<br />
rock. These circumstances have driven<br />
the need for<br />
an EGS experiment that can extend the<br />
reservoir into<br />
untapped hot rock to the<br />
north <str<strong>on</strong>g>of</str<strong>on</strong>g> the field, creating<br />
potential new injectors and increasing<br />
the residencee<br />
time <str<strong>on</strong>g>of</str<strong>on</strong>g> the<br />
fluid.<br />
Orientati<strong>on</strong>s <str<strong>on</strong>g>of</str<strong>on</strong>g> the horiz<strong>on</strong>tal principal stresses in<br />
well 27-15 were determined through analysis <str<strong>on</strong>g>of</str<strong>on</strong>g><br />
drilling-induced tensile fractures visible<br />
in both high-<br />
temperature<br />
acoustic televiewer (ABI85)<br />
and<br />
formati<strong>on</strong> micro-scannerr (FMS) logs. These drilling-<br />
induced structures indicate that the azimuth <str<strong>on</strong>g>of</str<strong>on</strong>g> the<br />
minimum horiz<strong>on</strong>tal principal stress, S hmin , is<br />
currently oriented 114 ± 17° (corresp<strong>on</strong>ding to a<br />
maximum horiz<strong>on</strong>tal principal stress <str<strong>on</strong>g>of</str<strong>on</strong>g> 024 ± 17°)<br />
[3]. Previous analysis <str<strong>on</strong>g>of</str<strong>on</strong>g> stress directi<strong>on</strong>s from<br />
borehole failure observed in well 23-1, located 2km<br />
E-SE <str<strong>on</strong>g>of</str<strong>on</strong>g> well 27-15, is in excellent agreement with<br />
stress orientati<strong>on</strong>s inferred from well 27-15 [31],<br />
suggestingg a regi<strong>on</strong>ally uniform stress field (Figure 2<br />
and Figure<br />
5).<br />
A detailed 3D analysis <str<strong>on</strong>g>of</str<strong>on</strong>g> the EGS wellsite based <strong>on</strong><br />
the geologic cross secti<strong>on</strong> and map introduced by<br />
Faulds et al., 2010 [9] (Figure 8 and Figure 10), ,<br />
suggests that EGS well 27-15 and injector well 22-222<br />
encounter the same permeable horiz<strong>on</strong> at about<br />
1400m depth, which is c<strong>on</strong>sistent with a moderatee<br />
inter-well c<strong>on</strong>necti<strong>on</strong> revealed by pressuree<br />
interference testing (Figure 9) [40] and<br />
TPS logs [3].<br />
Figure 8: Three dimensi<strong>on</strong>al geologic model <str<strong>on</strong>g>of</str<strong>on</strong>g> EGS<br />
wellsite, derived from<br />
the geologic cross secti<strong>on</strong> and map<br />
<str<strong>on</strong>g>of</str<strong>on</strong>g> Faulds et al., 20100 [9], but with lithology simplified and<br />
grouped into fewer units to facilitate<br />
c<strong>on</strong>ceptual modeling<br />
and numerical simulati<strong>on</strong>. Clustering <str<strong>on</strong>g>of</str<strong>on</strong>g> MEQs (shown<br />
from entire EGS experiment) mostly occurs within the<br />
Mesozoic and Jurassic metamorphic basement at depth.<br />
Unit abbreviati<strong>on</strong>s: J, Jurassic metamorphic basement; PT,<br />
Pre-Tertiary basement; Tr, Tertiaryry lavas and ash-flow<br />
tuffs; Bl, basalt lavas.<br />
This horiz<strong>on</strong> is thee projecti<strong>on</strong> at depth <str<strong>on</strong>g>of</str<strong>on</strong>g> <strong>on</strong>e <str<strong>on</strong>g>of</str<strong>on</strong>g> the<br />
mainn Rhyolite Ridge Fault Z<strong>on</strong>e structures mapped at<br />
the surface, the Shearing Target Fault (discussed<br />
below; see Figure 11 and Figure 5), which is also<br />
approximately parallel to S Hmax . This fault is near a<br />
densee cluster <str<strong>on</strong>g>of</str<strong>on</strong>g> MEQs associated with injecti<strong>on</strong> into<br />
well 27-15 and increases in injecti<strong>on</strong> rate thatt were<br />
occurring at about the same time into well 22-22.<br />
The temporal associati<strong>on</strong> <str<strong>on</strong>g>of</str<strong>on</strong>g> high-pressure injecti<strong>on</strong><br />
into 27-15 during the c<strong>on</strong>trolled hydr<str<strong>on</strong>g>of</str<strong>on</strong>g>rac phase and<br />
this cluster <str<strong>on</strong>g>of</str<strong>on</strong>g> seismicity suggest that the EGS<br />
stimulati<strong>on</strong> caused some <str<strong>on</strong>g>of</str<strong>on</strong>g> this seismicity. However,<br />
c<strong>on</strong>current increases in injecti<strong>on</strong> rate into well 22-22<br />
immediately beforee high-pressure injecti<strong>on</strong> makes it<br />
difficult to establish a unique causal link between<br />
mostt <str<strong>on</strong>g>of</str<strong>on</strong>g> this seismicity and the EGS stimulati<strong>on</strong>.<br />
Also, this seismicity occurs at a depth <str<strong>on</strong>g>of</str<strong>on</strong>g> 1400 to<br />
1600m, which is significantly below the interval <str<strong>on</strong>g>of</str<strong>on</strong>g><br />
fluid egress from well 27-15 at a depth <str<strong>on</strong>g>of</str<strong>on</strong>g> ~914m [2]<br />
(Figure 8). At 1400m depth, significant fluid loss<br />
associated with large-aperture fractures is observed in<br />
the deeper secti<strong>on</strong> <str<strong>on</strong>g>of</str<strong>on</strong>g> well 27-15 [3]. Also, in well 22-<br />
22, an active injecti<strong>on</strong> well located ~400m south <str<strong>on</strong>g>of</str<strong>on</strong>g><br />
27-15, major feed z<strong>on</strong>es are found at depths <str<strong>on</strong>g>of</str<strong>on</strong>g><br />
790m<br />
and 1340m.
Figure 9 – Transient testing<br />
c<strong>on</strong>ducted by altering injecti<strong>on</strong>n<br />
rates in wells 22-22 and 21-2 while observing pressuree<br />
resp<strong>on</strong>se in well 27-15. The test shows that well 27-15 is<br />
weakly but mainly c<strong>on</strong>nected with well 22-22 (Figure<br />
modified from [7]).<br />
Weak c<strong>on</strong>nectivity between wells 27-15 and 22-22 is<br />
c<strong>on</strong>firmed by transient hydraulic testing (Figure 9) )<br />
[7], and may be occurring through these deeper fluid<br />
loss/feed z<strong>on</strong>es.<br />
a cross-formati<strong>on</strong>al hydraulic c<strong>on</strong>necti<strong>on</strong> between<br />
thesee two wells (Figure 11). This<br />
structure appears to<br />
represent a preferential flow<br />
path for fluids<br />
circulating in its vicinity, in additi<strong>on</strong> to being<br />
well<br />
oriented for shear failure in the<br />
current stresss field<br />
[15] [37]. However, if this structure played a role<br />
during the EGS stimulati<strong>on</strong> as suggested by the<br />
deep seismicity observed during<br />
both the low- and<br />
high-pressurmustt have been established between the shallow<br />
stimulati<strong>on</strong> interval in well 27-15 and this deeper<br />
stimulati<strong>on</strong>s - a <str<strong>on</strong>g>hydro</str<strong>on</strong>g>logic c<strong>on</strong>necti<strong>on</strong><br />
fault z<strong>on</strong>e. Pressure transient tests (discussed above)<br />
indicate that pumping in 22-22 could also c<strong>on</strong>tribute<br />
to pressurizati<strong>on</strong><br />
<str<strong>on</strong>g>of</str<strong>on</strong>g> this structure (Figure 9),<br />
supporting the idea that injecti<strong>on</strong> rate changes into<br />
well 22-22 just prior to high-pressure (c<strong>on</strong>trolled<br />
hydraulic fracturing) stimulati<strong>on</strong> might also<br />
have<br />
c<strong>on</strong>tributed to thiss deep seismicity. The tracer tests<br />
suggest that permeability al<strong>on</strong>g this structure<br />
decreases northward <str<strong>on</strong>g>of</str<strong>on</strong>g> the injectors (Figure 7), or<br />
with increasing distance from the most productive<br />
area in the field [32].<br />
Figure 10: Lithology correlati<strong>on</strong>s between available<br />
Desert Peak<br />
geological models and simplified lithologicall<br />
grouping used for the 3D c<strong>on</strong>ceptual model <str<strong>on</strong>g>of</str<strong>on</strong>g> the wellsitee<br />
(Figure 8). Well 27-15 schematic diagram is also shown.<br />
Thus, a major NNE-SSW<br />
striking and WNW dipping<br />
segment <str<strong>on</strong>g>of</str<strong>on</strong>g> the Rhyolite Ridge Fault Z<strong>on</strong>e might<br />
extend between wells 22-22 and 27-15<br />
and establish<br />
Figure 11: C<strong>on</strong>ceptual model <str<strong>on</strong>g>of</str<strong>on</strong>g> the major fault strands <str<strong>on</strong>g>of</str<strong>on</strong>g><br />
the EGS wellsite (inferred from the geologic cross secti<strong>on</strong><br />
and map introduced by Faulds et al. , 2010 [9]). The<br />
threedepth<br />
<str<strong>on</strong>g>of</str<strong>on</strong>g><br />
dimensi<strong>on</strong>al geometry allows for visualizati<strong>on</strong> at MEQs (which occurred within the span <str<strong>on</strong>g>of</str<strong>on</strong>g> the entire EGS<br />
experiment) with respect to the structural setting. Both<br />
wells 27-15 and 22-22 encounter a highly-fractured and<br />
permeable horiz<strong>on</strong> (Shearing Target Fault “STF”) at about<br />
1400mm depth. Most <str<strong>on</strong>g>of</str<strong>on</strong>g> the MEQs recorded throughout the<br />
course <str<strong>on</strong>g>of</str<strong>on</strong>g> the EGS experiment are clustered at about<br />
1400m-1600m depth, which coincides with the approximate<br />
projecti<strong>on</strong> at depth <str<strong>on</strong>g>of</str<strong>on</strong>g>f the STF.
Based up<strong>on</strong> the deep seismicity observed, we propose<br />
that this fault segment might have played a<br />
significant role in all stages <str<strong>on</strong>g>of</str<strong>on</strong>g> the EGS stimulati<strong>on</strong>.<br />
One purpose <str<strong>on</strong>g>of</str<strong>on</strong>g> the modeling presented here is to test<br />
this hypothesis to see if it is c<strong>on</strong>sistent with known<br />
structural and stress characteristics <str<strong>on</strong>g>of</str<strong>on</strong>g> the EGS site<br />
and with the pressure resp<strong>on</strong>se observed during lowflow-rate<br />
(shear) stimulati<strong>on</strong>. For simplicity, this<br />
fault-segment will be referred to as “STF” (Shearing<br />
Target Fault) throughout the paper (Figure 11).<br />
This c<strong>on</strong>ceptual model for a deep <str<strong>on</strong>g>hydro</str<strong>on</strong>g>logic<br />
c<strong>on</strong>necti<strong>on</strong> between well 27-15 and wells to the SSW<br />
provides the basis to test potential mechanisms<br />
c<strong>on</strong>trolling permeability development during the<br />
Desert Peak EGS experiment. In particular, both the<br />
clustering <str<strong>on</strong>g>of</str<strong>on</strong>g> microseismicity (including the single<br />
event associated with shear stimulati<strong>on</strong>) and the<br />
inferred locati<strong>on</strong> <str<strong>on</strong>g>of</str<strong>on</strong>g> the STF are ~500m deeper than<br />
the open-hole secti<strong>on</strong> stimulated in well 27-15. Yet,<br />
migrati<strong>on</strong> <str<strong>on</strong>g>of</str<strong>on</strong>g> injected fluid from the formati<strong>on</strong><br />
surrounding this open-hole secti<strong>on</strong> toward the deeper<br />
STF might have been facilitated by existing welloriented<br />
fractures. In this scenario, the resulting<br />
transmissi<strong>on</strong> <str<strong>on</strong>g>of</str<strong>on</strong>g> hydraulic pressure increase within the<br />
STF is presumed to have triggered shear failure <str<strong>on</strong>g>of</str<strong>on</strong>g><br />
sufficient magnitude to result in observable MEQs,<br />
enhancing permeability and fluid pressure<br />
transmissi<strong>on</strong> al<strong>on</strong>g the STF.<br />
The single MEQ observed during the Sept 2010<br />
phase is located deeper than the main cluster <str<strong>on</strong>g>of</str<strong>on</strong>g><br />
MEQs observed throughout the entire EGS<br />
experiment (Figure 11). However, taking into<br />
account significant vertical errors <strong>on</strong> the order<br />
<str<strong>on</strong>g>of</str<strong>on</strong>g> hundreds <str<strong>on</strong>g>of</str<strong>on</strong>g> meters for this specific event, the most<br />
likely structure which generated the Sept 2010 MEQ<br />
remains the STF, which: is independently identified<br />
from geological evidence; is known to c<strong>on</strong>tain some<br />
permeability from previous hydraulic tests; and is<br />
also associated with other deep MEQ events during<br />
latter stimulati<strong>on</strong> phases.<br />
3 - TECHNICAL APPROACH<br />
We investigate whether or not the above c<strong>on</strong>ceptual<br />
model is c<strong>on</strong>sistent with observati<strong>on</strong>s made before<br />
and during the Desert Peak EGS stimulati<strong>on</strong> by<br />
applying statistical and numerical methods to<br />
ascertain: 1) the c<strong>on</strong>nectivity, attitudes, and hydraulic<br />
apertures <str<strong>on</strong>g>of</str<strong>on</strong>g> pre-existing natural fractures c<strong>on</strong>trolling<br />
fluid circulati<strong>on</strong> around the EGS stimulati<strong>on</strong> interval,<br />
and 2) the potential for initiating shear failure due to<br />
fluid over-pressurizati<strong>on</strong> that reduces effective<br />
normal stress and thus fricti<strong>on</strong>al resistance to slip<br />
within the STF. This is accomplished through a<br />
combinati<strong>on</strong> <str<strong>on</strong>g>of</str<strong>on</strong>g> discrete fracture network (DFN) and<br />
<str<strong>on</strong>g>hydro</str<strong>on</strong>g>-<str<strong>on</strong>g>mechanical</str<strong>on</strong>g> modeling techniques.<br />
3.1 - Discrete Fracture Network Modeling<br />
The study <str<strong>on</strong>g>of</str<strong>on</strong>g> fracture networks is typically restricted<br />
to small, localized sample volumes, and <str<strong>on</strong>g>of</str<strong>on</strong>g>ten<br />
simplified to 2D. These approaches can provide<br />
useful models <str<strong>on</strong>g>of</str<strong>on</strong>g> the actual fracture network,<br />
however, by deriving probabilistic descripti<strong>on</strong>s <str<strong>on</strong>g>of</str<strong>on</strong>g><br />
fracture locati<strong>on</strong>, attitude, spacing, length and<br />
aperture from borehole fracture data. The data set<br />
measured by Davatzes and Hickman, 2009 [3] from<br />
FMS and ABI85 image logs in well 27-15 is used to<br />
generate a representative statistical fracture network<br />
to simulate the corresp<strong>on</strong>ding fluid flow in the rock<br />
volume c<strong>on</strong>taining the well. This fracture populati<strong>on</strong><br />
spans the interval from 926m to 1705m, and thus<br />
extends bey<strong>on</strong>d the limited stimulated open-hole<br />
interval (916m to 1067m). This allows us to<br />
probabilistically assess the fracture populati<strong>on</strong> that<br />
extends from the stimulati<strong>on</strong> interval to the STF,<br />
which is presumed to host the <str<strong>on</strong>g>hydro</str<strong>on</strong>g>logic c<strong>on</strong>necti<strong>on</strong>.<br />
The data set c<strong>on</strong>sists <str<strong>on</strong>g>of</str<strong>on</strong>g> a total number <str<strong>on</strong>g>of</str<strong>on</strong>g> 567<br />
fractures with associated measured and true vertical<br />
depth, attitude (dip and dip directi<strong>on</strong>), apparent<br />
aperture (i.e., thickness at the borehole wall in the<br />
image logs), and a ranking <str<strong>on</strong>g>of</str<strong>on</strong>g> the reliability <str<strong>on</strong>g>of</str<strong>on</strong>g> the<br />
fracture identificati<strong>on</strong> as well as an assessment <str<strong>on</strong>g>of</str<strong>on</strong>g> the<br />
quality <str<strong>on</strong>g>of</str<strong>on</strong>g> the image log. The latter provides insight<br />
into whether variati<strong>on</strong>s in fracture density are related<br />
to changes in the fracture populati<strong>on</strong> or simply to the<br />
quality <str<strong>on</strong>g>of</str<strong>on</strong>g> the image log [3]. Fractures with<br />
immeasurably thin apparent apertures (typically the<br />
lowest quality picks), or with a
Figure 12: Lower hemisphere, equal area stereographic<br />
projecti<strong>on</strong> <str<strong>on</strong>g>of</str<strong>on</strong>g> poles to natural fractures used<br />
as input for the<br />
DFN simulati<strong>on</strong> (from analysis <str<strong>on</strong>g>of</str<strong>on</strong>g> image logs al<strong>on</strong>g the<br />
entire sampled well [3]). Fractures with negligiblee<br />
apparent aperture or with a < 45° dip angle are not shown<br />
since not c<strong>on</strong>sidered in the analysis. The identified clusterss<br />
show agreement with the observed stress field [15].<br />
The apparent apertures <str<strong>on</strong>g>of</str<strong>on</strong>g> fractures imaged in welll<br />
27-15 represent intervals<br />
<str<strong>on</strong>g>of</str<strong>on</strong>g> reduced resistivity at the<br />
borehole wall in the case<br />
<str<strong>on</strong>g>of</str<strong>on</strong>g> FMS images, and in the<br />
case <str<strong>on</strong>g>of</str<strong>on</strong>g> ABI85 images corresp<strong>on</strong>d to intervals in<br />
which the reflected acoustic pulse is<br />
scattered by<br />
irregularities in the borehole surface. Apparent<br />
aperture values range from millimeters to centimeters<br />
and are more representative <str<strong>on</strong>g>of</str<strong>on</strong>g> fault core thicknesss<br />
[35] than <str<strong>on</strong>g>mechanical</str<strong>on</strong>g> or hydraulic aperture, which are<br />
typically expected to be <strong>on</strong> the order <str<strong>on</strong>g>of</str<strong>on</strong>g> micr<strong>on</strong>s [22]<br />
[4]. Given<br />
the limitati<strong>on</strong><br />
<str<strong>on</strong>g>of</str<strong>on</strong>g> image logs to directly<br />
measure hydraulic aperture, we adopt a scaling<br />
approach that combines the total number <str<strong>on</strong>g>of</str<strong>on</strong>g> flowing<br />
fractures identified by temperature/spinner anomalies<br />
[3] with the permeability-thickness value measured<br />
during <str<strong>on</strong>g>hydro</str<strong>on</strong>g>logic tests to estimate the hydraulic<br />
fracture aperture [28].<br />
Temperature/spinner anomalies show evidence <str<strong>on</strong>g>of</str<strong>on</strong>g> 28<br />
flowing fractures al<strong>on</strong>g the entire sampled length<br />
(778m), 8 <str<strong>on</strong>g>of</str<strong>on</strong>g> which are al<strong>on</strong>g the stimulated open-<br />
hole secti<strong>on</strong> <str<strong>on</strong>g>of</str<strong>on</strong>g> the well (152m) [3]. Al<strong>on</strong>g the same<br />
open-hole secti<strong>on</strong>, a permeability-thickness <str<strong>on</strong>g>of</str<strong>on</strong>g> 60<br />
mD-ft was determined [36], yielding an averagee<br />
permeability <str<strong>on</strong>g>of</str<strong>on</strong>g> 1.2e-16 m 2 , a hydraulic c<strong>on</strong>ductivity<br />
<str<strong>on</strong>g>of</str<strong>on</strong>g> 4.7e-09 m/s (using reservoir fluid properties for a<br />
measured temperature <str<strong>on</strong>g>of</str<strong>on</strong>g> 120°C: fluid density<br />
ρ=948.7 kg/m3, fluid viscosity μ=2.35e-04 Pa-s) and<br />
a corresp<strong>on</strong>ding average transmissivity <str<strong>on</strong>g>of</str<strong>on</strong>g> 7.1e-077<br />
m 2 /s. C<strong>on</strong>sidering 8 flowing fractures al<strong>on</strong>g the<br />
current open-hole secti<strong>on</strong><br />
<str<strong>on</strong>g>of</str<strong>on</strong>g> the well, the equivalent<br />
average transmissivity<br />
T per flowing fracture<br />
becomes 8.9e-08 m 2 /s. By applying the cubic law, b<br />
= (12μT/ρg) 1/3 , the mean hydraulic aperture b is<br />
therefore 30μm.<br />
Borehole data is also limited by the inability to<br />
directly measure fracture length,<br />
which is critical to<br />
assessing the c<strong>on</strong>nectivity <str<strong>on</strong>g>of</str<strong>on</strong>g> fracture networks. In the<br />
absence <str<strong>on</strong>g>of</str<strong>on</strong>g> reliablee data relating<br />
fracture length to<br />
either <str<strong>on</strong>g>mechanical</str<strong>on</strong>g> aperture for<br />
tensile (Mode I)<br />
fractures or slip for shear (Modes II, III) fractures<br />
[33], fracture length is assumed to be distributed<br />
according to a power-law: 1 , where<br />
the power-law exp<strong>on</strong>ent a typically ranges from<br />
1 to<br />
3 in naturally-fractured rock masses (e.g., [1]<br />
[30])<br />
and C is related to<br />
the minimumm fracture length. A<br />
power-law exp<strong>on</strong>ent <str<strong>on</strong>g>of</str<strong>on</strong>g> a=2, corresp<strong>on</strong>ding<br />
to the<br />
approximate<br />
average <str<strong>on</strong>g>of</str<strong>on</strong>g> power-law<br />
exp<strong>on</strong>ents<br />
measured in the field [30] was selected to represent<br />
fracture length in the DFN model. Fracture networks<br />
with a=2 c<strong>on</strong>sist <str<strong>on</strong>g>of</str<strong>on</strong>g>f an approximately even mixture <str<strong>on</strong>g>of</str<strong>on</strong>g><br />
shortt and l<strong>on</strong>g fractures [6][14][26][27].<br />
The<br />
resulting fracture lengths are then scaled to the<br />
fracture heights using a relati<strong>on</strong>ship defined for<br />
normal faults in layered sequences [23]: H <br />
, .<br />
where H and L are the fault height and length,<br />
respectively.<br />
From<br />
the fracture analysis described above, a three-<br />
are seeded as: 1) fracture locati<strong>on</strong><br />
via a random<br />
point<br />
dimensi<strong>on</strong>al DFN is reproduced [29] where fractures<br />
process, 2) orientati<strong>on</strong> via a Fisher distributi<strong>on</strong><br />
c<strong>on</strong>sistent with prior probabilities for each set, 3)<br />
fracture lengths by<br />
input <str<strong>on</strong>g>of</str<strong>on</strong>g> the a=2 value through a<br />
Pareto distributi<strong>on</strong> truncated to censor extreme values<br />
greater than 200 m; ; and 4) a lognormal distributi<strong>on</strong> <str<strong>on</strong>g>of</str<strong>on</strong>g><br />
fracture transmissivity. The 3D<br />
DFNs are<br />
then<br />
projected <strong>on</strong>to 3 planes (orthog<strong>on</strong>al to each other)<br />
aligned with the Cartesian coordinate system for<br />
computati<strong>on</strong><br />
<str<strong>on</strong>g>of</str<strong>on</strong>g> the c<strong>on</strong>ductivity<br />
tensor. The<br />
lognormal distributi<strong>on</strong> <str<strong>on</strong>g>of</str<strong>on</strong>g> fracture transmissivity is<br />
derived from fracture aperture as<br />
follows. Only 8 <str<strong>on</strong>g>of</str<strong>on</strong>g><br />
261 fractures (~3%) were found<br />
to be significantly<br />
c<strong>on</strong>ductive, which we define as<br />
having a hydraulic<br />
aperture greater than 100μm from the well-test<br />
analysis presented<br />
above. Using a mean fracture<br />
aperture <str<strong>on</strong>g>of</str<strong>on</strong>g> 30μm derived from<br />
the well hydraulic<br />
test, fracture variance<br />
is changed so that<br />
approximately 3% <str<strong>on</strong>g>of</str<strong>on</strong>g> the fractures have an aperture<br />
greater than 100μm. The upper and lower bounds <str<strong>on</strong>g>of</str<strong>on</strong>g><br />
the distributi<strong>on</strong> are then censored to avoid<br />
<str<strong>on</strong>g>computati<strong>on</strong>al</str<strong>on</strong>g> problems with apertures being too<br />
smalll (< 2μm) and<br />
to retain realism by not allowing<br />
apertures to be unreas<strong>on</strong>ably large (>500μm). This<br />
censoring affects less than 1%<br />
<str<strong>on</strong>g>of</str<strong>on</strong>g> all generated<br />
aperture values.<br />
In order to compute a permeability tensor<br />
representative <str<strong>on</strong>g>of</str<strong>on</strong>g> the background natural fracture<br />
populati<strong>on</strong>, a 3D DFN was first<br />
generated until the<br />
fracture frequency <str<strong>on</strong>g>of</str<strong>on</strong>g> 0.3 fractures per meter derived<br />
from<br />
image log analysis was achieved within the<br />
DFN<br />
200m × 200m<br />
× 200m domain (computed<br />
al<strong>on</strong>g
multiple scan lines), followed by projecti<strong>on</strong> <str<strong>on</strong>g>of</str<strong>on</strong>g> these<br />
fractures <strong>on</strong>to three 200m × 200m orthog<strong>on</strong>al planes<br />
aligned with the Cartesian coordinate system: x-y, y-<br />
z, x-z. Discrete fracture networks are analyzed for<br />
intersecti<strong>on</strong> with three fracture types: all fractures,<br />
hydraulic backb<strong>on</strong>e fractures, and dominant fractures.<br />
"All fractures" refer to all fractures present in a rock<br />
mass, whereas "hydraulic backb<strong>on</strong>e" fractures refer<br />
<strong>on</strong>ly to the interc<strong>on</strong>nected fractures <str<strong>on</strong>g>of</str<strong>on</strong>g> the hydraulic<br />
backb<strong>on</strong>e. The fracture backb<strong>on</strong>e is thus computed<br />
for each Cartesian plane by eliminating dead-end<br />
segments and isolated clusters, as these cannot<br />
c<strong>on</strong>tribute to transmissivity. Two c<strong>on</strong>figurati<strong>on</strong>s <str<strong>on</strong>g>of</str<strong>on</strong>g><br />
linearly decreasing head c<strong>on</strong>diti<strong>on</strong>s are applied to<br />
compute each permeability tensor comp<strong>on</strong>ent, and<br />
flow is then solved iteratively via a bic<strong>on</strong>jugate<br />
gradient method under specific boundary c<strong>on</strong>diti<strong>on</strong>s<br />
at all internal nodes according to Darcy’s law<br />
[5][17][25][28][24].<br />
3.2 – FLAC 3D Fluid-Mechanical Resp<strong>on</strong>se Model<br />
The c<strong>on</strong>ceptual model is tested against the September<br />
13 to 23, 2010, low-flow-rate injecti<strong>on</strong> phase (Figure<br />
1) by numerical simulati<strong>on</strong> with the <str<strong>on</strong>g>mechanical</str<strong>on</strong>g>-flow<br />
code FLAC 3D .<br />
FLAC 3D is a three-dimensi<strong>on</strong>al explicit finitedifference<br />
program for c<strong>on</strong>tinuum mechanics<br />
computati<strong>on</strong> which also models fluid flow and its<br />
corresp<strong>on</strong>ding poro<str<strong>on</strong>g>mechanical</str<strong>on</strong>g> <str<strong>on</strong>g>effects</str<strong>on</strong>g>. [11]<br />
This simulati<strong>on</strong> c<strong>on</strong>sists <str<strong>on</strong>g>of</str<strong>on</strong>g> two successive stages: (1)<br />
hydraulic-<strong>on</strong>ly computati<strong>on</strong> <str<strong>on</strong>g>of</str<strong>on</strong>g> pressure gradients<br />
generated between the STF and the stimulati<strong>on</strong><br />
interval during fluid injecti<strong>on</strong>, and (2) a <str<strong>on</strong>g>hydro</str<strong>on</strong>g><str<strong>on</strong>g>mechanical</str<strong>on</strong>g>ly<br />
coupled calculati<strong>on</strong> to estimate the<br />
<str<strong>on</strong>g>mechanical</str<strong>on</strong>g> deformati<strong>on</strong> in resp<strong>on</strong>se to increased<br />
hydraulic pressure within the STF, where changes in<br />
pore pressure generate deformati<strong>on</strong>, and volumetric<br />
strain causes pore pressures to evolve.<br />
As menti<strong>on</strong>ed above, the simpler characteristics <str<strong>on</strong>g>of</str<strong>on</strong>g><br />
the September 2010 phase make it a perfect candidate<br />
for model verificati<strong>on</strong> and calibrati<strong>on</strong> for subsequent<br />
simulati<strong>on</strong> <str<strong>on</strong>g>of</str<strong>on</strong>g> more complex injecti<strong>on</strong> phases, given<br />
that: a) injecti<strong>on</strong> during the Sept 2010 phase occurs at<br />
pressures below S hmin ; and b) the injecti<strong>on</strong> rate climbs<br />
immediately after detecti<strong>on</strong> <str<strong>on</strong>g>of</str<strong>on</strong>g> a single, yet<br />
potentially significant, MEQ event. This suggests the<br />
process triggering the MEQ event plays a primary<br />
role in transmissivity development during this phase.<br />
The timing at which this single MEQ occurred<br />
represents a perfect reference for model calibrati<strong>on</strong> as<br />
it defines the diffusi<strong>on</strong> time required by the hydraulic<br />
pressure to build-up to a value critical for triggering<br />
<str<strong>on</strong>g>mechanical</str<strong>on</strong>g> deformati<strong>on</strong> (i.e. shear failure) in the<br />
rockmass. Therefore, we tune the model <str<strong>on</strong>g>of</str<strong>on</strong>g> pressure<br />
diffusi<strong>on</strong> through the fracture network between the<br />
open-hole interval in 27-15 and the locati<strong>on</strong> <str<strong>on</strong>g>of</str<strong>on</strong>g> the<br />
MEQ, presumed to be <strong>on</strong> the STF, to determine the<br />
model parameters/c<strong>on</strong>diti<strong>on</strong>s necessary to cause an<br />
MEQ 4 days after initiati<strong>on</strong> <str<strong>on</strong>g>of</str<strong>on</strong>g> injecti<strong>on</strong> into 27-15 at<br />
WHP fluid pressures <str<strong>on</strong>g>of</str<strong>on</strong>g> ~3.2MPa. In this case,<br />
pressure sufficient to reduce effective normal stress<br />
must be communicated to the STF in order to satisfy<br />
the c<strong>on</strong>diti<strong>on</strong>s for Mohr-Coulomb failure. The 27-15<br />
Sept 2010 low-flow-rate injecti<strong>on</strong> is used to verify<br />
these c<strong>on</strong>diti<strong>on</strong>s.<br />
As introduced above, injecti<strong>on</strong> into 27-15 is not the<br />
<strong>on</strong>ly source <str<strong>on</strong>g>of</str<strong>on</strong>g> pressure perturbati<strong>on</strong> in the studied<br />
area. Injecti<strong>on</strong> into 22-22 has also a potential<br />
c<strong>on</strong>necti<strong>on</strong> to this volume, and flow was varied into<br />
this well during the EGS experiment. However,<br />
during the Sept 2010 low-flow-rate phase, fluid from<br />
22-22 was transferred to 27-15, and thus injecti<strong>on</strong> in<br />
22-22 c<strong>on</strong>sisted <str<strong>on</strong>g>of</str<strong>on</strong>g> about half the rate injected in 27-<br />
15, at approximately four times less than the 27-15<br />
injecti<strong>on</strong> pressure.<br />
In additi<strong>on</strong>, this MEQ occurring approximately 4<br />
days after initiati<strong>on</strong> <str<strong>on</strong>g>of</str<strong>on</strong>g> injecti<strong>on</strong> is a good reference<br />
when calibrating the model, as it represents the time<br />
over which the hydraulic pressure diffusi<strong>on</strong> process<br />
builds up and triggers the shear mechanism. The 27-<br />
15 low-flow-rate phase allows for a sensitive and<br />
accurate calibrati<strong>on</strong> <str<strong>on</strong>g>of</str<strong>on</strong>g> the pressure gradient<br />
throughout the STF z<strong>on</strong>e. Finally, influence from<br />
injecti<strong>on</strong> operati<strong>on</strong>s in well 22-22 is limited during<br />
this phase, c<strong>on</strong>sisting <str<strong>on</strong>g>of</str<strong>on</strong>g> about half the rate injected in<br />
27-15, at approximately four times less than the<br />
injecti<strong>on</strong> pressure.<br />
For both simulati<strong>on</strong>s, and as a general rule, the<br />
simplest possible geometry opti<strong>on</strong> is used to define<br />
the FLAC 3D model, c<strong>on</strong>sistent with the reproducti<strong>on</strong><br />
<str<strong>on</strong>g>of</str<strong>on</strong>g> key physical processes. In the simplified<br />
representati<strong>on</strong> <str<strong>on</strong>g>of</str<strong>on</strong>g> the wellsite, the model comprises a<br />
low permeability background formati<strong>on</strong>, two<br />
injecti<strong>on</strong> points (wells 27-15 and 22-22) and a NNEstriking<br />
fault z<strong>on</strong>e (STF) about 100m thick, dipping<br />
70° WNW and located about 500m below the actual<br />
27-15 injecti<strong>on</strong> point. The model domain extends for<br />
3000m in the x-directi<strong>on</strong>, 700m in the y-directi<strong>on</strong> and<br />
2600m in the z-directi<strong>on</strong>. The grid is discretized into<br />
regular cubic z<strong>on</strong>es 100m <strong>on</strong> a side. The STF - like<br />
the rest <str<strong>on</strong>g>of</str<strong>on</strong>g> the model - is currently assumed to be a<br />
fluid-saturated single-porosity media. Later modeling<br />
exercises involving coupling with TOUGHREACT<br />
may adopt a dual-porosity c<strong>on</strong>ceptualizati<strong>on</strong>.<br />
A phreatic surface is initialized at 118m depth, below<br />
which pore pressures have a c<strong>on</strong>stant gradient <strong>on</strong>ce<br />
the initial force-equilibrium state is reached. (in<br />
FLAC 3D , force-equilibrium is assumed when the<br />
maximum unbalanced force and velocity vectors at<br />
each gridpoint are small compared to the<br />
representative z<strong>on</strong>e forces in the problem). Realistic
hydraulic c<strong>on</strong>diti<strong>on</strong>s typical <str<strong>on</strong>g>of</str<strong>on</strong>g> a fractured reservoir<br />
are represented in the model by anisotropic<br />
permeability. For numerical purposes, the lithological<br />
units described in Secti<strong>on</strong> 2 are grouped into rock<br />
types (a) through (c) as: a) corresp<strong>on</strong>ding to both the<br />
basement and the rhyolite units and representing the<br />
background rock mass; b) simulating the rock<br />
behavior in the vicinity <str<strong>on</strong>g>of</str<strong>on</strong>g> the open-hole secti<strong>on</strong> <str<strong>on</strong>g>of</str<strong>on</strong>g><br />
the well, and c) representing the STF.<br />
The permeability assigned to the formati<strong>on</strong><br />
surrounding well 27-15 in the FLAC 3D model is<br />
guided by the DFN equivalent permeability tensors<br />
computed from site-specific fracture attributes. A<br />
higher vertical permeability (k z ) is used to simulate<br />
an assumed vertical c<strong>on</strong>necti<strong>on</strong> between the openhole<br />
interval <str<strong>on</strong>g>of</str<strong>on</strong>g> 27-15 and the underlying STF (rock<br />
type b). The highest permeability values are assigned<br />
to the STF, within which both the vertical and<br />
horiz<strong>on</strong>tal tensors vary according to a prescribed<br />
gradient between well 27-15 (STF north end) and<br />
well 22-22 (STF south end) (Table 3). The STF<br />
permeability gradient is being assigned and adjusted<br />
by calibrati<strong>on</strong> against: 1) instantaneous downhole<br />
pressure in well 27-15 and 2) pressure transient<br />
testing carried out between wells 27-15 and 22-22.<br />
The low background permeability <str<strong>on</strong>g>of</str<strong>on</strong>g> the formati<strong>on</strong><br />
guarantees that fluid flows preferentially through the<br />
SFT and eventually exits the model to the south,<br />
toward the productive area <str<strong>on</strong>g>of</str<strong>on</strong>g> the field. The model is<br />
set by using permeable boundary c<strong>on</strong>diti<strong>on</strong>s (i.e., the<br />
pressure is set to remain c<strong>on</strong>stant at the boundaries <str<strong>on</strong>g>of</str<strong>on</strong>g><br />
the model after the initial equilibrated pressure is<br />
reached). Velocity and displacements are fixed at the<br />
bottom and sides <str<strong>on</strong>g>of</str<strong>on</strong>g> the model (i.e., no velocity or<br />
displacement is allowed at the selected gridpoints).<br />
C<strong>on</strong>sistent with the normal faulting regime observed<br />
in the field and using the measured magnitude <str<strong>on</strong>g>of</str<strong>on</strong>g><br />
S hmin [15], xx, zz and yy stress comp<strong>on</strong>ents vary with<br />
depth following the relati<strong>on</strong>s between S hmin , S Hmax and<br />
S v (vertical overburden): S Hmax = (S hmin + S v )/2 [15].<br />
A Mohr-Coulomb plasticity c<strong>on</strong>stitutive model is<br />
used in FLAC 3D to properly represent the <strong>on</strong>set <str<strong>on</strong>g>of</str<strong>on</strong>g><br />
shear (fricti<strong>on</strong>al) failure. The failure envelope for this<br />
c<strong>on</strong>stitutive model corresp<strong>on</strong>ds to a Mohr-Coulomb<br />
criteri<strong>on</strong> (shear yield functi<strong>on</strong> with tensi<strong>on</strong> cut<str<strong>on</strong>g>of</str<strong>on</strong>g>f)<br />
which is expressed in terms <str<strong>on</strong>g>of</str<strong>on</strong>g> principal stresses σ 1 ,<br />
σ 2 and σ 3 . For the Mohr-Coulomb plasticity model,<br />
the required properties defined for each material are:<br />
1) bulk and shear moduli; 2) fricti<strong>on</strong> and dilati<strong>on</strong><br />
angles; 3) cohesi<strong>on</strong>; and 4) tensile strength. The<br />
c<strong>on</strong>stitutive behavior and associated material<br />
properties dictate the type <str<strong>on</strong>g>of</str<strong>on</strong>g> resp<strong>on</strong>se the model will<br />
display up<strong>on</strong> disturbance by the injected fluid [11].<br />
Mechanical parameters used in the model are derived<br />
from rock <str<strong>on</strong>g>mechanical</str<strong>on</strong>g> tests c<strong>on</strong>ducted <strong>on</strong> selected<br />
core samples representative <str<strong>on</strong>g>of</str<strong>on</strong>g> the stimulati<strong>on</strong><br />
interval in well 27-15 [20]. Mechanical properties for<br />
the Rhyolitic and Metamorphic Basement Units are<br />
averaged and assigned to rock types a, b and c. A<br />
lower fricti<strong>on</strong> angle <str<strong>on</strong>g>of</str<strong>on</strong>g> 22° is used for rock type c<br />
(Table 2). The latter is also set with zero cohesi<strong>on</strong>, as<br />
in-situ stress measurements in a variety <str<strong>on</strong>g>of</str<strong>on</strong>g><br />
tect<strong>on</strong>ically-active geologic settings suggest that<br />
fracture planes well oriented with respect to the stress<br />
field are generally cohesi<strong>on</strong>less [14][39].<br />
Table 2: Mechanical properties used in the FLAC 3D <str<strong>on</strong>g>hydro</str<strong>on</strong>g><str<strong>on</strong>g>mechanical</str<strong>on</strong>g><br />
model.<br />
Rock type a, b Rock type c<br />
Density [g/cm 3 ] 2.5 2.5<br />
Shear Modulus [MPa] 1.0E+04 1.0E+04<br />
Bulk Modulus [MPa] 1.7E+04 1.7E+04<br />
Fricti<strong>on</strong> angle [°] 39.1 21.0<br />
Cohesi<strong>on</strong> [MPa] 20.6 0<br />
Tensile strength [MPa] 1.0E+04 1.0E+04<br />
Boundary and initial c<strong>on</strong>diti<strong>on</strong>s define the in-situ<br />
state (i.e., the c<strong>on</strong>diti<strong>on</strong> before a change or<br />
disturbance is introduced by injecti<strong>on</strong>). After these<br />
c<strong>on</strong>diti<strong>on</strong>s are defined in FLAC 3D and the initial<br />
equilibrium state is calculated for the model, an<br />
alterati<strong>on</strong> is made (e.g., a change in pore pressure at<br />
selected points), and the resulting model resp<strong>on</strong>se is<br />
computed. For both hydraulic-<strong>on</strong>ly and <str<strong>on</strong>g>hydro</str<strong>on</strong>g><str<strong>on</strong>g>mechanical</str<strong>on</strong>g><br />
simulati<strong>on</strong>s, a prescribed volumetric<br />
inflow <str<strong>on</strong>g>of</str<strong>on</strong>g> fluid varying with time is assigned to define<br />
the principal fluid sources in the model (wells 27-15<br />
and 22-22).<br />
Table 3: Anisotropic permeabilities used in FLAC 3D .<br />
kx [m 2 ] ky [m 2 ] kz [m 2 ] Porosity ϕ<br />
Rock type a 1.4e-16 1.4e-16 7.2e-18 0.01<br />
Rock type b 1.9e-17 1.9e-17 7.0e-17 0.01<br />
Rock type c<br />
(27-15 end)<br />
7.0e-18 1.0e-17 1.9e-14 0.01<br />
Rock type c<br />
(22-22 end)<br />
7.0e-16 2.3e-14 9.4e-17 0.01<br />
An average volumetric flow rate <str<strong>on</strong>g>of</str<strong>on</strong>g> 5e-5m 3 /s is<br />
applied to the gridpoints corresp<strong>on</strong>ding to the openhole<br />
secti<strong>on</strong> in well 27-15. At the same time, an<br />
average volumetric flow rate <str<strong>on</strong>g>of</str<strong>on</strong>g> 2.5e-5m 3 /s is applied<br />
to the gridpoints corresp<strong>on</strong>ding to the two feed z<strong>on</strong>es<br />
in well 22-22: 60% <str<strong>on</strong>g>of</str<strong>on</strong>g> the injected fluid is prescribed<br />
to the deep feed z<strong>on</strong>e (basement), while the<br />
remaining 40% is applied to the shallower feed z<strong>on</strong>e<br />
(rhyolite), which is c<strong>on</strong>sistent with temperaturepressure-flowmeter<br />
logs run in this well.
4 - RESULTS<br />
4.1 Discrete Fracture Network Modeling<br />
Figure 13a provides a 3D representati<strong>on</strong> <str<strong>on</strong>g>of</str<strong>on</strong>g> the<br />
discrete fracture network generated using the<br />
procedure described above from the<br />
site-specificc<br />
statistics in<br />
well 27-15. The 3D DFNs<br />
are projected<br />
<strong>on</strong>to planes aligned with the Cartesian coordinate<br />
system for<br />
computati<strong>on</strong> <str<strong>on</strong>g>of</str<strong>on</strong>g> the c<strong>on</strong>ductivity tensor.<br />
2D illustrati<strong>on</strong> <str<strong>on</strong>g>of</str<strong>on</strong>g> the relative c<strong>on</strong>tributi<strong>on</strong> to flow<br />
am<strong>on</strong>g fractures <strong>on</strong> the x-z plane is shown in Figure<br />
13b. The DFN correctly reproduces<br />
the regi<strong>on</strong>al<br />
structural trends observed at the field scale from<br />
surface mapping, the fracture attitudes from boreholee<br />
observati<strong>on</strong>s, as well as the density <str<strong>on</strong>g>of</str<strong>on</strong>g><br />
hydraulically-<br />
c<strong>on</strong>ductive<br />
fractures (i.e.. 4/100m) identified from TS<br />
anomalies in the boreholee log data [9]. Geometric and<br />
flow techniques eliminate dead-end segments or<br />
isolated clusters, and identify the hydraulic backb<strong>on</strong>e<br />
representing the interc<strong>on</strong>nected subset <str<strong>on</strong>g>of</str<strong>on</strong>g> fractures<br />
resp<strong>on</strong>siblee for c<strong>on</strong>ducting flow across the model<br />
[26][27]. By computing hydraulic c<strong>on</strong>ductivity from<br />
fracture apertures according to the cubic law for each<br />
principal directi<strong>on</strong> (x, y and z), a total <str<strong>on</strong>g>of</str<strong>on</strong>g> 40<br />
simulati<strong>on</strong>s <str<strong>on</strong>g>of</str<strong>on</strong>g> fluid flow<br />
through the generated DFN<br />
provide the following<br />
horiz<strong>on</strong>tal (k x =east-west,<br />
k y =north-south) and vertical (k z ) average equivalent<br />
permeabilities comprising the permeability tensor<br />
k x =2.50-17m 2 , k y =1.83e-16m 2 2<br />
, k z =6.16e-17m respectively for the volume c<strong>on</strong>taining well 27-15.<br />
The resulting permeability magnitude k is equal to<br />
1.94e-16 m 2 . Despite the lack <str<strong>on</strong>g>of</str<strong>on</strong>g> calibrati<strong>on</strong> <str<strong>on</strong>g>of</str<strong>on</strong>g> the<br />
DFN simulati<strong>on</strong>s to the<br />
measured permeability to<br />
date (i.e., <strong>on</strong>ly the permeability distributi<strong>on</strong> is<br />
c<strong>on</strong>diti<strong>on</strong>ed to general observati<strong>on</strong>s from hydraulic<br />
testing), the results are in very good agreement with<br />
the <strong>on</strong>-site<br />
measured permeability <str<strong>on</strong>g>of</str<strong>on</strong>g> 1.2e-16 m 2 for<br />
the formati<strong>on</strong> surrounding the open-hole secti<strong>on</strong> <str<strong>on</strong>g>of</str<strong>on</strong>g><br />
the well [36].<br />
The results emphasize preferential flow through ky<br />
and k z relative to k x , in accordance with the trends <str<strong>on</strong>g>of</str<strong>on</strong>g><br />
the major structural features. The existing natural<br />
fracture network supports vertical fluid flow and<br />
represents a preferential pathway through whichh<br />
injected fluids can reach greater depths.<br />
Figure 13: a) Site representative 3D<br />
fault network mapped<br />
<strong>on</strong>to three orthog<strong>on</strong>al planes <str<strong>on</strong>g>of</str<strong>on</strong>g> a Cartesian coordinate<br />
systemm al<strong>on</strong>g with b) fault network projected <strong>on</strong>to x-z<br />
plane<br />
with line thickness<br />
proporti<strong>on</strong>al to flow. Only<br />
interc<strong>on</strong>nected fault segments <str<strong>on</strong>g>of</str<strong>on</strong>g> the hydraulic backb<strong>on</strong>e<br />
are shown. Note thatt the frequency <str<strong>on</strong>g>of</str<strong>on</strong>g> higher permeability<br />
fractures is c<strong>on</strong>sistent with that encountered in welll 27-15<br />
(i.e., approximately 7 fractures over a 200 m vertical<br />
length).<br />
4.2 FLAC 3D Modeling<br />
In the first set <str<strong>on</strong>g>of</str<strong>on</strong>g> simple models, <strong>on</strong>ly fluid diffusi<strong>on</strong><br />
al<strong>on</strong>gg fractures in a rigid rock mass was c<strong>on</strong>sidered.<br />
The <str<strong>on</strong>g>computati<strong>on</strong>al</str<strong>on</strong>g>ly-simpler hydraulic-<strong>on</strong>ly<br />
model<br />
was necessary in the first stage to estimatee if a<br />
pressure gradient/ /incremental could be generated<br />
between the STF and the stimulati<strong>on</strong> interval under<br />
the Sept 2010 injecti<strong>on</strong> phase c<strong>on</strong>diti<strong>on</strong>s. The<br />
resulting computed<br />
pressure incremental was<br />
then<br />
analytically tested against a Mohr-Coulomb analysis<br />
to verify if the resulting pressure incremental could<br />
satisfy c<strong>on</strong>diti<strong>on</strong>s for shear failure <strong>on</strong> well-oriented<br />
sets <str<strong>on</strong>g>of</str<strong>on</strong>g> fractures.<br />
Under the prescribed c<strong>on</strong>diti<strong>on</strong>s, the FLAC 3D<br />
hydraulic-<strong>on</strong>ly (no deformati<strong>on</strong> in a rigid rock mass)<br />
simulati<strong>on</strong> shows that fluid diffusi<strong>on</strong> throughout the
STF generates a maximum pressure increase <str<strong>on</strong>g>of</str<strong>on</strong>g> ~1.8<br />
MPa within the STF after about 4 days <str<strong>on</strong>g>of</str<strong>on</strong>g> injecti<strong>on</strong>n<br />
(Figure 14).<br />
Figure 14: The Sept 2010 low-flow-rate<br />
EGS injecti<strong>on</strong>n<br />
phase is simulated in a FLAC 3D hydraulic-<strong>on</strong>ly <str<strong>on</strong>g>of</str<strong>on</strong>g> fluid (5e-5m 3 /s) at the<br />
injecti<strong>on</strong> gridpoint (closest point to the casing shoe <str<strong>on</strong>g>of</str<strong>on</strong>g> the<br />
well) during<br />
the EGS stimulati<strong>on</strong>. Fluid diffusi<strong>on</strong> throughh<br />
natural fracture networks from the injecti<strong>on</strong> point toward<br />
greater depths increases the<br />
pore pressure within the more<br />
permeable STF. Maximum pressure increase (i.e delta P)<br />
simulated within the STF is 1.80 analysis by<br />
applying c<strong>on</strong>stant injecti<strong>on</strong><br />
MPa.<br />
Figure 16: FLAC 3D simulated downhole pressure against<br />
downhole pressure resp<strong>on</strong>se observed in well 27-15 during<br />
the Sept 2010 low-flow-rate EGS injecti<strong>on</strong> phase.<br />
The timing required by the DHP to reach a steady<br />
valuee (instantaneous timing pressure resp<strong>on</strong>se) as<br />
well as the maximum pressure, provide<br />
key<br />
informati<strong>on</strong> <strong>on</strong> thee transmissivity <str<strong>on</strong>g>of</str<strong>on</strong>g> the formati<strong>on</strong><br />
surrounding the open secti<strong>on</strong> <str<strong>on</strong>g>of</str<strong>on</strong>g> the well. The<br />
instantaneous downhole pressuree resp<strong>on</strong>se measured<br />
in 27-15 during thee injecti<strong>on</strong> test is simulated through<br />
inverse modeling exercises and variati<strong>on</strong> <str<strong>on</strong>g>of</str<strong>on</strong>g> the<br />
formati<strong>on</strong> permeability, until a good approximati<strong>on</strong> is<br />
reached. This is a promising sign that the correct<br />
calibrati<strong>on</strong> <str<strong>on</strong>g>of</str<strong>on</strong>g> the FLAC 3D model has been achieved<br />
(Figure 16). The FLAC 3D <str<strong>on</strong>g>hydro</str<strong>on</strong>g>-<str<strong>on</strong>g>mechanical</str<strong>on</strong>g> failure within the STF<br />
after<br />
coupled<br />
analysis predicts shear<br />
about 4 days <str<strong>on</strong>g>of</str<strong>on</strong>g> injecti<strong>on</strong> into the<br />
stimulati<strong>on</strong> z<strong>on</strong>e <str<strong>on</strong>g>of</str<strong>on</strong>g><br />
well 27-15. This failure is manifest as a c<strong>on</strong>tiguous<br />
line <str<strong>on</strong>g>of</str<strong>on</strong>g> active shearing z<strong>on</strong>es in<br />
which the stresses<br />
satisfy the yield criteri<strong>on</strong>, denoting that fricti<strong>on</strong>al<br />
failure is occurring<br />
over a z<strong>on</strong>e that is el<strong>on</strong>gated in<br />
the down-dip directi<strong>on</strong> (Figure 17).<br />
Figure 15 - Normal-stresss regime Mohr circles showing<br />
shear and effective normal stress at 1600m<br />
depth (locati<strong>on</strong><br />
<str<strong>on</strong>g>of</str<strong>on</strong>g> MEQs and STF) under: 1) <str<strong>on</strong>g>hydro</str<strong>on</strong>g>static c<strong>on</strong>diti<strong>on</strong>s definedd<br />
by groundwater level at 118m depth (blue<br />
circle) and 2)<br />
hydraulic pressure generated al<strong>on</strong>g the STF<br />
after 4 days <str<strong>on</strong>g>of</str<strong>on</strong>g><br />
fluid injecti<strong>on</strong> in 27-15 (red<br />
circle), using pressure increasee<br />
derived from the FLAC 3D hydraulic model (Figure 14). .<br />
Fricti<strong>on</strong>al failure lines are based <strong>on</strong> the coefficient <str<strong>on</strong>g>of</str<strong>on</strong>g><br />
sliding fricti<strong>on</strong> derived from laboratory testing <str<strong>on</strong>g>of</str<strong>on</strong>g> rock<br />
samples from surrounding<br />
geologic units [20]. In-situ<br />
natural and<br />
cohesi<strong>on</strong>less fractures are well-oriented and<br />
critically stressed for shear failure under<br />
the Sept 20100<br />
low-flow-rate phase hydraulically-induced c<strong>on</strong>diti<strong>on</strong>s.<br />
A Mohr-Coulommaximum<br />
pressure increase within the STF is<br />
sufficient to generate shear failure in well-oriented,<br />
cohesi<strong>on</strong>less fractures (Figure analysis<br />
suggests that this<br />
15).<br />
Figure 17: FLAC 3D coupled <str<strong>on</strong>g>hydro</str<strong>on</strong>g>-<str<strong>on</strong>g>mechanical</str<strong>on</strong>g> simulati<strong>on</strong><br />
<str<strong>on</strong>g>of</str<strong>on</strong>g> <str<strong>on</strong>g>mechanical</str<strong>on</strong>g> resp<strong>on</strong>se as a result<br />
<str<strong>on</strong>g>of</str<strong>on</strong>g> pressure increase<br />
generated al<strong>on</strong>g the STF during the<br />
Sept 2010 low-flow-<br />
<str<strong>on</strong>g>of</str<strong>on</strong>g> the<br />
rate EGS injecti<strong>on</strong> phase. FLAC 3D displays z<strong>on</strong>es<br />
model (i.e. STF) where the pore pressure incremental<br />
establishes c<strong>on</strong>diti<strong>on</strong>s for initiati<strong>on</strong>n <str<strong>on</strong>g>of</str<strong>on</strong>g> plastic flow (i.e.<br />
shear-n > the z<strong>on</strong>e is s at active failure<br />
now, -n).
5 - DISCUSSION AND CONCLUSION<br />
In an attempt to <str<strong>on</strong>g>of</str<strong>on</strong>g>fer a plausible explanati<strong>on</strong> for the<br />
locati<strong>on</strong> <str<strong>on</strong>g>of</str<strong>on</strong>g> deep MEQs and to define plausible<br />
mechanisms governing the evoluti<strong>on</strong> <str<strong>on</strong>g>of</str<strong>on</strong>g><br />
transmissivity during the EGS experiment, the<br />
present study analyzes: 1) 3D site-specific geometry<br />
<str<strong>on</strong>g>of</str<strong>on</strong>g> the key structures involved in the experiment, 2)<br />
3D equivalent permeability tensors in a<br />
representative DFN c<strong>on</strong>sistent with observati<strong>on</strong>s <str<strong>on</strong>g>of</str<strong>on</strong>g><br />
the fracture network and, specifically, hydraulically<br />
c<strong>on</strong>ductive fractures within well 27-15, 3) a hydraulic<br />
model <str<strong>on</strong>g>of</str<strong>on</strong>g> fluid pressure distributi<strong>on</strong>s within the STF,<br />
and 4) a <str<strong>on</strong>g>hydro</str<strong>on</strong>g>-<str<strong>on</strong>g>mechanical</str<strong>on</strong>g> simulati<strong>on</strong> c<strong>on</strong>sistent with<br />
the activati<strong>on</strong> <str<strong>on</strong>g>of</str<strong>on</strong>g> hydraulically-induced shear failure<br />
al<strong>on</strong>g the STF.<br />
As introduced above, the MEQ cluster observed<br />
throughout the entire EGS experiment is mainly used<br />
for structural identificati<strong>on</strong> purposes here. The<br />
numerical simulati<strong>on</strong> refers to the Sept 2010 injecti<strong>on</strong><br />
phase <strong>on</strong>ly, when injecti<strong>on</strong> operati<strong>on</strong>s in 22-22 were<br />
reduced and <strong>on</strong>ly 1 MEQ was observed. The<br />
complexity resulting from combined injecti<strong>on</strong><br />
operati<strong>on</strong>s at higher-flow-rates is not addressed here<br />
and may be discussed in a future study.<br />
The c<strong>on</strong>ceptual and numerical modeling results<br />
reveal that c<strong>on</strong>diti<strong>on</strong>s necessary for fluid<br />
“channeling” to depths below the stimulati<strong>on</strong> interval<br />
during the Sept 2010 EGS injecti<strong>on</strong> phase in well 27-<br />
15 can lead to pressurizati<strong>on</strong> and poro<str<strong>on</strong>g>mechanical</str<strong>on</strong>g><br />
stressing <str<strong>on</strong>g>of</str<strong>on</strong>g> the STF. The computed DFN<br />
permeability tensors indicate that, within the<br />
background natural fracture network, fluid injected at<br />
the open secti<strong>on</strong> in well 27-15 flows preferentially<br />
toward the NNE and the vertical directi<strong>on</strong>s (in<br />
accordance with the regi<strong>on</strong>al structures observed <strong>on</strong><br />
site).<br />
Two FLAC 3D simulati<strong>on</strong>s are carried out separately:<br />
1) the hydraulic-<strong>on</strong>ly model is run to simulate fluid<br />
diffusi<strong>on</strong> and STF pressurizati<strong>on</strong> under the Sept 2010<br />
injecti<strong>on</strong> phase hydraulically-induced c<strong>on</strong>diti<strong>on</strong>s, and<br />
the resulting pressure incremental is used as input to<br />
the Mohr-Coulomb analytical analysis; 2) the<br />
subsequent coupled <str<strong>on</strong>g>hydro</str<strong>on</strong>g>-<str<strong>on</strong>g>mechanical</str<strong>on</strong>g> model is run<br />
to test the <str<strong>on</strong>g>mechanical</str<strong>on</strong>g> resp<strong>on</strong>se <str<strong>on</strong>g>of</str<strong>on</strong>g> the model and<br />
verify c<strong>on</strong>diti<strong>on</strong>s for deformati<strong>on</strong> and initiati<strong>on</strong> <str<strong>on</strong>g>of</str<strong>on</strong>g><br />
shear failure al<strong>on</strong>g the STF. The FLAC 3D hydraulic<strong>on</strong>ly<br />
model is initialized <strong>on</strong> the basis <str<strong>on</strong>g>of</str<strong>on</strong>g> the computed<br />
DFN permeability tensors and by assigning a higher<br />
permeability to the STF. With these c<strong>on</strong>diti<strong>on</strong>s, the<br />
simulated injected fluid (Sept 2010 phase) migrates<br />
from the open secti<strong>on</strong> in well 27-15 toward greater<br />
depths and it diffuses within the STF. The FLAC 3D<br />
hydraulic-<strong>on</strong>ly model shows localized pressurizati<strong>on</strong><br />
<str<strong>on</strong>g>of</str<strong>on</strong>g> the STF and pore pressure incremental up to 1.8<br />
MPa. Analysis <str<strong>on</strong>g>of</str<strong>on</strong>g> the resulting effective pressure<br />
through analytical Mohr-coulomb circles and<br />
FLAC 3D <str<strong>on</strong>g>hydro</str<strong>on</strong>g>-<str<strong>on</strong>g>mechanical</str<strong>on</strong>g> modeling suggest that<br />
these pressures can establish c<strong>on</strong>diti<strong>on</strong>s for shear<br />
failure within the STF. The injected fluid being<br />
colder and denser tends to flows toward the bottom <str<strong>on</strong>g>of</str<strong>on</strong>g><br />
the STF, generating higher pressure at greater rather<br />
than shallower depth within the STF. The subsequent<br />
FLAC 3D coupled <str<strong>on</strong>g>hydro</str<strong>on</strong>g>-<str<strong>on</strong>g>mechanical</str<strong>on</strong>g> numerical model<br />
dem<strong>on</strong>strates that effective stress changes induced by<br />
these fluid pressure increases and spatially variable<br />
permeability al<strong>on</strong>g the STF are sufficient to produce<br />
slip and microseismicity within the STF itself. The<br />
activati<strong>on</strong> <str<strong>on</strong>g>of</str<strong>on</strong>g> shearing after about 4 days <str<strong>on</strong>g>of</str<strong>on</strong>g> injecti<strong>on</strong><br />
is also in good agreement with the time at which the<br />
single MEQ event is observed during the low-flowrate<br />
injecti<strong>on</strong> phase, suggesting a correlati<strong>on</strong> between<br />
slip <strong>on</strong> the deep STF and the Sept 2010 change in<br />
injectivity.<br />
The modeling results (i.e. migrati<strong>on</strong> <str<strong>on</strong>g>of</str<strong>on</strong>g> injected fluid<br />
at depth, pressurizati<strong>on</strong> and shearing <str<strong>on</strong>g>of</str<strong>on</strong>g> the STF)<br />
appear to validate the hypothesis that the proposed<br />
framework (based <strong>on</strong> the identificati<strong>on</strong> <str<strong>on</strong>g>of</str<strong>on</strong>g> the STF) is<br />
a plausible explanati<strong>on</strong> for the presumed correlati<strong>on</strong><br />
between the observed injecti<strong>on</strong> rate increase and the<br />
occurrence <str<strong>on</strong>g>of</str<strong>on</strong>g> microseismicity at depths greater than<br />
the open secti<strong>on</strong>. The parameters under which the<br />
models simulate this process for the Sept 2010 phase<br />
are listed in Table 2 and 3. Shear failure appears to be<br />
more sensitive to variati<strong>on</strong>s in the STF fricti<strong>on</strong> angle.<br />
The identified STF satisfies some <str<strong>on</strong>g>of</str<strong>on</strong>g> the c<strong>on</strong>diti<strong>on</strong>s<br />
that are necessary for shear failure initiati<strong>on</strong>: 1)<br />
adequate initial transmissivity, (2) optimum<br />
orientati<strong>on</strong> with respect to the local stress state, and<br />
(3) enhanced transmissivity with slip [21]. Related<br />
physical processes have been inferred in several<br />
injecti<strong>on</strong>-disposal operati<strong>on</strong>s, especially al<strong>on</strong>g faults<br />
that transit between basement rocks and overlying<br />
aquifers. Such a process may have been resp<strong>on</strong>sible<br />
for recent observati<strong>on</strong>s <str<strong>on</strong>g>of</str<strong>on</strong>g> injecti<strong>on</strong>-induced<br />
seismicity at Guy, Arkansas [16].<br />
Both numerical (coupled <str<strong>on</strong>g>hydro</str<strong>on</strong>g>-<str<strong>on</strong>g>mechanical</str<strong>on</strong>g>) and<br />
analytical (<str<strong>on</strong>g>mechanical</str<strong>on</strong>g> Mohr-Coulomb analysis)<br />
results support the existence <str<strong>on</strong>g>of</str<strong>on</strong>g> regi<strong>on</strong>s in the STF<br />
which can undergo shear failure under the simulated<br />
injecti<strong>on</strong>-induced hydraulic pressure c<strong>on</strong>diti<strong>on</strong>s.<br />
Given the n<strong>on</strong>-uniqueness <str<strong>on</strong>g>of</str<strong>on</strong>g> the problem, the<br />
presented c<strong>on</strong>ceptual framework is <strong>on</strong>e possible<br />
model for the Desert Peak EGS experiment. Future<br />
coupling <str<strong>on</strong>g>of</str<strong>on</strong>g> thermo-<str<strong>on</strong>g>hydro</str<strong>on</strong>g>-<str<strong>on</strong>g>mechanical</str<strong>on</strong>g>-chemical<br />
processes will be carried out to better understand the<br />
evoluti<strong>on</strong> <str<strong>on</strong>g>of</str<strong>on</strong>g> permeability throughout the Desert Peak<br />
EGS stimulati<strong>on</strong>.
5 - ACKNOWLEDGEMENTS<br />
This work is supported by the Great Basin Center for<br />
Geothermal Energy under a Geothermal Technology<br />
Program (GTP) Faculty Seed Grant, Ormat<br />
Technologies, Inc., and Itasca through the Itasca<br />
Educati<strong>on</strong> Partnership program. The first two authors<br />
wish to acknowledge Belinda Poli for providing<br />
comments/feedback while reviewing the document.<br />
6 - REFERENCES<br />
[1]. B<strong>on</strong>net, E., O. Bour, N.E. Odling, P. Davy, I.<br />
Main, P. Cowie, and B. Berkowitz (2001),<br />
Scaling <str<strong>on</strong>g>of</str<strong>on</strong>g> fracture systems in geologic media,<br />
Rev. Geophys., 39(3), 347-383.<br />
[2]. Chabora, E., Zemach, E., Spielman, P.,<br />
Drakos, P., Hickman, S., Lutz, S., Boyle, K.,<br />
Falc<strong>on</strong>er, A., Roberts<strong>on</strong>-Tait, A., Davatzes,<br />
N.C., Rose, P., Majer, E., Jarpe, S., (2012),<br />
Hydraulic stimulati<strong>on</strong> <str<strong>on</strong>g>of</str<strong>on</strong>g> well 27-15, Desert<br />
Peak Geothermal Field, Nevada, USA,<br />
Proceedings, 37 th Workshop <strong>on</strong> Geothermal<br />
Reservoir Engineering, Stanford University,<br />
Stanford, California, January 30 - February 1,<br />
2012, SGP-TR-194.<br />
[3]. Davatzes, N.C. and Hickman, S., (2009),<br />
Fractures, stress and fluid flow prior to<br />
stimulati<strong>on</strong> <str<strong>on</strong>g>of</str<strong>on</strong>g> well 27-15, Desert Peak,<br />
Nevada, EGS project, Proceedings, 34 th<br />
Workshop <strong>on</strong> Geothermal Reservoir<br />
Engineering, Stanford University, Stanford,<br />
California, February 9-11, 2009 SGP-TR-187.<br />
[4]. Davatzes, N.C., and Hickman, S.H. (2010),<br />
Stress, fracture, and fluid-flow analysis using<br />
acoustic and electrical image logs in hot<br />
fractured granites <str<strong>on</strong>g>of</str<strong>on</strong>g> the Coso geothermal<br />
field, California, U.S.A., in M. Poppelreiter,<br />
C. Garcıa-Carballido, and M. Kraaijveld, eds.,<br />
Dipmeter and borehole image log technology:<br />
AAPG Memoir 92, Ch 24., p. 1 – 35.<br />
[5]. de Dreuzy, J.R. & Erhel, J., (2003), Efficient<br />
algorithms for the determinati<strong>on</strong> <str<strong>on</strong>g>of</str<strong>on</strong>g> the<br />
c<strong>on</strong>nected fracture network and the soluti<strong>on</strong> to<br />
the steady-state flow equati<strong>on</strong> in fracture<br />
networks, Comput. Geosci., Vol. 29, No. 1,<br />
107–111.<br />
[6]. de Dreuzy, J.R.; Davy, P. O.and Bour, (2001),<br />
Hydraulic properties <str<strong>on</strong>g>of</str<strong>on</strong>g> two-dimensi<strong>on</strong>al<br />
random fracture networks following a powerlaw<br />
length distributi<strong>on</strong>: 1. Effective<br />
c<strong>on</strong>nectivity, Water Resour. Res., Vol. 37, No.<br />
8, 2065-2078.<br />
[7]. Drakos, P., Ormat Nevada Inc., (2010), Desert<br />
Peak EGS Project, Geothermal Technologies<br />
Program 2010 Peer Review, DOE: DE-FC6-<br />
02ID14406, May 18, 2010.<br />
[8]. Faulds, J.E., and Henry, C.D., (2008),<br />
Tect<strong>on</strong>ic influences <strong>on</strong> the spatial and<br />
temporal evoluti<strong>on</strong> <str<strong>on</strong>g>of</str<strong>on</strong>g> the Walker Lane: an<br />
incipient transform fault al<strong>on</strong>g the evolving<br />
Pacific-North American plate boundary, in<br />
Spencer, J.E., and Titley, S.R., eds., Ores and<br />
orogenesis: CircumPacific tect<strong>on</strong>ics, geologic<br />
evoluti<strong>on</strong>, and ore deposits, Ariz<strong>on</strong>a<br />
Geological Society Digest 22, p. 437-470.<br />
[9]. Faulds, J.E., Coolbaugh, M.F., Benoit, D.,<br />
Opplinger, G., Perkins, M., Moeck, I., Drakos,<br />
P., (2010), Structural c<strong>on</strong>trols <str<strong>on</strong>g>of</str<strong>on</strong>g> geothermal<br />
activity in the Northern Hot Spring Mountains,<br />
Western Nevada: the tale <str<strong>on</strong>g>of</str<strong>on</strong>g> three geothermal<br />
systems (Brady’s, Desert Peak, and Desert<br />
Queen), Geothermal Resources Council<br />
Transacti<strong>on</strong>s, Vol. 34, 2010.<br />
[10]. Faulds, J.E., Garside, L.J., Johns<strong>on</strong>, G.L.,<br />
Muehlberg, J., Oppliger, G.L., (2002),<br />
Geologic setting and preliminary analysis <str<strong>on</strong>g>of</str<strong>on</strong>g><br />
the Desert Peak-Brady Geothermal Field,<br />
Western Nevada, Geothermal Resource<br />
Council Transacti<strong>on</strong>s, 2002.<br />
[11]. FLAC 3D Fast Lagrangian Analysis <str<strong>on</strong>g>of</str<strong>on</strong>g> C<strong>on</strong>tinua<br />
in 3 Dimensi<strong>on</strong>s, (2009), User’s Guide, Itasca<br />
C<strong>on</strong>sulting Group Inc.<br />
[12]. Goyal, K.P., Benoit, W.R., Maas, J.P., Rosser,<br />
J.R., (1983), Desert Peak: a geothermal field in<br />
Churchill County, Nevada, Proceedings Ninth<br />
Workshop Geothermal Reservoir Engineering,<br />
Stanford University, Stanford, California,<br />
December 1983 SGP-TR-74.<br />
[13]. Hamm<strong>on</strong>d, W.C., and Thatcher, W., (2004),<br />
C<strong>on</strong>temporary tect<strong>on</strong>ic deformati<strong>on</strong> <str<strong>on</strong>g>of</str<strong>on</strong>g> the<br />
Basin and Range province, western United<br />
States: 10 years <str<strong>on</strong>g>of</str<strong>on</strong>g> observati<strong>on</strong> with the Global<br />
Positi<strong>on</strong>ing System, Journal <str<strong>on</strong>g>of</str<strong>on</strong>g> Geophysical<br />
Research, v. 109, B08403, doi:<br />
10.1029/2003JB002746.<br />
[14]. Hickman, S. (1991), Stress in the lithosphere<br />
and the strength <str<strong>on</strong>g>of</str<strong>on</strong>g> active faults, U.S. Nati<strong>on</strong>al<br />
Report to the Internati<strong>on</strong>al Uni<strong>on</strong> <str<strong>on</strong>g>of</str<strong>on</strong>g> Geodesy<br />
and Geophysics 1987-1990, Reviews <str<strong>on</strong>g>of</str<strong>on</strong>g><br />
Geophysics, v. 29, p. 759-775.<br />
[15]. Hickman, S. and Davatzes, N.C., (2010), Insitu<br />
stress and fracture characterizati<strong>on</strong> for<br />
planning <str<strong>on</strong>g>of</str<strong>on</strong>g> an EGS stimulati<strong>on</strong> in the Desert<br />
Peak Geothermal field, Nevada, Proceedings,<br />
35 th Workshop <strong>on</strong> Geothermal Reservoir<br />
Engineering, Stanford University, Stanford,<br />
California, February 1-3, 2010 SGP-TR-188.<br />
[16]. Hort<strong>on</strong>, S., (2012), Disposal <str<strong>on</strong>g>of</str<strong>on</strong>g> hydr<str<strong>on</strong>g>of</str<strong>on</strong>g>racking<br />
waste fluid by injecti<strong>on</strong> into subsurface<br />
aquifers triggers earthquake swarn in central<br />
Arkansas with potential for damaging<br />
earthquake, Seismological Research Letters,<br />
Vol. 83, Number 2, March/April 2012.
[17]. Klimczak, C., Schultz R.A., Parashar R.,<br />
Reeves D.M., (2010), Cubic law with<br />
correlated aperture to length and implicati<strong>on</strong>s<br />
for network scale fluid flow, Hydrogeology<br />
Journal, doi:10.1017/s10040-009-0572-6.<br />
[18]. Larsen, P.H., (1988), Relay structures in a<br />
lower Permian basement-involved extensi<strong>on</strong>al<br />
system, East Greenland, Journal <str<strong>on</strong>g>of</str<strong>on</strong>g> Structural<br />
Geology, v.10, p 3-8.<br />
[19]. Lutz, S., Moore, J., J<strong>on</strong>es, C., Suemnicht, G.,<br />
and Roberts<strong>on</strong>-Tait, A., (2009), Geological<br />
and structural relati<strong>on</strong>ships in the Desert Peak<br />
Geothermal System, Nevada: Implicati<strong>on</strong>s for<br />
EGS development, Proceedings 34th<br />
Workshop <strong>on</strong> Geothermal Reservoir<br />
Engineering, Stanford, University, Stanford,<br />
CA, SGP-TR-187.<br />
[20]. Lutz, S.J., Hickman, S., Davatzes, N., Zemach,<br />
E., Drakos, P., Roberts<strong>on</strong>-Tait, A., (2010),<br />
Rock <str<strong>on</strong>g>mechanical</str<strong>on</strong>g> testing in support <str<strong>on</strong>g>of</str<strong>on</strong>g> well<br />
stimulati<strong>on</strong> activities at the desert Peak<br />
geothermal field, Nevada, Geothermal<br />
Resources Council Transacti<strong>on</strong>s, Vol. 34,<br />
2010.<br />
[21]. McClure, M., Horne, R., Is pure shear<br />
stimulati<strong>on</strong> always the mechanism <str<strong>on</strong>g>of</str<strong>on</strong>g><br />
stimulati<strong>on</strong> in EGS?, Proceedings, Thirtyeight<br />
Workshop <strong>on</strong> Geothermal Reservoir<br />
Engineering, Stanford University, Stanford,<br />
California, February 11-13, 2013, SGP-TR-<br />
198.<br />
[22]. Nati<strong>on</strong>al Research Council, (1996), Rock<br />
Fractures and Fluid Flow: C<strong>on</strong>temporary<br />
Understanding and Applicati<strong>on</strong>s, Nati<strong>on</strong>al<br />
Academy <str<strong>on</strong>g>of</str<strong>on</strong>g> Sciences, New York, 551 p.<br />
[23]. Nicol, A., Watters<strong>on</strong>, J., Walsh, J., Childs, C.,<br />
(1996), The shapes, major axis orientati<strong>on</strong>s<br />
and displacement patterns <str<strong>on</strong>g>of</str<strong>on</strong>g> fault surfaces,<br />
Journal <str<strong>on</strong>g>of</str<strong>on</strong>g> Structural Geology, Vol. 18, No.<br />
2/3, pp. 235 to 248, 1996.<br />
[24]. Parashar, R. and Reeves D.M. (2012), On<br />
iterative techniques for solving flow in large<br />
two-dimensi<strong>on</strong>al discrete fracture<br />
networks, Journal <str<strong>on</strong>g>of</str<strong>on</strong>g> Computati<strong>on</strong>al and<br />
Applied<br />
Mathematics,<br />
doi:10.1016/j.cam.2012.02.038.<br />
[25]. Priest, S.D., (1993), Disc<strong>on</strong>tinuity Analysis <str<strong>on</strong>g>of</str<strong>on</strong>g><br />
Rock Engineering, Chapman and Hall,<br />
L<strong>on</strong>d<strong>on</strong>.<br />
[26]. Reeves, D.M., Bens<strong>on</strong>, D.A., Meerschaert,<br />
M.M., (2008a), Transport <str<strong>on</strong>g>of</str<strong>on</strong>g> c<strong>on</strong>servative<br />
solutes in simulated fracture networks: 1.<br />
Synthetic data generati<strong>on</strong>, Water Resour. Res.,<br />
Vol. 44, No. W05401,<br />
doi:10.1029/2007WR006069.<br />
[27]. Reeves, D.M., Bens<strong>on</strong>, D.A., Meerschaert,<br />
M.M., Scheffler, H.-P, (2008b), Transport <str<strong>on</strong>g>of</str<strong>on</strong>g><br />
c<strong>on</strong>servative soluti<strong>on</strong>s in simulated fracture<br />
networks: 2. Ensemble solute transport and the<br />
corresp<strong>on</strong>dence to operator-stable limit<br />
distributi<strong>on</strong>s, Water Resour. Res., Vol. 44, No.<br />
W05410, doi:10.1029/2008WR006858.<br />
[28]. Reeves, D.M., Parashar, R., Zhang, Y., (2012),<br />
Hydrogeologic characterizati<strong>on</strong> <str<strong>on</strong>g>of</str<strong>on</strong>g> fractured<br />
rock masses intended for disposal <str<strong>on</strong>g>of</str<strong>on</strong>g><br />
radioactive waste, Radioactive Waste, Dr.<br />
Rehab Abdel Rahman (Ed.), ISBN: 978-953-<br />
51-0551-0, InTech.<br />
[29]. Reeves, D.M., Pohll, G., Lyles, B., Faulds, J.,<br />
Louie, J., Ehni, B., Kratt, C., Cooper, C.,<br />
Parashar, R., Pullammanappallil, S., Noel D.,<br />
(2012), Geothermal resource characterizati<strong>on</strong><br />
and evaluati<strong>on</strong> at Astor Pass,<br />
Nevada, Geothermal Resources Council<br />
Transacti<strong>on</strong>s, 36, 1371-1376.<br />
[30]. Renshaw, C.E. (1999). C<strong>on</strong>nectivity <str<strong>on</strong>g>of</str<strong>on</strong>g> joint<br />
networks with power law length distributi<strong>on</strong>s,<br />
Water Resour. Res., 35(9), 2661-2670.<br />
[31]. Roberts<strong>on</strong>-Tait, A., Lutz, S.J., Sheridan, J.,<br />
and Morris, C.L. (2004), Selecti<strong>on</strong> <str<strong>on</strong>g>of</str<strong>on</strong>g> an<br />
interval for massive hydraulic stimulati<strong>on</strong> in<br />
well DP 23-1, Desert Peak East EGS project,<br />
Nevada, Proceedings, 29th Workshop <strong>on</strong><br />
Geothermal Reservoir Engineering, Stanford<br />
University, Stanford CA, SGP-TR-175.<br />
[32]. Rose, P., Leecaster, K., Drakos, P., Roberts<strong>on</strong>-<br />
Tait, A., Tracer testing at the Desert Peak EGS<br />
Project, Geothermal Resource Council<br />
Transacti<strong>on</strong>s, Vol. 33, 2009.<br />
[33]. Schultz, R.A., Soliva, R., Fossen, H., Okubo,<br />
C.H., Reeves, D.M., (2008), Dependence <str<strong>on</strong>g>of</str<strong>on</strong>g><br />
displacement-length scaling relati<strong>on</strong>s for<br />
fractures and deformati<strong>on</strong> bands <strong>on</strong> the<br />
volumetric changes across them, Journal <str<strong>on</strong>g>of</str<strong>on</strong>g><br />
Structural Geology 30 (2008) 1405-1411.<br />
[34]. Sherburn, S. and Quinn, R., (2012), An<br />
Assessment <str<strong>on</strong>g>of</str<strong>on</strong>g> the Effects <str<strong>on</strong>g>of</str<strong>on</strong>g> Hydraulic<br />
Fracturing <strong>on</strong> Seismicity in the Taranaki<br />
Regi<strong>on</strong>, GNS Science C<strong>on</strong>sultancy Report<br />
2012/50, February 2012.<br />
[35]. Shipt<strong>on</strong>, Z.K., Soden, A.M., Kirkpatrick, J.D.,<br />
Bright, A.M., Lunn, R.J., (2006), How thick is<br />
a fault? Fault-Displacement-Thickness scaling<br />
revisited, in Abercrombie, R., (Eds)<br />
Earthquakes: Radiated energy and the physics<br />
<str<strong>on</strong>g>of</str<strong>on</strong>g> faulting, pp. 193-198, AGU bulletin, 2006.<br />
[36]. Stacey, R.W., Roberts<strong>on</strong>-Tait, A., Drakos, P.,<br />
Zemach, E., (2010), EGS stimulati<strong>on</strong> <str<strong>on</strong>g>of</str<strong>on</strong>g> well<br />
27-15, Desert Peak geothermal field, Nevada,<br />
Geothermal Resource Council Transacti<strong>on</strong>s,<br />
Vol. 34, 2010.<br />
[37]. Swyer, M.W., Davatzes, N.C., (2012), Using<br />
boundary element modeling <str<strong>on</strong>g>of</str<strong>on</strong>g> fault slip to<br />
predict patterns <str<strong>on</strong>g>of</str<strong>on</strong>g> stress perturbati<strong>on</strong> and
elated fractures in geothermal reservoirs and<br />
explore parameter uncertainty, Proceedings,<br />
Thirty-Seventh Workshop <strong>on</strong> Geothermal<br />
Reservoir Engineering, Stanford University,<br />
Stanford, California, January 30 – February 1,<br />
2012, SGP-TR-194.<br />
[38]. Tar<strong>on</strong>, J., Elsworth, D., Min, K.B., (2009),<br />
Numerical simulati<strong>on</strong> <str<strong>on</strong>g>of</str<strong>on</strong>g> thermal-<str<strong>on</strong>g>hydro</str<strong>on</strong>g>logic<str<strong>on</strong>g>mechanical</str<strong>on</strong>g>-chemical<br />
processes in deformable,<br />
fractured porous media, Internati<strong>on</strong>al Journal<br />
Rock Mechanics & Mining Sciences 2009, doi:<br />
10.1016/j.ijrmms.2009.01.008.<br />
[39]. Townend, J., and Zoback, M. D. (2000), How<br />
faulting keeps the crust str<strong>on</strong>g, Geology, v. 28,<br />
p. 399–402.<br />
[40]. Zemach, E., Drakos, P., Roberts<strong>on</strong>-Tait, A.,<br />
Lutz, S.J., (2010), Feasibility evaluati<strong>on</strong> <str<strong>on</strong>g>of</str<strong>on</strong>g> an<br />
“in-field” EGS project at Desert Peak, Nevada,<br />
USA, Proceedings World Geothermal<br />
C<strong>on</strong>gress, Bali, Ind<strong>on</strong>esia, 25-29 April 2010.


