The ShawCor Difference The ShawCor Difference - SNL Financial
The ShawCor Difference The ShawCor Difference - SNL Financial
The ShawCor Difference The ShawCor Difference - SNL Financial

You also want an ePaper? Increase the reach of your titles
YUMPU automatically turns print PDFs into web optimized ePapers that Google loves.
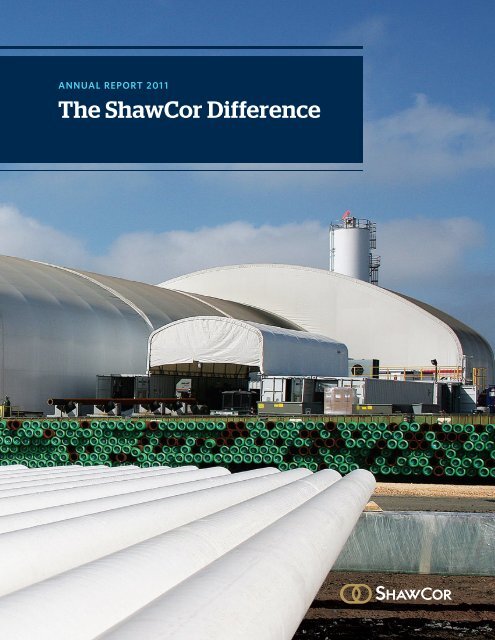
ANNUAL REPORT 2011<br />
<strong>The</strong> <strong>ShawCor</strong> <strong>Difference</strong>
<strong>ShawCor</strong>’s Mission<br />
To be the market leader and technology innovator with<br />
a primary focus on the global pipeline industry and to<br />
use this base as a platform to build an international<br />
energy services company while achieving <strong>ShawCor</strong>’s<br />
performance objectives.<br />
<strong>Financial</strong> Summary<br />
Year ended December 31<br />
(in thousands of Canadian dollars except per share amounts) 2011 2010<br />
OPERATING RESULTS<br />
Revenue $ 1,157,265 $ 1,034,163<br />
EBITDA 138,837 186,035<br />
Income from operations 84,443 119,831<br />
Net income Note 1 $ 56,086 $ 95,072<br />
Earnings per share, Class A and Class B – basic $ 0.79 $ 1.35<br />
Earnings per share, Class A and Class B – diluted $ 0.78 $ 1.33<br />
CASH FLOW<br />
Cash provided by operating activities $ 45,327 $ 53,244<br />
FINANCIAL POSITION<br />
Working capital $ 281,848 $ 283,852<br />
Total assets $ 1,223,265 $ 1,224,936<br />
Shareholders’ equity per share (Class A and Class B) $ 12.22 $ 11.79<br />
Note 1 Attributable to shareholders of the Company.<br />
42 YEAR HISTORY OF VALUE CREATION<br />
$25,000<br />
$20,000<br />
$15,000<br />
SCL.A/SCL.B<br />
S&P/TSX Composite Total Return<br />
TABLE OF CONTENTS<br />
1 <strong>The</strong> <strong>ShawCor</strong> <strong>Difference</strong><br />
2 Message to Shareholders<br />
4 <strong>ShawCor</strong> At-a-Glance<br />
6 Global Leadership<br />
10 Superior Execution<br />
14 Technological Innovation<br />
18 Organizational Excellence<br />
20 <strong>Financial</strong> Strength<br />
21 <strong>Financial</strong> Review<br />
106 <strong>ShawCor</strong> Directors<br />
107 Corporate Governance<br />
108 Primary Operating Locations<br />
IBC Corporate Information<br />
2011 HIGHLIGHTS<br />
(in Canadian dollars)<br />
1.2 B<br />
REVENUE<br />
56.1 M<br />
NET INCOME<br />
(attributable to shareholders of the Company)<br />
2.3 B<br />
MARKET CAPITALIZATION<br />
CORPORATE PROFILE<br />
25000<br />
20000<br />
15000<br />
$10,000<br />
$5,000<br />
69 71 73 75 77 79 81 83 85 87 89 91 93 95 97 99 01 03 05 07 09 11<br />
<strong>ShawCor</strong> benefits from a strong competitive position based on global locations,<br />
proprietary products and services and a solid balance sheet, which means the Company<br />
is the only capable supplier for many of its products and services.<br />
<strong>ShawCor</strong> Ltd. is a global energy services<br />
company specializing in technology-based<br />
products and services for the pipeline<br />
and pipe services and the petrochemical<br />
and industrial markets. <strong>The</strong> Company<br />
operates seven business units with more<br />
than seventy manufacturing and service<br />
facilities employing over 5,000 people<br />
around the world.<br />
10000<br />
5000<br />
0
On the Frontiers<br />
of Energy Production<br />
To bridge the widening gap between supply and demand, oil and gas<br />
producers must discover new reserves in increasingly remote and<br />
challenging locations. As the world’s largest provider of advanced<br />
pipeline coatings and a leading energy services company, we are well<br />
positioned to benefit from this trend. In fact, <strong>ShawCor</strong> won many of<br />
the largest pipeline coating contracts awarded during the past year,<br />
setting the stage for significant growth in 2012 and beyond. You can<br />
learn more about the unique competitive strengths behind our success<br />
in this year’s annual report. Together, they represent what we call<br />
<strong>The</strong> <strong>ShawCor</strong> <strong>Difference</strong>
2 <strong>ShawCor</strong> Ltd. MESSAGE TO SHAREHOLDERS<br />
Message to Shareholders<br />
<strong>The</strong> past year presented us with a combination of disappointing financial<br />
results and unprecedented success at winning new business, which will<br />
benefit us in 2012 and 2013. <strong>The</strong> financial crisis caused a “pause” in the<br />
final investment decisions on several major energy projects and delayed<br />
revenue in our core pipe coating markets. By year-end, however, our<br />
success in winning these significant projects resulted in the Company<br />
establishing an all-time record for booked customer orders.<br />
Revenue for 2011 increased 12 percent to $1.16 billion as the<br />
result of the growth achieved in several of our businesses.<br />
In the Pipeline and Pipe Services segment, revenue increased<br />
11 percent, however, operating margins were impacted by<br />
weak conditions in the large diameter pipe market, especially<br />
in Asia Pacific and Latin America where there was virtually<br />
no new energy infrastructure activity. This was partially offset<br />
by steady project volumes in Europe and the Middle East and<br />
strong demand for our small diameter pipe coatings, composite<br />
pipe and joint protection products in North America. <strong>The</strong><br />
Petrochemical and Industrial segment also performed well<br />
with a 19 percent increase in revenue during the year.<br />
Despite the growth in revenue, net income attributable to<br />
shareholders of the company declined 41 percent to<br />
$56.1 million. <strong>The</strong> reasons for this included: a much lower<br />
volume contribution from our Asia Pacific region’s pipe coating<br />
business, a $10.1 million loss on our investment in Fineglade, low<br />
capacity utilization in our pipe coating facilities in Asia Pacific<br />
and Latin America and the decision to maintain workforce levels<br />
for a significant ramp up in production beginning in 2012.<br />
A record year for new business<br />
While 2011 was an unusually quiet year for the pipe coating<br />
industry, <strong>ShawCor</strong> secured over US$800 million in major project<br />
awards and entered 2012 with a record year-end backlog of<br />
$548 million in booked customer orders. This twelve-month<br />
rolling backlog included current portions of US$170 million<br />
in contracts with Chevron Australia Pty. Ltd. to provide pipe<br />
coatings and related products and services in connection with<br />
the gas supply trunkline and flow lines for the Wheatstone<br />
LNG Project off the northwest coast of Australia. We were<br />
also successful in winning a US$400 million contract from<br />
Mitsui & Co. Ltd., to provide pipe coatings and related products<br />
and services for the gas export pipeline that will serve the<br />
massive Ichthys LNG Project, a joint venture between Inpex<br />
Corporation and Total E&P. This project will involve advanced<br />
coatings for approximately 900 kilometres of 42 inch subsea<br />
pipeline from the offshore central processing facility to the<br />
onshore LNG facility at Darwin, Australia.<br />
Extending our lead<br />
Continuous investment in market and technological leadership<br />
has been an essential part of our success in winning such<br />
contracts. <strong>The</strong> Simulated Service Vessel (SSV), an integral part of<br />
<strong>ShawCor</strong>’s new Subsea Test Facility which opened in early 2011,<br />
has enabled us to exhaustively test and prove the performance<br />
of our most advanced coatings prior to deployment. <strong>The</strong> unique<br />
capabilities of the SSV were recognized earlier this year with the<br />
receipt of a Spotlight on New Technology Award. <strong>The</strong> Spotlight<br />
on New Technology Program is designed to highlight the newest<br />
and most advanced technologies in the oil and gas sector as<br />
presented by companies exhibiting at the Offshore Technology<br />
Conference in Houston, Texas. Our remarkable Brigden TM<br />
portable coating plant, commissioned in the third quarter for<br />
Chevron’s Jack/St. Malo Project, is now a proven technology and<br />
potential game changer for the completion of remote or tightly<br />
scheduled pipeline projects. We also introduced a number of<br />
other advanced products, such as Bredero Shaw’s <strong>The</strong>rmotite®<br />
ULTRA TM deepwater insulation system and new high-temperature<br />
and cyclic pressure composite pipe products from Flexpipe<br />
Systems, that have increased our product differentiation and<br />
generated new sources of revenue.<br />
In addition, we continued to invest in strategic capabilities<br />
that will strengthen <strong>ShawCor</strong>’s position in its chosen markets.<br />
In the first quarter, Shaw Pipe Protection acquired the former<br />
CSI operations of Altus Energy Services in Western Canada.<br />
This acquisition enables Shaw Pipe Protection to supply a broad<br />
range of customized coating solutions that are complementary to<br />
its current range of anticorrosion, insulation and flow efficiency<br />
coatings for oil and gas transmission lines and strengthens our<br />
position in pipeline rehabilitation markets.<br />
Strategic capital investments in our existing facilities are also<br />
important. In 2011, we improved throughput and pipe handling<br />
capabilities on the anticorrosion and insulation lines at our
ANNUAL REPORT 2011 <strong>ShawCor</strong> Ltd.<br />
3<br />
Kabil, Indonesia and Kuantan, Malaysia facilities, added<br />
and prepared new yard space in Kabil following the<br />
construction of two new berths at its deepwater port<br />
and also added a second new berth at the facility in<br />
Kuantan. <strong>The</strong>se improvements played an essential role in<br />
winning the Wheatstone, Ichthys and Zawtika contracts<br />
and position us for continuing success in the Asia<br />
Pacific region.<br />
William P. Buckley<br />
President and Chief Executive Officer<br />
Virginia L. Shaw<br />
Chair of the Board<br />
An improving outlook<br />
In an environment of weak economic growth, global<br />
energy demand is expected to rise by about one percent<br />
over the next year. However, the annual depletion rate<br />
for existing reserves is about six to seven percent.<br />
To bridge the gap, the energy industry’s major producers<br />
are extending their search to challenging new frontiers.<br />
We are right there with them as a trusted global supplier<br />
of the reliable and technologically advanced products<br />
and services essential for their success.<br />
While global economic prospects remain uncertain,<br />
we are confident that <strong>ShawCor</strong> is positioned for success<br />
in 2012 and beyond. Our backlog has increased by<br />
16 percent since the end of the past year to an all-time<br />
record of $637 million as of February 29, 2012. <strong>The</strong><br />
largest of these new orders involve energy infrastructure<br />
for the long-term supply of LNG to Asian markets where<br />
rapid economic growth continues to support increased<br />
demand for new energy resources.<br />
<strong>The</strong> people of <strong>ShawCor</strong><br />
As always, our progress has been made possible by<br />
the skill and dedication of more than 5,000 employees<br />
around the world. We are grateful for their support in<br />
building a leading international energy services company.<br />
We would also like to thank the Board for its wise counsel<br />
over the past year and, in particular, to acknowledge<br />
the contribution of retiring Director Murray Mullen<br />
and welcome two new members, Derek Blackwood, a<br />
Divisional President of global energy services company<br />
Wood Group, and Dennis Freeman, a retired partner<br />
of KPMG LLP.<br />
Sincerely,<br />
WILLIAM P. BUCKLEY<br />
PRESIDENT AND CHIEF EXECUTIVE OFFICER<br />
Virginia L. Shaw<br />
Chair of the Board
4 <strong>ShawCor</strong> Ltd. Shawcor at-a-glance<br />
<strong>ShawCor</strong> At-a-Glance<br />
?<br />
? ?<br />
?? ? ?<br />
? ?? ?<br />
??<br />
? ?<br />
? ? ? ?<br />
?<br />
?<br />
? Coating facility<br />
? Portable coating plant<br />
? Other operating facility<br />
?<br />
? ?<br />
?<br />
?<br />
?<br />
?<br />
?<br />
?<br />
?<br />
?<br />
? ?<br />
?<br />
?<br />
?<br />
??<br />
?<br />
?<br />
?<br />
?? ?<br />
?<br />
?<br />
?<br />
Pipeline and Pipe Services<br />
Bredero Shaw<br />
Flexpipe Systems<br />
Shaw Pipeline Services<br />
Business Description<br />
<strong>The</strong> Global Leader in pipe<br />
coating solutions for corrosion<br />
protection, flow assurance,<br />
insulation, field joints and weight<br />
coating applications for onshore<br />
and offshore pipelines.<br />
Leading manufacturer of flexible<br />
composite pipe systems used<br />
for oil and gas gathering, water<br />
transportation, CO 2 injection<br />
and other corrosive applications<br />
that benefit from the product’s<br />
pressure and corrosion<br />
resistance capabilities.<br />
A leader in specialized NDT<br />
inspection with a primary focus<br />
on both the upstream and<br />
downstream oil and gas industry<br />
where the division is the premier<br />
global provider of girth weld<br />
inspection services for land and<br />
offshore pipelines.<br />
Key Markets<br />
• Pipeline owners<br />
• Energy producers<br />
• Pipeline contractors<br />
• Energy producers<br />
• Gas distributors<br />
• Lay barge operators<br />
• Spool bases<br />
• Pipeline owners<br />
and contractors
ANNUAL REPORT 2011 <strong>ShawCor</strong> Ltd. 5<br />
?<br />
<strong>ShawCor</strong> has established a dominant position in its chosen markets<br />
through an unwavering focus on global growth, flawless execution,<br />
technological innovation and organizational excellence. With a<br />
network of more than 70 modern manufacturing and service facilities<br />
around the globe, we are located in the world’s primary energy<br />
producing regions and on each of the industry’s growth frontiers.<br />
?<br />
? ?<br />
? ?<br />
?<br />
?<br />
?<br />
5,000+<br />
dedicated employees<br />
around the world<br />
70+<br />
manufacturing and service<br />
facilities worldwide<br />
15+<br />
countries around the world<br />
are home to <strong>ShawCor</strong> facilities<br />
?<br />
Petrochemical and Industrial<br />
Canusa-CPS<br />
Guardian DSG-Canusa ShawFlex<br />
<strong>The</strong> market leader in field<br />
applied pipeline joint protection<br />
and insulation systems for<br />
onshore and offshore corrosion<br />
and thermal protection<br />
applications in the global oil,<br />
gas, water and insulated<br />
pipeline markets.<br />
Leading provider of a complete<br />
range of tubular management<br />
solutions including integrated<br />
inspection, threading,<br />
refurbishment and inventory<br />
services as one of the largest<br />
OCTG inspection businesses in<br />
the USA, Canada and Mexico.<br />
Leading global manufacturer of<br />
heat shrinkable tubing, sleeves<br />
and moulded products as well<br />
as heat shrink accessories and<br />
equipment with a manufacturing<br />
presence in three key markets:<br />
Americas, Europe and<br />
Asia Pacific.<br />
World-class manufacturer<br />
of specialty wire and cable<br />
products for use in severe<br />
service industrial environments.<br />
• Oil and gas pipelines<br />
• District heating and<br />
cooling systems<br />
• Water and waste<br />
water pipelines<br />
• Drilling contractors<br />
• Oil and gas producers<br />
• Tubular rental companies<br />
• Automotive<br />
• Electrical/Utility<br />
• Electronics<br />
• Communications<br />
• Petrochemical<br />
• Power generation<br />
• Pulp and paper<br />
• Mining<br />
• Automation
6<br />
<strong>ShawCor</strong> Ltd. Global Leadership<br />
THE SHAWCOR DIFFERENCE<br />
Global Leadership<br />
<strong>ShawCor</strong> is the world’s largest pipe coating company, with a<br />
family of complementary energy service businesses that are well<br />
positioned in their respective markets. Our global reach, which<br />
includes more than 70 manufacturing and service facilities in<br />
18 countries – makes us uniquely capable of meeting customers’<br />
needs, even at the frontiers of energy production.
ANNUAL REPORT 2011 <strong>ShawCor</strong> Ltd.<br />
7<br />
As traditional energy resources mature, the world’s leading energy producers<br />
have been staking their futures on the new frontiers of energy production, from<br />
abundant deepwater deposits to the Canadian oil sands to emerging shale<br />
resources in North America and around the world. This trend has created<br />
growing demand for new energy infrastructure and enormous opportunities<br />
for <strong>ShawCor</strong>’s pipe coating and other energy services businesses.<br />
In 2011, <strong>ShawCor</strong> secured more than US$800 million in major pipe coating<br />
contracts and letters of intent. Our success has come from being in the<br />
locations where our customers need us. Today, we are uniquely capable of<br />
serving the largest projects from multiple high-capacity coating plants<br />
around the world.<br />
This includes the Asia Pacific region, which is becoming an increasingly<br />
important source of energy owing to the improving economics of natural<br />
Wheatstone<br />
Karratha<br />
Ichthys<br />
Darwin<br />
Wheatstone, Ichthys and Asia Pacific<br />
<strong>ShawCor</strong> secured several major new contracts during 2011 and early 2012 to<br />
supply advanced pipe coatings and related products for the Wheatstone and<br />
Ichthys projects off the northwest coast of Australia. Rapid economic growth<br />
in Asia coupled with a scarcity of domestic resources has fuelled a frenzy of<br />
exploration activity in the waters of Southeast Asia and coastal Australia<br />
and the development of LNG as an economically viable energy source.<br />
<strong>ShawCor</strong>’s regional pipe coating facilities are well positioned to benefit from<br />
the substantial investment in energy infrastructure that will accompany<br />
this development.<br />
gas liquefaction and burgeoning demand from the world’s fastest growing<br />
economies. During the past year, <strong>ShawCor</strong> won contracts for three major<br />
projects in Asia Pacific. <strong>The</strong>se included US$170 million in contracts awarded<br />
by Chevron Australia Pty. Ltd. to protect approximately 300 kilometres of<br />
10 to 44 inch diameter pipe with advanced anticorrosion, insulation, flow<br />
assurance and concrete weight coatings for the gas supply trunkline and the<br />
flow lines on the Wheatstone LNG Project off the northwest coast of Australia.<br />
This success was followed by a US$400 million contract with Mitsui & Co. Ltd.,<br />
the largest contract in the Company’s history, in connection with the Ichthys<br />
LNG Project for Inpex Corporation and Total E&P. <strong>The</strong> contract calls for asphalt<br />
enamel, flow assurance and concrete weight coatings on an approximately<br />
900 kilometre, 42 inch diameter subsea pipeline from an offshore central<br />
processing facility to an onshore LNG plant near Darwin, Australia.<br />
Our Asia Pacific region is also home to the Zawtika Development Project,<br />
operated by PTTEP International Limited. <strong>ShawCor</strong> won this US$60 million<br />
contract from Welspun Corp. Limited for three-layer anticorrosion and<br />
Liquid natural gas receiving terminal and regasification plant, Asia Pacific region.
8 <strong>ShawCor</strong> Ltd. Global Leadership<br />
Over the past decade, the Asia Pacific region has experienced<br />
the strongest increase in energy demand among all the regions<br />
of the world. Driven by limited oil and gas resources and rapidly<br />
growing consumption of natural gas, the area has become an<br />
important hub for LNG production.<br />
concrete weight coatings on 335<br />
kilometres of 10 to 28 inch diameter<br />
subsea pipe.<br />
<strong>The</strong> year 2011 was also a solid one for<br />
our operations in Europe and the Middle<br />
East. Our coating plant in Orkanger,<br />
Norway won a number of contracts with<br />
a total value in excess of US$40 million<br />
from Subsea 7 to provide flow assurance<br />
coatings for 110 kilometres of 6 to 16 inch<br />
diameter pipe for offshore projects in<br />
the Norwegian sector of the North Sea.<br />
Our Ras Al Khaimah coating plant in<br />
the United Arab Emirates is also expected<br />
to have a busy year thanks to a<br />
US$45 million contract with Hyundai<br />
Heavy Industries to provide fusion<br />
bonded epoxy anticorrosion and<br />
HeviCote® concrete weight coatings for<br />
292 kilometres of up to 24 inch diameter<br />
pipe on the Barzan project in the Qatari<br />
section of the Arabian Gulf.<br />
In North America, while large diameter<br />
transmission activity languished, <strong>ShawCor</strong><br />
continued to benefit from diverse and<br />
steadily improving small diameter<br />
coating activity. Although conventional<br />
oil and gas production in western Canada<br />
technically peaked more than 10 years ago,<br />
modern horizontal drilling and fracking<br />
technologies continue to give new life to<br />
mature deposits and support high levels<br />
of exploration activity. Business in the<br />
Canadian oil sands also continues to<br />
be robust with production projected to<br />
increase from an estimated 1.5 million<br />
barrels per day in 2010 to 2.2 million<br />
barrels per day by 2015. We also continue<br />
to benefit from growing exploration<br />
and drilling activity in America’s shale<br />
deposits, which are estimated to contain<br />
enough gas to satisfy U.S. energy demands<br />
for the next 100 years. Despite weakness<br />
in natural gas prices, producers continue<br />
to be driven by the pursuit of natural gas<br />
liquids, such as propane and butane, which<br />
are priced on a barrel-of-oil-equivalent<br />
(BOE) basis.<br />
<strong>The</strong>se developments were beneficial to<br />
all of our energy services businesses<br />
in 2011. Guardian, which established<br />
its first U.S. operation in the Marcellus<br />
Shale region of Pennsylvania in 2010,<br />
continues to expand its presence as a<br />
leading provider of tubular management<br />
systems in the U.S. Flexpipe Systems<br />
also continued to grow on the strength<br />
of new products such as FlexPipe HT,<br />
an advanced, high-temperature linepipe<br />
that can handle continuous service<br />
temperatures of up to 82°C, and FlexCord,<br />
a steel reinforced composite linepipe<br />
with high cyclic pressure capabilities that<br />
provides significant cost and performance<br />
advantages over welded steel pipe.<br />
While the strong growth of Flexpipe<br />
Systems is mostly attributable to its North<br />
American operations, the division is also<br />
starting to benefit from closer cooperation<br />
with <strong>ShawCor</strong>’s other businesses.<br />
For instance, Flexpipe Systems’ products<br />
are now represented by Canusa-CPS<br />
Top: A Flexpipe Systems installation in the<br />
oil-rich Eagle Ford shale formation in<br />
southern Texas.<br />
Bottom: Guardian is the largest provider of<br />
OCTG (oil country tubular goods) management<br />
solutions and inspection services in Canada<br />
and Mexico with a growing presence in<br />
the United States.<br />
in South America and by Guardian in<br />
Mexico. This has resulted in new sales<br />
orders for Flexpipe Systems in Brazil, Chile<br />
and Argentina as well as certification of<br />
compliance with a key Pemex standard in<br />
Mexico. In addition, excellent feedback
ANNUAL REPORT 2011 <strong>ShawCor</strong> Ltd.<br />
9<br />
New deepwater port facilities in Kabil, Indonesia.<br />
<strong>ShawCor</strong> CSI Systems – the newest part of<br />
Shaw Pipeline Services – provides custom<br />
shop and oilfield applied coating solutions for<br />
specialized configurations, including the tanks<br />
featured here, to customers in western Canada.<br />
from Petrobras and a trial installation with<br />
PDVSA in Venezuela bode well for the<br />
division’s prospects in Latin America.<br />
Global leadership also includes investment<br />
in selective acquisitions that strengthen<br />
our existing operations. <strong>The</strong> past year was<br />
no exception. In March, we acquired a<br />
specialty coating business, formerly known<br />
as CSI, from Altus Energy Services. This<br />
acquisition will allow Shaw Pipe Protection<br />
to provide custom shop and field applied<br />
coating solutions that are complementary<br />
to its existing business and strengthen our<br />
position in pipeline rehabilitation markets.<br />
We also continue to invest in the world’s<br />
largest network of modern, large-diameter<br />
pipe coating plants. Over the next few<br />
years, we will be delivering record volumes<br />
of coated pipe from our facilities in Kabil,<br />
Indonesia and Kuantan, Malaysia to fulfill<br />
contracts won to date and keep pace<br />
with projected energy exploration and<br />
production in the Asia Pacific region.<br />
Over the past two years, area management<br />
has increased anticorrosion and insulation<br />
coating capacity, constructed four<br />
additional deepwater berths, upgraded<br />
crane, loader and truck fleets and added<br />
160 hectares of storage space to increase<br />
capacity and efficiency at the Kabil and<br />
Kuantan coating facilities.
10 <strong>ShawCor</strong> Ltd. SUPERIOR EXECUTION<br />
THE SHAWCOR DIFFERENCE<br />
Superior Execution<br />
<strong>ShawCor</strong>’s seven divisions are among the strongest competitors<br />
in their markets. Individually and together, they are building a<br />
hard-earned reputation for fulfilling the most demanding project<br />
requirements on time, on budget and in accordance with the<br />
highest standards of quality. In 2011, we continued to raise the<br />
bar for superior execution with the most advanced manufacturing<br />
process management system in the business.
ANNUAL REPORT 2011 <strong>ShawCor</strong> Ltd.<br />
11<br />
A reputation for superior execution is important in a world of multi-billion<br />
dollar energy infrastructure investments where the impact of project delays<br />
can be measured in millions of dollars per day. Our customers expect<br />
flawless, on time, on budget performance from <strong>ShawCor</strong> and so do we. It’s a<br />
commitment that lies at the heart of every <strong>ShawCor</strong> facility worldwide through<br />
the <strong>ShawCor</strong> Management System (SMS).<br />
First launched in 2006, SMS is an industry-leading continuous improvement<br />
program that draws upon the best elements of lean manufacturing, Six Sigma<br />
and other world-class manufacturing systems as well as lessons from our own<br />
experience over the years. <strong>The</strong> SMS program combines these elements with a<br />
strong corporate culture to drive excellence in <strong>ShawCor</strong>’s manufacturing and<br />
business processes.<br />
Today, the performance of each of our<br />
manufacturing locations is continuously<br />
audited against eight measurable SMS<br />
elements that embrace: standardized work,<br />
product/service and process launch, product<br />
and process engineering, global operations<br />
metrics, SMS leadership management,<br />
workforce engagement, quality and process<br />
control and knowledge sharing.<br />
SMS continued to drive significant cost benefits<br />
for <strong>ShawCor</strong> during 2011. To date, we have<br />
achieved more than $25 million in cumulative<br />
annual savings as a result of improved<br />
efficiencies, material variance reductions,<br />
manufacturing process improvements and<br />
standardized launch methodologies for new<br />
products. Such improvements also translate<br />
into multiple benefits for our customers in the<br />
form of lower costs, higher quality and better<br />
on-time performance.<br />
DSG-Canusa's DERAY®<br />
Autoseal is an automated<br />
water blocking solution for use<br />
in the assembly of automotive<br />
wire harnesses.<br />
A higher level of assurance<br />
<strong>The</strong> commitment to superior execution extends beyond our pipe manufacturing<br />
processes to a growing range of onsite energy services. Shaw Pipeline Services<br />
is the premier global provider of girth weld inspection services that assure<br />
the integrity of onshore and marine pipelines. <strong>The</strong> company continued to<br />
build upon its technological leadership in real time radiographic inspection<br />
during the past year with the introduction of HDRTR – the industry’s first<br />
high definition real time radiography inspection solution. Applicable to any<br />
welding technique, including submerged arc welding, HDRTR delivers critical<br />
assurance on the growing frontiers of energy production.<br />
Performance at every <strong>ShawCor</strong> location is continuously audited against eight<br />
measurable SMS elements.
12<br />
<strong>ShawCor</strong> Ltd. Superior execution<br />
SMS continued to produce significant cost benefits for <strong>ShawCor</strong><br />
during the past year. To date, we have achieved more than<br />
$25 million in annual savings as a result of improved efficiencies,<br />
material variance reductions, manufacturing process improvements<br />
and standardized launch methodologies for new products.<br />
In 2011, our worldwide operations<br />
achieved a record SMS compliance score<br />
of more than 80 percent against a bar<br />
that continues to be raised each year. Our<br />
progress during the past year has been<br />
particularly impressive across all of the<br />
<strong>ShawCor</strong> manufacturing and pipe coating<br />
facilities where SMS has been adopted<br />
as a central element of the Company’s<br />
growth strategy. Our Bredero Shaw plant<br />
All control systems are built into Brigden’s<br />
modular design, which eliminates the need<br />
for time-consuming installation of lighting,<br />
electronics and plumbing on site. As a<br />
result, this full-service coating plant can be<br />
mobilized and into production in six weeks.<br />
in Ras Al Khaimah (RAK) in the United<br />
Arab Emirates achieved the highest yearover-year<br />
improvement in the SMS audit,<br />
a performance that helped earn <strong>ShawCor</strong>’s<br />
2011 awards for SMS Achievement<br />
and SMS Safety Performance. <strong>The</strong> RAK<br />
facility’s impressive achievements<br />
included a composite SMS compliance<br />
score of 87 percent, reduced material<br />
usage, reduced changeover times,<br />
increased contribution margins and a Total<br />
Recordable Case Frequency rate of zero.<br />
While proud of our progress to date,<br />
we see ample opportunity to improve<br />
our performance in the years ahead. To<br />
achieve our potential, <strong>ShawCor</strong>’s leaders<br />
must be able to support, guide and inspire<br />
business improvement and possess the<br />
knowledge to independently lead SMS<br />
initiatives at their respective facilities. In<br />
2010 we introduced the SMS Champion<br />
Certification Program, which has now<br />
graduated 55 Champions to help make<br />
continuous improvement a way of life at<br />
<strong>ShawCor</strong>. This comprehensive program<br />
includes over 100 hours of classroom and<br />
web-based training, simulations, handson<br />
applications, online testing and a final<br />
assignment on SMS application, personal<br />
development and business improvement.<br />
With the support of our senior leaders,<br />
these graduates have been able to broaden<br />
the collective knowledge of their teams,<br />
ensuring that we all speak a common<br />
language and are able to collaboratively<br />
execute meaningful improvements<br />
in <strong>ShawCor</strong>’s operating practices and<br />
corporate culture.<br />
We also place a high priority on continuing<br />
to learn from the experiences and best<br />
practices of other industry leaders<br />
throughout North America. <strong>ShawCor</strong> is<br />
an active member of the Association for<br />
Manufacturing Excellence (AME), North<br />
America’s premier organization for the<br />
exchange of knowledge in organizational<br />
excellence through the implementation of<br />
techniques such as Lean Tools, Leadership,<br />
Lean Product Development, Lean Supply<br />
Chain and Lean Accounting. In 2011, the<br />
annual AME conference in Dallas, Texas<br />
drew more than 2,400 participants<br />
(in millions of Canadian dollars)<br />
12<br />
11<br />
10<br />
9<br />
8<br />
7<br />
6<br />
5<br />
4<br />
3<br />
2<br />
1<br />
0<br />
SMS Annual Savings<br />
08 09 10 11<br />
<strong>ShawCor</strong>'s SMS Program has generated<br />
more than $25 million in cumulative annual<br />
savings since 2008.<br />
12<br />
10<br />
8<br />
6<br />
4<br />
2<br />
0
ANNUAL REPORT 2011<br />
<strong>ShawCor</strong> Ltd.<br />
13<br />
Our first fully modular Brigden coating plant<br />
opened last year in Beaumont, Texas.<br />
from 37 countries. As in past years,<br />
<strong>ShawCor</strong>’s delegation was the largest at<br />
the conference with 85 of our people<br />
in attendance at both the AME conference<br />
and the Company's parallel SMS sessions.<br />
<strong>The</strong> spirit of continuous improvement<br />
unleashed by SMS can also be seen<br />
elsewhere in the organization, from the<br />
development of new products to the<br />
introduction of innovative production<br />
technologies. <strong>ShawCor</strong> has led the<br />
industry in the design and construction of<br />
portable concrete coating plants to fulfill<br />
customer requirements at the most cost<br />
effective point in the supply chain. In 2011,<br />
we unveiled our most ambitious portable<br />
coating facility to date with the opening<br />
of our fully modular Brigden plant in<br />
Beaumont, Texas. <strong>The</strong> Brigden plant has<br />
been designed with the capability to<br />
provide a full range of internal and external<br />
anticorrosion and flow assurance pipe<br />
coatings and robotic end finishing. Each<br />
Brigden plant includes fully integrated<br />
raw material storage, maintenance,<br />
quality control and testing facilities. <strong>The</strong>se<br />
mobile plants can be located anywhere<br />
in the world, from nearby pipe mills to<br />
the most remote oil and gas fields or<br />
strategically located ports serving offshore<br />
deepwater plays. As a result, they can<br />
provide significant advantages in terms of<br />
streamlining project logistics, improving<br />
safety and reducing the costs of handling<br />
and transporting pipe. A Brigden plant<br />
ships in standard ISO containers and takes<br />
only six weeks to assemble and be fully<br />
operational. Built to comply with the same<br />
stringent SMS operating standards as<br />
our fixed plants, the Brigden concept was<br />
successfully commissioned with<br />
the application of anticorrosion and<br />
thermal insulation coatings for<br />
Chevron’s Jack/St. Malo Project in<br />
the Gulf of Mexico.<br />
As the quest for new energy resources<br />
becomes more challenging and expensive,<br />
<strong>ShawCor</strong>’s reliability as a supplier<br />
becomes increasingly important. We are<br />
uniquely capable of serving the largest<br />
and most technologically demanding<br />
projects in the industry with the world’s<br />
largest pipe coating facilities, complete<br />
pipe mill to pipe installation logistics and<br />
the financial strength to fund and execute<br />
multiple contracts on time and on budget<br />
while achieving projected margins and<br />
quality standards.
14<br />
<strong>ShawCor</strong> Ltd. Technological Innovation<br />
THE SHAWCOR DIFFERENCE<br />
Technological Innovation<br />
<strong>ShawCor</strong>’s ability to answer new challenges in the continuously<br />
evolving search for additional energy resources is based on a strong<br />
foundation of technological leadership and innovation. Today,<br />
we hold 203 enforceable patents with an additional 15 patents<br />
applied for and nine new patents granted or allowed during 2011<br />
in the fields of adhesive technology, anticorrosion science, flow<br />
assurance/thermal design, polymer compounding, crosslinking of<br />
polymers and specialized concrete systems.
ANNUAL REPORT 2011 <strong>ShawCor</strong> Ltd.<br />
15<br />
At <strong>ShawCor</strong>, research and development plays a crucial role in our ability to<br />
keep pace with growing demands for new product technologies. As the search<br />
for energy continues to push the boundaries of new frontiers, our customers<br />
are looking for products that can perform in more extreme environments,<br />
reduce long-term operating costs and minimize environmental risk. In 2011,<br />
we continued to answer those needs.<br />
<strong>The</strong> world’s subsea hydrocarbon deposits are an increasingly important source<br />
of energy production and a growing focus for the industry’s major exploration<br />
and production companies. <strong>The</strong>se subsea deposits contain more than<br />
200 billion barrels of recoverable reserves according to recent estimates by<br />
the International Energy Agency. At the same time, access to these deposits<br />
has been made possible by the development of new technologies that have<br />
allowed drilling at unprecedented depths.<br />
Technology for new frontiers<br />
A next generation insulation system with unlimited depth capability,<br />
<strong>ShawCor</strong>’s <strong>The</strong>rmotite® ULTRA TM integrated coating and protection<br />
system is enabling energy companies to access reserves beyond the reach<br />
of conventional technology. During the past year, <strong>ShawCor</strong> delivered its<br />
<strong>The</strong>rmotite® ULTRA TM insulation system for use on the ENI Norge Goliat<br />
Project. One of the first offshore developments in Norway’s frigid Barents<br />
Sea, Goliat represents a significant technological challenge owing to its depth<br />
(up to 1,800 metres below the surface of the ocean), the unusually shallow<br />
formation and thus the low temperature of the deposit. Such factors make<br />
the performance of the pipeline insulation system a vital element in the<br />
performance of the entire field.<br />
In 2011, <strong>ShawCor</strong> strengthened its leadership in this important energy frontier<br />
with the commissioning of our new Subsea Test Facility with its Simulated<br />
Service Vessel (SSV) in Toronto, Ontario. This remarkable 82-tonne vessel<br />
allows us to thoroughly test and verify the<br />
thermal, compression resistance and flow<br />
assurance capabilities of newly developed<br />
insulation coatings and joint protection<br />
systems at an equivalent water depth up to<br />
3,000 metres and an internal pipe temperature<br />
up to 180 °C. Capable of testing pipe samples<br />
up to 6.0 metres in length and 910 mm<br />
(36 inches) in diameter, the SSV is the<br />
largest and most advanced vessel of its kind<br />
in the industry as confirmed by the receipt<br />
of a Spotlight on New Technology Award at<br />
this year’s Offshore Technology Conference in<br />
Houston, Texas. Commissioning the <strong>ShawCor</strong><br />
Subsea Test Facility is just the latest step in<br />
Each year, the Offshore<br />
Technology Conference<br />
recognizes outstanding<br />
achievements to the offshore<br />
exploration and production<br />
industry with the Spotlight on<br />
New Technology Award.<br />
Volatile weather conditions in the North Sea make exploration, drilling and the<br />
construction of pipelines challenging.
16 <strong>ShawCor</strong> Ltd. Technological Innovation<br />
Our Subsea Test Facility and Simulated Service Vessel (SSV),<br />
the industry’s largest and most technologically advanced, allow<br />
<strong>ShawCor</strong> and its energy industry customers to thoroughly test the<br />
thermal, compression resistance and flow assurance capabilities of<br />
newly developed insulation coatings and joint protection systems<br />
before critical pipelines are installed.<br />
our commitment to provide end-to-end<br />
pipeline solutions that meet or exceed<br />
customer needs for the deepest and most<br />
extreme subsea operating conditions.<br />
During 2011, the SSV played a key role<br />
in the development and testing of pipe<br />
coatings and joint systems in connection<br />
with our success in winning several major<br />
pipeline contracts including Chevron’s<br />
Jack/St. Malo Project, the first project for<br />
the Company’s Brigden portable plant,<br />
which involved testing an end-to-end<br />
insulation system to a simulated water<br />
depth of over 2,000 metres.<br />
One of the advanced products that has<br />
been tested utilizing our sophisticated<br />
Flow Assurance testing capabilities is<br />
<strong>The</strong>rmotite® ULTRA TM , an innovative<br />
subsea insulation system with virtually<br />
unlimited depth capability that assures<br />
complete system integrity during service<br />
and reduced energy loss in steady state<br />
and transient conditions. Such qualities<br />
made <strong>The</strong>rmotite® ULTRA TM the coating<br />
system of choice for the ENI Norge Goliat<br />
Project and the winner of the<br />
International Pipe Line & Offshore<br />
Contractors Association’s 2011 New<br />
Technologies Award.<br />
We also continue to build upon our<br />
leadership in coating technology for<br />
new land-based pipelines as well as the<br />
growing market for pipeline rehabilitation.<br />
Recent failures in North America’s existing<br />
pipeline infrastructure, including numerous<br />
incidents during 2011, represent a growing<br />
area of need for <strong>ShawCor</strong>’s products and<br />
services. <strong>The</strong> majority of North America’s<br />
oil and gas pipelines were constructed<br />
prior to 1970. Back then, joints were<br />
sometimes protected with pitch or taped<br />
in a manner that could trap moisture and<br />
accelerate corrosion. <strong>The</strong> replacement and<br />
rehabilitation of aging legacy pipelines<br />
represents a potential multi-billion dollar<br />
opportunity for <strong>ShawCor</strong>. We are ready to<br />
take advantage of it with a new generation<br />
of high performance coating systems such<br />
as our High Performance Powder Coating<br />
(HPPC), which allowed <strong>ShawCor</strong> to secure<br />
the 82 kilometre 36 inch diameter Wood<br />
Buffalo project. Our Shaw Pipeline Services<br />
division, which provides ultrasonic and<br />
real time radiographic pipeline weld<br />
inspection services and our Canusa-CPS<br />
division which provides field applied<br />
joint protection systems, are also well<br />
positioned to benefit.<br />
<strong>ShawCor</strong>’s spirit of continuous innovation<br />
could also be seen at work in the<br />
introduction of innovative new products<br />
from Flexpipe Systems. Advances in<br />
horizontal drilling and fracking technology<br />
are driving increasing levels of drilling<br />
activity in North America, from mature<br />
energy basins to new shale resources.<br />
Flexpipe continued to earn a larger share<br />
of these markets in 2011, aided by growing<br />
service capabilities and the successful<br />
commercialization of two innovative<br />
new products.<br />
Top: Shaw Pipeline Services’ proven HDUT<br />
technology provides state-of-the-art mechanized<br />
ultrasonic testing technology for the complete<br />
inspection of pipeline girth-welds.<br />
Bottom: Canusa-CPS' IntelliCOAT TM is the<br />
world’s first fully automated system for the<br />
application of heat shrinkable sleeves, providing<br />
unprecedented precision, consistency and<br />
speed of operation for contractors and<br />
other customers.<br />
FlexPipe HT High Temperature Linepipe<br />
can easily withstand the continuous<br />
service temperatures of up to 82°C<br />
found in deeper oil and gas reservoirs<br />
with the same corrosion resistance and<br />
installation benefits of conventional
ANNUAL REPORT 2011 <strong>ShawCor</strong> Ltd.<br />
17<br />
58%<br />
Folore nis nonum autat ut<br />
feugiat umsandignim odignim<br />
Ichthys utat borum ipismolore miniat. Ibidus et<br />
prat.Erosto ea consed enim quissed dipit feugiat<br />
ullam blandips.<br />
Subsea Test Facility and Simulated Service Vessel.<br />
FlexPipe Linepipe. FlexCord Linepipe also<br />
delivers the same corrosion resistance<br />
and installation benefits as FlexPipe<br />
Linepipe, but is engineered to handle the<br />
high cyclic pressure associated with water<br />
Flexpipe Systems’ new “reel-less” packaging<br />
system delivers pipe faster and allows more<br />
efficient deployment of product on site while<br />
reducing logistics costs.<br />
injection and other positive displacement<br />
pump applications. <strong>The</strong>se products have<br />
filled important customer needs while<br />
strengthening the company’s position as<br />
a single source provider.<br />
<strong>The</strong> same spirit of innovation is also<br />
helping Flexpipe Systems find more<br />
efficient ways to service its customers.<br />
<strong>The</strong> past year witnessed the introduction<br />
of a radical new package design, coined<br />
“reel-less pipe”, that offers significant<br />
advantages over previous shipping<br />
methods. This customized deployment<br />
technology accommodates 25 percent<br />
more product per truckload while<br />
significantly improving speed of<br />
deployment on site.<br />
<strong>ShawCor</strong>’s ability to anticipate and satisfy<br />
the evolving product requirements of<br />
our global energy customers depends<br />
on our strong commitment to research<br />
and development. Today, each of our<br />
seven business units uses industry<br />
leading technologies thanks to a common<br />
commitment to excellence and the<br />
extraordinary contributions of <strong>ShawCor</strong>’s<br />
research and product development<br />
professionals. In addition to the divisions’<br />
product development activities, we employ<br />
more than 25 scientists at the Company’s<br />
central research facilities, whose work has<br />
set <strong>ShawCor</strong> apart with 203 enforceable<br />
patents and an additional 15 patents<br />
applied for and nine new patents granted<br />
or allowed during 2011. As the search for<br />
new energy sources continues to challenge<br />
the ingenuity of the world’s major energy<br />
producers, <strong>ShawCor</strong> will be ready with<br />
the high performance products and<br />
environmentally responsible solutions<br />
our customers need.
18<br />
<strong>ShawCor</strong> Ltd. organizational excellence<br />
THE SHAWCOR DIFFERENCE<br />
Organizational Excellence<br />
<strong>The</strong> quality and determination of our people, and the alignment of<br />
their efforts in pursuit of individual and organizational excellence,<br />
have always been the foundation of <strong>ShawCor</strong>’s development and<br />
success. Thanks to their efforts, we continue to build upon our<br />
reputation as a global and market leader in our chosen businesses.
ANNUAL REPORT 2011 <strong>ShawCor</strong> Ltd.<br />
19<br />
At <strong>ShawCor</strong>, we believe that our success depends on becoming a higher<br />
performing organization every year. Since 2008, we have measured our<br />
performance against a common set of objectives across all of our operations.<br />
Our overarching aim is to ensure that all executives, managers and other<br />
staff are aligned in the pursuit of common strategies for growth, innovation,<br />
execution, people and leadership. We keep track of our progress by<br />
establishing and linking the personal objectives of more than 1,500 people<br />
in the organization with quantifiable performance metrics tied to <strong>ShawCor</strong>’s<br />
corporate and divisional objectives. Today, each of them has direct,<br />
line-of-sight metrics supporting the company’s strategic objectives with<br />
closely related, merit-based compensation programs that reward individual<br />
and collective accomplishments.<br />
<strong>The</strong>se efforts are complemented by<br />
participation in industry forums and<br />
company activities that promote continuous<br />
organizational improvement. In October 2011,<br />
85 executives and managers from all <strong>ShawCor</strong><br />
divisions attended the annual Association for<br />
Manufacturing Excellence (AME) conference in<br />
Dallas, Texas. AME is North America’s leading<br />
forum for the exchange of best practices in<br />
organizational excellence with <strong>ShawCor</strong> playing<br />
a prominent role in the association’s activities<br />
each year. <strong>The</strong> AME conference also serves<br />
as an ideal backdrop for our own professional<br />
development, awards presentations and planning<br />
activities. At a private lunch held during this year’s<br />
Non-manufacturing operations<br />
will be implementing<br />
SMS in 2012.<br />
conference, <strong>ShawCor</strong> launched the SMS Program and Strategies 2012 with<br />
the support of best practice presentations delivered by representatives from<br />
each division. This year’s exchange celebrated new performance milestones<br />
achieved through SMS and outlined key initiatives for the current year,<br />
including the migration of SMS into non-manufacturing areas of our business.<br />
Aiming higher at Ras Al Khaimah<br />
Bredero Shaw’s Ras Al Khaimah (RAK) pipe coating plant in the United Arab<br />
Emirates distinguished itself with two awards in 2011 for SMS Achievement<br />
and SMS Safety Performance. Among the facility’s most impressive<br />
accomplishments were a record 87 percent compliance score on the SMS<br />
Audit, a 35 percent reduction in material waste, a 58 percent decrease in<br />
changeover times and a Total Recordable Case Frequency rate of zero.<br />
Co-workers share issues and concerns at the Daily Management Process board,<br />
a universal element of the <strong>ShawCor</strong> Management System.
<strong>Financial</strong> Strength<br />
REVENUE<br />
(in millions of Canadian dollars)<br />
CAPITAL EXPENDITURES<br />
AND AMORTIZATION<br />
(in millions of Canadian dollars)<br />
1,400<br />
1,200<br />
1,000<br />
100<br />
90<br />
80<br />
70<br />
Capital Expendituresp<br />
Amortizationp<br />
800<br />
600<br />
60<br />
50<br />
40<br />
400<br />
30<br />
200<br />
20<br />
10<br />
02 03 04 05 06 07 08 09 10 11<br />
02 03 04 05 06 07 08 09 10 11<br />
CAPITALIZATION<br />
(in millions of Canadian dollars)<br />
INCOME FROM CONTINUING<br />
OPERATIONS<br />
(in millions of Canadian dollars)<br />
1,000<br />
900<br />
Shareholders Equityp<br />
Long-term Debtp<br />
150<br />
135<br />
800<br />
120<br />
700<br />
105<br />
600<br />
90<br />
500<br />
75<br />
400<br />
60<br />
300<br />
45<br />
200<br />
30<br />
100<br />
15<br />
02 03 04 05 06 07 08 09 10 11<br />
02 03 04 05 06 07 08 09 10 11
ANNUAL REPORT 2011 <strong>ShawCor</strong> Ltd.<br />
21<br />
<strong>Financial</strong> Review<br />
Management’s Discussion and Analysis 22<br />
1.0 Executive Overview 22<br />
1.1 Core Businesses 22<br />
1.2 Vision and Objectives 23<br />
1.3 Key Performance Drivers 24<br />
1.4 Key Performance Indicators 24<br />
1.5 Capability to Deliver Results 25<br />
2.0 <strong>Financial</strong> Highlights 27<br />
2.1 Selected Annual Information 27<br />
2.2 Foreign Exchange Impact 28<br />
3.0 Significant Business Developments 28<br />
4.0 Results from Operations 30<br />
4.1 Consolidated Information 30<br />
4.2 Segment Information 31<br />
5.0 Liquidity and Capitalization 33<br />
5.1 Cash Provided by Operating Activities 33<br />
5.2 Cash Used in Investing Activities 33<br />
5.3 Cash Used in Financing Activities 33<br />
5.4 Liquidity and Capital<br />
Resource Measures 33<br />
5.5 Credit Facilities 34<br />
5.6 Future Uses of Liquidity 35<br />
5.7 <strong>Financial</strong> Instruments 36<br />
5.8 Outstanding Share Capital 38<br />
6.0 Quarterly Selected<br />
<strong>Financial</strong> Information 38<br />
7.0 Off-Balance Sheet Arrangements 39<br />
8.0 Critical Accounting Estimates and<br />
Accounting Policy Developments 39<br />
8.1 Critical Accounting Estimates 39<br />
8.2 Accounting Standards Issued<br />
but Not Yet Applied 40<br />
8.3 First Time Adoption of IFRS 42<br />
9.0 Disclosure Controls and Internal<br />
Controls over <strong>Financial</strong> Reporting 48<br />
10.0 General Outlook 48<br />
11.0 Risks and Uncertainties 50<br />
11.1 Economic Risks 50<br />
11.2 Litigation and Legal Risks 51<br />
11.3 HSE Risks 52<br />
11.4 Political and Regulatory Risks 52<br />
12.0 Environmental Matters 53<br />
13.0 Reconciliation of<br />
Non-GAAP Measures 53<br />
14.0 Forward Looking Information 55<br />
Management’s Responsibility<br />
for <strong>Financial</strong> Statements 57<br />
Independent Auditors’ Report 58<br />
Consolidated Balance Sheets 59<br />
Consolidated Statements of Income 60<br />
Consolidated Statements of<br />
Comprehensive Income 61<br />
Consolidated Statement of<br />
Changes in Shareholders’ Equity 61<br />
Consolidated Statements of Cash Flow 62<br />
Notes to the Consolidated<br />
<strong>Financial</strong> Statements 63<br />
Six-Year Review 105<br />
Quarterly Information 105<br />
<strong>ShawCor</strong> Directors 106<br />
Corporate Governance 107<br />
Primary Operating Locations 108<br />
Corporate Information<br />
IBC
22 <strong>ShawCor</strong> Ltd. Management's discussion and analysis<br />
Management’s Discussion and Analysis<br />
<strong>The</strong> following Management’s Discussion and Analysis (“MD&A”) is a discussion of the consolidated financial position and results of operations<br />
of <strong>ShawCor</strong> Ltd. (“<strong>ShawCor</strong>” or the “Company”) for the years ended December 31, 2011 and 2010 and should be read together with <strong>ShawCor</strong>’s<br />
audited Consolidated <strong>Financial</strong> Statements for the same periods. All dollar amounts in this MD&A are in thousands of Canadian dollars except<br />
per share amounts or unless otherwise stated.<br />
This MD&A and the Consolidated <strong>Financial</strong> Statements and comparative information have been prepared in accordance with International<br />
<strong>Financial</strong> Reporting Standards (“IFRS”) as issued by the International Accounting Standards Board. For all periods up to and including the year<br />
ended December 31, 2010, we prepared our Consolidated <strong>Financial</strong> Statements in accordance with Canadian Generally Accepted Accounting<br />
Principles (“CGAAP”). Pursuant to the standard related to the first time adoption of IFRS, our transition date to IFRS was January 1, 2010<br />
and therefore the comparative information for 2010 has been restated to be in accordance with our IFRS accounting policies. <strong>The</strong> financial<br />
information for years prior to 2010 contained within this MD&A has been prepared following CGAAP and, as allowed by the standard related<br />
to the first time adoption of IFRS (“IFRS 1”), has not been re-presented on an IFRS basis. Certain amounts in prior years have been reclassified<br />
to conform to the current year’s IFRS presentation format.<br />
1.0 Executive Overview<br />
<strong>ShawCor</strong> is a growth oriented, global energy services company serving the Pipeline and Pipe Services and the Petrochemical and<br />
Industrial segments of the energy industry. <strong>The</strong> Company operates seven divisions with over 70 manufacturing and service facilities<br />
located around the world. <strong>The</strong> Company is publicly traded on the Toronto Stock Exchange (“TSX”).<br />
1.1 Core Businesses<br />
<strong>ShawCor</strong> provides a broad range of products and services, which include high quality pipe coating services, flexible composite pipe,<br />
onshore and offshore pipeline corrosion and thermal protection, state-of-the-art ultrasonic and radiographic inspection services,<br />
tubular management services, heat-shrinkable polymer tubing and control and instrumentation wire and cable.<br />
<strong>The</strong> Company and its predecessors have designed, engineered, marketed and sold these products and services worldwide for over<br />
50 years. <strong>ShawCor</strong> has made substantial investments in research and development (“R&D”) initiatives and earned strong customer<br />
loyalty based on a history of project execution success.<br />
<strong>The</strong> Company operates in a highly competitive international business environment with its success attributed to its strategic global<br />
locations, its extensive portfolio of proprietary technologies and its commitment to the use of industry-leading business processes<br />
and programs. <strong>ShawCor</strong> is the world’s largest applicator of pipeline coatings for the oil and gas industry for both onshore and<br />
offshore pipelines.<br />
<strong>The</strong> primary driver of demand for the Company’s products and services is the level of energy industry investment in pipeline<br />
infrastructure for hydrocarbon development and transportation around the globe. This investment, in turn, is driven by global<br />
levels of economic activity and the resulting growth in hydrocarbon demand, the impact of resource depletion on the supply<br />
of hydrocarbons and the financial position of the major energy companies. <strong>The</strong> relationship between global hydrocarbon demand<br />
and supply and the level of energy industry investment in infrastructure tends to be cyclical.<br />
As at December 31, 2011, the Company operated its seven divisions through two reportable operating segments: Pipeline and Pipe<br />
Services; and Petrochemical and Industrial.
ANNUAL REPORT 2011 <strong>ShawCor</strong> Ltd.<br />
23<br />
Pipeline and Pipe Services<br />
<strong>The</strong> Pipeline and Pipe Services segment is the largest segment of the Company and accounted for 88% of consolidated revenue for<br />
the year ended December 31, 2011. This segment includes the Bredero Shaw, Canusa–CPS, Shaw Pipeline Services, Flexpipe Systems<br />
and Guardian divisions.<br />
• Bredero Shaw’s product offerings include specialized internal anticorrosion and flow efficiency pipe coating systems, insulation<br />
coating systems, weight coating systems and custom coating and field joint application services for onshore and offshore<br />
pipelines.<br />
• Canusa–CPS manufactures heat-shrinkable sleeves, adhesives, sealants and liquid coatings for corrosion protection on onshore<br />
and offshore pipelines.<br />
• Shaw Pipeline Services provides ultrasonic and radiographic pipeline girth weld inspection services to pipeline operators and<br />
construction contractors worldwide for both onshore and offshore pipelines.<br />
• Flexpipe Systems manufactures spoolable composite pipe systems used for oil and gas gathering, water disposal, carbon dioxide<br />
injection pipelines and other applications requiring corrosion resistance and high pressure capabilities.<br />
• Guardian provides a complete range of tubular management services including inventory management systems, mobile<br />
inspection, in-plant inspection and the refurbishment and rethreading of drill pipe, production tubing and casing.<br />
Petrochemical and Industrial<br />
<strong>The</strong> Petrochemical and Industrial segment, which includes the DSG–Canusa and ShawFlex divisions, accounted for 12% of<br />
consolidated revenue for the year ended December 31, 2011. Operations within this segment utilize polymer and adhesive<br />
technologies that were developed for the Pipeline and Pipe Services segment and are now being applied to applications in<br />
Petrochemical and Industrial markets.<br />
• DSG–Canusa is a global manufacturer of heat-shrinkable products including thin, medium and heavy-walled tubing, sleeves<br />
and molded products as well as heat-shrink accessories and equipment.<br />
• ShawFlex is a manufacturer of wire and cable for control, instrumentation, thermocouple, power, marine and robotics<br />
applications.<br />
1.2 Vision and Objectives<br />
<strong>ShawCor</strong>’s vision and business strategy is to be the market leader and technology innovator with a primary focus on the global<br />
pipeline industry and to use this base as a platform to build an international energy services company while achieving the following<br />
key performance objectives:<br />
• generate a Return on Equity (“ROE”) of 15% over the full business cycle;<br />
• generate average annual net income growth of 15% over the full business cycle;<br />
• continuously improve on an industry leading health, safety and environmental (“HSE”) management system to support<br />
the Company’s commitment to an Incident and Injury Free (“IIF”) workplace;<br />
• maintain a strong market share with each division being number one or a strong number two in its respective market;<br />
• achieve flawless execution supported by clear lines of accountability and responsibility;<br />
• increase the flow of new products using the New Product Development (“AFPD”) system to achieve a minimum of 20%<br />
of revenue from new products introduced within the current or previous two years;<br />
• achieve lowest cost producer status using the <strong>ShawCor</strong> Manufacturing System (“SMS”) program combined with effective<br />
global procurement;<br />
• provide a reliable organization based on best practices in governance, financial control and business processes; and<br />
• provide a workplace and career growth environment that will attract and retain top calibre employees who are essential<br />
to achieving the corporate growth and profitability objectives.
24 <strong>ShawCor</strong> Ltd. Management's discussion and analysis<br />
1.3 Key Performance Drivers<br />
<strong>The</strong> Company believes the following key performance drivers are critical to the success of its businesses:<br />
• demand for the Company’s products and services that is primarily determined by investment in new energy infrastructure<br />
necessary to supply global energy needs;<br />
• current and forecasted oil and gas commodity prices and availability of capital to enable customers to finance energy<br />
infrastructure investment;<br />
• the Company’s competitive position globally and its ability to maintain operations in each of the major oil and gas producing<br />
regions;<br />
• the Company’s technology and its ability to research and commercialize innovative products that provide added value to<br />
customers and provide competitive differentiation;<br />
• the Company’s operational effectiveness and its ability to maintain efficient utilization of productive capacity at each geographic<br />
location;<br />
• access to capital and maintenance of sufficient available liquidity to support continuing operations and finance growth activities;<br />
• the ability to identify and execute successful business acquisitions that result in strategic global growth; and<br />
• the ability to attract and retain key personnel.<br />
1.4 Key Performance Indicators<br />
Several of the drivers identified above are beyond the Company’s control; however, there are certain key performance indicators that<br />
the Company utilizes to monitor its progress in achieving its vision and performance objectives. <strong>The</strong>se indicators are detailed below.<br />
Certain of the following key performance indicators used by <strong>ShawCor</strong> are not measurements in accordance with Generally Accepted<br />
Accounting Principles (“GAAP”) and should not be considered as an alternative to net income or any other measure of performance<br />
under GAAP. Refer to section 13 – Reconciliation of Non-GAAP Measures, for additional information with respect to Non-GAAP<br />
measures used by the Company.<br />
Net Income Growth<br />
As part of its performance objectives, the Company has set a goal for average annual net income growth of 15% over the full<br />
business cycle, as described in section 1.2 – Vision and Objectives. Net income (attributable to shareholders of the Company)<br />
decreased by $39.0 million, or 41%, from $95.1 million for the year ended December 31, 2010 to $56.1 million for the year ended<br />
December 31, 2011. <strong>The</strong> decrease was mainly attributable to lower revenue in the Asia Pacific and Latin America regions in the<br />
Pipeline and Pipe Services segment as described in section 4.2.1 – Pipeline and Pipe Services segment, an increase in selling, general<br />
and administrative (“SG&A”) expenses as described in section 4.1 – Consolidated Information and the accounting gain on acquisition<br />
of $13.2 million recorded in 2010.<br />
Return on Equity (“ROE”)<br />
ROE is defined as net income for the year divided by average shareholders’ equity for the most recently completed year. ROE is<br />
used by the Company to assess the efficiency of generating profits from each unit of shareholders’ equity. As part of its performance<br />
objectives, the Company has set a ROE target of 15%, as described in section 1.2 – Vision and Objectives. <strong>The</strong> Company’s ROE for<br />
the years ended December 31, 2011 and 2010 was 6.7% and 11.7%, respectively. <strong>The</strong> decrease of 5.0 percentage points was primarily<br />
due to a decrease in net income of $38.4 million and an increase in average shareholders’ equity of $36.5 million.<br />
Free Cash Flow (“FCF”)<br />
FCF is defined as cash flow from operating activities less capital expenditures and dividend payments during the year. FCF represents<br />
the cash available from operations after spending on maintenance of existing assets and expanding the current asset base and is<br />
a measure of the Company’s ability to generate cash flow to fund growth. FCF decreased by $16.6 million from a negative cash<br />
outflow of $15.9 million during 2010 to a negative cash outflow of $32.6 million during 2011. <strong>The</strong> change was primarily due to lower<br />
cash provided by operating activities of $7.9 million, an increase in capital expenditures of $7.3 million and an increase in dividends<br />
paid of $1.5 million.
ANNUAL REPORT 2011 <strong>ShawCor</strong> Ltd.<br />
25<br />
Employees<br />
<strong>The</strong> Company conducts periodic employee surveys and monitors turnover in key personnel positions in order to assess<br />
employee engagement.<br />
Market Position<br />
<strong>The</strong> Company’s record of successful project execution and the resulting repeat business demonstrate customer loyalty, which is one<br />
of many qualitative measures that the Company utilizes to measure customer satisfaction.<br />
<strong>The</strong> following table sets forth the relative market position by division within the markets that the Company operated in during the<br />
year ended December 31, 2011:<br />
Bredero Shaw<br />
Canusa–CPS<br />
Shaw Pipeline Services<br />
Flexpipe Systems<br />
Guardian<br />
DSG–Canusa<br />
ShawFlex<br />
Market Position<br />
First<br />
First<br />
First<br />
Second<br />
First<br />
Second<br />
First<br />
Safety and Environmental Stewardship<br />
<strong>The</strong> Company maintains a comprehensive Health, Safety and Environmental (“HSE”) management system in place within each<br />
of its seven operating divisions and is committed to being an Incident and Injury Free (“IIF”) workplace with no damage to the<br />
environment. For the years ended December 31, 2011 and December 31, 2010, the Company had recordable injuries per million<br />
person hours worked of 6.7 and 7.3, respectively. During 2011, the Company completed 29 HSE audits at manufacturing and<br />
service locations across all seven divisions and developed action plans to correct any deficiencies identified in the audits.<br />
1.5 Capability to Deliver Results<br />
Capital Resources<br />
<strong>The</strong> Company operates in the global energy industry and, as a result, the operations of the Company tend to be cyclical. In addition,<br />
the Company can undertake major pipe coating projects anywhere in the world as part of its normal operations. <strong>The</strong>se factors,<br />
as well as the Company’s growth initiatives, can result in variations in the amount of investment in property, plant and equipment,<br />
working capital and project guarantees required to support the Company’s businesses. <strong>The</strong> Company’s policy is to manage its<br />
financial resources, including debt facilities, so as to maintain sufficient financial capacity to fund these investment requirements.<br />
Capital expenditures increased by $7.3 million from $48.7 million for the year ended December 31, 2010 to $56.0 million for the year<br />
ended December 31, 2011. <strong>The</strong> Company believes it has sufficient available resources and capacity to meet the market demand for<br />
its products and services in the markets where the Company operates. <strong>The</strong> Company may, however, incur new capital expenditures<br />
to facilitate growth in new markets.<br />
<strong>The</strong> current level of working capital investment is expected to be sufficient to support the level of business activity projected in<br />
2012; however, unexpected increases in business activity or specific pipe coating project requirements may result in higher working<br />
capital requirements. Any such increase in requirements will be financed from the Company’s cash balances and available<br />
committed credit facilities. <strong>The</strong> Company had cash and cash equivalents of $67.3 million and $156.0 million as at December 31, 2011<br />
and 2010, respectively, and had unutilized lines of credit available of $162.3 million and $164.9 million, as at December 31, 2011<br />
and 2010, respectively.<br />
<strong>The</strong> current financial position of the Company is strong and the Company does not foresee any difficulties in maintaining a sufficient<br />
level of financial capacity to execute the Company’s growth strategy.<br />
Please refer to section 5 – Liquidity and Capitalization, for additional information with respect to the Company’s liquidity and<br />
financial position.
26 <strong>ShawCor</strong> Ltd. Management's discussion and analysis<br />
Non-Capital Resources<br />
<strong>The</strong> Company considers its people as the most significant non-capital resource required in order to achieve the vision and objectives<br />
identified above. <strong>The</strong> Company’s executives are comprised of senior business leaders who bring a broad range of experience and<br />
skill sets in the oil and gas industry, finance, tax, law and corporate governance. <strong>The</strong> leadership team’s experience, combined with<br />
the employees’ knowledge and dedication to excellence, has resulted in a long history of proven financial success and stability, with<br />
the resulting creation of value for the Company’s stakeholders.<br />
On an ongoing basis, the Company monitors its succession planning program in order to mitigate the impact of planned or<br />
unplanned departures of key personnel. As at December 31, 2011, the Company believes it has sufficient human resources to operate<br />
its businesses at an optimal level and execute its strategic plan.<br />
Systems and Processes<br />
Management regularly reviews the Company’s operational systems and processes and develops new ones as required. Key<br />
operational programs utilized by the Company during the year ended December 31, 2011 included systems and controls over project<br />
bidding, capital expenditures, internal controls over financial reporting, product development, HSE management and human resource<br />
development. In addition, the <strong>ShawCor</strong> Manufacturing System (“SMS”) program has been implemented to increase operating<br />
efficiency and achieve significant cost savings in each of the Company’s seven divisions.<br />
As at December 31, 2011, the Company believes it has sufficient systems and processes in place to operate its businesses at an<br />
optimal level and execute its strategic plan.
ANNUAL REPORT 2011 <strong>ShawCor</strong> Ltd.<br />
27<br />
2.0 <strong>Financial</strong> Highlights<br />
2.1 Selected Annual Information<br />
<strong>The</strong> following sets forth the Company’s financial highlights for the years ended December 31:<br />
(in thousands of Canadian dollars) 2011 2010 2009 (c)<br />
Revenue $ 1,157,265 $ 1,034,163 $ 1,183,978<br />
Cost of goods sold 734,730 623,641 695,521<br />
Gross profit $ 422,535 $ 410,522 $ 488,457<br />
Selling, general and administrative expenses 269,241 219,084 219,557<br />
Research and development expenses 13,119 11,050 10,967<br />
Foreign exchange (gains) losses 1,338 (5,647) 3,790<br />
Amortization of property, plant and equipment 41,906 45,077 57,244<br />
Amortization of intangible assets 7,244 5,038 4,380<br />
Impairment of property, plant and equipment, intangible assets and goodwill 5,244 16,089 –<br />
Income from Operations $ 84,443 $ 119,831 $ 192,519<br />
Accounting gain on acquisition – (13,181) –<br />
Loss on investment in associate 10,133 1,939 –<br />
Finance costs – net 4,507 2,805 4,672<br />
Income before income taxes and non-controlling interest $ 69,803 $ 128,268 $ 187,847<br />
Income taxes 13,120 33,196 56,397<br />
Non-controlling interest 597 – –<br />
Net Income (attributable to shareholders of the Company) $ 56,086 $ 95,072 $ 131,450<br />
Net Income (attributable to shareholders of the Company) $ 56,086 $ 95,072 $ 131,450<br />
Add:<br />
Non-controlling interest 597 – –<br />
Income taxes 13,120 33,196 56,397<br />
Finance costs – net 4,507 2,805 4,672<br />
Impairment of property, plant and equipment, intangible assets and goodwill 5,244 16,089 –<br />
Amortization of property, plant, equipment and intangible assets 49,150 50,115 61,624<br />
Accounting gain on acquisition – (13,181) –<br />
Loss on investment in associate 10,133 1,939 –<br />
EBITDA (a) $ 138,837 $ 186,035 $ 254,143<br />
Per Share Information:<br />
Net Income<br />
Basic (Classes A and B) 0.79 1.35 1.86<br />
Diluted (Classes A and B) 0.78 1.33 1.85<br />
Total Assets $ 1,223,265 $ 1,224,936 $ 1,194,027<br />
Total Non-current Liabilities (b) $ 110,445 $ 121,336 $ 128,167<br />
(a) Earnings before interest, income taxes, depreciation and amortization (“EBITDA”) is a Non-GAAP measure and should not be considered as an alternative to net<br />
income or any other measure of performance under GAAP. Refer to section 13 – Reconciliation of Non-GAAP Measures, for additional information with respect to<br />
Non-GAAP measures used by the Company.<br />
(b) Includes the Company’s non-current portion of long-term debt, non-current provisions, deferred income taxes, non-current derivative financial instruments and the<br />
non-current portion of obligations under finance leases.<br />
(c) <strong>Financial</strong> highlights for the Statement of Income and the Schedule of EBITDA for the year ended December 31, 2009 have been prepared under CGAAP.<br />
Revenue<br />
Revenue increased by $123.1 million, or 12%, from $1,034.2 million in 2010 to $1,157.3 million in 2011, primarily as a result<br />
of increased market activity in both the Pipeline and Pipe Services segment and the Petrochemical and Industrial segment (refer<br />
to section 4.2 – Segment Information for further details), partly offset by the unfavourable effects of foreign exchange fluctuations<br />
(refer to section 2.2 – Foreign Exchange Impact).
28 <strong>ShawCor</strong> Ltd. Management's discussion and analysis<br />
Income from Operations<br />
Income from operations decreased by $35.4 million, or 30%, from $119.8 million in 2010 to $84.4 million in 2011. Revenue increased<br />
$123.1 million as explained above, with an increase in gross profit of $12.0 million and lower impairment charges on property, plant,<br />
equipment, goodwill and intangible assets of $10.8 million offset by increased foreign exchange losses of $7.0 million, an increase<br />
in research and development expenses of $2.1 million and an increase in SG&A expenses of $50.2 million.<br />
Net Income<br />
Net income (attributable to shareholders of the Company) decreased by $39.0 million, or 41%, from $95.1 million in 2010 to<br />
$56.1 million in 2011. <strong>The</strong> decrease was primarily due to the decrease in income from operations as explained above, an accounting<br />
gain on acquisition of $13.2 million reported in 2010, a higher loss on investment in associate of $8.2 million, partially offset by<br />
a 7.1 percentage point reduction in the effective income tax rate from 25.9% in 2010 to 18.8% in 2011.<br />
2.2 Foreign Exchange Impact<br />
<strong>The</strong> following table sets forth the significant currencies in which the Company operates and the average year-to-date foreign<br />
exchange rates for these currencies versus Canadian dollars, for the following periods:<br />
Year Ended Year Ended<br />
December 31 December 31<br />
2011 2010<br />
US Dollar 0.9931 1.0351<br />
Euro 1.3750 1.3785<br />
British Pound 1.5854 1.5987<br />
<strong>The</strong> following table sets forth the impact on revenue, income from operations and net income (attributable to shareholders<br />
of the Company), compared with the prior year period, as a result of foreign exchange fluctuations on the translation of foreign<br />
currency operations:<br />
Year Ended<br />
D december 31<br />
(in thousands of Canadian dollars) 2011<br />
Revenue $ (22,378)<br />
Income from operations (4,560)<br />
Net income (attributable to shareholders of the Company) (3,430)<br />
<strong>The</strong> Company recorded a foreign exchange loss of $1.3 million in 2011 compared to a gain of $5.6 million in 2010, as a result of the<br />
impact of changes in foreign exchange rates on monetary assets and liabilities and short-term foreign currency intercompany loans<br />
within the group, net of hedging activities.<br />
3.0 Significant Business Developments<br />
Acquisition of CSI<br />
On April 6, 2011, the Company acquired certain of the coating assets and business of Altus Energy Services Partnership, Altus<br />
Energy Services Ltd. and Nusco Northern Manufacturing Ltd. for $12.8 million. <strong>The</strong> assets purchased constitute a business as defined<br />
by IFRS 3, Business Combinations. <strong>The</strong> coating business, formerly known as CSI, and now known as <strong>ShawCor</strong> CSI Services (“CSI”)<br />
provides shop applied coatings at its modern facility in Nisku, Alberta and provides field coating services throughout western Canada.<br />
CSI specializes in the internal and external coating of bends, fittings, elbows and short spools of pipe including the internal corrosion<br />
coating of long straight lengths of pipe. <strong>The</strong> acquisition of the CSI assets will allow the Bredero Shaw division to supply a broad<br />
range of internal and external custom coating solutions in Canada that are complementary to its current range of anticorrosion, flow<br />
efficiency and insulation coatings for oil and gas gathering and transmission lines. This acquisition will also allow Bredero Shaw to<br />
provide a full range of custom coating solutions for pipeline rehabilitation applications.<br />
Investment in Socotherm S.p.A.<br />
On May 18, 2010, the Company announced that the Board of Directors of Socotherm S.p.A. (“Socotherm”) had accepted an offer<br />
from an investor group consisting of the Company and two private equity firms, 4D Global Energy Advisors of Paris, France and<br />
Sophia Capital of Buenos Aires, Argentina (the “Investor Group”) whereby the Investor Group would complete a share capital<br />
investment in Socotherm of €50 million and attain a 95% ownership interest in Socotherm. <strong>The</strong> Investor Group also entered into<br />
an undertaking to invest a further €25 million in Socotherm, if necessary, to discharge potential liabilities that arise subsequent to<br />
the completion of Socotherm’s court supervised restructuring. <strong>The</strong> Company’s interest in the Investor Group is 40%.
ANNUAL REPORT 2011 <strong>ShawCor</strong> Ltd.<br />
29<br />
On July 2, 2010, the Investor Group established a new entity, Fineglade Limited (Ireland) [“Fineglade”] to hold the proposed<br />
investment in Socotherm. Also on this date, the Investor Group capitalized Fineglade with €50 million and Fineglade transferred<br />
this amount into an escrow account, such funds to be released to Socotherm upon court approval of the share capital investment.<br />
<strong>The</strong> Company’s investment in Fineglade was €20 million ($25.7 million). <strong>The</strong> Company also entered into a shareholders’ agreement<br />
with the other shareholders of Fineglade that provides the Company with significant influence over the strategic operating,<br />
investing and financing activities of Fineglade, without having joint control. Furthermore, on August 17, 2010, the Company made<br />
an incremental investment in Fineglade of €4 million ($5.2 million) as its pro rata share of a secured bridge loan provided by<br />
Fineglade to Socotherm.<br />
On October 29, 2010, the Court of Vicenza issued a Homologation Decree that approved the share capital investment and the<br />
agreement between the Investor Group and Socotherm was subsequently completed. In November 2010, the Company injected<br />
an additional €2.6 million ($3.4 million) into Fineglade to discharge additional liabilities of Socotherm.<br />
During 2011, the Company invested an additional US$10.7 million ($10.5 million at the current exchange rates) in Fineglade<br />
as its pro rata share of a potential future capital increase by Fineglade in Socotherm and incurred an investment loss on its<br />
investment in Fineglade in the amount of $8.1 million.<br />
During the third quarter of 2011, the Company advanced a loan to Fineglade in the amount of US$8.5 million ($8.2 million at the<br />
then current exchange rate) with a maturity date of December 31, 2013. <strong>The</strong> interest rate on this loan is reset on a quarterly basis<br />
at the 3-month LIBOR rate + 2.0%.<br />
During the fourth quarter of 2011, the Company advanced another loan to Fineglade in the amount of US$2.0 million ($2.1 million<br />
at the then current exchange rate) payable on demand and bearing an upfront fee at 2%.<br />
Significant Business Contracts<br />
In October, 2011, the Company was awarded a contract with a value in excess of US$40.0 million from Subsea 7 to provide flow<br />
assurance pipeline coatings for subsea projects in the Norwegian sector of the North Sea. <strong>The</strong> work, consisting of coating in excess<br />
of 110 km of 6" to 16" pipe, will be executed at the Bredero Shaw pipe coating facility in Orkanger, Norway.<br />
In October and November, 2011, the Company was awarded two contracts to provide pipeline coatings and related products and<br />
services for the Wheatstone project, from Chevron Australia Pty. Ltd., with a combined value in excess of US$170 million. <strong>The</strong><br />
contracts involve coating approximately 300 km of 10" to 44" diameter pipe that will be protected with fusion bonded epoxy or<br />
three layer anticorrosion coatings, <strong>The</strong>rmotite® polypropylene insulation coating, SureFlo internal coatings and HeviCote® concrete<br />
weight coating. In addition, the Company has also received a contract for anode procurement and installation as well as custom<br />
coating. <strong>The</strong> contracts will be executed at the Bredero Shaw facilities in Kabil, Indonesia; Kuantan, Malaysia and Orkanger, Norway.<br />
Work will commence during the second quarter of 2012.<br />
In November, 2011, the Company was awarded the Barzan pipeline project in the Qatari sector of the Arabian Gulf from Hyundai<br />
Heavy Industries, with a value in excess of US$45 million, to provide corrosion protection and concrete weight coating. <strong>The</strong> contract<br />
will be executed at Bredero Shaw’s facility in Ras Al Khaimah in the United Arab Emirates and will involve coating of 292 km of up to<br />
24" pipe with fusion bonded epoxy anticorrosion coating and HeviCote® concrete weight coating. Work on this project is scheduled<br />
to commence late in the first quarter of 2012.<br />
In January, 2012, the Company was awarded a significant contract from Technip USA to provide concrete weight coatings, anode<br />
installation and other related services for a Latin American pipeline project, consisting of approximately 100 km of 36" pipe to<br />
be installed offshore for the transportation of natural gas. Bredero Shaw will mobilize two Compression Coat Technology (CCT)<br />
concrete weight coating plants to La Brea, Trinidad for this project. Initial operations are scheduled to commence during the first<br />
quarter of 2012, with concrete coating scheduled to start in the third quarter of 2012.<br />
In February, 2012, the Company was awarded the Ichthys LNG project by Mitsui & Co., with a value in excess of US$400 million,<br />
to provide pipeline coatings and related products and services for the gas export pipeline. <strong>The</strong> Ichthys LNG project is a joint venture<br />
between INPEX and Total. <strong>The</strong> contract involves coating 889 km of 42" pipe that will be protected with Asphalt Enamel coating,<br />
SureFlo internal coating and HeviCote® concrete weight coating. In addition, Bredero Shaw has received a contract for anode<br />
procurement and installation as well as custom coating. <strong>The</strong> Company will execute the work starting in the third quarter of 2012<br />
at Bredero Shaw’s facilities in Kabil, Indonesia and Kuantan, Malaysia.
30 <strong>ShawCor</strong> Ltd. Management's discussion and analysis<br />
Renewal of Normal Course Issuer Bid (“NCIB”)<br />
On November 30, 2011, the Company received approval from the TSX to renew its NCIB for an additional one year period expiring<br />
on November 30, 2012. Under the terms of the renewal, the Company is authorized to acquire, through the facilities of the TSX, up<br />
to 3,000,000 of the then issued and outstanding Class A Subordinate Voting Shares (the “Class A Shares”) and up to 100,000 of<br />
the then issued and outstanding Class B Multiple Voting Shares (the “Class B Shares”). <strong>The</strong>se two amounts comprised approximately<br />
5.81% and 9.36% of the public float outstanding as at December 31, 2011 for Class A Shares and Class B Shares, respectively. Daily<br />
purchases are limited to 27,449 Class A Shares and 1,000 Class B Shares, other than for block purchase exemptions. All Class A<br />
Shares and Class B Shares purchased under the NCIB will be cancelled. Please refer to section 5.8 – Outstanding Share Capital, for<br />
additional information with respect to the Company’s Class A Shares and Class B Shares.<br />
4.0 Results from Operations<br />
4.1 Consolidated Information<br />
Revenue<br />
<strong>The</strong> following table sets forth revenue by reportable operating segment for the years ended December 31:<br />
(in thousands of Canadian dollars) 2011 2010 Change<br />
Pipeline and Pipe Services $ 1,021,099 $ 920,157 $ 100,942<br />
Petrochemical and Industrial 138,080 115,783 22,297<br />
Elimination (1,914) (1,777) (137)<br />
Consolidated $ 1,157,265 $ 1,034,163 $ 123,102<br />
Consolidated revenue increased by $123.1 million, or 12%, from $1,034.2 million in 2010 to $1,157.3 million in 2011, due to growth<br />
of 11% in the Pipeline and Pipe Services segment and growth of 19% in the Petrochemical and Industrial segment.<br />
Revenue for the Pipeline and Pipe Services segment was $100.9 million higher in 2011 compared with 2010 due to higher revenue in<br />
North America and EMAR of $135.3 million and $57.1 million, respectively, which was partially offset by lower revenue in Asia Pacific<br />
and Latin America of $73.5 million and $17.9 million, respectively. See section 4.2.1 – Pipeline and Pipe Services segment for<br />
additional information with respect to the change in revenue in the Pipeline and Pipe Services segment.<br />
Revenue for the Petrochemical and Industrial segment reported strong growth in all regions. See section 4.2.2 – Petrochemical<br />
and Industrial segment for additional information with respect to the change in revenue in the Petrochemical and Industrial segment.<br />
Income From Operations (“Operating Income”)<br />
<strong>The</strong> following table sets forth income from operations and operating margin for the years ended December 31:<br />
(in thousands of Canadian dollars) 2011 2010 Change<br />
Income from operations $ 84,443 $ 119,831 $ (35,388)<br />
Operating margin (a) 7.3% 11.6% (4.3) points<br />
(a) Operating margin is defined as income from operations divided by revenue.<br />
Operating Income decreased by $35.4 million, or 30%, from $119.8 million in 2010 to $84.4 million in 2011, with an increase in gross<br />
profit of $12.0 million and lower impairment charges on property, plant, equipment, goodwill and intangible assets of $10.8 million,<br />
offset by increased foreign exchange losses of $7.0 million, an increase in research and development expenses of $2.1 million<br />
and an increase in SG&A expenses of $50.2 million.<br />
Higher revenue, as explained above, generated increased gross profit, which was somewhat mitigated by a reduction in the gross<br />
profit margin of 3.2 percentage points. <strong>The</strong> main factors in the gross profit margin reduction were the lower overhead absorption<br />
in Latin America and Asia Pacific due to low volumes and the inefficient utilization of the Leith, Scotland facility, which experienced<br />
significant downtime in the second and third quarters as a result of interruptions in the Laggan–Tormore project production schedule.<br />
SG&A expenses increased by $50.2 million compared with 2010 with three factors accounting for most of the increase. First, SG&A<br />
expenses were higher year over year as a result of increased salaries and other personnel related costs of $17.4 million, increased<br />
facility and occupancy costs of $6.2 million as a result of the acquisition of CSI in the beginning of the second quarter of 2011 and<br />
50% of the Brazilian joint venture in the third quarter of 2010 and other growth related additions. Second, 2011 SG&A expenses<br />
include one-time increases in pension expenses, decommissioning liabilities and inventory obsolescence of $14.2 million and an<br />
increase in the allowance for doubtful accounts related to a contract dispute with a customer of $9.6 million. Finally, the 2010<br />
SG&A expenses had been reduced by income under a management services contract, now discontinued, of $2.5 million.
ANNUAL REPORT 2011 <strong>ShawCor</strong> Ltd.<br />
31<br />
Finance Costs – Net<br />
<strong>The</strong> following table sets forth the components of finance costs – net for the years ended December 31:<br />
(in thousands of Canadian dollars) 2011 2010 Change<br />
Interest income on short-term deposits $ (1,024) $ (1,455) $ 431<br />
Interest expense, other 4,864 1,933 2,931<br />
Interest expense on long-term debt 667 2,327 (1,660)<br />
Finance costs – net $ 4,507 $ 2,805 $ 1,702<br />
<strong>The</strong> finance costs – net balance increased by $1.7 million, from $2.8 million in 2010 to $4.5 million in 2011, mainly due to higher<br />
accretion expense on certain non-current liabilities and lower interest income on short-term deposits, partially offset by a decrease<br />
in the interest expense on long-term debt of $1.7 million.<br />
Income Taxes<br />
<strong>The</strong> Company recorded an income tax expense of $13.1 million (19% of income before income taxes) for the year ended<br />
December 31, 2011, compared to income tax expense of $33.2 million (26% of income before income taxes) for the year ended<br />
December 31, 2010. <strong>The</strong> effective income tax rate was lower in 2011 than in 2010 primarily due to the Company earning more<br />
of its income in jurisdictions where the tax rate is 25% or lower, the recognition of previously unrecognized deferred tax assets<br />
in the second quarter of 2011 as a result of reorganizing the corporate structure in certain foreign jurisdictions, and a reduction<br />
in a prior year provision as a result of the settlement of certain items in dispute with tax authorities that were settled in the<br />
company’s favour.<br />
4.2 Segment Information<br />
4.2.1 Pipeline and Pipe Services segment<br />
<strong>The</strong> following table sets forth, by geographic location, the revenue, operating income and operating margin for the Pipeline and Pipe<br />
Services segment for the years ended December 31:<br />
(in thousands of Canadian dollars) 2011 2010 Change<br />
North America $ 547,881 $ 412,622 $ 135,259<br />
Latin America 38,499 56,400 (17,901)<br />
EMAR 241,885 184,768 57,117<br />
Asia Pacific 192,834 266,367 (73,533)<br />
Total revenue $ 1,021,099 $ 920,157 $ 100,942<br />
Operating income $ 96,982 $ 131,637 $ (34,655)<br />
Operating margin 9.5% 14.3% (4.8%)<br />
Revenue in the Pipeline and Pipe Services segment for the year ended December 31, 2011 was $1,021.1 million, an increase<br />
of $100.9 million, or 11%, from the prior year. <strong>The</strong> increase resulted from stronger demand for small diameter pipe from increased<br />
well completions in North America and higher project activity in EMAR, partially offset by lower project activity in Asia Pacific and<br />
Latin America and the translation impact of a weaker US dollar and Euro against the Company’s Canadian dollar reporting currency:<br />
• <strong>The</strong> increase in revenue in North America of $135.3 million was primarily due to growth in small diameter project activity in both<br />
the US and Canada, a 102% increase in spoolable composite pipe revenue, particularly driven by growth in market share in the<br />
United States, increased tubular management services driven by increased drilling activity in Canada and Mexico and revenue<br />
from the acquisition of CSI Services.<br />
• A decrease in revenue in Latin America of $17.9 million was due to year over year reductions in pipe coating project activity<br />
of 25% in Mexico and 41% in Brazil.<br />
• <strong>The</strong> increase in EMAR revenue of $57.1 million was mainly due to higher pipe coating volumes at the Company’s flow assurance<br />
insulation coating facility in Orkanger, Norway and a significant increase in activity at Leith, Scotland to complete the Laggan–<br />
Tormore, Breagh and Gundrun projects, partially offset by lower volumes in Saudi Arabia and the UAE.
32 <strong>ShawCor</strong> Ltd. Management's discussion and analysis<br />
• In Asia Pacific, revenue decreased by $73.5 million as a result of a reduction in large project activity in 2011 as compared<br />
to 2010. In Kembla Grange, Australia, project activity was very low following the first quarter 2011 completion of the EPIC QSN<br />
project. At Kabil, Indonesia and Kuantan, Malaysia, activity levels were lower by 15% and 20%, respectively, as a number of<br />
large projects were executed in 2010.<br />
Operating Income in the Pipeline and Pipe Services segment for the year ended December 31, 2011 was $97.0 million, a decrease<br />
of $34.7 million, or 26%, compared to the prior year. Gross profit increased by $6.9 million; however, the gross profit margin declined<br />
by 3.4 percentage points due to the shift in project mix, with 2010 experiencing a higher proportion of the Company’s revenue<br />
derived from projects in Asia Pacific. Also contributing to lower gross margins was the lower overhead absorption in Latin America<br />
and Asia Pacific due to the reduced volumes and the inefficient utilization of the Leith, Scotland facility, which experienced significant<br />
downtime in the second and third quarters as a result of interruptions in the Laggan-Tormore project production schedule. <strong>The</strong> final<br />
factor affecting operating income was the increase in SG&A expenses as explained in section 4.1 – Consolidated Information.<br />
4.2.2 Petrochemical and Industrial segment<br />
<strong>The</strong> following table sets forth, by geographic location, the revenue, operating income and operating margin for the Petrochemical and<br />
Industrial segment for the years ended December 31:<br />
(in thousands of Canadian dollars) 2011 2010 Change<br />
North America $ 80,762 $ 64,053 $ 16,709<br />
EMAR 54,237 50,002 4,235<br />
Asia Pacific 3,081 1,728 1,353<br />
Total revenue $ 138,080 $ 115,783 $ 22,297<br />
Operating income $ 18,242 $ 13,580 $ 4,662<br />
Operating margin 13.2% 11.7% 1.5% P.P.<br />
Revenue in the Petrochemical and Industrial segment increased by $22.3 million, or 19%, from $115.8 million in 2010 to $138.1 million<br />
in 2011. <strong>The</strong> revenue increase resulted from higher shipments of wire and cable products in the oil sands, transit and nuclear markets<br />
in North America combined with increased heat-shrink sleeve shipments resulting from a strengthening in industrial and automotive<br />
markets in North America, EMAR and Asia Pacific. This was partially offset by the translation impact of a weaker US dollar and Euro<br />
versus the Canadian dollar.<br />
Operating income in the Petrochemical and Industrial segment for 2011 was $18.2 million, an increase of $4.7 million, or 34%, over<br />
2010. <strong>The</strong> operating margin was higher by 1.5 points due to higher gross profit margins and improved overhead absorption due to<br />
increased revenue and better facility utilization, partly offset by higher selling, general and administrative expenses of $2.6 million.<br />
4.2.3 <strong>Financial</strong> and Corporate<br />
<strong>Financial</strong> and corporate costs include corporate expenses not allocated to the operating segments and other non-operating items<br />
including foreign exchange gains and losses on foreign currency denominated cash and working capital balances. <strong>The</strong> corporate<br />
division of the Company only earns revenue that is considered incidental to the activities of the Company. As a result, it does not<br />
meet the definition of a reportable operating segment as defined under IFRS.<br />
<strong>The</strong> following table sets forth the Company’s unallocated financial and corporate expenses, before foreign exchange gains and losses,<br />
for the years ended December 31:<br />
(in thousands of Canadian dollars) 2011 2010 Change<br />
<strong>Financial</strong> and corporate expenses $ (29,443) $ (31,033) $ 1,590<br />
<strong>Financial</strong> and corporate expenses decreased by $1.6 million or 5% in 2011 compared to 2010, primarily due to lower professional fees<br />
of $1.9 million.
ANNUAL REPORT 2011 <strong>ShawCor</strong> Ltd.<br />
33<br />
5.0 Liquidity and Capitalization<br />
<strong>The</strong> following table sets forth the Company’s cash flows by activity and cash balance as at December 31:<br />
(in thousands of Canadian dollars, except dividends) 2011 2010<br />
Net income $ 56,683 $ 95,072<br />
Non-cash items 63,854 54,764<br />
Settlement of decommissioning liability obligations (1,074) (3,218)<br />
Settlement of provisions (2,240) (2,027)<br />
Change in employee future benefits 636 (3,637)<br />
Change in non-cash working capital and foreign exchange (72,532) (87,710)<br />
Cash provided by operating activities 45,327 53,244<br />
Cash used in investing activities (95,428) (100,250)<br />
Cash used in financing activities (41,058) (39,551)<br />
Foreign exchange gain (loss) on foreign cash and cash equivalents 2,437 (7,433)<br />
Net increase (decrease) in cash and cash equivalents (88,722) (93,990)<br />
Cash and cash equivalents, beginning of year 155,998 249,988<br />
Cash and cash equivalents at end of period $ 67,276 $ 155,998<br />
5.1 Cash Provided by Operating Activities<br />
Cash provided by operating activities decreased by $7.9 million, or 15%, from $53.2 million in 2010 to $45.3 million in 2011. <strong>The</strong><br />
change was primarily due to lower net income of $38.4 million, partially offset by an increase in non-cash items of $9.1 million and<br />
a decrease in the amount of non-cash working capital and foreign exchange invested of $15.2 million. Net income decreased due to<br />
the reasons outlined above. Non-cash items increased due to a higher investment loss in associate of $8.2 million in 2011 compared<br />
to 2010, and the accounting gain on acquisition of $13.2 million in 2010. Amounts invested in non-cash working capital and foreign<br />
exchange decreased by $15.2 million mainly due to a lower rate of growth in accounts receivable and inventory and increasing<br />
growth in accounts payable.<br />
5.2 Cash Used in Investing Activities<br />
Cash used in investing activities decreased $4.8 million as the cash outflow to acquire CSI services in 2011 was lower than the cash<br />
outflow for the acquisition of the remaining 50% interest in the two Brazilian joint ventures in 2010.<br />
5.3 Cash Used in Financing Activities<br />
Cash used in financing activities increased by $1.5 million, or 4%, from $39.6 million in 2010 to $41.1 million in 2011, as the<br />
incremental amounts that were spent in 2011 to repurchase Class A shares were offset by proceeds from bank indebtedness and<br />
funds from the exercise of stock options. Please refer to section 5.5 – Credit Facilities for additional information with respect to<br />
changes in bank indebtedness, credit facilities and loans payable.<br />
5.4 Liquidity and Capital Resource Measures<br />
Accounts Receivable<br />
<strong>The</strong> following table sets forth the Company’s accounts receivable balance and days sales outstanding in trade accounts receivable<br />
(“DSO”) as at December 31:<br />
(in thousands of Canadian dollars) 2011 2010 Change<br />
Average trade accounts receivable $ 236,275 $ 218,398 $ 17,877<br />
DSO (a) 62 67 (4)<br />
(a) DSO is the average numbers of days that receivables are outstanding based on a 90-day cycle. See section 13 – Reconciliation of Non-GAAP Measures of this<br />
report, for additional information with respect to DSO.<br />
Average accounts receivable of $236.3 million in the fourth quarter of 2011 increased by $17.9 million from $218.4 million in the<br />
fourth quarter of 2010, in line with the higher sales volumes.
34 <strong>ShawCor</strong> Ltd. Management's discussion and analysis<br />
Inventories<br />
<strong>The</strong> following table sets forth the Company’s inventories balance as at December 31:<br />
(in thousands of Canadian dollars) 2011 2010 Change<br />
Inventories $ 146,786 $ 126,132 $ 20,654<br />
Inventories increased by $20.7 million, or 16%, from $126.1 million as at December 31, 2010 to $146.8 million as at December 31, 2011.<br />
<strong>The</strong> inventories balance consists primarily of raw materials purchased in advance of project execution. Raw materials as a percentage<br />
of inventories were 67% and 70% as at December 31, 2011 and December 31, 2010, respectively. <strong>The</strong> increase was primarily due to<br />
an increase in raw material inventories in the Asia Pacific region that had been built up to support pipe coating projects in late 2011<br />
and higher inventories of composite pipe and joint protection products.<br />
Accounts Payable<br />
<strong>The</strong> following table sets forth the Company’s accounts payable balance and days of purchases outstanding in accounts payable<br />
(“DPO”) as at December 31:<br />
(in thousands of Canadian dollars) 2011 2010 Change<br />
Average accounts payable and accrued liabilities $ 144,270 $ 126,278 $ (17,992)<br />
DPO (a) 62 64 (2)<br />
(a) DPO is the number of days from when purchased goods and services are received until payment is made to the suppliers based on a 90-day cycle.<br />
See section 13 – Reconciliation of Non-GAAP Measures, for additional information with respect to DPO.<br />
Average accounts payable and accrued liabilities of $144.3 million in the fourth quarter of 2011 increased by $18.0 million from<br />
$126.3 million in the comparable period of 2010. DPO decreased by 2 days to 62 days in 2011.<br />
5.5 Credit Facilities<br />
<strong>The</strong> following table presents the Company’s total credit facilities as at December 31:<br />
(in thousands of Canadian dollars) 2011 2010<br />
Total available credit facilities $ 236,168 $ 240,048<br />
Standby letters of credit for performance, bid and surety bonds (a) 73,836 75,140<br />
Unutilized credit facilities (b) $ 162,332 $ 164,908<br />
(a) Refer to section 7 – Off-Balance Sheet Arrangements, for additional information with respect to the Company’s various bonds.<br />
(b) Excludes the banking facilities of the Company’s 30% owned joint venture, Arabian Pipe Coating Company Ltd. (“APCO”).<br />
Loan Payable<br />
On February 4, 2010, the Company’s Russian joint venture obtained a loan from OOO ArkhTekhnoProm in the amount of 600 million<br />
Russian roubles payable on demand. Interest is calculated on this loan at 9.625% per annum and is to be paid over the period of<br />
actual use. In the event that the Company’s Russian joint venture fails to repay the outstanding loan within the time specified by the<br />
loan agreement, a penalty in the amount of 24% per annum will be assessed on the outstanding loan amount on a daily basis. <strong>The</strong><br />
Company’s portion of this loan that has been proportionately consolidated and included on the consolidated balance sheet as at<br />
December 31, 2011 in the amount of $5.0 million or 156 million Russian roubles at the current exchange rate (December 31, 2010 –<br />
$5.1 million or 156 million Russian roubles at the then current exchange rate).<br />
Long-term Debt (“Senior Notes”)<br />
On June 27, 2003, the Company entered into an agreement for the issue and sale, at par, on a private placement basis to institutional<br />
investors, of US$75.0 million of Senior Notes due June 30, 2011. Under the terms of the agreement, the Company was required to<br />
repay the Senior Notes in three equal installments of US$25.0 million on June 30, 2009, 2010 and 2011. On June 30, 2009, the<br />
Company made the first repayment of US$25.0 million ($28.7 million at the then current exchange rate). On June 30, 2010, the<br />
Company made the second repayment of US$25.0 million ($26.0 million at the then current exchange rate) (“Second Repayment”).<br />
On June 30, 2011, the Company made the third and final repayment of US$25.0 million ($24.4 million at the then current exchange<br />
rate) (“Final Payment”).
ANNUAL REPORT 2011 <strong>ShawCor</strong> Ltd.<br />
35<br />
<strong>The</strong> Company’s Senior Notes and associated interest expense were denominated in US dollars. Fluctuations in the exchange rate<br />
between the Canadian and US dollar impacted the carrying value of the Senior Notes in terms of Canadian dollars as well as the<br />
amount of interest expense that was translated into Canadian dollars. Effective July 3, 2003, the Company designated the Senior<br />
Notes as a hedge of a portion of its net investment in the Company’s US dollar based operations (“Net Investment”). After the<br />
Second Repayment, the remaining balance of the Senior Notes of US$25.0 million ($25.8 million) was hedged against the<br />
Net Investment. Upon making the Final Payment and extinguishing the hedge, a foreign exchange gain in the amount of $1.8 million<br />
was recognized and included in the consolidated statement of income.<br />
Debt Covenants<br />
Under the terms of the Company’s credit facilities, the Company must maintain the following:<br />
• Fixed Charge Coverage Ratio of more than 2.5 to 1; and<br />
• Debt to total capitalization ratio of less than 0.40 to 1.<br />
<strong>The</strong> Company was in compliance with the debt covenants detailed above as at December 31, 2011. <strong>The</strong>se debt covenants are<br />
Non-GAAP measures and should not be considered as an alternative to net income or any other measure of performance under<br />
GAAP. See section 13 – Reconciliation of Non-GAAP Measures for additional information with respect to these debt covenants.<br />
5.6 Future Uses of Liquidity<br />
Commitments and Contingencies<br />
As part of the Company’s normal operations, it often enters into contracts, such as leases and purchase contracts, which obligate<br />
the Company to make disbursements in the future. <strong>The</strong> following table summarizes these future payments required in respect<br />
of the Company’s contractual obligations:<br />
(in thousands of Canadian dollars) 2012 2013 2014 2015 2016 After 2016 Total<br />
Operating leases $ 9,755 $ 7,308 $ 5,798 $ 4,341 $ 2,615 $ 11,921 $ 41,738<br />
Decommissioning liabilities 6,001 4,020 3,225 2,057 183 11,206 26,692<br />
Loans payable 5,001 – – – – – 5,001<br />
Obligations under finance leases 191 88 39 – – – 318<br />
Deferred purchase consideration – 16,721 – – – – 16,721<br />
Total contractual obligations $ 20,948 $ 28,137 $ 9,062 $ 6,398 $ 2,798 $ 23,127 $ 90,470<br />
<strong>The</strong> following table sets forth the Company’s future minimum finance lease payments:<br />
(in thousands of Canadian dollars) 2011<br />
Total future minimum lease payments $ 318<br />
Less: imputed interest (50)<br />
Balance of obligations under finance leases 268<br />
Less: current portion (165)<br />
Non-current obligations under finance leases $ 103<br />
<strong>The</strong> Company expects to have sufficient financial capacity to meet all contractual obligations as and when they become due.<br />
Litigation Matters<br />
In the ordinary course of business activities, the Company may be contingently liable for litigation and claims with customers,<br />
suppliers and other third parties. Management believes that adequate provisions have been recorded in the accounts where required.<br />
Although it is not possible to estimate the extent of potential costs and losses, if any, management believes, but can provide no<br />
assurance, that the ultimate resolution of such contingencies would not have a material adverse effect on the consolidated financial<br />
position of the Company.
36 <strong>ShawCor</strong> Ltd. Management's discussion and analysis<br />
5.7 <strong>Financial</strong> Instruments<br />
5.7.1 Fair Value<br />
IFRS 7, <strong>Financial</strong> Instruments – Disclosure, provides a hierarchy of valuation techniques based on whether the inputs to those<br />
valuation techniques are observable or unobservable. Observable inputs are those which reflect market data obtained from<br />
independent sources, while unobservable inputs reflect the Company’s assumptions with respect to how market participants<br />
would price an asset or liability. <strong>The</strong>se two inputs, as used to measure fair value, fall into the following three different levels of the<br />
fair value hierarchy:<br />
Level 1 Quoted prices in active markets for identical instruments that are observable.<br />
Level 2 Quoted prices in active markets for similar instruments; inputs other than quoted prices that are observable and derived<br />
from or corroborated by observable market data.<br />
Level 3 Valuations derived from valuation techniques in which one or more significant inputs are unobservable.<br />
<strong>The</strong> hierarchy requires the use of observable market data when available.<br />
<strong>The</strong> following table presents, for each of the fair value hierarchy levels, the assets and liabilities that are measured at fair value<br />
on a recurring basis as at December 31, 2011 and does not include those instruments where the carrying amount is a reasonable<br />
approximation of the fair value:<br />
(in thousands of Canadian dollars) Fair Value Level 1 Level 2 Level 3<br />
Assets<br />
Derivative financial instruments – current $ 270 $ – $ 270 $ –<br />
270 – 270 –<br />
Liabilities<br />
Derivative financial instruments – current 419 – 419 –<br />
Derivative financial instruments – non-current 2,499 – – 2,499<br />
$ 2,918 $ – $ 419 $ 2,499<br />
<strong>The</strong> current derivative financial instruments relate to foreign exchange forward contracts entered into by the Company (as described<br />
below) and are valued by comparing the rates at the time the derivatives are acquired to the period-end rates quoted in the market.<br />
<strong>The</strong> non-current derivative financial instrument liability represents the net fair value of the financial instruments that were entered<br />
into by the Company in conjunction with its long-term investment in Fineglade, as described in note 14, and has been valued using<br />
a modified Black-Scholes model and unobservable input data. <strong>The</strong> fair values of the Company’s remaining financial instruments<br />
are not materially different from their carrying values.<br />
<strong>The</strong> following table presents the changes in the Level 3 fair value category for the year ended December 31, 2011:<br />
(in thousands of Canadian dollars)<br />
Fair Value<br />
Opening balance – January 1, 2010 $ –<br />
Additions 807<br />
Balance – December 31, 2010 $ 807<br />
Losses recognized in the statement of income 1,692<br />
Closing balance – December 31, 2011 $ 2,499<br />
5.7.2 <strong>Financial</strong> Risk Management<br />
<strong>The</strong> Company’s operations expose it to a variety of financial risks including market risk (including foreign exchange and interest<br />
rate risk), credit risk and liquidity risk. <strong>The</strong> Company’s overall risk management program focuses on the unpredictability of financial<br />
markets and seeks to minimize potential adverse effects on the Company’s financial position and financial performance. Risk<br />
management is the responsibility of Company management. Material risks are monitored and are regularly reported to the Board<br />
of Directors.
ANNUAL REPORT 2011 <strong>ShawCor</strong> Ltd.<br />
37<br />
Foreign Exchange Risk<br />
<strong>The</strong> majority of the Company’s business is transacted outside of Canada through subsidiaries operating in several countries. <strong>The</strong><br />
net investments in these subsidiaries as well as their revenue, operating expenses and non-operating expenses are based in foreign<br />
currencies. As a result, the Company’s consolidated revenue, expenses and financial position may be impacted by fluctuations in<br />
foreign exchange rates as these foreign currency items are translated into Canadian dollars. As at December 31, 2011, fluctuations<br />
of +/– 5% in the Canadian dollar, relative to those foreign currencies, would impact the Company’s consolidated revenue, income<br />
from operations, and net income (attributable to shareholders of the Company) for the year ended by approximately $32.5 million,<br />
$6.5 million and $4.7 million, respectively, prior to hedging activities. In addition, such fluctuations would impact the Company’s<br />
consolidated total assets, consolidated total liabilities and consolidated total shareholders’ equity by $53.5 million, $34.5 million<br />
and $19.0 million, respectively.<br />
<strong>The</strong> objective of the Company’s foreign exchange risk management activities is to minimize transaction exposures associated with<br />
the Company’s foreign currency denominated cash streams and the resulting variability of the Company’s earnings. <strong>The</strong> Company<br />
utilizes foreign exchange forward contracts to manage this foreign exchange risk. <strong>The</strong> Company does not enter into foreign exchange<br />
contracts for speculative purposes. With the exception of the Company’s US dollar based operations, the Company does not hedge<br />
translation exposures.<br />
Interest Rate Risk<br />
<strong>The</strong> following table summarizes the Company’s exposure to interest rate risk as at December 31, 2011:<br />
Fixed Interest Rate<br />
Maturing in<br />
One Year<br />
(in thousands of Canadian dollars) Floating Rate or Less Total<br />
<strong>Financial</strong> assets<br />
Cash equivalents $ – $ 5,978 $ 5,978<br />
Long-term notes receivable 3,845 – 3,845<br />
Long-term loan to related party 8,777 2,047 10,824<br />
Total $ 12,622 $ 8,025 $ 20,647<br />
<strong>Financial</strong> liabilities<br />
Bank indebtedness $ 12,281 $ – $ 12,281<br />
Loan payable 5,001 – 5,001<br />
Total $ 17,282 $ – $ 17,282<br />
<strong>The</strong> Company’s interest rate risk arises primarily from its floating rate bank indebtedness and long-term notes receivable and is not<br />
currently considered to be material.<br />
Credit Risk<br />
Credit risk arises from cash and cash equivalents held with banks, forward foreign exchange contracts, as well as credit exposure<br />
of customers, including outstanding accounts receivable. <strong>The</strong> maximum credit risk is equal to the carrying value of the<br />
financial instruments.<br />
<strong>The</strong> objective of managing counter-party credit risk is to prevent losses in financial assets. <strong>The</strong> Company is subject to considerable<br />
concentration of credit risk since the majority of its customers operate within the global energy industry and are therefore affected<br />
to a large extent by the same macroeconomic conditions and risks. <strong>The</strong> Company manages this credit risk by assessing the credit<br />
quality of all counter parties, taking into account their financial position, past experience and other factors. Management also<br />
establishes and regularly reviews credit limits of counter parties and monitors utilization of those credit limits on an ongoing basis.<br />
As at December 31, 2011 and 2010, <strong>ShawCor</strong> had no customers who generated revenue greater than 10% of total consolidated revenue.<br />
<strong>The</strong> carrying value of accounts receivable is reduced through the use of an allowance for doubtful accounts and the amount<br />
of the loss is recognized in the consolidated statement of income with a charge to selling, general and administrative expenses.<br />
When a receivable balance is considered to be uncollectible, it is written off against the allowance for doubtful accounts.<br />
Subsequent recoveries of amounts previously written off are credited against selling, general and administrative expenses.<br />
As at December 31, 2011, $11.6 million, or 5.1% of trade accounts receivable, were more than 90 days overdue, which is consistent<br />
with prior period aging analysis. <strong>The</strong> Company expects to receive full payment on accounts receivable that are neither past due<br />
nor impaired.
38 <strong>ShawCor</strong> Ltd. Management's discussion and analysis<br />
<strong>The</strong> following is an analysis of the change in the allowance for doubtful accounts for the year ended December 31, 2011 and 2010:<br />
December 31 December 31<br />
(in thousands of Canadian dollars) 2011 2010<br />
Balance – Beginning of year $ 3,775 $ 5,353<br />
Bad debt expense 9,160 697<br />
Recovery of previously written-off bad debts 126 (384)<br />
Write-offs of bad debts (328) (1,469)<br />
Impact of change in foreign exchange rates 1,234 (422)<br />
Balance – End of year $ 13,967 $ 3,775<br />
5.8 Outstanding Share Capital<br />
As at December 31, 2011, the Company had 57,832,572 Class A shares outstanding and 12,784,334 Class B shares outstanding.<br />
In addition, as at December 31, 2011, the Company had stock options outstanding to purchase up to 2.3 million Class A shares.<br />
6.0 Quarterly Selected <strong>Financial</strong> Information<br />
<strong>The</strong> following tables set forth the Company’s summary of selected financial information for the four quarters of 2011 and 2010:<br />
(in thousands of Canadian dollars except per share amounts) Q1-2011 Q2-2011 Q3-2011 Q4-2011<br />
Operating results<br />
Revenue $ 279,466 $ 264,541 $ 271,478 $ 341,780<br />
Income from operations 30,095 22,660 (60) 31,748<br />
Net income (attributable to shareholders of the Company) 20,485 15,703 (3,144) 23,042<br />
Net income per share (Classes A and B)<br />
Basic $ 0.29 $ 0.22 $ (0.04) $ 0.32<br />
Diluted 0.29 0.21 (0.04) 0.32<br />
(in thousands of Canadian dollars except per share amounts) Q1-2010 Q2-2010 Q3-2010 Q4-2010<br />
Operating results<br />
Revenue $ 224,572 $ 234,546 $ 282,959 $ 292,086<br />
Income from operations 18,547 18,944 42,718 39,622<br />
Net income (attributable to shareholders of the Company) 11,739 12,031 32,126 39,176<br />
Net income per share (Classes A and B)<br />
Basic $ 0.17 $ 0.17 $ 0.46 $ 0.55<br />
Diluted 0.16 0.17 0.45 0.55<br />
<strong>The</strong> following are key factors affecting the comparability of quarterly financial results.<br />
• <strong>The</strong> Company’s operations in the Pipeline and Pipe Services segment, representing 88% of the Company’s consolidated revenue<br />
in 2011, are largely project based. <strong>The</strong> nature and timing of projects can result in variability in the Company’s quarterly revenue<br />
and profitability. In addition, certain of the Company’s operations are subject to a degree of seasonality, particularly in the<br />
Pipeline and Pipe Services segment.<br />
• Over 75% of the Company’s revenue in 2011 is transacted in currencies other than Canadian dollars, with a majority transacted<br />
in US dollars. Changes in the rates of exchange between the Canadian dollar and other currencies could have a significant<br />
effect on the amount of this revenue when it is translated into Canadian dollars. See section 2.2 – Foreign Exchange Impact,<br />
for additional information with respect to the effects of foreign exchange fluctuations on the results of the Company.
ANNUAL REPORT 2011 <strong>ShawCor</strong> Ltd.<br />
39<br />
7.0 Off-Balance Sheet Arrangements<br />
<strong>The</strong> Company provides standby letters of credit for performance, bid and surety bonds through financial intermediaries to various<br />
customers as required under various project contracts. If the Company fails to perform under the terms of the contract, the customer<br />
has the ability to draw upon all or a portion of the bond as compensation for the Company’s failure to perform. <strong>The</strong> contracts, which<br />
these performance bonds support, generally have a term of one to three years, but could extend beyond such periods. Bid bonds<br />
typically have a term of less than one year and are renewed, if required, over the term of the applicable contract. If the Company<br />
is unwilling to issue performance and other types of bonds, it could have a materially adverse effect on the ability of the Company<br />
to generate revenue. Historically, the Company has not made and does not anticipate that it will be required to make material<br />
payments under these types of bonds.<br />
<strong>The</strong> Company’s utilizes its credit facilities to support the Company’s bonds. <strong>The</strong> Company had utilized credit facilities of $73.8 million<br />
and $75.1 million as at December 31, 2011 and 2010, respectively, in support of its bonds.<br />
See section 5.5 – Credit Facilities, for additional information with respect to the Company’s various bonds and credit facilities.<br />
8.0 Critical Accounting Estimates and Accounting Policy Developments<br />
8.1 Critical Accounting Estimates<br />
<strong>The</strong> preparation of consolidated financial statements in conformity with IFRS requires management to make estimates and<br />
assumptions that affect the amounts of assets and liabilities and disclosures of contingent liabilities at the date of the consolidated<br />
financial statements and the reported amounts of revenue and expenses during the reporting period. Actual results could differ from<br />
those estimates.<br />
Critical estimates used in preparing the consolidated financial statements include:<br />
Long-lived Assets and Goodwill<br />
<strong>The</strong> Company evaluates the carrying values of the Cash Generating Units’ (“CGU”) goodwill on an annual basis on October 31<br />
of each year to determine whether or not impairment of these assets has occurred and whether writedowns of the value of these<br />
assets are required. Similarly, the Company evaluates the carrying values of CGUs for long-lived assets whenever circumstances<br />
arise that could indicate impairment and at each reporting date. <strong>The</strong>se impairment tests include certain assumptions regarding<br />
discount rates and future cash flows generated by these assets in determining the value-in-use and fair value less costs to sell<br />
calculations. Actual results could differ from these assumptions.<br />
Future Benefit Obligations<br />
<strong>The</strong> Company provides future benefits to its employees under a number of defined benefit arrangements. <strong>The</strong> calculation of<br />
the accrued benefit obligations recognized in the consolidated financial statements includes a number of assumptions regarding<br />
discount rates, long-term rates of return on pension plan assets, rates of employee compensation increases, rates of inflation,<br />
medical costs and life expectancies. <strong>The</strong> outcome of any of these factors could differ from the estimates used in the calculations<br />
and have an impact on operating expenses, non-current assets and non-current liabilities.<br />
Provisions and Contingent Liabilities<br />
Provisions and liabilities for legal and other contingent matters are recognized in the period when it becomes probable that there<br />
will be a future outflow of economic benefits resulting from past operations or events and the amount of the cash outflow can be<br />
reliably measured. <strong>The</strong> timing of recognition and measurement of the provision requires the application of judgment to existing facts<br />
and circumstances, which can be subject to change. <strong>The</strong> carrying amounts of provisions and liabilities are reviewed regularly and<br />
adjusted to take account of changing facts and circumstances.<br />
<strong>The</strong> Company is required to both determine whether a loss is probable based on judgment and interpretation of laws and regulations<br />
and whether the loss can be reliably measured. When a loss is determined it is charged to the consolidated statement of income.<br />
<strong>The</strong> Company must continually monitor known and potential contingent matters and make appropriate provisions by charges to<br />
income when warranted by circumstances.
40 <strong>ShawCor</strong> Ltd. Management's discussion and analysis<br />
Decommissioning Liabilities<br />
Decommissioning liabilities include legal and constructive obligations related to owned and leased facilities. <strong>The</strong>se have been<br />
recorded in the consolidated financial statements based on estimated future amounts required to satisfy these obligations. <strong>The</strong><br />
amount recognized is the present value of estimated future expenditures required to settle the obligation using a current pre-tax<br />
risk-free rate. A corresponding asset equal to the present value of the initial estimated liability is capitalized as part of the cost of the<br />
related long-lived asset. Changes in the estimated liability resulting from revisions to estimated timing or future decommissioning<br />
cost estimates are recognized as a change in the decommissioning liability and the related long-lived asset. <strong>The</strong> amount capitalized<br />
in property, plant and equipment is depreciated on a straight line basis over the useful life of the related asset. Increases in the<br />
decommissioning liabilities resulting from the passage of time are recognized as a finance cost in the consolidated statement<br />
of income. Actual expenditures incurred are charged against the accumulated decommissioning liability.<br />
<strong>Financial</strong> Instruments<br />
<strong>The</strong> Company has determined the estimated fair values of its financial instruments not traded in an active market based on<br />
appropriate valuation methodologies; however, considerable judgment is required to develop these estimates, mainly based on<br />
market conditions existing at the end of each reporting period. Accordingly, these estimated fair values are not necessarily indicative<br />
of the amounts the Company could realize in a current market exchange. <strong>The</strong> estimated fair value amounts can be materially<br />
affected by the use of different assumptions or methodologies.<br />
Income Taxes<br />
<strong>The</strong> recording of income tax expense includes certain estimations related to the impact in the current year of future events.<br />
<strong>Difference</strong>s between the estimated and actual impact of these events could impact tax expense, current taxes payable or deferred<br />
taxes. In particular, earnings and losses in foreign jurisdictions may be taxed at rates different from those expected in Canada.<br />
8.2 Accounting Standards Issued but Not Yet Applied<br />
IFRS 9 <strong>Financial</strong> Instruments<br />
IFRS 9, <strong>Financial</strong> Instruments, was issued in November 2009 and contained requirements for financial assets. This standard addresses<br />
classification and measurement of financial assets and replaces the multiple category and measurement models in IAS 39, <strong>Financial</strong><br />
Instruments – Recognition and Measurement for debt instruments with a new mixed measurement model having only two categories:<br />
amortized cost and fair value through profit or loss. IFRS 9 also replaces the models for measuring equity instruments and such<br />
instruments are either recognized at fair value through profit or loss or at fair value through other comprehensive income (loss).<br />
Requirements for financial liabilities were added in October 2010 and they largely carried forward existing requirements in IAS 39,<br />
except that fair value changes due to credit risk for liabilities designated at fair value through profit or loss would generally be<br />
recorded in other comprehensive income (loss).<br />
IFRS 9 is required to be applied for accounting periods beginning on or after January 1, 2013, with earlier adoption permitted.<br />
<strong>The</strong> Company has not yet assessed the impact of the standard or determined whether it will adopt the standard early.<br />
IFRS 10 Consolidated <strong>Financial</strong> Statements<br />
For annual periods beginning on January 1, 2013, IFRS 10, Consolidated <strong>Financial</strong> Statements, will replace portions of IAS 27 Consolidated<br />
and Separate <strong>Financial</strong> Statements and interpretation SIC-12 Consolidation – Special Purpose Entities. <strong>The</strong> new standard requires<br />
consolidated financial statements to include all controlled entities under a single control model. <strong>The</strong> Company will be considered<br />
to control an investee when it is exposed, or has rights to variable returns from its involvement with the investee, and has the current<br />
ability to affect those returns through its power over the investee. As required by this standard, control is reassessed as facts and<br />
circumstances change. All facts and circumstances must be considered to make a judgment about whether the Company controls<br />
another entity. Additional guidance is given on how to evaluate whether certain relationships give the Company the current ability to<br />
affect its returns, including how to consider options and convertible instruments, holding less than a majority of voting rights, how to<br />
consider protective rights and principal-agency relationships (including removal rights), all of which may differ from current practice.<br />
IFRS 10 is required to be applied for accounting periods beginning on or after January 1, 2013, with earlier adoption permitted.<br />
<strong>The</strong> Company has not yet assessed the impact of the standard or determined whether it will adopt the standard early.
ANNUAL REPORT 2011 <strong>ShawCor</strong> Ltd.<br />
41<br />
IFRS 11 Joint Arrangements<br />
On January 1, 2013, <strong>ShawCor</strong> will be required to adopt IFRS 11, Joint Arrangements, which applies to accounting for interests in joint<br />
arrangements where there is joint control. <strong>The</strong> standard requires the joint arrangements to be classified as either joint operations<br />
or joint ventures. <strong>The</strong> structure of the joint arrangement would no longer be the most significant factor when classifying the joint<br />
arrangement as either a joint operation or a joint venture. In addition, the option to account for joint ventures (previously called<br />
jointly controlled entities) using proportionate consolidation will be removed and replaced by equity accounting.<br />
Due to the adoption of this new section, the Company will transition the accounting for joint ventures from the proportionate<br />
consolidation method to the equity method by aggregating the carrying values of the proportionately consolidated assets and<br />
liabilities into a single line item.<br />
IFRS 11 is required to be applied for accounting periods beginning on or after January 1, 2013, with earlier adoption permitted.<br />
<strong>The</strong> Company has not yet assessed the impact of the standard or determined whether it will adopt the standard early.<br />
IFRS 12 Disclosure of Interests in Other Entities<br />
On January 1, 2013, <strong>ShawCor</strong> will be required to adopt IFRS 12, Disclosure of Interests in Other Entities, which includes disclosure<br />
requirements about subsidiaries, joint ventures and associates, as well as unconsolidated structured entities and replaces<br />
existing disclosure requirements. Due to this new standard, the Company will be required to disclose the following: judgments<br />
and assumptions made when deciding how to classify involvement with another entity, interests that non-controlling interests<br />
have in consolidated entities and the nature of the risks associated with interests in other entities.<br />
IFRS 12 is required to be applied for accounting periods beginning on or after January 1, 2013, with earlier adoption permitted.<br />
<strong>The</strong> Company has not yet assessed the impact of the standard or determined whether it will adopt the standard early.<br />
IFRS 13 Fair Value Measurement<br />
On January 1, 2013, <strong>ShawCor</strong> will be required to adopt IFRS 13, Fair Value Measurement. <strong>The</strong> new standard will generally converge<br />
the IFRS and US GAAP requirements on how to measure fair value and the related disclosures. IFRS 13 establishes a single source<br />
of guidance for fair value measurements, when fair value is required or permitted by IFRS. Upon adoption, the Company will provide<br />
a single framework for measuring fair value while requiring enhanced disclosures when fair value is applied. In addition, fair value will<br />
be defined as the ‘exit price’ and concepts of ‘highest and best use’ and ‘valuation premise’ would be relevant only for non-financial<br />
assets and liabilities.<br />
IFRS 13 is required to be applied for accounting periods beginning on or after January 1, 2013, with earlier adoption permitted.<br />
<strong>The</strong> Company has not yet assessed the impact of the standard or determined whether it will adopt the standard early.<br />
IAS 27 Separate <strong>Financial</strong> Statements<br />
On January 1, 2013, <strong>ShawCor</strong> will be required to adopt IAS 27, Separate <strong>Financial</strong> Statements. As a result of the issue of the new<br />
consolidation suite of standards, IAS 27 has been reissued to reflect the changes to the consolidation guidance recently included<br />
in IFRS 10.<br />
In addition, IAS 27 will now only prescribe the accounting and disclosure requirements for investments in subsidiaries, joint ventures<br />
and associates when the Company prepares separate financial statements. <strong>The</strong> Company has not yet assessed the impact of this<br />
new accounting standard.<br />
IAS 28 Investments in Associates and Joint Ventures<br />
On January 1, 2013, <strong>ShawCor</strong> will be required to adopt IAS 28, Investments in Associates and Joint Ventures. As a consequence<br />
of the issue of IFRS 10, IFRS 11 and IFRS 12, IAS 28 has been amended and will provide further accounting guidance for investments in<br />
associates and will set out the requirements for the application of the equity method when accounting for investments in associates<br />
and joint ventures. This standard will be applied by the Company when there is joint control or significant influence over an investee.<br />
Significant influence is the power to participate in the financial and operating policy decisions of the investee but does not include<br />
control or joint control of those policy decisions. When it has been determined that the Company has an interest in a joint venture,<br />
the Company will recognize an investment and will account for it using the equity method in accordance with IAS 28.<br />
IAS 28 is required to be applied for accounting periods beginning on or after January 1, 2013, with earlier adoption permitted.<br />
<strong>The</strong> Company has not yet assessed the impact of the standard or determined whether it will adopt the standard early.
42 <strong>ShawCor</strong> Ltd. Management's discussion and analysis<br />
8.3 First Time Adoption of IFRS<br />
<strong>ShawCor</strong> has adopted IFRS on January 1, 2011 with a date of transition to IFRS of January 1, 2010. In accordance with IFRS 1, IFRS<br />
is applied retrospectively at the transition date, with any adjustments to the assets and liabilities as a result of the adoption taken<br />
to retained earnings unless certain exemptions are applied.<br />
<strong>The</strong> effect of the Company’s transition to IFRS, is summarized as follows:<br />
a) Adoption of IFRS<br />
<strong>The</strong> adoption of IFRS requires the application of IFRS 1, which provides guidance for an entity’s initial adoption of IFRS. Generally<br />
speaking, IFRS requires that an entity apply all IFRS effective at the end of its first IFRS reporting period on a retrospective basis with<br />
any adjustments to the assets and liabilities as a result of the adoption taken to retained earnings. IFRS 1 does, however, provide for<br />
certain mandatory exemptions and limited optional exemptions in specified areas of certain standards from this general requirement.<br />
<strong>The</strong> following are the exemptions available under IFRS 1 that are significant to <strong>ShawCor</strong> and have been applied in preparing the<br />
Company’s first financial statements under IFRS.<br />
i) Property, Plant and Equipment<br />
IFRS permits an entity to measure an item of property, plant and equipment at either cost or fair value. <strong>ShawCor</strong> has elected to retain<br />
the historical cost model for all assets. <strong>The</strong> Company has recalculated the associated historical accumulated depreciation of all fixed<br />
assets using a more detailed componentization analysis where applicable, and has reviewed their expected useful life, which, in<br />
a number of cases, was extended. This has caused the net book value of property, plant and equipment to increase.<br />
ii) Employee Benefits<br />
Under IAS 19, Employee Benefits, an entity may elect to use a ‘corridor’ approach that leaves some actuarial gains and losses<br />
unrecognized. Retrospective application of this approach requires the entity to split the cumulative actuarial gains and losses from<br />
the inception of the plan until the date of transition to IFRS into a recognized portion and an unrecognized portion. <strong>ShawCor</strong> has<br />
elected to recognize all cumulative actuarial gains and losses at the date of transition to IFRS through an adjustment to the opening<br />
retained earnings. This has resulted in an increase in the liability for employee benefits. <strong>The</strong> Company has elected to adopt the IFRS 1<br />
option to disclose the amounts required by IAS 19 on a prospective basis.<br />
iii) Cumulative Translation Account<br />
IAS 21, the Effects of Changes in Foreign Exchange Rates, requires an entity to determine the translation differences in accordance<br />
with IFRS from the date on which a subsidiary was formed or acquired. IFRS 1 allows cumulative translation differences for all foreign<br />
operations to be deemed zero at the date of transition to IFRS, with future gains or losses on subsequent disposal of any foreign<br />
operations to exclude translation differences arising from periods prior to the date of transition to IFRS. <strong>ShawCor</strong> has elected to<br />
deem all cumulative translation differences to be zero on transition to IFRS as at January 1, 2010.<br />
iv) Business Combinations<br />
IFRS 1 allows a first time adopter to elect not to apply IFRS 3, Business Combinations, retrospectively to past business combinations<br />
that occurred before the date of transition to IFRS. <strong>The</strong> Company has elected the business combinations exemption in IFRS 1 to not<br />
apply IFRS 3 retrospectively to past business combinations. Accordingly, the Company has not restated business combinations that<br />
took place prior to the transition date.<br />
As <strong>ShawCor</strong> early adopted CICA Handbook Section 1582, Business Combinations, on January 1, 2010, which was harmonized with<br />
IFRS 3, there are no IFRS adjustments required for 2010 for the accounting for business combinations completed in 2010.
ANNUAL REPORT 2011 <strong>ShawCor</strong> Ltd.<br />
43<br />
v) Stock-based Compensation<br />
<strong>ShawCor</strong> is required to apply IFRS 2, Share-based Payments, to equity instruments that vest after January 1, 2010. <strong>ShawCor</strong> has<br />
consistently used the method of recognizing stock-based compensation expense on a graded vesting schedule. Adopting IFRS has<br />
resulted in a $145 thousand additional expense due to the revaluation of compound financial instruments (Share Appreciation Rights<br />
“SAR”) using the Black-Scholes model, compared to using the intrinsic value of liability under CGAAP.<br />
vi) Borrowing Costs<br />
<strong>ShawCor</strong> has elected not to capitalize any borrowing costs on a retrospective basis for qualifying assets acquired prior<br />
to January 1, 2010, the date of transition to IFRS.<br />
vii) Decommissioning Liabilities<br />
<strong>ShawCor</strong> has elected, in accordance with IFRS 1, to remeasure these liabilities as of the date of transition to IFRS in accordance with<br />
IAS 37, and has adjusted the asset cost and depreciable amount accordingly and will amortize the depreciable amount of the assets<br />
over the remaining useful lives.<br />
b) IFRS 1 Guidelines<br />
Under certain circumstances, a first time adopter must adhere to specific guidelines under IFRS 1. <strong>ShawCor</strong> Ltd. has applied the<br />
following guidelines to its opening IFRS statement of financial position as on January 1, 2010:<br />
i) Goodwill<br />
<strong>ShawCor</strong> is required to apply IAS 36 Impairment of Assets, on transition to IFRS on January 1, 2010. Under CGAAP goodwill is tested<br />
for impairment by comparing the carrying value to the fair value at the reporting unit level. Impairment for goodwill under IFRS is<br />
tested at the CGU level. <strong>The</strong>re was no impairment recognized on transition from CGAAP to IFRS, based on the testing carried out<br />
under IFRS at the CGU level (note 16).<br />
ii) Estimates<br />
In accordance with IFRS 1, an entity’s estimates under IFRS at the date of transition from CGAAP to IFRS must be consistent with<br />
estimates made in accordance with CGAAP unless there is objective evidence that those estimates were in error. Estimates under<br />
IFRS are consistent with the CGAAP estimates.<br />
c) Reconciliations between CGAAP and IFRS<br />
<strong>The</strong> impact of applying the above noted IFRS exemptions and the accounting policy differences between CGAAP and IFRS are<br />
summarized in the following tables and notes:
44 <strong>ShawCor</strong> Ltd. Management's discussion and analysis<br />
Reconciliation of the balance sheet under CGAAP to IFRS at January 1, 2010<br />
Restated under<br />
CGAAP Effect of IFRS<br />
December 31 IFRS FS Transition January 1<br />
(in thousands of Canadian dollars) Note 2009 Reclassification to IFRS 2010<br />
Assets<br />
Current Assets<br />
Cash and cash equivalents $ 249,988 $ – $ – $ 249,988<br />
Accounts receivable 191,821 – – 191,821<br />
Income taxes receivable 14,055 – – 14,055<br />
Inventories 109,379 – – 109,379<br />
Prepaid expenses 14,392 – – 14,392<br />
Derivative financial instruments 1,782 – – 1,782<br />
Current future income taxes i 4,668 (4,668) – –<br />
586,085 (4,668) – 581,417<br />
Non-current Assets<br />
Property, plant and equipment b, d, f 270,219 – 14,072 284,291<br />
Intangible assets 62,784 – – 62,784<br />
Investment in associates 24 – – 24<br />
Derivative financial instruments 39 – – 39<br />
Deferred income taxes e, i 36,249 4,668 498 41,415<br />
Other assets 16,128 – (6,520) 9,608<br />
Goodwill 214,449 – – 214,449<br />
599,892 4,668 8,050 612,610<br />
Total Assets $ 1,185,977 $ – $ 8,050 $ 1,194,027<br />
Liabilities<br />
Current Liabilities<br />
Accounts payable and accrued liabilities j, i $ 127,932 $ (8,119) $ – $ 119,813<br />
Provisions d, i – 8,874 971 9,845<br />
Income taxes payable 42,971 – – 42,971<br />
Derivative financial instruments 510 – – 510<br />
Deferred revenue 75,100 – – 75,100<br />
Current portion of long-term debt 26,235 – – 26,235<br />
Obligations under finance lease 371 – – 371<br />
273,119 755 971 274,845<br />
Non-current Liabilities<br />
Long-term debt 26,052 – – 26,052<br />
Obligations under finance lease 492 – – 492<br />
Deferred income taxes e 76,552 – (976) 75,576<br />
Provisions c, i, d – 18,585 7,462 26,047<br />
Other non-current liabilities i 19,340 (19,340) – –<br />
122,436 (755) 6,486 128,167<br />
Total Liabilities 395,555 – 7,457 403,012<br />
Shareholders’ Equity<br />
Share capital 204,151 – – 204,151<br />
Contributed surplus 17,277 – – 17,277<br />
Retained earnings a 695,800 – (126,213) 569,587<br />
Accumulated other comprehensive loss a (126,806) – 126,806 –<br />
790,422 – 593 791,015<br />
Total Liabilities and Shareholders’ Equity $ 1,185,977 $ – $ 8,050 $ 1,194,027
ANNUAL REPORT 2011 <strong>ShawCor</strong> Ltd.<br />
45<br />
Reconciliation of the balance sheet under CGAAP to IFRS at December 31, 2010<br />
Restated under<br />
CGAAP Effect of IFRS<br />
December 31 IFRS FS Transition December 31<br />
(in thousands of Canadian dollars) Note 2010 Reclassification to IFRS 2010<br />
Assets<br />
Current Assets<br />
Cash and cash equivalents $ 155,998 $ – $ – $ 155,998<br />
Accounts receivable 243,955 – – 243,955<br />
Income taxes receivable 13,823 – – 13,823<br />
Inventories 126,132 – – 126,132<br />
Prepaid expenses 14,171 – – 14,171<br />
Derivative financial instruments 1,130 – – 1,130<br />
Current future income taxes i 4,590 (4,590) – –<br />
559,799 (4,590) – 555,209<br />
Non-current Assets<br />
Property, plant and equipment b, d, f 283,286 – 4,411 287,697<br />
Intangible assets 91,353 – – 91,353<br />
Investment in associates 31,995 – – 31,995<br />
Deferred income taxes e, i 29,035 4,590 (70) 33,555<br />
Other assets 15,622 – (5,699) 9,923<br />
Goodwill 215,204 – – 215,204<br />
666,495 4,590 (1,358) 669,727<br />
Total Assets $ 1,226,294 $ – $ (1,358) $ 1,224,936<br />
Liabilities<br />
Current Liabilities<br />
Loan payable $ 5,126 $ – $ – $ 5,126<br />
Accounts payable and accrued liabilities j, i 137,669 (4,926) – 132,743<br />
Provisions d, i – 5,595 2,297 7,892<br />
Income taxes payable 44,968 – – 44,968<br />
Derivative financial instruments 527 – – 527<br />
Deferred revenue 54,751 – – 54,751<br />
Current portion of long-term debt 25,005 – – 25,005<br />
Finance lease obligation 345 – – 345<br />
268,391 669 2,297 271,357<br />
Non-current Liabilities<br />
Long-term finance lease obligation 339 – – 339<br />
Derivative financial instruments 807 – – 807<br />
Deferred income taxes e 78,516 – (3,349) 75,167<br />
Provisions c, i, d – 39,709 5,314 45,023<br />
Other non-current liabilities i 40,378 (40,378) – –<br />
120,040 (669) 1,965 121,336<br />
Total Liabilities 388,431 – 4,262 392,693<br />
Shareholders’ Equity<br />
Share capital 206,775 – – 206,775<br />
Contributed surplus 18,144 – – 18,144<br />
Retained earnings a 775,924 – (131,733) 644,191<br />
Accumulated other comprehensive loss a (162,980) – 126,113 (36,867)<br />
Total Shareholders’ Equity 837,863 – (5,620) 832,243<br />
Total Liabilities and Shareholders’ Equity $ 1,226,294 $ – $ (1,358) $ 1,224,936
46 <strong>ShawCor</strong> Ltd. Management's discussion and analysis<br />
Reconciliation of the statement of income and comprehensive income under CGAAP to IFRS for the year ended December 31, 2010<br />
Restated<br />
CGAAP Effect of under IFRS<br />
December 31, Transition December 31,<br />
(in thousands of Canadian dollars) Note 2010 to IFRS 2010<br />
Consolidated Statement of Income<br />
Revenue $ 1,034,163 $ – $ 1,034,163<br />
Cost of Goods Sold 623,641 – 623,641<br />
Gross Profit 410,522 – 410,522<br />
Selling, general and administrative expenses h, j 221,648 (2,564) 219,084<br />
Research and development expenses 11,050 – 11,050<br />
Foreign exchange (gains) losses g (5,745) 98 (5,647)<br />
Amortization of property, plant and equipment f 50,376 (5,299) 45,077<br />
Amortization of intangible assets 5,038 – 5,038<br />
Impairment of property, plant & equipment b – 14,923 14,923<br />
Impairment of intangible assets 958 – 958<br />
Impairment of goodwill 208 – 208<br />
Income from Operations 126,989 (7,158) 119,831<br />
Gain on revaluation of investment 13,181 – 13,181<br />
Loss on investment in associate (1,939) – (1,939)<br />
Interest income on short-term deposits 1,455 – 1,455<br />
Interest expense on bank indebtedness (1,631) (302) (1,933)<br />
Interest expense on long-term debt (2,327) – (2,327)<br />
Income Before Income Taxes 135,728 (7,460) 128,268<br />
Income Taxes 35,136 (1,940) 33,196<br />
Net Income $ 100,592 $ (5,520) $ 95,072<br />
Earnings per Share<br />
Basic $ 1.43 $ 1.35<br />
Diluted $ 1.41 $ 1.33<br />
Consolidated Statement of Comprehensive Income<br />
Net Income $ 100,592 $ (5,520) $ 95,072<br />
Unrealized loss on translating financial statements of foreign operations (37,379) (693) (38,072)<br />
Gain on hedges of unrealized foreign currency translation 1,423 – 1,423<br />
Income tax expense (218) – (218)<br />
Other comprehensive loss for the period (36,174) (693) (36,867)<br />
Comprehensive Income $ 64,418 $ (6,213) $ 58,205<br />
December 31, January 1,<br />
(in thousands of Canadian dollars) Note 2010 2010<br />
Reconciliation of Shareholders’ Equity<br />
Shareholders’ Equity in Accordance with Canadian GAAP $ 837,863 $ 790,422<br />
Property, plant and equipment b, f 30,462 25,977<br />
Impairment of property, plant, and equipment b (27,087) (14,275)<br />
Employee future benefits c, e (8,170) (10,547)<br />
Effects of change in FX rates g (931) (396)<br />
Provisions 210 222<br />
Decommissioning of liabilities d 41 (388)<br />
Share-based compensation j (145) –<br />
Shareholders’ Equity in Accordance with IFRS $ 832,243 $ 791,015
ANNUAL REPORT 2011 <strong>ShawCor</strong> Ltd.<br />
47<br />
Notes to the Reconciliations<br />
a) Cumulative Translation Account<br />
<strong>The</strong> Effects of Changes in Foreign Exchange Rates requires an entity to determine the translation differences in accordance with<br />
IFRS from the date on which a subsidiary was formed or acquired. IFRS 1 allows cumulative translation differences for all foreign<br />
operations to be deemed zero at the date of transition to IFRS, with future gains or losses on subsequent disposal of any foreign<br />
operations to exclude translation differences arising from periods prior to the date of transition to IFRS. <strong>ShawCor</strong> has made the<br />
election to deem all cumulative translation differences be reset to zero on transition to IFRS as on January 1, 2010. Consequently,<br />
the Company has transferred a deficit of $126.8 million to retained earnings from the cumulative translation adjustment account.<br />
b) Property, Plant and Equipment<br />
<strong>The</strong> adjustment to property, plant and equipment at the January 1, 2010 transition date is a net increase of $14.1 million to the Net<br />
Book Value (“NBV”). NBV increased by $28.4 million due to the impact of componentization of property, plant and equipment and<br />
revision in the estimated useful life as required by IAS 16. This increase was partly offset by a combined asset impairment loss of<br />
$14.3 million recognized on certain Pipeline and Pipe Services segment fixed assets.<br />
Under IFRS, impairment testing is performed by comparing the carrying amount to the recoverable amount, calculated using the<br />
value in use method, which uses a risk adjusted pre-tax rate to discount cash flows (i.e. a higher rate than under CGAAP) to their<br />
net present value. Under CGAAP, there is a two-step process:<br />
i) A reasonability test using the sum of the undiscounted cash flows and comparing them to the carrying value, and if the<br />
test fails<br />
ii) <strong>The</strong> amount of impairment is calculated using a risk adjusted post-tax rate to discount the cash flows (i.e. a lower rate than<br />
under IFRS) to their net present value.<br />
Under CGAAP, no impairment existed on the above assets as of December 31, 2010.<br />
Under IFRS, <strong>ShawCor</strong> recognized an additional impairment at December 31, 2010 on these fixed assets in the amount of $14.9 million.<br />
<strong>The</strong> impairment recognized has been expensed in the statement of income for the year ended December 31, 2010.<br />
c) Employee Benefits<br />
Under IFRS, the $14.4 million adjustment as at the IFRS Transition Date resulted from <strong>ShawCor</strong>’s election to use the IFRS 1 exemption<br />
and adopt IAS 19 on a prospective basis. This ‘fresh start or prospective approach’ allows that any unrecognized actuarial gains and<br />
losses as at the IFRS Transition Date for all plans be immediately recognized through an adjustment to the opening retained earnings<br />
and an increase to the defined employee future benefit liability.<br />
For the year ended December 31, 2010, the expense for defined employee future benfits under IFRS was $3.3 million lower than that<br />
under CGAAP due to the application of IFRIC 14 and IAS 19 on a prospective basis.<br />
d) Decommissioning Liabilities<br />
As at the IFRS Transition Date, the decommissioning obligation liability increased by $1.1 million on transition to IFRS due to the use<br />
of country specific risk free rates under IFRS, as opposed to the use of country specific risk-adjusted discount rates under CGAAP.<br />
<strong>The</strong> use of lower discount rates also resulted in the calculation of higher decommissioning liability balances throughout 2010 under<br />
IFRS, which resulted in an IFRS transitional adjustment to the property, plant and equipment account (relating to decommissioning<br />
costs) in the amount of $1.6 million as at December 31, 2010.<br />
e) Deferred Income Tax Effect<br />
<strong>The</strong>se are the required deferred tax effects related to the various IFRS adjustments (i.e., property, plant and equipment; employee<br />
future benefits; decommissioning liabilities etc.). <strong>The</strong> rates used were based on the statutory tax rates in the jurisdiction where the<br />
adjustment was made.<br />
f) Amortization of Property, Plant and Equipment<br />
<strong>The</strong> 2010 income statement adjustment was due to the recalculation of depreciation expense on all fixed assets due to the<br />
application of a more detailed componentization analysis including their expected useful lives, which, in a number of cases,<br />
was extended. This resulted in a decrease in the amortization cost under IFRS versus CGAAP of $5.1 million for the year ended<br />
December 31, 2010.
48 <strong>ShawCor</strong> Ltd. Management's discussion and analysis<br />
g) Foreign Exchange<br />
Foreign exchange gains decreased by $0.1 million for the twelve months ended December 31, 2010, primarily due to the change<br />
in the translation method for certain entities from the Temporal Method under CGAAP to the Current Rate Method under IFRS.<br />
h) Selling, General and Administrative Expense<br />
<strong>The</strong> selling, general and administrative expense for the year ended December 31, 2010 has decreased by $2.5 million under<br />
IFRS versus CGAAP, because of lower defined employee future benefits expense under IFRS of $3.3 million due to the application<br />
of IFRIC 14 on transition to IFRS and the application of IAS 19 on a prospective basis, which was partly offset by higher<br />
decommissioning liabilities expense of $0.5 million.<br />
i) Account Reclassification<br />
Certain accounts were reclassified for financial statement presentation purposes, including deferred tax assets from current<br />
to non-current, reflecting the adoption of IAS 12 and the requirements for provisions to be presented separately by IAS 37.<br />
j) Stock-based Compensation<br />
Adopting IFRS has resulted in a $145 thousand additional expense due to revaluing liability settled instruments (Share Appreciation<br />
Rights “SAR”) using the Black-Scholes model, compared to using the intrinsic value of liability under CGAAP.<br />
k) Adjustment to the Consolidated Statement of Cash Flows<br />
<strong>The</strong> changes to the consolidated statement of income and consolidated balance sheet have resulted in various reclassifications<br />
on the consolidated statement of cash flows; however, there were no material changes to the net cash flows. As a result, no<br />
reconciliations have been presented.<br />
9.0 Disclosure Controls and Internal Controls over <strong>Financial</strong> Reporting<br />
<strong>The</strong> President and Chief Executive Officer and the Vice President, Finance and Chief <strong>Financial</strong> Officer, together with the management<br />
of the Company, have evaluated the effectiveness of the Company’s Disclosure Controls and Procedures (“DC&Ps”) (as defined<br />
in the rules of the Canadian Securities Administrators) and the effectiveness of Internal Controls over <strong>Financial</strong> Reporting (“ICFRs”).<br />
Based on that evaluation, they have concluded that the Company’s DC&Ps were effective as at December 31, 2011 and 2010.<br />
Furthermore, they have concluded that the Company’s ICFRs were adequate and effective to prevent a material misstatement<br />
of the Company’s annual financial statements as at December 31, 2011. <strong>The</strong>re were no material changes in either the Company’s<br />
DC&Ps or its ICFRs during 2011.<br />
10.0 General Outlook<br />
In late 2008 and throughout 2009, the global economic recession caused lower energy demand and reduced capital availability<br />
for infrastructure investment, which resulted in pipeline project delays and cancellations and fewer well completions. Commencing<br />
in 2010 and continuing in 2011, energy demand rebounded strongly and many of the major pipeline projects that had been delayed<br />
or deferred during the economic recession were reactivated, with front end engineering, project bidding and, by the end of 2011, the<br />
commencement of contract awards. <strong>The</strong> strengthening of pipeline infrastructure market demand was first indicated early in 2011<br />
when the value of projects, for which <strong>ShawCor</strong> had provided firm bids, exceeded $1.5 billion for the first time. During the fourth<br />
quarter of 2011 and early 2012, the improving outlook for pipeline infrastructure was further evidenced when <strong>ShawCor</strong> received<br />
contracts or letters of intent for projects with a cumulative value exceeding $800 million. As a result of the award of new contracts,<br />
<strong>ShawCor</strong>’s order backlog reached a new record level of $548 million at December 31, 2011 and this backlog is expected to lead to<br />
revenue growth, particularly in the Company’s Pipeline and Pipe Services segment operations in Asia Pacific and Latin America, as<br />
noted below.<br />
<strong>The</strong> outlook for market activity in the Company’s Pipeline and Pipe Services segment by region and in the Petrochemical and<br />
Industrial segment is outlined below:<br />
Pipeline and Pipe Services Segment – North America<br />
<strong>The</strong> Company produced strong growth in revenue in North America during 2011 and overall levels of activity are expected to<br />
remain strong in 2012 and 2013. <strong>The</strong> improvement in revenue in 2011 was largely driven by the increased level of well drilling and<br />
completions throughout North America, which has bolstered demand for the Company’s small diameter pipe coating, composite<br />
pipe, joint protection products and drill pipe services. With total well completion volumes expected to stabilize at current levels,<br />
growth will be driven by market share gains. This is most evident with the Company’s spoolable composite pipe business unit, which<br />
has steadily gained market share in the United States following the installation of service centers in locations well positioned to<br />
supply pipe demand from emerging shale resources. <strong>The</strong> Company believes that the potential exists for further gains in market share
ANNUAL REPORT 2011 <strong>ShawCor</strong> Ltd.<br />
49<br />
and revenue growth in the North American composite pipe market. Another market targeted for share gain is drill string tubular<br />
services in the United States. <strong>The</strong> first US drill string tubular service center was successfully launched in 2011 in Pennsylvania to<br />
supply the Marcellus and Utica shale plays and further centers will be opened in the United States in 2012 to support customers in<br />
other active shale regions.<br />
In pipe coating, growth in 2012 from projects involving offshore applications is expected to largely offset modest weakening in large<br />
diameter project volumes. In the fourth quarter of 2011, the Company commenced production on the $40 million Jack/St. Malo<br />
project at the Brigden facility in Beaumont, Texas. <strong>The</strong> Company has also submitted bids for additional deepwater flow assurance<br />
projects in the Gulf of Mexico that, if won, will be executed in 2012 and 2013. In addition, the Company will mobilize a mobile<br />
concrete weight coating plant to the Beaumont site to execute a project for a customer in South America.<br />
Pipeline and Pipe Services Segment – Latin America<br />
<strong>The</strong> Company experienced weak market conditions in both Mexico and Brazil throughout 2011 with revenue well below historical<br />
levels. For 2012, the Company has secured several large projects that will deliver significant revenue growth. Offshore Mexico<br />
activity is expected to pick up based on the Company’s level of bidding activity. In Brazil, the $20 million P55 Risers pipe coating<br />
project has finally commenced production after customer delays during 2011. Elsewhere in the Latin America region, the Company<br />
has secured a project with Technip for concrete weight coating on a large diameter offshore gas transmission line. This work will<br />
be executed in Trinidad and is expected to contribute in excess of $60 million in revenue.<br />
Beyond 2012, the Company expects the Latin America region to be a continuing source of revenue growth as Brazil undertakes the<br />
development of pipeline infrastructure necessary to bring to production the vast deepwater oil resources discovered in the pre-salt<br />
Santos basin. <strong>The</strong> Company also expects that Mexico and other markets in South America will offer growth potential for composite<br />
pipe products that are now experiencing growing market acceptance in North America.<br />
Pipeline and Pipe Services Segment – EMAR<br />
During 2011, revenue increased over the prior year in the Europe, Middle East, Africa, Russia (“EMAR”) region as a result of the<br />
execution of the US$93 million Laggan–Tormore project at <strong>ShawCor</strong>’s Leith, Scotland facility. <strong>The</strong> Company does not expect to be<br />
able to fully replace the 2011 Leith volume of activity in 2012. <strong>The</strong> outlook is thus for a modest slowdown in region revenue, with<br />
lower volumes from Leith partially offset by a pick up in facility utilization at the Company’s pipe coating plants in Orkanger, Norway<br />
and in the UAE. Beyond 2012, the potential for growth exists through expansion opportunities that are under evaluation for several<br />
geographic markets in the region where the Company does not currently have pipe coating facilities.<br />
Pipeline and Pipe Services Segment – Asia Pacific<br />
<strong>The</strong> Company’s Asia Pacific region, having experienced a significant reduction in revenue in 2011 versus the prior year, is now<br />
in a position, with booked production orders, to generate very strong revenue growth. During 2011 and in the first quarter of 2012,<br />
<strong>ShawCor</strong> has booked production orders or holds letters of intent for projects that will be executed at the Company’s facilities in<br />
Malaysia and Indonesia with a value that exceeds $700 million. <strong>The</strong>se projects include the PTTEP Zawtika Development Project, the<br />
Pearl Energy Ruby pipeline, the trunk line and flow assurance pipe coating contracts for the Chevron Wheatstone LNG project and<br />
the Ichthys gas export pipeline. <strong>The</strong>se orders should deliver strong revenue growth for the Company’s Asia Pacific region in 2012<br />
and 2013.<br />
In the first quarter of 2012, Asia Pacific revenue will be largely unchanged from the fourth quarter of 2011, while operating margins<br />
will be impacted by the costs associated with loading in pipe and ramping up the facilities for the launch of the Wheatstone and<br />
Ichthys projects. However, steady growth in revenue and improvement in margins are expected once production begins in the second<br />
quarter. By the fourth quarter, the Company’s facilities in Malaysia and Indonesia are expected to be operating at record volume<br />
levels with resulting strong operating margins. This level of activity, based on the booked orders, will be sustained throughout 2013<br />
and well into 2014.<br />
Petrochemical and Industrial Segment<br />
<strong>The</strong> improved revenue and operating income generated by the Petrochemical and Industrial segment businesses in 2011 was the<br />
result of the recovery from the abrupt decline in activity associated with the global economic recession in late 2008 and in 2009.<br />
With continued stability in the global economy, operating performance is expected to continue to improve in 2012 based on<br />
a stronger backlog for wire and cable project activity particularly for the oil sands market and the continued ramp up of production<br />
and sales in the segment’s DSG Canusa China facility. <strong>The</strong> major risk to this outlook relates to the potential for economic<br />
deceleration in Europe and the impact this would have on the Company’s automotive and industrial products shipments.
50 <strong>ShawCor</strong> Ltd. Management's discussion and analysis<br />
Order Backlog<br />
<strong>The</strong> Company’s order backlog consists of firm customer orders only and represents the revenue the Company expects to realize<br />
on booked orders over the succeeding twelve months. <strong>The</strong> Company reports the twelve month billable backlog because it provides<br />
a leading indicator of significant changes in consolidated revenue. A majority of the Company’s revenue is typically derived from<br />
small orders and projects less than $5 million in value. <strong>The</strong>se orders/projects do not typically enter the backlog as they are booked<br />
and executed with minimal lead times. In contrast, projects with values exceeding $5 million often have extended lead times before<br />
production commences and thus the growth or decline in such project activity will cause the backlog to change over time and signal<br />
changes in future revenue. In the third quarter of 2008, the Company’s backlog peaked at $529 million and revenue in 2008 reached<br />
a record level of $1.38 billion. Subsequent to 2008, the order backlog declined and reached a low level for 2011 of $333 million at the<br />
end of first quarter. Since that time, the resurgence of pipeline infrastructure demand and new contract orders has resulted in an<br />
increase in the backlog to a new record level of $548 million at December 31, 2011. With the award, in the first quarter of 2012, of<br />
the Ichthys GEP project, with a value exceeding $400 million, further growth in the backlog through 2012 is expected.<br />
With a record backlog in hand and further backlog increases expected, the Company has a high degree of confidence in its outlook<br />
for growth in revenue in 2012 and 2013. Revenue growth will also lead to gains in facility utilization, the operational driver for<br />
operating margin improvement. With a focus on the successful execution of the projects that have been secured, <strong>ShawCor</strong> is well<br />
positioned to generate strong cash flows over the next two years. Increasing cash flows from operations, plus the Company’s current<br />
healthy financial position, create the resources to allow <strong>ShawCor</strong> to pursue its strategy of growth through geographic expansion, new<br />
product and service introductions in existing and complementary markets and through the acquisition of companies that broaden<br />
the Company’s market position within the global pipeline and energy services industry.<br />
11.0 Risks and Uncertainties<br />
Operating in an international environment, servicing predominantly the oil and gas industry, <strong>ShawCor</strong> faces a number of business<br />
risks and uncertainties that could materially and adversely affect the Company’s projections, business, results of operations and<br />
financial condition.<br />
<strong>The</strong> following summarizes the Company’s risks and uncertainties and how it manages and mitigates each risk:<br />
11.1 Economic Risks<br />
An economic downturn could adversely affect demand for the Company’s products and services and, consequently, its<br />
projections, business, results of operations and financial condition.<br />
Demand for oil and natural gas is influenced by numerous factors, including the North American and worldwide economies as well<br />
as activities of the Organization of Petroleum Exporting Countries (“OPEC”). Economic declines impact demand for oil and natural<br />
gas and result in a softening of oil and gas prices and projected oil and gas drilling activity. If economic conditions or international<br />
markets decline unexpectedly, the Company’s projections, business, results of operations and financial condition could be materially<br />
adversely affected. In addition, if actions by OPEC and other oil producers to increase production of oil adversely affect world oil<br />
prices, additional declines in rig counts could result, particularly internationally, and the Company’s projections, business, results<br />
of operations and financial condition could be materially adversely affected. Similarly, demand for the products of the Petrochemical<br />
and Industrial segment’s businesses is largely dependent on the level of general economic activity in North America and Europe.<br />
Decreases in economic activity in these regions could result in significant decreases in activity levels in these businesses.<br />
A cyclical decline in the level of global pipeline construction could have a material adverse effect on the Company’s projections,<br />
business, results of operations and financial condition.<br />
<strong>The</strong> Company’s business is materially dependent on the level of global pipeline construction activity, which, in turn, relates to the<br />
growth in demand for oil and natural gas and the availability of new supplies to meet this increased demand. Reductions in capital<br />
spending by producers could dampen demand for the Company’s products and services supplied in pipeline markets.<br />
Revenue generated by the Company’s Pipeline and Pipe Services segment accounted for 88% of consolidated sales in 2011. With this<br />
proportion expected to continue, the Company’s revenue is materially dependent on the global Pipeline and Pipe Services industry.<br />
Any reduction in the anticipated growth in pipeline market activity could have a material adverse effect on the Company’s<br />
projections, business, results of operations and financial condition.
ANNUAL REPORT 2011 <strong>ShawCor</strong> Ltd.<br />
51<br />
Increases in the prices and/or shortages in the supply of raw materials used in the Company’s manufacturing processes could<br />
adversely affect the competitiveness of the Company, its ability to serve its customers’ needs and its financial performance.<br />
<strong>The</strong> Company purchases a broad range of materials and components throughout the world in connection with its manufacturing<br />
activities. Major items include polyolefin and other polymeric resins, iron ore, cement, adhesives, sealants and copper and other<br />
nonferrous wire. <strong>The</strong> ability of suppliers to meet performance and quality specifications and delivery schedules is important to the<br />
maintenance of customer satisfaction. While the materials required for its manufacturing operations have generally been readily<br />
available, cyclical swings in supply and demand can produce short-term shortages and/or price spikes. <strong>The</strong> Company’s ability<br />
to pass on any such price increases may be restricted in the short term.<br />
A decline in global drilling activity could have a material adverse effect on the Company’s projections, business, results<br />
of operations and financial condition.<br />
<strong>The</strong> Company’s business is materially dependent on the level of global drilling activity, which, in turn, depends on global oil and gas<br />
demand, prices and production depletion rates. Lower drilling activity decreases demand for the Company’s products and services,<br />
including small diameter pipe coating, composite pipe and tubular inspection and inventory management services.<br />
Economic Risk Mitigation<br />
<strong>The</strong> Company cannot completely mitigate economic risks. However, the Company maintains a competitive geographical presence<br />
in a diverse number of regions and has implemented several systems and processes to manage operational risks and to achieve<br />
continuous improvements in operational effectiveness in addition to various cost reduction initiatives. Through these efforts,<br />
economic risk is mitigated.<br />
Refer to section 1.5 – Capability to Deliver Results for additional information with respect to the Company’s systems and processes.<br />
11.2 Litigation and Legal Risks<br />
<strong>The</strong> Company could be subject to substantial liability claims, which could adversely affect its projections, business, results of<br />
operations and financial condition.<br />
Some of the Company’s products are used in hazardous applications where an accident or a failure of a product could cause personal<br />
injury, loss of life, damage to property, equipment or the environment, as well as the suspension of the end-user’s operations. If the<br />
Company’s products were to be involved in any of these difficulties, the Company could face litigation and may be held liable for<br />
those losses. <strong>The</strong> Company’s insurance coverage may not be adequate in risk coverage or policy limits to cover all losses or liabilities<br />
that it may incur. Moreover, the Company may not be able in the future to maintain insurance at levels of risk coverage or policy<br />
limits that management deems adequate. Any claims made under the Company’s policies likely will cause its premiums to increase.<br />
Any future damages deemed to be caused by the Company’s products or services that are not covered by insurance, or that are<br />
in excess of policy limits or subject to substantial deductibles, could have a material adverse effect on the Company’s projections,<br />
business, results of operations and financial condition.<br />
<strong>The</strong> Company is subject to litigation and could be subject to future litigation and significant potential financial liability.<br />
From time to time, the Company is a party to litigation and legal proceedings that it considers to be a part of the ordinary course<br />
of business. Although none of the litigation or legal proceedings in which the Company is currently involved could reasonably<br />
be expected to have a material adverse effect on the Company’s projections, business, results of operations or financial condition,<br />
the Company may, however, become involved in material legal proceedings in the future. Such proceedings may include, for example,<br />
product liability claims and claims relating to the existence or use of hazardous materials on the Company’s property or in its<br />
operations, as well as intellectual property disputes and other material legal proceedings with competitors, customers, employees<br />
and governmental entities. <strong>The</strong>se proceedings could arise from the Company’s current or former actions and operations or the<br />
actions or operations of businesses and entities acquired by the Company prior to acquisition. <strong>The</strong> Company maintains insurance<br />
it believes to be commercially reasonable and customary; however, such coverage may be inadequate for or inapplicable to<br />
particular claims.<br />
Litigation and Legal Risk Mitigation<br />
<strong>The</strong> Company cannot completely mitigate legal risks. However, the Company maintains adequate commercial insurance to mitigate<br />
most adverse litigation and legal risks.
52 <strong>ShawCor</strong> Ltd. Management's discussion and analysis<br />
11.3 HSE Risks<br />
<strong>The</strong> Company is subject to Health, Safety and Environmental laws and regulations that expose it to potential financial liability.<br />
<strong>The</strong> Company’s operations are regulated under a number of federal, provincial, state, local and foreign environmental laws<br />
and regulations, which govern, among other things, the discharge of hazardous materials into the air and water as well as the<br />
handling, storage and disposal of hazardous materials. Compliance with these environmental laws is a major consideration<br />
in the manufacturing of the Company’s products, as the Company uses, generates, stores and disposes of hazardous substances<br />
and wastes in its operations. <strong>The</strong> Company may be subject to material financial liability for any investigation and clean-up of<br />
such hazardous materials. In addition, many of the Company’s current and former properties are or have been used for industrial<br />
purposes. Accordingly, the Company also may be subject to financial liabilities relating to the investigation and remediation<br />
of hazardous materials resulting from the actions of previous owners or operators of industrial facilities on those sites. Liability<br />
in certain instances may be imposed on the Company regardless of the legality of the original actions relating to the hazardous<br />
or toxic substances or whether or not the Company knew of, or was responsible for, the presence of those substances. <strong>The</strong> Company<br />
is also subject to various Canadian and US federal, provincial, state and local laws and regulations as well as foreign laws and<br />
regulations relating to safety and health conditions in its manufacturing facilities. Those laws and regulations may also subject<br />
the Company to material financial penalties or liabilities for any non-compliance, as well as potential business disruption if any<br />
of its facilities or a portion of any facility is required to be temporarily closed as a result of any violation of those laws and regulations.<br />
Any such financial liability or business disruption could have a material adverse effect on the Company’s projections, business,<br />
results of operations and financial condition.<br />
Demand for the Company’s products and services could be adversely affected by changes to Canadian, US or other countries’<br />
laws or regulations pertaining to the emission of Carbon Dioxide and other Greenhouse Gases (“GHGs”) into the atmosphere.<br />
Although the Company is not a large producer of GHGs, the products and services of the Company’s production are mainly related<br />
to the transmission of hydrocarbons including crude oil and natural gas, whose ultimate consumption are major sources of GHG<br />
emissions. Changes in the regulations concerning the release of GHGs into the atmosphere, including the introduction of so-called<br />
carbon taxes or limitations over the emissions of GHGs, may adversely impact the demand for hydrocarbons and ultimately, the<br />
demand for the Company’s products and services.<br />
HSE Risk Mitigation<br />
To minimize risks associated with HSE matters, the Company has implemented a comprehensive audit program in which it has<br />
completed detailed environmental audits at manufacturing and service locations across all seven divisions. Furthermore, the<br />
Company is committed to being an IIF workplace.<br />
11.4 Political and Regulatory Risks<br />
<strong>The</strong> Company’s international operations may experience interruptions due to political, economic or other risks, which could<br />
adversely affect the Company’s projections, business, results of operations and financial condition.<br />
During 2011, the Company derived over 23% of its total revenue from its facilities outside North America and Western Europe.<br />
In addition, part of the Company’s sales from its locations in Canada and the US were for use in other countries. <strong>The</strong> Company’s<br />
operations in certain international locations are subject to various political and economic conditions existing in those countries<br />
that could disrupt operations. <strong>The</strong>se risks include:<br />
• currency fluctuations and devaluations;<br />
• currency restrictions and limitations on repatriation of profits;<br />
• political instability and civil unrest;<br />
• hostile or terrorist activities; and<br />
• restrictions on foreign operations.
ANNUAL REPORT 2011 <strong>ShawCor</strong> Ltd.<br />
53<br />
<strong>The</strong> Company’s foreign operations may suffer disruptions and may incur losses that would not be covered by insurance. In particular,<br />
civil unrest in politically unstable countries may increase the possibility that the Company’s operations could be interrupted or<br />
adversely affected. <strong>The</strong> impact of such disruptions could include the Company’s inability to ship products in a timely and cost<br />
effective manner, its inability to place contractors and employees in various countries or regions, or result in the need for evacuations<br />
or similar disruptions.<br />
Any material currency fluctuations or devaluations or political unrest that may disrupt oil and gas exploration and production<br />
or the movement of funds and assets could materially adversely affect the Company’s projections, business, results of operations<br />
and financial condition.<br />
<strong>The</strong> Company’s projections, business, results of operations and financial condition could be adversely affected by actions under<br />
Canadian, US or other trade laws.<br />
<strong>The</strong> Company is a Canadian-based company with significant operations in the United States. <strong>The</strong> Company also owns and operates<br />
international manufacturing operations that support its Canadian and US operations. If actions under Canadian, US or other trade<br />
laws were instituted that limited the Company’s access to the materials or products necessary for such manufacturing operations,<br />
the Company’s ability to meet its customers’ specifications and delivery requirements would be reduced. Any such reduction in the<br />
Company’s ability to meet its customers’ specifications and delivery requirements could have a material adverse effect on the<br />
Company’s projections, business, results of operations and financial condition.<br />
<strong>The</strong> Company also conducts business in countries permitted by Canadian law that would be prohibited by US trade laws if the<br />
Company were a US entity or controlled by a US entity or person. While the Company believes that it and its subsidiaries currently<br />
are in compliance with applicable US trade laws, changes in these regulations or the interpretation of these regulations, or changes<br />
in the control of the Company, could adversely affect the Company’s business.<br />
Political and Regulatory Risk Mitigation<br />
<strong>The</strong> Company manages political and regulatory risks by working with government, regulators and other parties to resolve issues,<br />
if any. In addition, the Company ensures that it is compliant with the laws and regulations within the jurisdictions where it operates.<br />
12.0 Environmental Matters<br />
While environmental related liabilities are considered immaterial to the Company’s financial results, they are important to the<br />
Company from a social responsibility standpoint. Refer to section 11.3 – HSE Risks for additional information with respect to the<br />
Company’s environmental matters.<br />
As at December 31, 2011, the accruals on the consolidated balance sheet related to environmental matters and included<br />
as decommissioning liability obligations were $23.4 million. <strong>The</strong> Company believes the accruals to be sufficient to fully satisfy<br />
all liabilities related to known environmental matters.<br />
13.0 Reconciliation of Non-GAAP Measures<br />
<strong>The</strong> Company evaluates its performance using a number of different measures that are not in accordance with GAAP and should<br />
not be considered as an alternative to net income or any other measure of performance under GAAP. <strong>The</strong> Company’s method<br />
of calculating these measures may differ from other entities and as a result may not necessarily be comparable to measures<br />
used by other entities.<br />
EBITDA<br />
EBITDA is defined as earnings before interest, income taxes, depreciation and amortization, impairment of property, plant,<br />
equipment, goodwill and intangible assets, investment losses and gain on revaluation of investment. <strong>The</strong> Company believes that<br />
EBITDA is a useful supplemental measure that provides a meaningful indication of the Company’s results from principal business<br />
activities prior to the consideration of how these activities are financed or the tax impacts in various jurisdictions. Refer to section<br />
2.1 – Selected Annual Information of this report for a reconciliation of the Company’s EBITDA to its net income (attributable to<br />
shareholders of the Company) in accordance with GAAP.
54 <strong>ShawCor</strong> Ltd. Management's discussion and analysis<br />
Return on Equity (“ROE”)<br />
ROE is defined as net income divided by average shareholders’ equity over the year and is used by the Company to assess the<br />
efficiency of generating profits from each unit of shareholders’ equity.<br />
<strong>The</strong> following table sets forth the calculation of the Company’s ROE as at December 31:<br />
(in thousands of Canadian dollars) 2011 2010<br />
Net income $ 56,683 $ 95,072<br />
Average shareholders’ equity 848,152 811,629<br />
ROE 6.7% 11.7%<br />
Free Cash Flow (“FCF”)<br />
FCF is defined as operating cash flow less capital expenditures and dividends paid during the year. FCF is intended to demonstrate<br />
the amount of cash the Company has available to invest in capital growth initiatives and the ability to generate cash flows to<br />
maintain operations.<br />
<strong>The</strong> following table sets forth the calculation of the Company’s FCF as at December 31:<br />
(in thousands of Canadian dollars) 2011 2010<br />
Cash provided by operating activities $ 45,327 $ 53,244<br />
Less:<br />
Capital expenditures (55,982) (48,723)<br />
Dividends paid (21,930) (20,468)<br />
FCF $ (32,585) $ (15,947)<br />
Days Sales Outstanding (“DSO”)<br />
DSO is defined as the number of days that accounts receivable are outstanding based on a 90-day cycle and is calculated by<br />
dividing the average trade accounts receivable balance by revenue for the quarter and multiplying by 90 days. DSO approximates the<br />
measure of the average number of days from when the Company recognizes revenue until the cash is collected from the customer.<br />
<strong>The</strong> following table sets forth the calculation for the Company’s DSO as at December 31:<br />
(in thousands of Canadian dollars) 2011 2010<br />
Average accounts receivable $ 236,275 $ 218,398<br />
Revenue for the fourth quarter 341,780 292,086<br />
DSO 62 67<br />
Days Payables Outstanding (“DPO”)<br />
DPO is defined as the average number of days from when purchased goods and services are received until payment is made to the<br />
suppliers based on a 90-day cycle and is calculated by dividing the quarter end accounts payable and accrued liabilities balance by<br />
the cost of goods sold for the quarter and multiplying by 90 days.<br />
<strong>The</strong> following table sets forth the calculation for the Company’s DPO as at December 31:<br />
(in thousands of Canadian dollars) 2011 2010<br />
Average accounts payable and accrued liabilities $ 144,270 $ 126,278<br />
Cost of goods sold for the fourth quarter 210,449 176,293<br />
DPO 62 64
ANNUAL REPORT 2011 <strong>ShawCor</strong> Ltd.<br />
55<br />
Working Capital Ratio<br />
Working capital ratio is defined as current assets divided by current liabilities. This metric provides management with an indication<br />
of the current liquidity available to the Company before considering long-term debt.<br />
<strong>The</strong> following table sets forth the calculation for the Company’s working capital ratio as at December 31:<br />
(in thousands of Canadian dollars) 2011 2010<br />
Current assets $ 530,607 $ 555,209<br />
Current liabilities 248,759 271,357<br />
Working capital ratio 2.13 2.05<br />
Fixed Charge Coverage Ratio<br />
Fixed Charge Coverage Ratio is defined as EBITDA divided by interest expense. <strong>The</strong> Company is required to maintain a fixed charge<br />
coverage ratio of more than 2.5 to 1 under the terms of its credit facilities.<br />
<strong>The</strong> following table sets forth the calculation of the Company’s fixed charge coverage ratio as at December 31:<br />
(in thousands of Canadian dollars) 2011 2010<br />
EBITDA $ 138,837 $ 183,035<br />
Interest expense 4,507 2,805<br />
Fixed charge coverage ratio 31 65<br />
<strong>The</strong> Company is in compliance with this debt covenant as at December 31, 2011.<br />
Debt to Total Capitalization Ratio<br />
Debt to total capitalization ratio is defined as the Company’s long-term debt divided by the sum of shareholders’ equity and<br />
long-term debt. <strong>The</strong> Company is required to maintain a debt to total capitalization ratio of no more than 0.40 to 1. <strong>The</strong> Company<br />
is in compliance with this debt covenant as at December 31, 2011.<br />
14.0 Forward Looking Information<br />
This document includes certain statements that reflect management’s expectations and objectives for the Company’s future<br />
performance, opportunities and growth, which statements constitute forward looking information under applicable securities<br />
laws. Such statements, other than statements of historical fact, are predictive in nature or depend on future events or conditions.<br />
Forward looking information involves estimates, assumptions, judgments and uncertainties. <strong>The</strong>se statements may be identified<br />
by the use of forward looking terminology such as “may”, “will”, “should”, “anticipate”, “expect”, “believe”,“predict”, “estimate”,<br />
“continue”, “intend”, “plan” and variations of these words or other similar expressions. Specifically, this document includes<br />
forward looking information in respect of, among other things, the impact of the existing order backlog on the Company’s revenue,<br />
the impact of global economic activity on the demand for the Company’s products as well as the prices of commodities used by the<br />
Company, the impact of changing energy demand, supply and prices, the impact and likelihood of changes in competitive conditions<br />
in the markets in which the Company participates, the impact of changing laws for environmental compliance on the Company’s<br />
capital and operating costs, and the adequacy of the Company’s existing accruals in respect thereof, the Company’s relationships<br />
with its employees, the continued establishment of international operations, the effect of continued development in emerging<br />
economies, as well as the Company’s plans as they relate to research and development activities and the maintenance of its current<br />
dividend policies, the outlook for revenue and operating income and the expected development in the Company’s order backlog.<br />
Forward looking information involves known and unknown risks and uncertainties that could cause actual results to differ materially<br />
from those predicted by the forward looking information. We caution readers not to place undue reliance on forward looking<br />
information as a number of factors could cause actual events, results and prospects to differ materially from those expressed in<br />
or implied by the forward looking information. Significant risks facing the Company include, but are not limited to: changes in global<br />
economic activity and changes in energy supply and demand, which impact on the level of drilling activity and pipeline construction;<br />
exposure to product and other liability claims; shortages of or significant increases in the prices of raw materials used by the<br />
Company; compliance with environmental, trade and other laws; political, economic and other risks arising from the Company’s<br />
international operations; fluctuations in foreign exchange rates, as well as other risks and uncertainties, as more fully described<br />
herein under the heading “Risks and Uncertainties”.
56 <strong>ShawCor</strong> Ltd. Management's discussion and analysis<br />
<strong>The</strong>se statements of forward looking information are based on assumptions, estimates and analysis made by management in light<br />
of its experience and perception of trends, current conditions and expected developments as well as other factors believed to be<br />
reasonable and relevant in the circumstances. <strong>The</strong>se assumptions include assumptions in respect of the potential for improvement<br />
in demand for the Company’s products and services as a result of continued global economic recovery, the potential for increased<br />
investment in global energy infrastructure as a result of stabilization of capital markets, the Company’s ability to execute projects<br />
under contract, the continued supply of and stable pricing for commodities used by the Company and the availability of personnel<br />
resources sufficient for the Company to operate its businesses. <strong>The</strong> Company believes that the expectations reflected in the forward<br />
looking information are based on reasonable assumptions in light of currently available information. However, should one<br />
or more risks materialize or should any assumptions prove incorrect, then actual results could vary materially from those expressed<br />
or implied in the forward looking information included in this document and the Company can give no assurance that such<br />
expectations will be achieved.<br />
When considering the forward looking information in making decisions with respect to the Company, readers should carefully<br />
consider the foregoing factors and other uncertainties and potential events. <strong>ShawCor</strong> Ltd. does not assume the obligation to revise<br />
or update forward looking information after the date of this document or to revise it to reflect the occurrence of future unanticipated<br />
events, except as may be required under applicable securities laws.<br />
Other information relating to the Company, including its Annual Information Form, is available on SEDAR at www.sedar.com.<br />
March 29, 2012
ANNUAL REPORT 2011 <strong>ShawCor</strong> Ltd.<br />
57<br />
Management’s Responsibility for <strong>Financial</strong> Statements<br />
<strong>The</strong> accompanying consolidated financial statements of <strong>ShawCor</strong> Ltd. included in this Annual Report are the responsibility<br />
of management and have been approved by the Board of Directors.<br />
<strong>The</strong> consolidated financial statements have been prepared by management in accordance with International <strong>Financial</strong> Reporting<br />
Standards, as issued by the International Accounting Standards Board. When alternative accounting methods exist, management<br />
has selected those it deems to be most appropriate in the circumstances. <strong>The</strong> consolidated financial statements include estimates<br />
based on the experience and judgment of management in order to ensure that the financial statements are presented fairly,<br />
in all material respects. <strong>Financial</strong> information presented elsewhere in the annual report is consistent with that in the consolidated<br />
financial statements.<br />
<strong>The</strong> management of the Company and its subsidiaries developed and continues to maintain systems of internal accounting controls<br />
and management practices designed to provide reasonable assurance that the financial information is relevant, reliable and accurate<br />
and that the Company's assets are appropriately accounted for and adequately safeguarded.<br />
<strong>The</strong> Board of Directors exercises its responsibilities for ensuring that management fulfils its responsibilities for financial reporting<br />
and internal control with the assistance of its Audit Committee.<br />
<strong>The</strong> Audit Committee is appointed by the Board and all of its members are Directors who are not officers or employees of <strong>ShawCor</strong><br />
Ltd. or any of its subsidiaries. <strong>The</strong> Committee meets periodically to review quarterly financial reports and to discuss internal controls<br />
over the financial reporting process, auditing matters and financial reporting issues. <strong>The</strong> Committee reviews the Company’s annual<br />
consolidated financial statements and recommends their approval to the Board of Directors.<br />
<strong>The</strong>se financial statements have been audited by Ernst & Young LLP, the external auditors, on behalf of the shareholders.<br />
Ernst & Young LLP has full and free access to the Audit Committee.<br />
March 1, 2012<br />
WILLIAM P. BUCKLEy<br />
PRESIDENT AND CHIEF EXECUTIVE OFFICER<br />
gARY S. LOVE<br />
VICE-PRESIDENT, FINANCE AND CHIEF FINANCIAL OFFICER
58 <strong>ShawCor</strong> Ltd. consolidated financial statements<br />
Independent Auditors’ Report<br />
To the Shareholders of <strong>ShawCor</strong> Ltd.<br />
We have audited the accompanying consolidated financial statements of <strong>ShawCor</strong> Ltd., which comprise the consolidated balance<br />
sheets as at December 31, 2011 and 2010, and January 1, 2010, and the consolidated statements of income, comprehensive income,<br />
changes in shareholders’ equity and cash flows for the years ended December 31, 2011 and 2010, and a summary of significant<br />
accounting policies and other explanatory information.<br />
Management’s Responsibility for the Consolidated <strong>Financial</strong> Statements<br />
Management is responsible for the preparation and fair presentation of these consolidated financial statements in accordance<br />
with International <strong>Financial</strong> Reporting Standards, and for such internal control as management determines is necessary to enable<br />
the preparation of consolidated financial statements that are free from material misstatement, whether due to fraud or error.<br />
Auditors’ Responsibility<br />
Our responsibility is to express an opinion on these consolidated financial statements based on our audits. We conducted our<br />
audits in accordance with Canadian generally accepted auditing standards. Those standards require that we comply with ethical<br />
requirements and plan and perform the audit to obtain reasonable assurance about whether the consolidated financial statements<br />
are free from material misstatement.<br />
An audit involves performing procedures to obtain audit evidence about the amounts and disclosures in the consolidated<br />
financial statements. <strong>The</strong> procedures selected depend on the auditors’ judgment, including the assessment of the risks of material<br />
misstatement of the consolidated financial statements, whether due to fraud or error. In making those risk assessments, the auditors<br />
consider internal control relevant to the entity’s preparation and fair presentation of the consolidated financial statements in order<br />
to design audit procedures that are appropriate in the circumstances, but not for the purpose of expressing an opinion on the<br />
effectiveness of the entity’s internal control. An audit also includes evaluating the appropriateness of accounting policies used and<br />
the reasonableness of accounting estimates made by management, as well as evaluating the overall presentation of the consolidated<br />
financial statements.<br />
We believe that the audit evidence we have obtained in our audits is sufficient and appropriate to provide a basis for our audit opinion.<br />
Opinion<br />
In our opinion, the consolidated financial statements present fairly, in all material respects, the financial position of <strong>ShawCor</strong> Ltd.<br />
as at December 31, 2011 and 2010, and January 1, 2010, and its financial performance and its cash flows for the years ended<br />
December 31, 2011 and 2010 in accordance with International <strong>Financial</strong> Reporting Standards.<br />
Chartered Accountants<br />
Licensed Public Accountants<br />
Toronto, Canada<br />
March 1, 2012
ANNUAL REPORT 2011 <strong>ShawCor</strong> Ltd.<br />
59<br />
Consolidated Balance Sheets<br />
December 31 December 31 January 1<br />
(in thousands of Canadian dollars) 2011 2010 2010<br />
Assets<br />
Current Assets<br />
Cash and cash equivalents note 8 $ 67,276 $ 155,998 $ 249,988<br />
Accounts receivable note 9 279,324 243,955 191,821<br />
Income taxes receivable note 21 15,981 13,823 14,055<br />
Inventories note 10 146,786 126,132 109,379<br />
Prepaid expenses 20,970 14,171 14,392<br />
Derivative financial instruments note 21 270 1,130 1,782<br />
530,607 555,209 581,417<br />
Non-current Assets<br />
Property, plant and equipment note 11 299,118 287,697 284,291<br />
Intangible assets note 12 86,362 91,353 62,784<br />
Investment in associate note 14 30,095 31,995 24<br />
Derivative financial instruments note 21 – – 39<br />
Deferred income taxes note 29 30,058 33,555 41,415<br />
Other assets note 15 26,691 9,923 9,608<br />
Goodwill note 16 220,334 215,204 214,449<br />
692,658 669,727 612,610<br />
$ 1,223,265 $ 1,224,936 $ 1,194,027<br />
Liabilities<br />
Current Liabilities<br />
Bank indebtedness note 19 $ 12,281 $ – $ –<br />
Loan payable note 27 5,001 5,126 –<br />
Accounts payable and accrued liabilities note 17 155,796 132,743 119,813<br />
Provisions notes 18 and 20 12,317 7,892 9,845<br />
Income taxes payable note 21 35,334 44,968 42,971<br />
Derivative financial instruments note 21 419 527 510<br />
Deferred revenue 27,446 54,751 75,100<br />
Current portion of long-term debt note 19 – 25,005 26,235<br />
Obligations under finance lease note 22 165 345 371<br />
248,759 271,357 274,845<br />
Non-current Liabilities<br />
Long-term debt note 19 – – 26,052<br />
Obligations under finance lease note 22 103 339 492<br />
Provisions notes 18 and 20 50,859 45,024 26,047<br />
Derivative financial instruments note 21 2,499 807 –<br />
Deferred income taxes note 29 56,984 75,166 75,576<br />
110,445 121,336 128,167<br />
359,204 392,693 403,012<br />
Equity<br />
Share capital note 24 218,381 206,775 204,151<br />
Contributed surplus 16,391 18,144 17,277<br />
Retained earnings 654,062 644,191 569,587<br />
Non-controlling interest 7,473 – –<br />
Accumulated other comprehensive loss (32,246) (36,867) –<br />
864,061 832,243 791,015<br />
$ 1,223,265 $ 1,224,936 $ 1,194,027<br />
<strong>The</strong> accompanying notes are an integral part of these consolidated financial statements.<br />
Paul G. Robinson, Director<br />
Virginia L. Shaw, Director
60 <strong>ShawCor</strong> Ltd. consolidated financial statements<br />
Consolidated Statements of Income<br />
For the year ended December 31: (in thousands of Canadian dollars, except per share amounts) 2011 2010<br />
Sale of products $ 332,242 $ 317,443<br />
Rendering of services 825,023 716,720<br />
Revenue 1,157,265 1,034,163<br />
Cost of Goods Sold 734,730 623,641<br />
Gross Profit 422,535 410,522<br />
Selling, general and administrative expenses 269,241 219,084<br />
Research and development expenses 13,119 11,050<br />
Foreign exchange losses (gains) 1,338 (5,647)<br />
Amortization of property, plant and equipment note 11 41,906 45,077<br />
Amortization of intangible assets note 12 7,244 5,038<br />
Impairment of property, plant & equipment note 13 5,244 14,923<br />
Impairment of intangible assets – 958<br />
Impairment of goodwill note 16 – 208<br />
Income from Operations 84,443 119,831<br />
Accounting gain on acquisition – (13,181)<br />
Loss on investment in associate note 14 10,133 1,939<br />
Finance costs, net 4,507 2,805<br />
Income Before Income Taxes 69,803 128,268<br />
Income taxes note 29 13,120 33,196<br />
Net Income 56,683 95,072<br />
Net Income Attributable to:<br />
Shareholders of the Company 56,086 95,072<br />
Non-controlling interests 597 –<br />
Net Income $ 56,683 $ 95,072<br />
Earnings per Share<br />
Basic note 28 $ 0.79 $ 1.35<br />
Diluted note 28 $ 0.78 $ 1.33<br />
Weighted Average Number of Shares Outstanding (000s)<br />
Basic note 28 70,725 70,566<br />
Diluted note 28 71,536 71,444<br />
<strong>The</strong> accompanying notes are an integral part of these consolidated financial statements.
ANNUAL REPORT 2011 <strong>ShawCor</strong> Ltd.<br />
61<br />
Consolidated Statements of Comprehensive Income<br />
For the year ended December 31: (in thousands of Canadian dollars) 2011 2010<br />
Net Income for the Year $ 56,683 $ 95,072<br />
Other Comprehensive Income (Loss)<br />
Unrealized gain (loss) on translation of foreign operations 8,724 (38,072)<br />
Gain on hedges of unrealized foreign currency translation 603 1,423<br />
Gain on hedges of unrealized foreign currency translation transferred to net income during the period (1,833) (218)<br />
Share of other comprehensive loss attributable to investment in associate (3,081) –<br />
Income tax on other comprehensive income (loss)<br />
Gain on hedges of unrealized foreign currency translation (103) –<br />
Gain on hedges of unrealized foreign currency translation transferred to net income during the period 311 –<br />
Other Comprehensive Income (Loss) for the Year, Net of Income Tax 4,621 (36,867)<br />
Comprehensive Income for the Year $ 61,304 $ 58,205<br />
Attributable to:<br />
Shareholders of the Company 60,707 58,205<br />
Non-controlling interests 597 –<br />
<strong>The</strong> accompanying notes are an integral part of these consolidated financial statements.<br />
Consolidated Statement of Changes in Shareholders’ Equity<br />
Accumulated<br />
Other<br />
Total<br />
For the year ended December 31, 2011 Contributed Retained Non-Controlling Comprehensive Shareholders’<br />
(in thousands of Canadian dollars) Capital Stock Surplus Earnings Interest Loss equity<br />
Balance – January 1, 2010 $ 204,151 $ 17,277 $ 569,587 $ – $ – $ 791,015<br />
Net income for the year – – 95,072 – – 95,072<br />
Issued on exercise of stock options 2,013 – – – – 2,013<br />
Compensation cost on exercised options 611 (611) – – – –<br />
Stock-based compensation expense – 1,478 – – – 1,478<br />
Other comprehensive loss – – – – (36,867) (36,867)<br />
Dividends paid – – (20,468) – – (20,468)<br />
Balance – December 31, 2010 $ 206,775 $ 18,144 $ 644,191 $ – $ (36,867) $ 832,243<br />
Net income for the year – – 56,086 597 – 56,683<br />
Issued on exercise of stock options 9,878 – – – – 9,878<br />
Compensation cost on exercised options 4,122 (4,122) – – – –<br />
Compensation cost on exercised RSUs 7 (7) – – – –<br />
Stock-based compensation expense – 2,376 – – – 2,376<br />
Purchase – Normal Course Issuer Bid (2,401) – – – – (2,401)<br />
Excess of purchase price over<br />
stated value of shares – – (14,068) – – (14,068)<br />
Other comprehensive income – – – – 4,621 4,621<br />
Adjustment for non-controlling interest – – (10,217) 10,217 – –<br />
Non-cash dividends paid<br />
to non-controlling interest – – – (3,341) – (3,341)<br />
Dividends paid note 24 – – (21,930) – – (21,930)<br />
Balance – December 31, 2011 $ 218,381 $ 16,391 $ 654,062 $ 7,473 $ (32,246) $ 864,061<br />
<strong>The</strong> accompanying notes are an integral part of these consolidated financial statements.
62 <strong>ShawCor</strong> Ltd. consolidated financial statements<br />
Consolidated Statements of Cash Flow<br />
For the year ended December 31 (in thousands of Canadian dollars) 2011 2010<br />
Operating activities<br />
Net income for the year $ 56,683 $ 95,072<br />
Add (deduct) items not affecting cash<br />
Amortization of property, plant and equipment note 11 41,906 45,077<br />
Amortization of intangible assets note 12 7,244 5,038<br />
Amortization of long-term prepaid expenses 754 4<br />
Decommissioning obligations expense note 18 425 1,096<br />
Stock based and incentive based compensation note 25 4,501 4,487<br />
Other provisions expense note 18 4,362 1,890<br />
Deferred income taxes note 29 (14,686) (7,472)<br />
Loss (gain) on disposal of property, plant and equipment 180 (1,100)<br />
Loss on derivative financial instruments 2,444 708<br />
Accretion expense on deferred purchase consideration note 18 1,053 189<br />
Accounting gain on acquisition – (13,181)<br />
Loss on investment in associate note 14 10,133 1,939<br />
Impairment of property, plant and equipment note 13 5,244 14,923<br />
Impairment of intangible assets note 12 – 958<br />
Impairment of goodwill note 16 – 208<br />
Other 294 –<br />
Settlement of decommissioning liability obligations note 18 (1,074) (3,218)<br />
Settlement of other provisions note 18 (2,240) (2,027)<br />
Net change in employee future benefits notes 18 and 20 636 (3,637)<br />
Net change in non-cash working capital and foreign exchange (72,532) (87,710)<br />
Cash Provided by Operating Activities 45,327 53,244<br />
Investing activities<br />
Purchases of property, plant and equipment note 11 (55,982) (48,723)<br />
Proceeds on disposal of property, plant and equipment 745 3,420<br />
Purchase of intangible assets note 12 (392) (302)<br />
Acquisition of subsidiaries – net of cash acquired note 6 (12,839) (19,728)<br />
Loan provided to associate notes 14 and 15 (10,347) –<br />
(Increase) decrease in other assets (6,096) –<br />
Investment in associate note 14 (10,517) (34,917)<br />
Cash Used in Investing Activities (95,428) (100,250)<br />
Financing activities<br />
Increase in bank indebtedness note 19 12,281 –<br />
Proceeds from loan note 27 – 5,126<br />
Repayments of obligations under finance lease (416) (179)<br />
Repayment of long-term debt note 19 (24,402) (26,043)<br />
Issuance of shares note 24 9,878 2,013<br />
Repurchase of treasury shares note 24 (16,469) –<br />
Dividends paid to shareholders note 24 (21,930) (20,468)<br />
Cash Used in Financing Activities (41,058) (39,551)<br />
Effect of Foreign Exchange on Cash and Cash Equivalents 2,437 (7,433)<br />
Net Decrease in Cash and Cash Equivalents for the Year (88,722) (93,990)<br />
Cash and Cash Equivalents – Beginning of Year 155,998 249,988<br />
Cash and Cash Equivalents – End of Year $ 67,276 $ 155,998<br />
Supplemental Information<br />
Cash interest paid $ 5,531 $ 5,022<br />
Cash interest received 1,024 1,455<br />
Cash income taxes paid $ 35,379 $ 38,892<br />
<strong>The</strong> accompanying notes are an integral part of these consolidated financial statements.
ANNUAL REPORT 2011 <strong>ShawCor</strong> Ltd.<br />
63<br />
Notes to the Consolidated <strong>Financial</strong> Statements<br />
note 1<br />
Corporate information<br />
<strong>ShawCor</strong> Ltd. is a publicly listed company incorporated in<br />
Canada with its shares listed on the Toronto Stock Exchange.<br />
<strong>ShawCor</strong> Ltd., together with its wholly owned subsidiaries<br />
(collectively referred to as the “Company” or “<strong>ShawCor</strong>”), is<br />
a growth oriented, global energy services company serving the<br />
Pipeline and Pipe Services and the Petrochemical and Industrial<br />
segments of the energy industry. <strong>The</strong> Company operates<br />
seven divisions with over 70 manufacturing and service facilities<br />
located around the world. Further information as it pertains to<br />
the nature of operations is set out in note 5.<br />
<strong>The</strong> head office, principal address and registered office<br />
of the Company is 25 Bethridge Road, Toronto, Ontario,<br />
M9W 1M7, Canada.<br />
Note 2<br />
Basis of preparation and adoption of<br />
International <strong>Financial</strong> Reporting Standards<br />
<strong>The</strong> Company prepares its consolidated financial statements<br />
in accordance with Canadian generally accepted accounting<br />
principles as set out in the Handbook of <strong>The</strong> Canadian Institute<br />
of Chartered Accountants (“CICA Handbook”). In 2010, the<br />
CICA Handbook was revised to incorporate International<br />
<strong>Financial</strong> Reporting Standards (“IFRS”) and require publicly<br />
accountable enterprises to apply such standards effective<br />
for years beginning on or after January 1, 2011. Accordingly,<br />
the Company has commenced reporting on this basis in these<br />
consolidated financial statements. In these consolidated<br />
financial statements, the term “CGAAP” refers to Canadian<br />
Generally Accepted Accounting Principles before the adoption<br />
of IFRS.<br />
<strong>The</strong>se consolidated financial statements have been prepared in<br />
accordance with IFRS, as issued by the International Accounting<br />
Standards Board, applicable to the preparation of financial<br />
statements, including International Accounting Standard<br />
(“IAS”) 1, Presentation of <strong>Financial</strong> Statements, and IFRS 1,<br />
First-time Adoption of International <strong>Financial</strong> Reporting Standards.<br />
Subject to certain transition elections disclosed in note 4, the<br />
Company has consistently applied the same accounting policies<br />
in its opening IFRS consolidated balance sheet at January 1, 2010<br />
and throughout all periods presented, as if these policies had<br />
always been in effect. Note 4 discloses the impact of the<br />
transition to IFRS on the Company’s reported financial position,<br />
financial performance and cash flows, including the nature and<br />
effect of significant changes in accounting policies from those<br />
used in the Company’s audited annual consolidated financial<br />
statements for the year ended December 31, 2010.<br />
<strong>The</strong> policies applied in these consolidated financial<br />
statements are based on IFRS issued and outstanding<br />
as of December 31, 2011.<br />
Basis of Presentation and Consolidation<br />
<strong>The</strong> consolidated financial statements have been prepared<br />
on the historical cost basis, except for certain non‐current assets<br />
and financial instruments, which are measured at fair value,<br />
as explained in the accounting policies set out in note 3.<br />
<strong>The</strong> consolidated financial statements are presented in Canadian<br />
dollars and all values are rounded to the nearest thousand,<br />
except when otherwise stated.<br />
<strong>The</strong> consolidated financial statements comprise the financial<br />
statements of the Company and the entities under its control<br />
and the Company’s proportionate share in joint ventures.
64 <strong>ShawCor</strong> Ltd. notes to the consolidated financial statements<br />
<strong>The</strong> preparation of consolidated financial statements<br />
in conformity with IFRS requires the use of certain critical<br />
accounting estimates. It also requires management to exercise<br />
its judgment in the process of applying the Company’s<br />
accounting policies. <strong>The</strong> areas involving a higher degree<br />
of judgment or complexity, or areas where assumptions<br />
and estimates are significant to the consolidated financial<br />
statements, are disclosed in note 3.<br />
<strong>The</strong> results of the subsidiaries acquired during the period are<br />
included in the consolidated financial statements from the date<br />
of the acquisition. Adjustments are made, where necessary, to<br />
the financial statements of the subsidiaries and joint ventures to<br />
ensure consistency with those policies adopted by the Company.<br />
All intercompany transactions, balances, income and expenses<br />
are eliminated upon consolidation.<br />
<strong>The</strong> audited consolidated financial statements and<br />
accompanying notes for the year ended December 31, 2011<br />
were authorized for issue by the company’s Board of Directors<br />
on March 1, 2012.<br />
note 3<br />
Summary of significant accounting policies<br />
<strong>The</strong> consolidated financial statements have been prepared by<br />
management in accordance with IFRS. <strong>The</strong> more significant<br />
accounting policies are as follows:<br />
a) Business Combinations<br />
Business combinations are accounted for using the acquisition<br />
accounting method. Identifiable assets, liabilities and contingent<br />
liabilities acquired are measured at fair value at the acquisition<br />
date. <strong>The</strong> consideration transferred is measured at fair value and<br />
includes the fair value of any contingent consideration. <strong>The</strong> costs<br />
of the acquisition transaction costs and any restructuring costs<br />
are charged to the consolidated statement of income in the<br />
period in which they are incurred.<br />
For an acquisition achieved in stages, the acquisition date fair<br />
value of the acquirer’s previously held equity interest in the<br />
acquiree is remeasured to fair value at the acquisition date<br />
through profit or loss.<br />
<strong>The</strong> excess of the aggregate consideration transferred over the<br />
fair value of the Company’s share of the identifiable net assets<br />
acquired is recorded as goodwill.<br />
b) Interest in Joint Ventures<br />
<strong>The</strong> Company has interests in several jointly controlled entities<br />
(“joint ventures”), whereby joint control has been established<br />
by contractual agreements that establish joint control over<br />
the economic activities of the entity. <strong>The</strong> Company accounts<br />
for joint ventures using proportionate consolidation. As a result,<br />
the consolidated financial statements include the Company’s<br />
proportionate share of the joint venture’s assets and liabilities,<br />
income and expenses, and cash flows with items of a similar<br />
nature on a line by line basis, from the effective date that the<br />
joint control commenced, up to the date that joint control<br />
ceased. Adjustments are made where necessary to bring the<br />
accounting policies in line with those of the Company.<br />
<strong>The</strong> Company recognizes the portion of gains or losses<br />
on the sale of assets by the Company to the joint venture that<br />
is attributable to the other venturers. <strong>The</strong> Company does not<br />
recognize its share of gains or losses from the joint venture that<br />
result from the Company’s purchase of assets from the joint<br />
venture until it resells the assets to an independent party.<br />
However, a loss on the transaction is recognized immediately<br />
if the loss provides evidence of a reduction in the net realizable<br />
value of current assets, or an impairment loss.<br />
A listing of all jointly controlled entities is presented in note 27.<br />
c) Foreign Currency Translation<br />
Functional and Presentation Currency<br />
Items included in the financial statements of each of the<br />
Company’s entities are measured using the currency of the<br />
primary economic environment in which the entity operates (the<br />
“functional currency”). <strong>The</strong> consolidated financial statements of<br />
the company are presented in Canadian dollars, which is the<br />
parent company’s presentation and functional currency.<br />
Transactions<br />
Foreign currency transactions are translated into the functional<br />
currency using the exchange rates prevailing at the dates of the<br />
transactions. Foreign exchange gains and losses resulting from<br />
the settlement of such transactions and from the translation<br />
at period-end exchange rates of monetary assets and liabilities<br />
denominated in foreign functional currencies are recognized<br />
in the consolidated statement of income, except when deferred<br />
in other comprehensive income (loss) as qualifying net<br />
investment hedges.<br />
Translation of Foreign Operations<br />
<strong>The</strong> results and financial position of all the group entities that<br />
have a functional currency different from the presentation<br />
currency are translated into the presentation currency<br />
as follows:<br />
• assets and liabilities for each balance sheet presented<br />
are translated at the closing rate at the date of that balance<br />
sheet; and<br />
• income and expenses for each income statement<br />
are translated at the average exchange rates prevailing<br />
at the dates of the transactions.<br />
On consolidation, exchange differences arising from the<br />
translation of the net investment in foreign operations, and
ANNUAL REPORT 2011 <strong>ShawCor</strong> Ltd.<br />
65<br />
of borrowings and other currency instruments designated as<br />
hedges of such investments, are taken to other comprehensive<br />
income (loss).<br />
When a foreign operation is partially disposed of or sold,<br />
exchange differences that were recorded in accumulated other<br />
comprehensive income (loss) are recognized in the consolidated<br />
statement of income as part of the gain or loss on sale.<br />
Goodwill and fair value adjustments arising on the acquisition of<br />
a foreign entity are treated as assets and liabilities of the foreign<br />
entity and translated at the closing rate.<br />
d) Revenue Recognition<br />
Revenue is recognized to the extent that it is probable that the<br />
economic benefits will flow to the Company and the revenue can<br />
be reliably measured, regardless of when the payment is being<br />
made. Revenue is measured at the fair value of the consideration<br />
received or receivable, taking into account contractually defined<br />
terms of payment and excluding taxes or duty.<br />
Sale of Goods<br />
Revenue from the sale of goods is recognized when the<br />
significant risks and rewards of ownership of the goods<br />
have passed to the buyer, usually on delivery of the goods.<br />
Rendering of Services<br />
Revenue from pipe coating, inspection, repair and other services<br />
provided in respect of customer-owned property is recognized<br />
as services and are performed under specific contracts. Revenue<br />
on these contracts is recognized using the percentage of<br />
completion method based on a proportional performance basis<br />
using output as a measure of performance. Losses, if any, on<br />
these contracts are provided for in full at the time such losses<br />
are identified.<br />
Services performed in advance of billings are recorded as<br />
unbilled revenue pursuant to the contractual terms. In general,<br />
amounts become billable upon the achievement of certain<br />
milestones or in accordance with predetermined payment<br />
schedules. Changes in the scope of work are not included<br />
in net revenues until earned and realization is assured.<br />
e) Cash and Cash Equivalents<br />
Cash and cash equivalents consist of balances with banks and<br />
other short-term highly liquid investments with original maturity<br />
dates on acquisition of 90 days or less. <strong>The</strong> amounts presented<br />
in the consolidated financial statements approximate the fair<br />
value of cash and cash equivalents.<br />
f) Inventories<br />
Inventories are measured at the lower of cost or net realizable<br />
value. Cost is determined on a first-in, first-out (“FIFO”)<br />
basis, except in certain project based pipe coating businesses<br />
where the average cost basis is employed, and includes direct<br />
materials, direct labour and variable and fixed manufacturing<br />
overheads. Net realizable value for finished goods, work-inprocess<br />
and raw materials inventories required for production<br />
is the estimated amount that would be realized on eventual sale<br />
of completed products, less the estimated costs necessary to<br />
complete the sale, while for excess raw materials it is the current<br />
market price. Ownership of inbound inventories is recognized<br />
at the time title passes to the Company.<br />
g) Property, Plant and Equipment<br />
Property, plant and equipment are recorded at historical cost<br />
less accumulated amortization and accumulated impairment.<br />
Direct costs are included in the asset’s carrying amount or<br />
recognized as a separate asset, such as borrowing costs for<br />
long-term construction projects and major inspections, as<br />
appropriate, only when it is probable that future economic<br />
benefits associated with the item will flow to the Company<br />
and the cost of the item can be measured reliably. <strong>The</strong> carrying<br />
amount of the replaced part is derecognized.<br />
All other repair and maintenance costs are recognized<br />
in the consolidated statement of income during the financial<br />
period in which they are incurred. <strong>The</strong> expected cost for the<br />
decommissioning and remediation of an asset is included in the<br />
cost of the respective asset if the recognition criteria are met.<br />
Property, plant and equipment, other than land and projectrelated<br />
facilities and equipment, are amortized over their useful<br />
lives commencing when the asset is available for use on<br />
a straight-line basis at the following annual rates:<br />
• 100% for land improvements;<br />
• 4% to 10% on buildings;<br />
• 5% to 50% on machinery and equipment; and<br />
• Project-related facilities are amortized over the estimated<br />
project life.<br />
An item of property, plant and equipment is derecognized<br />
when no further economic benefits are expected from its use<br />
or disposal. Any gains or losses arising on derecognition of the<br />
asset (calculated as the difference between the net disposal<br />
proceeds or the net recoverable amount, and the carrying value<br />
of the asset) is included in the consolidated statement of income<br />
in the year the asset is derecognized.<br />
<strong>The</strong> assets’ residual values, useful lives and methods of<br />
amortization are reviewed at the end of each reporting period<br />
and adjusted prospectively, if appropriate.<br />
h) Borrowing Costs<br />
Borrowing costs directly attributable to the acquisition,<br />
construction or production of a qualifying asset are capitalized<br />
as part of the cost of the asset. All other borrowing costs are<br />
expensed in the period in which they occur. Borrowing costs<br />
consist of interest and other costs that an entity incurs in<br />
connection with the borrowing of funds.
66 <strong>ShawCor</strong> Ltd. notes to the consolidated financial statements<br />
i) Deferred Costs<br />
Costs related to the mobilization of project-specific plants for<br />
fixed term projects are included in work-in-process inventories<br />
and are charged to costs of goods sold on a percentage of<br />
completion basis. Such costs are to be included in inventories<br />
only if incurred after the Company is awarded the project and<br />
if directly related to the performance of the contract.<br />
j) Intangible Assets<br />
Intangible assets acquired separately are measured at cost.<br />
<strong>The</strong> cost of intangible assets acquired in a business combination<br />
is the fair value as at the date of acquisition. Following initial<br />
recognition, intangible assets are carried at cost less any<br />
accumulated amortization and any accumulated impairment<br />
losses. Internally generated intangible assets, excluding<br />
capitalized development costs, are not capitalized and<br />
the expenditure is reflected in the consolidated statement<br />
of income during the period in which they are incurred.<br />
Intellectual Property and Intangible Assets with Limited Lives<br />
Intellectual property and intangible assets with limited lives<br />
are amortized over the useful economic life and assessed for<br />
impairment whenever there is an indication that the intangible<br />
asset may be impaired. Amortization is recorded on a straightline<br />
basis over their estimated useful lives of up to 15 years. <strong>The</strong><br />
amortization period and the amortization method is reviewed at<br />
least at each year-end and adjusted prospectively if appropriate.<br />
Intangible Assets with Indefinite Lives<br />
Intangible assets with indefinite useful lives are not amortized<br />
but are tested for impairment annually, or when there is an<br />
indication that the asset may be impaired either individually<br />
or at the Cash Generating Unit (“CGU”) level. <strong>The</strong> assessment<br />
of indefinite life is reviewed annually to determine whether the<br />
indefinite life continues to be supportable; if not, the change in<br />
useful life from indefinite to finite is made on a prospective basis.<br />
Gains or losses arising from the derecognition of an intangible<br />
asset are measured as the difference between the net disposal<br />
proceeds and the carrying amount of the assets and are<br />
recognized in the consolidated statement of income when<br />
the asset is derecognized.<br />
k) Impairment of Non-financial Assets<br />
Assets that have indefinite useful lives are not subject to<br />
amortization and are tested annually for impairment or when<br />
there is an indication that the asset may be impaired.<br />
Assets that are subject to amortization are reviewed for<br />
impairment whenever events or changes in circumstances<br />
indicate that the carrying amount may not be recoverable.<br />
An impairment loss is recognized for the amount by which the<br />
asset’s carrying amount exceeds its recoverable amount. <strong>The</strong><br />
recoverable amount is the higher of an asset’s fair value less<br />
costs to sell and its value in use. For the purposes of assessing<br />
impairment, assets are grouped at the lowest levels for which<br />
there are separately identifiable Cash Generating Units (“CGU”).<br />
Non-financial assets, other than goodwill, that suffered an<br />
impairment are reviewed for possible reversal of the impairment<br />
whenever indicators exist.<br />
l) Goodwill<br />
Goodwill represents the excess of the purchase price of the<br />
Company’s interest in subsidiary entities over the fair value<br />
of the underlying net identifiable tangible and intangible assets<br />
arising at the date of acquisition.<br />
Goodwill is deemed to have an indefinite life and is tested annually<br />
for impairment and carried at cost less accumulated impairment<br />
losses. Impairment losses on goodwill are not reversed.<br />
Goodwill is allocated to CGUs for the purpose of impairment<br />
testing. <strong>The</strong> allocation is made to those CGUs or groups of<br />
CGUs that are expected to benefit from the business<br />
combination in which the goodwill arose, identified according<br />
to operating segment.<br />
Gains and losses on the disposal of an entity include the carrying<br />
amount of goodwill relating to the entity sold.<br />
m) Investments in Associates<br />
<strong>The</strong> Company accounts for investments in which it has significant<br />
influence using the equity method and these investments are<br />
initially recognized at cost, and the carrying amount is increased<br />
or decreased to recognize the investor’s share of the profit or<br />
loss of the investee, after the date of acquisition.<br />
n) Employee Future Benefits<br />
<strong>The</strong> Company provides future benefits to its employees<br />
under a number of defined benefit and defined contribution<br />
arrangements. <strong>The</strong> liability recognized in the consolidated<br />
balance sheet in respect of defined benefit pension plans is the<br />
present value of the defined benefit obligation at the end of the<br />
reporting period. <strong>The</strong> fair value of plan assets is recorded and<br />
included in “other assets” on the consolidated balance sheet.<br />
<strong>The</strong> defined benefit obligation is determined by independent<br />
actuaries using the projected benefit method pro-rated on<br />
service. <strong>The</strong> present value of the defined benefit obligation is<br />
determined by discounting the estimated future cash outflows<br />
using interest rates of high-quality corporate bonds that have<br />
terms to maturity matching the terms of the related pension<br />
obligation. Plan assets are valued at quoted market prices at the<br />
consolidated balance sheet date.<br />
Past service costs arising from plan amendments are amortized<br />
on a straight-line basis over the average period until the benefits<br />
become vested. If the benefits have already vested, past service<br />
costs are recognized immediately in the consolidated statement<br />
of income following the introduction of, or changes to,<br />
a pension plan.
ANNUAL REPORT 2011 <strong>ShawCor</strong> Ltd.<br />
67<br />
Net actuarial gains and losses that exceed 10% of the greater<br />
of the benefit obligation and the fair value of plan assets are<br />
amortized over the average remaining service lives of the<br />
employees who are members of the plan. <strong>The</strong>se actuarial gains<br />
and losses arising from experience adjustments and changes in<br />
actuarial assumptions are charged or credited to equity in other<br />
comprehensive income in the period in which they arise. For the<br />
Company’s principal plans, these periods range from 5 years<br />
to 22 years.<br />
For the Company’s defined contribution plans, costs are<br />
determined based on the services provided by the Company’s<br />
employees and are recognized in the consolidated statement<br />
of income as those services are provided.<br />
o) Leases<br />
Finance leases, which transfer to the Company substantially<br />
all the risks and benefits incidental to ownership of the leased<br />
item, are capitalised at the commencement of the lease at<br />
the fair value of the leased property or, if lower, at the present<br />
value of the minimum lease payments. Lease payments are<br />
apportioned between finance charges and reduction of the<br />
lease liability so as to achieve a constant rate of interest<br />
on the remaining balance of the liability.<br />
Leases in which substantially all of the benefits and risks of<br />
ownership are retained by the lessor are classified as operating<br />
leases. Payments made under operating leases are charged to<br />
the consolidated statement of income on a straight-line basis<br />
over the period of the lease.<br />
p) Trade and Other Receivables<br />
Impairment of trade and other receivables is constantly<br />
monitored. Impairments are based on observed customer<br />
solvency, the aging of trade and other receivables, historical<br />
values and customer specific and industry risks. External<br />
credit ratings as well as bank and trade references are reviewed<br />
when available.<br />
q) Provisions<br />
A provision is an accrued liability, legal or constructive, resulting<br />
from a past event with a high degree of uncertainty with respect<br />
to either the timing or amount. Provisions must be probable and<br />
should be measurable to be recognized, and are determined by<br />
discounting the expected future cash flows at a pre-tax rate that<br />
reflects current market assessments of the time value of money<br />
and the risks specific to the liability. <strong>The</strong> increase in the provision<br />
due to the passage of time is recognized as finance costs in the<br />
consolidated statement of income.<br />
r) <strong>Financial</strong> Instruments<br />
<strong>Financial</strong> assets include financial assets held for trading and<br />
financial assets designated upon initial recognition at fair value<br />
through profit or loss. <strong>Financial</strong> assets are classified as held for<br />
trading if they are acquired for the purpose of selling or<br />
repurchasing in the near term. <strong>Financial</strong> assets at fair value<br />
through profit or loss are carried in the statement of financial<br />
position at fair value with changes in fair value recognized<br />
in the consolidated statement of income. Interest income from<br />
financial assets at fair value through profit or loss is recognized<br />
in the consolidated statement of income as part of other income<br />
when the Company’s right to receive payments is established.<br />
Held-to-maturity financial assets, loans and receivables<br />
and other liabilities not held for trading are accounted for at<br />
amortized cost with related expenses charged to selling, general<br />
and administrative expenses in the consolidated statement<br />
of income.<br />
Available-for-sale financial assets are those non-derivative<br />
financial assets that are so designated by the Company or do not<br />
fall into another category. Available-for-sale financial assets are<br />
carried on the consolidated balance sheet at fair value with gains<br />
or losses from changes in fair value in a period included in other<br />
comprehensive income (loss).<br />
All financial liabilities are initially recorded at fair value and<br />
designated upon inception as fair value through profit or loss,<br />
or other liabilities. <strong>Financial</strong> liabilities classified as fair value<br />
through profit or loss include derivative financial instruments.<br />
Any changes in fair value are recognized through the consolidated<br />
statement of income.<br />
Loans and borrowings are initially recorded at fair value less any<br />
directly attributable transaction costs. After initial recognition,<br />
other liabilities are subsequently measured at amortized cost<br />
using the effective interest rate method.<br />
<strong>The</strong> following is a summary of the classes of financial<br />
instruments included in the Company’s consolidated balance<br />
sheet as well as their designation by the Company under the<br />
new accounting standards:<br />
Balance sheet item<br />
Designation<br />
Cash and cash equivalents<br />
Loans and receivables<br />
Accounts receivable<br />
Loans and receivables<br />
Income taxes receivable<br />
Loans and receivables<br />
Long-term notes receivable<br />
Loans and receivables<br />
Long-term loan to associate<br />
Loans and receivables<br />
Derivative financial instruments Fair value through profit or loss<br />
Bank indebtedness<br />
Loans and borrowings<br />
Loan payable<br />
Loans and borrowings<br />
Accounts payable and accrued liabilities Loans and borrowings<br />
Income taxes payable<br />
Loans and borrowings<br />
Deferred purchase consideration<br />
Loans and borrowings<br />
Other provisions<br />
Loans and borrowings<br />
Long-term debt<br />
Loans and borrowings
68 <strong>ShawCor</strong> Ltd. notes to the consolidated financial statements<br />
Derivative <strong>Financial</strong> Instruments<br />
<strong>The</strong> Company’s policy is to document its risk management<br />
objectives and strategy for undertaking various derivative<br />
financial instrument transactions. Derivative financial<br />
instruments designated as effective net investment hedges<br />
are reflected in the consolidated balance sheet at fair value, with<br />
any gains or losses resulting from fair value changes included<br />
in other comprehensive income (loss) to the extent of hedge<br />
effectiveness. Derivative financial instruments not designated<br />
as part of a formal hedging relationship are carried at fair value<br />
in the consolidated balance sheet, with gains or losses resulting<br />
from changes in fair value in a period charged or credited<br />
to foreign exchange gains and losses on the consolidated<br />
statement of income.<br />
<strong>Financial</strong> instruments measured at fair value are categorized<br />
into one of the following three hierarchy levels for<br />
disclosure purposes:<br />
• Level 1 – Quoted prices in active markets for identical<br />
instruments that are observable<br />
• Level 2 – Quoted prices in active markets for similar<br />
instruments; inputs other than quoted prices that are<br />
observable and derived from or corroborated by observable<br />
market data<br />
• Level 3 – Valuations derived from valuation techniques in<br />
which one or more significant inputs are unobservable.<br />
<strong>The</strong> hierarchy requires the use of observable market data<br />
when available.<br />
Derecognition<br />
<strong>Financial</strong> assets are derecognized where the contractual rights<br />
to the receipt of cash flows expire or the asset is transferred to<br />
another party whereby the entity no longer has any significant<br />
continuing involvement in the risks and rewards associated with<br />
the asset. <strong>Financial</strong> liabilities are derecognized where the related<br />
obligations are either discharged, cancelled or expire. <strong>The</strong><br />
difference between the carrying value of the financial liability<br />
extinguished or transferred to another party and the fair value<br />
of the consideration paid, including the transfer of non-cash<br />
assets or liabilities assumed, is recognized in the consolidated<br />
statement of income in the period in which it is incurred.<br />
Impairment<br />
<strong>Financial</strong> assets carried at amortized cost are assessed at each<br />
reporting date for any potential impairment. If there is objective<br />
evidence that an impairment loss has been incurred, the amount<br />
of the loss is measured as the difference between the carrying<br />
amount and the present value of estimated future cash flows<br />
discounted using the original effective interest rate. <strong>The</strong> carrying<br />
amount of the asset is then reduced by the amount of the<br />
impairment and is recognized in the consolidated statement<br />
of income.<br />
If, in a subsequent period, the amount of the impairment<br />
loss decreases and the decrease can be related objectively<br />
to an event occurring after the impairment was recognized,<br />
the reversal of the previously recognized impairment loss<br />
is recognized in the consolidated statement of income.<br />
Comprehensive Income<br />
<strong>The</strong> Company’s comprehensive income comprises net income<br />
and other comprehensive income (loss), which is made up<br />
of unrealized foreign currency gains or losses on the translation<br />
of the financial statements of foreign operations, unrealized<br />
gains or losses on available-for-sale financial assets, and<br />
changes in unrealized gains or losses on financial instruments<br />
designated as effective net investment hedges.<br />
Accumulated Other Comprehensive Loss<br />
Accumulated other comprehensive loss is included in the<br />
consolidated balance sheet as a separate component of<br />
shareholders’ equity, and includes other comprehensive income<br />
(loss) accumulated over the years.<br />
s) Share-based and Other Incentive-based Compensation<br />
<strong>The</strong> Company has various stock-based compensation plans.<br />
<strong>The</strong> Company recognizes compensation expense in respect<br />
of all of its stock-based compensation plans. <strong>The</strong> compensation<br />
expense is equal to the estimated fair value, based on an<br />
appropriate pricing model, of the incentive options, rights<br />
or units granted at the grant date, and is amortized over<br />
the vesting period of the incentive options, rights or units.<br />
In accordance with IFRS, for each award of stock-based<br />
compensation that vests in installments, the fair value is<br />
determined on each installment as a separate award. Nonmarket<br />
vesting conditions are included in assumptions about<br />
the number of options that are expected to vest. At the end<br />
of each reporting period, the Company revises its estimates<br />
of the number of options, rights or incentive units that are<br />
expected to vest based on the non-market vesting conditions.<br />
For options, units or rights that are settled with equity,<br />
an amount equal to compensation expense is initially credited<br />
to contributed surplus and transferred to share capital if and<br />
when the option, unit or right is exercised. Options, units<br />
or rights that are settled with cash are classified as liability<br />
instruments in accordance with IFRS, as their terms require<br />
that they be settled in cash. Until the date of settlement, the<br />
liability associated with cash-settled options, units or rights<br />
is remeasured at the fair value at each reporting period, with<br />
any changes in the fair value recognized in the consolidated<br />
statement of income. Consideration received on the exercise<br />
of a stock option, right or unit is credited to share capital, when<br />
additional equity instruments are issued.
ANNUAL REPORT 2011 <strong>ShawCor</strong> Ltd.<br />
69<br />
For cash-settled awards, the fair value is recalculated at each<br />
balance sheet date until the awards are settled based on the<br />
estimated number of awards that are expected to vest, adjusting<br />
for market and non-market based performance conditions.<br />
During the vesting period, a liability is recognized representing<br />
the portion of the vesting period that has expired at the balance<br />
sheet date multiplied by the fair value of the awards at that date.<br />
After vesting, the full fair value of the unsettled awards at each<br />
balance date is recognized as a liability. Movements in the<br />
liability are recognized in the consolidated statement of income.<br />
<strong>The</strong> fair value is recalculated using an option pricing model.<br />
Awards where the employee has the right to choose whether<br />
a share-based transaction is settled in cash or by issuing equity,<br />
is accounted for as a compound financial instrument. <strong>The</strong><br />
Company measures the fair value of the compound financial<br />
instrument as at the date of issue, taking into account the terms<br />
and conditions of the grant. Stock-based compensation awards<br />
that constitute compound financial instruments of the Company<br />
are classified as liability instruments on the consolidated<br />
balance sheet.<br />
t) Research and Development Costs<br />
In accordance with IAS 38, Intangible Assets, research and<br />
development expenditures are charged to the consolidated<br />
statement of income, except for development costs, which<br />
are capitalized as an intangible asset when the following criteria<br />
are met:<br />
• the project is clearly defined and the costs are separately<br />
identified and reliably measured;<br />
• the technical feasibility of the project is demonstrated;<br />
• the project will generate future economic benefit;<br />
• resources are available to complete the project; and<br />
• the project is intended to be completed.<br />
<strong>The</strong> intangible asset is carried at cost less any accumulated<br />
amortization and accumulated impairment losses. Amortization<br />
of the asset commences when development has been completed<br />
and the asset is available for use. It is amortized over the period<br />
of expected future benefit, generally between three to ten years.<br />
During the period of development, the asset is tested for<br />
impairment annually. All other development costs are charged<br />
to the consolidated statement of income.<br />
u) Income Taxes<br />
Income tax expense for the period comprises current and<br />
deferred taxes. Tax is recognized in the consolidated statement<br />
of income, except to the extent that it relates to items<br />
recognized in other comprehensive income (loss).<br />
<strong>The</strong> current income tax charge is calculated on the basis of the<br />
tax laws enacted or substantively enacted at the consolidated<br />
balance sheet date in the countries where the Company and its<br />
subsidiaries operate and generate taxable income.<br />
<strong>The</strong> Company accounts for income taxes using the liability<br />
method. Under this method, deferred income tax assets and<br />
liabilities are determined based on differences between the<br />
financial reporting and tax bases of assets and liabilities and are<br />
measured using the enacted or substantively enacted tax rates<br />
and laws that will be in effect when the differences are expected<br />
to reverse. Deferred tax liabilities are not recognized if they arise<br />
from the initial recognition of goodwill; deferred income tax is<br />
not accounted for if it arises from initial recognition of an asset<br />
or liability in a transaction other than a business combination<br />
that at the time of the transaction affects neither accounting<br />
nor taxable profit or loss.<br />
Deferred income tax assets are recognized only to the extent<br />
that it is probable that future taxable profit will be available<br />
against which the temporary differences can be utilized.<br />
Deferred income tax assets and liabilities are offset when there<br />
is a legally enforceable right to offset current tax assets against<br />
current tax liabilities and when the deferred income tax assets<br />
and liabilities relate to income taxes levied by the same taxation<br />
authority on either the same taxable entity or different taxable<br />
entities where there is an intention to settle the balances on<br />
a net basis.<br />
Investment tax credits relating to the acquisition of assets are<br />
accounted for using the cost reduction approach, reducing the<br />
cost of the asset acquired or amortized into income over the<br />
useful life of the asset.<br />
v) Transaction Costs<br />
Transaction costs associated with financial assets carried<br />
at fair value through profit or loss are expensed as incurred,<br />
while transaction costs associated with all other financial assets<br />
are included in the initial carrying amount of the asset.<br />
w) Earnings per Share (“EPS”)<br />
Basic EPS is calculated using the weighted average number<br />
of shares outstanding during the period.<br />
Diluted EPS is calculated using the treasury stock method<br />
for determining the dilutive effect of outstanding financial<br />
instruments issued under the Company’s various stock-based<br />
compensation plans. Under this method, the conversion of<br />
dilutive financial instruments and related issue of shares is<br />
assumed at the beginning of the period (or at the time of award,<br />
if later).<br />
<strong>The</strong> proceeds from the conversion or exercise of dilutive financial<br />
instruments plus future period compensation expenses are<br />
assumed to be used to purchase common shares at the average<br />
market price during the period, and the incremental number of<br />
shares (the difference between the number of shares assumed<br />
issued and assumed purchased) is included in the denominator<br />
of the diluted EPS computation.
70 <strong>ShawCor</strong> Ltd. notes to the consolidated financial statements<br />
x) Segment Reporting<br />
Operating segments are reported in a manner consistent with<br />
the internal reporting provided to the chief operating decisionmaker.<br />
<strong>The</strong> chief operating decision-maker, who is responsible<br />
for allocating resources and assessing the performance<br />
of the operating segments, has been identified as the Chief<br />
Executive Officer.<br />
y) Use of Estimates<br />
<strong>The</strong> preparation of consolidated financial statements in<br />
conformity with IFRS requires management to make estimates<br />
and assumptions that affect the amounts of assets and liabilities<br />
and disclosures of contingent liabilities at the date of the<br />
consolidated financial statements and the reported amounts<br />
of revenue and expenses during the reporting period. Actual<br />
results could differ from those estimates.<br />
Critical estimates used in preparing the consolidated financial<br />
statements include:<br />
Long-lived Assets and Goodwill<br />
<strong>The</strong> Company evaluates the carrying values of the CGUs’<br />
goodwill on an annual basis on October 31 of each year to<br />
determine whether or not impairment of these assets has<br />
occurred and whether writedowns of the value of these assets<br />
are required. Similarly, the Company evaluates the carrying<br />
values of CGUs for long-lived assets whenever circumstances<br />
arise that could indicate impairment or reversal of impairment,<br />
and at each reporting date. <strong>The</strong>se impairment tests include<br />
certain assumptions regarding discount rates and future cash<br />
flows generated by these assets in determining the value-in-use<br />
and fair value less costs to sell calculations. Actual results could<br />
differ from these assumptions.<br />
Future Benefit Obligations<br />
<strong>The</strong> Company provides future benefits to its employees under<br />
a number of defined benefit arrangements. <strong>The</strong> calculation<br />
of the accrued benefit obligations recognized in the consolidated<br />
financial statements includes a number of assumptions<br />
regarding discount rates, long-term rates of return on pension<br />
plan assets, rates of employee compensation increases, rates<br />
of inflation, and life expectancies. <strong>The</strong> outcome of any of these<br />
factors could differ from the estimates used in the calculations<br />
and have an impact on operating expenses, non-current assets<br />
and non-current liabilities.<br />
Provisions and Contingent Liabilities<br />
Provisions and liabilities for legal and other contingent matters<br />
are recognized in the period when it becomes probable that<br />
there will be a future outflow of economic benefits resulting<br />
from past operations or events and the amount of the cash<br />
outflow can be reliably measured. <strong>The</strong> timing of recognition<br />
and measurement of the provision requires the application<br />
of judgment to existing facts and circumstances, which can<br />
be subject to change. <strong>The</strong> carrying amounts of provisions<br />
and liabilities are reviewed regularly and adjusted to take<br />
account of changing facts and circumstances.<br />
<strong>The</strong> Company is required to determine whether a loss is<br />
probable based on judgment and interpretation of laws and<br />
regulations and whether the loss can be reliably measured.<br />
When a loss is determined it is charged to the consolidated<br />
statement of income. <strong>The</strong> Company must continually monitor<br />
known and potential contingent matters and make appropriate<br />
provisions by charges to income when warranted by<br />
circumstances.<br />
Decommissioning Liabilities<br />
Decommissioning liabilities include legal and constructive<br />
obligations related to owned and leased facilities. <strong>The</strong>se have<br />
been recorded in the consolidated financial statements based<br />
on estimated future amounts required to satisfy these<br />
obligations. <strong>The</strong> amount recognized is the present value<br />
of estimated future expenditures required to settle the obligation<br />
using a current pre-tax risk free rate. A corresponding asset<br />
equal to the present value of the initial estimated liability is<br />
capitalized as part of the cost of the related long-lived asset.<br />
Changes in the estimated liability resulting from revisions<br />
to estimated timing or future decommissioning cost estimates<br />
are recognized as a change in the decommissioning liability<br />
and the related long-lived asset. <strong>The</strong> amount capitalized in<br />
property, plant and equipment is depreciated on a straight line<br />
basis over the useful life of the related asset. Increases in the<br />
decommissioning liabilities resulting from the passage of time<br />
are recognized as a finance cost in the consolidated statement<br />
of income.<br />
Actual expenditures incurred are charged against the<br />
accumulated decommissioning liability.<br />
<strong>Financial</strong> Instruments<br />
<strong>The</strong> Company has determined the estimated fair values of its<br />
financial instruments not traded in an active market based on<br />
appropriate valuation methodologies; however, considerable<br />
judgment is required to develop these estimates, mainly based<br />
on market conditions existing at the end of each reporting<br />
period. Accordingly, these estimated fair values are not<br />
necessarily indicative of the amounts the Company could realize<br />
in a current market exchange. <strong>The</strong> estimated fair value amounts<br />
can be materially affected by the use of different assumptions<br />
or methodologies.<br />
Income Taxes<br />
<strong>The</strong> recording of income tax expense includes certain<br />
estimations related to the impact in the current year of future<br />
events. <strong>Difference</strong>s between the estimated and actual impact<br />
of these events could impact tax expense, current taxes payable<br />
or deferred taxes. In particular, earnings and losses in foreign<br />
jurisdictions may be taxed at rates different from those expected<br />
in Canada.
ANNUAL REPORT 2011 <strong>ShawCor</strong> Ltd.<br />
71<br />
z) Accounting Standards Issued But Not Yet Applied<br />
IFRS 9 <strong>Financial</strong> Instruments<br />
IFRS 9, <strong>Financial</strong> Instruments, was issued in November 2009 and<br />
addresses classification and measurement of financial assets<br />
and replaces the multiple category and measurement models in<br />
IAS 39, <strong>Financial</strong> Instruments – Recognition and Measurement, for<br />
debt instruments with a new mixed measurement model having<br />
only two categories: amortized cost and fair value through profit<br />
or loss. IFRS 9 also replaces the models for measuring equity<br />
instruments, and such instruments are either recognized at fair<br />
value through profit or loss or at fair value through other<br />
comprehensive income (loss).<br />
Requirements for financial liabilities were added in October 2010<br />
and they largely carried forward existing requirements in IAS 39,<br />
except that fair value changes due to credit risk for liabilities<br />
designated at fair value through profit or loss would generally be<br />
recorded in other comprehensive income (loss).<br />
IFRS 9 is required to be applied for accounting periods beginning<br />
on or after January 1, 2013, with earlier adoption permitted.<br />
<strong>The</strong> Company has not yet assessed the impact of the standard<br />
or determined whether it will adopt the standard early.<br />
IFRS 10 Consolidated <strong>Financial</strong> Statements<br />
For annual periods beginning on January 1, 2013, IFRS 10,<br />
Consolidated <strong>Financial</strong> Statements, will replace portions of IAS 27<br />
Consolidated and Separate <strong>Financial</strong> Statements and interpretation<br />
SIC-12 Consolidation – Special Purpose Entities. <strong>The</strong> new standard<br />
requires consolidated financial statements to include all<br />
controlled entities under a single control model. <strong>The</strong> Company<br />
will be considered to control an investee when it is exposed,<br />
or has rights to variable returns from its involvement with<br />
the investee, and has the current ability to affect those returns<br />
through its power over the investee. As required by this<br />
standard, control is reassessed as facts and circumstances<br />
change. All facts and circumstances must be considered<br />
to make a judgment about whether the Company controls<br />
another entity. Additional guidance is given on how to evaluate<br />
whether certain relationships give the Company the current<br />
ability to affect its returns, including how to consider options<br />
and convertible instruments, holding less than a majority of<br />
voting rights, how to consider protective rights and principalagency<br />
relationships (including removal rights), all of which<br />
may differ from current practice.<br />
IFRS 10 is required to be applied for accounting periods<br />
beginning on or after January 1, 2013, with earlier adoption<br />
permitted. <strong>The</strong> Company has not yet assessed the impact of the<br />
standard or determined whether it will adopt the standard early.<br />
IFRS 11 Joint Arrangements<br />
On January 1, 2013, <strong>ShawCor</strong> will be required to adopt IFRS 11,<br />
Joint Arrangements, which applies to accounting for interests in<br />
joint arrangements where there is joint control. <strong>The</strong> standard<br />
requires the joint arrangements to be classified as either joint<br />
operations or joint ventures. <strong>The</strong> structure of the joint<br />
arrangement would no longer be the most significant factor<br />
when classifying the joint arrangement as either a joint operation<br />
or a joint venture. In addition, the option to account for joint<br />
ventures (previously called jointly controlled entities) using<br />
proportionate consolidation will be removed and replaced<br />
by equity accounting.<br />
IFRS 11 is required to be applied for accounting periods beginning<br />
on or after January 1, 2013, with earlier adoption permitted. <strong>The</strong><br />
Company has not yet assessed the impact of the standard or<br />
determined whether it will adopt the standard early.<br />
IFRS 12 Disclosure of Interests in Other Entities<br />
On January 1, 2013, <strong>ShawCor</strong> will be required to adopt IFRS 12,<br />
Disclosure of Interests in Other Entities, which includes disclosure<br />
requirements about subsidiaries, joint ventures and associates,<br />
as well as unconsolidated structured entities and replaces<br />
existing disclosure requirements. Due to this new standard, the<br />
Company will be required to disclose the following: judgments<br />
and assumptions made when deciding how to classify<br />
involvement with another entity, interests that non-controlling<br />
interests have in consolidated entities, and nature of the risks<br />
associated with interests in other entities.<br />
IFRS 12 is required to be applied for accounting periods beginning<br />
on or after January 1, 2013, with earlier adoption permitted. <strong>The</strong><br />
Company has not yet assessed the impact of the standard or<br />
determined whether it will adopt the standard early.<br />
IFRS 13 Fair Value Measurement<br />
On January 1, 2013, <strong>ShawCor</strong> will be required to adopt IFRS 13,<br />
Fair Value Measurement. <strong>The</strong> new standard will generally<br />
converge the IFRS and U.S. Generally Accepted Accounting<br />
Principles requirements on how to measure fair value and the<br />
related disclosures. IFRS 13 establishes a single source of<br />
guidance for fair value measurements, when fair value is<br />
required or permitted by IFRS. Upon adoption, the Company<br />
will provide a single framework for measuring fair value while<br />
requiring enhanced disclosures when fair value is applied. In<br />
addition, fair value will be defined as the ‘exit price’ and concepts<br />
of ‘highest and best use’ and ‘valuation premise’ would be<br />
relevant only for non-financial assets and liabilities.
72 <strong>ShawCor</strong> Ltd. notes to the consolidated financial statements<br />
IFRS 13 is required to be applied for accounting periods beginning<br />
on or after January 1, 2013, with earlier adoption permitted. <strong>The</strong><br />
Company has not yet assessed the impact of the standard or<br />
determined whether it will adopt the standard early.<br />
IAS 27 Separate <strong>Financial</strong> Statements<br />
On January 1, 2013, <strong>ShawCor</strong> will be required to adopt IAS 27,<br />
Separate <strong>Financial</strong> Statements. As a result of the issue of the new<br />
consolidation suite of standards, IAS 27 has been reissued to<br />
reflect the changes to the consolidation guidance recently<br />
included in IFRS 10.<br />
In addition, IAS 27 will now only prescribe the accounting and<br />
disclosure requirements for investments in subsidiaries, joint<br />
ventures and associates when the Company prepares separate<br />
financial statements. <strong>The</strong> Company has not yet assessed the<br />
impact of this new accounting standard.<br />
IAS 28 Investments in Associates and Joint Ventures<br />
On January 1, 2013, <strong>ShawCor</strong> will be required to adopt IAS 28,<br />
Investments in Associates and Joint Ventures. As a consequence<br />
of the issue of IFRS 10, IFRS 11 and IFRS 12, IAS 28 has been<br />
amended and will provide further accounting guidance for<br />
investments in associates and will set out the requirements<br />
for the application of the equity method when accounting<br />
for investments in associates and joint ventures. This standard<br />
will be applied by the Company when there is joint control<br />
or significant influence over an investee. Significant influence<br />
is the power to participate in the financial and operating policy<br />
decisions of the investee but does not include control or joint<br />
control of those policy decisions. When it has been determined<br />
that the Company has an interest in a joint venture, the<br />
Company will recognize an investment and will account<br />
for it using the equity method in accordance with IAS 28.<br />
IAS 28 is required to be applied for accounting periods beginning<br />
on or after January 1, 2013, with earlier adoption permitted.<br />
<strong>The</strong> Company has not yet assessed the impact of the standard<br />
or determined whether it will adopt the standard early.<br />
Note 4<br />
First-time adoption of IFRS<br />
<strong>ShawCor</strong> adopted IFRS on January 1, 2011 with a date of<br />
transition to IFRS of January 1, 2010 (the “IFRS Transition Date”).<br />
In accordance with IFRS 1, IFRS is applied retrospectively at the<br />
transition date, with any adjustments to the assets and liabilities<br />
as a result of the adoption taken to retained earnings unless<br />
certain exemptions are applied.<br />
<strong>The</strong> effect of the Company’s transition to IFRS, described<br />
in note 2, is summarized in this note as follows:<br />
a) Adoption of IFRS<br />
<strong>The</strong> adoption of IFRS requires the application of IFRS 1,<br />
which provides guidance for an entity’s initial adoption<br />
of IFRS. Generally speaking, IFRS requires that an entity apply<br />
IFRS effective at the end of its first IFRS reporting period on<br />
a retrospective basis, with any adjustments to the assets and<br />
liabilities as a result of the adoption taken to retained earnings.<br />
IFRS 1 does, however, provide for certain mandatory exemptions<br />
and limited optional exemptions in specified areas of certain<br />
standards from this general requirement. <strong>The</strong> following are<br />
the exemptions available under IFRS 1 that are significant<br />
to <strong>ShawCor</strong> and have been applied in preparing the Company’s<br />
first financial statements under IFRS:<br />
i) Property, Plant and Equipment<br />
IFRS permits an entity to measure an item of property, plant<br />
and equipment at either cost or fair value. <strong>ShawCor</strong> has elected<br />
to retain the historical cost model for all assets. <strong>The</strong> Company<br />
has recalculated the associated historical accumulated<br />
depreciation of all fixed assets using a more detailed<br />
componentization analysis where applicable, and has reviewed<br />
their expected useful life, which in a number of cases was<br />
extended. This has caused the net book value of property,<br />
plant and equipment to increase.<br />
ii) Employee Benefits<br />
Under IAS 19, Employee Benefits, an entity may elect to use<br />
a ‘corridor’ approach that leaves some actuarial gains and<br />
losses unrecognized. Retrospective application of this approach<br />
requires the entity to split the cumulative actuarial gains and<br />
losses from the inception of the plan until the date of transition<br />
to IFRS into a recognized portion and an unrecognized portion.<br />
<strong>ShawCor</strong> has elected to recognize all cumulative actuarial<br />
gains and losses at the date of transition to IFRS through an<br />
adjustment to the opening retained earnings. This has resulted<br />
in an increase in the liability for employee benefits. <strong>The</strong><br />
Company has elected to adopt the IFRS 1 option to disclose<br />
the amounts required by IAS 19 on a prospective basis.
ANNUAL REPORT 2011 <strong>ShawCor</strong> Ltd.<br />
73<br />
iii) Cumulative Translation Account<br />
IAS 21, <strong>The</strong> Effects of Changes in Foreign Exchange Rates, requires<br />
an entity to determine the translation differences in accordance<br />
with IFRS from the date on which a subsidiary was formed or<br />
acquired. IFRS 1 allows cumulative translation differences for all<br />
foreign operations to be deemed zero at the date of transition to<br />
IFRS, with future gains or losses on subsequent disposal of any<br />
foreign operations to exclude translation differences arising from<br />
periods prior to the date of transition to IFRS. <strong>ShawCor</strong> has<br />
elected to deem all cumulative translation differences be zero<br />
on transition to IFRS as at January 1, 2010.<br />
iv) Business Combinations<br />
IFRS 1 allows a first time adopter to elect not to apply IFRS 3,<br />
Business Combinations, retrospectively to past business<br />
combinations that occurred before the date of transition to<br />
IFRS. <strong>The</strong> Company has elected to use the business<br />
combinations exemption in IFRS 1 to not apply IFRS 3<br />
retrospectively to past business combinations. Accordingly,<br />
the Company has not restated business combinations that<br />
took place prior to the transition date.<br />
As <strong>ShawCor</strong> early adopted CICA Handbook Section 1582, Business<br />
Combinations, on January 1, 2010, which was harmonized with<br />
IFRS 3, there are no IFRS adjustments required for 2010 for the<br />
accounting for business combinations completed in 2010.<br />
v) Stock-based Compensation<br />
<strong>ShawCor</strong> is required to apply IFRS 2, Share-based Payments,<br />
to equity instruments that vest after January 1, 2010. <strong>ShawCor</strong><br />
has consistently used the method of recognizing stock-based<br />
compensation expense on a graded vesting schedule. Adopting<br />
IFRS has resulted in a $145 thousand additional expense due<br />
to the revaluation of compound financial instruments (Share<br />
Appreciation Rights “SAR”) using the Black-Scholes model,<br />
compared to using the intrinsic value of liability under CGAAP.<br />
vii) Decommissioning Liabilities<br />
<strong>ShawCor</strong> has elected, in accordance with IFRS 1, to remeasure<br />
these liabilities as of the date of transition to IFRS in accordance<br />
with IAS 37, and has adjusted the asset cost and depreciable<br />
amount accordingly and will amortize the depreciable amount<br />
of the assets over the remaining useful lives.<br />
b) IFRS 1 Guidelines<br />
Under certain circumstances, a first time adopter must adhere<br />
to specific guidelines under IFRS 1. <strong>ShawCor</strong> Ltd. has applied the<br />
following guidelines to its opening IFRS statement of financial<br />
position as on January 1, 2010.<br />
i) Goodwill<br />
<strong>ShawCor</strong> is required to apply IAS 36, Impairment of Assets,<br />
on transition to IFRS on January 1, 2010. Under CGAAP, goodwill<br />
is tested for impairment by comparing the carrying value to the<br />
fair value at the reporting unit level. Impairment for goodwill<br />
under IFRS is tested at the CGU level. <strong>The</strong>re was no impairment<br />
recognized on transition from CGAAP to IFRS, based on the<br />
testing carried out under IFRS at the CGU level (note 16).<br />
ii) Estimates<br />
In accordance with IFRS 1, an entity’s estimates under IFRS<br />
at the date of transition from CGAAP to IFRS must be consistent<br />
with estimates made in accordance with CGAAP unless there is<br />
objective evidence that those estimates were in error. Estimates<br />
under IFRS are consistent with the CGAAP estimates.<br />
c) Reconciliations Between CGAAP and IFRS<br />
<strong>The</strong> impact of applying the above noted IFRS exemptions and<br />
the accounting policy differences between CGAAP and IFRS are<br />
summarized in the following tables and notes:<br />
vi) Borrowing Costs<br />
<strong>ShawCor</strong> has elected not to capitalize any borrowing costs<br />
on a retrospective basis for qualifying assets acquired prior<br />
to January 1, 2010, the date of transition to IFRS.
74 <strong>ShawCor</strong> Ltd. notes to the consolidated financial statements<br />
Reconciliation of the Balance Sheet Under CGAAP to IFRS at January 1, 2010<br />
Restated<br />
CGAAP IFRS FS effect of under IFRS<br />
(in thousands of Canadian dollars) Note December 31, 2009 Reclassification Transition to IFRS January 1, 2010<br />
Assets<br />
Current Assets<br />
Cash and cash equivalents $ 249,988 $ – $ – $ 249,988<br />
Accounts receivable 191,821 – – 191,821<br />
Income taxes receivable 14,055 – – 14,055<br />
Inventories 109,379 – – 109,379<br />
Prepaid expenses 14,392 – – 14,392<br />
Derivative financial instruments 1,782 – – 1,782<br />
Current future income taxes i 4,668 (4,668) – –<br />
586,085 (4,668) – 581,417<br />
Non-current Assets<br />
Property, plant and equipment b, d, f 270,219 – 14,072 284,291<br />
Intangible assets 62,784 – – 62,784<br />
Investment in associates 24 – – 24<br />
Derivative financial instruments 39 – – 39<br />
Deferred income taxes e, i 36,249 4,668 498 41,415<br />
Other assets 16,128 – (6,520) 9,608<br />
Goodwill 214,449 – – 214,449<br />
599,892 4,668 8,050 612,610<br />
Total Assets $ 1,185,977 $ – $ 8,050 $ 1,194,027<br />
Liabilities<br />
Current Liabilities<br />
Accounts payable and accrued liabilities j, i $ 127,932 $ (8,119) $ – $ 119,813<br />
Provisions d, i – 8,874 971 9,845<br />
Income taxes payable 42,971 – – 42,971<br />
Derivative financial instruments 510 – – 510<br />
Deferred revenue 75,100 – – 75,100<br />
Current portion of long-term debt 26,235 – – 26,235<br />
Obligations under finance lease 371 – – 371<br />
273,119 755 971 274,845<br />
Non-current Liabilities<br />
Long-term debt 26,052 – – 26,052<br />
Obligations under finance lease 492 – – 492<br />
Deferred income taxes e 76,552 – (976) 75,576<br />
Long-term provisions c, d, i – 18,585 7,462 26,047<br />
Other non-current liabilities i 19,340 (19,340) – –<br />
122,436 (755) 6,486 128,167<br />
Total Liabilities 395,555 – 7,457 403,012<br />
Shareholders’ Equity<br />
Share capital 204,151 – – 204,151<br />
Contributed surplus 17,277 – – 17,277<br />
Retained earnings a 695,800 – (126,213) 569,587<br />
Accumulated other comprehensive loss a (126,806) – 126,806 –<br />
790,422 – 593 791,015<br />
Total Liabilities and Shareholders’ Equity $ 1,185,977 $ – $ 8,050 $ 1,194,027
ANNUAL REPORT 2011 <strong>ShawCor</strong> Ltd.<br />
75<br />
Reconciliation of the Balance Sheet Under CGAAP to IFRS at December 31, 2010<br />
Restated<br />
CGAAP IFRS FS effect of under IFRS<br />
(in thousands of Canadian dollars) Note December 31, 2010 Reclassification Transition to IFRS December 31, 2010<br />
Assets<br />
Current Assets<br />
Cash and cash equivalents $ 155,998 $ – $ – $ 155,998<br />
Accounts receivable 243,955 – – 243,955<br />
Income taxes receivable 13,823 – – 13,823<br />
Inventories 126,132 – – 126,132<br />
Prepaid expenses 14,171 – – 14,171<br />
Derivative financial instruments 1,130 – – 1,130<br />
Current future income taxes i 4,590 (4,590) – –<br />
559,799 (4,590) – 555,209<br />
Non-current Assets<br />
Property, plant and equipment b, d, f 283,286 – 4,411 287,697<br />
Intangible assets 91,353 – – 91,353<br />
Long-term investment 31,995 – – 31,995<br />
Deferred income taxes e, i 29,035 4,590 (70) 33,555<br />
Other assets 15,622 – (5,699) 9,923<br />
Goodwill 215,204 – – 215,204<br />
666,495 4,590 (1,358) 669,727<br />
Total Assets $ 1,226,294 $ – $ (1,358) $ 1,224,936<br />
Liabilities<br />
Current Liabilities<br />
Loan payable $ 5,126 $ – $ – $ 5,126<br />
Accounts payable and accrued liabilities j, i 137,669 (4,926) – 132,743<br />
Provisions d, i – 5,595 2,297 7,892<br />
Income taxes payable 44,968 – – 44,968<br />
Derivative financial instruments 527 – – 527<br />
Deferred revenue 54,751 – – 54,751<br />
Current portion of long-term debt 25,005 – – 25,005<br />
Finance lease obligation 345 – – 345<br />
268,391 669 2,297 271,357<br />
Non-current Liabilities<br />
Long-term finance lease obligation 339 – – 339<br />
Derivative financial instruments 807 – – 807<br />
Deferred income taxes e 78,516 – (3,349) 75,167<br />
Long-term provisions c, d, i – 39,709 5,314 45,023<br />
Other non-current liabilities i 40,378 (40,378) – –<br />
120,040 (669) 1,965 121,336<br />
Total Liabilities 388,431 – 4,262 392,693<br />
Shareholders’ Equity<br />
Share capital 206,775 – – 206,775<br />
Contributed surplus 18,144 – – 18,144<br />
Retained earnings a 775,924 – (131,733) 644,191<br />
Accumulated other comprehensive loss a (162,980) – 126,113 (36,867)<br />
Total Shareholders’ Equity 837,863 – (5,620) 832,243<br />
Total Liabilities and Shareholders’ Equity $ 1,226,294 $ – $ (1,358) $ 1,224,936
76 <strong>ShawCor</strong> Ltd. notes to the consolidated financial statements<br />
Reconciliation of the Statement of Income and Comprehensive Income Under CGAAP to IFRS for the Year Ended December 31, 2010<br />
Restated<br />
CGAAP effect of under IFRS<br />
(in thousands of Canadian dollars) Note December 31, 2010 Transition to IFRS December 31, 2010<br />
Consolidated Statement of Income<br />
Revenue $ 1,034,163 $ – $ 1,034,163<br />
Cost of Goods Sold 623,641 – 623,641<br />
Gross Profit 410,522 – 410,522<br />
Selling, general and administrative expenses h, j 221,648 (2,564) 219,084<br />
Research and development expenses 11,050 – 11,050<br />
Foreign exchange (gains) losses g (5,745) 98 (5,647)<br />
Amortization of property, plant and equipment f 50,376 (5,299) 45,077<br />
Amortization of intangible assets 5,038 – 5,038<br />
Impairment of property, plant & equipment b – 14,923 14,923<br />
Impairment of intangible assets 958 – 958<br />
Impairment of goodwill 208 – 208<br />
Income from Operations 126,989 (7,158) 119,831<br />
Gain on revaluation of investment 13,181 – 13,181<br />
Investment loss on long-term investment (1,939) – (1,939)<br />
Interest income on short-term deposits 1,455 – 1,455<br />
Interest expense, other i (1,631) (302) (1,933)<br />
Interest expense on long-term debt (2,327) – (2,327)<br />
Income Before Income Taxes 135,728 (7,460) 128,268<br />
Income Taxes e 35,136 (1,940) 33,196<br />
Net Income $ 100,592 $ (5,520) $ 95,072<br />
Earnings per Share<br />
Basic $ 1.43 $ 1.35<br />
Diluted $ 1.41 $ 1.33<br />
Consolidated Statement of Comprehensive Income<br />
Net Income $ 100,592 $ (5,520) $ 95,072<br />
Unrealized loss on translating financial statements of foreign operations (37,379) (693) (38,072)<br />
Gain on hedges of unrealized foreign currency translation 1,423 – 1,423<br />
Income tax expense (218) – (218)<br />
Other comprehensive loss for the period (36,174) (693) (36,867)<br />
Comprehensive Income $ 64,418 $ (6,213) $ 58,205<br />
December 31 January 1<br />
(in thousands of Canadian dollars) Note 2010 2010<br />
Reconciliation of Shareholders’ Equity<br />
Shareholders’ Equity in Accordance with CGAAP $ 837,863 $ 790,422<br />
Property, plant and equipment b, f 30,462 25,977<br />
Impairment of property, plant, and equipment b, e (27,087) (14,275)<br />
Employee future benefits c, e (8,170) (10,547)<br />
Effects of change in FX rates g (931) (396)<br />
Provisions 210 222<br />
Decommissioning of liabilities d 41 (388)<br />
Share-based compensation j (145) –<br />
Shareholders’ Equity in Accordance with IFRS $ 832,243 $ 791,015
ANNUAL REPORT 2011 <strong>ShawCor</strong> Ltd.<br />
77<br />
Notes to the Reconciliations<br />
a) Cumulative Translation Account<br />
IAS 21, <strong>The</strong> Effects of Changes in Foreign Exchange Rates, requires<br />
an entity to determine the translation differences<br />
in accordance with IFRS from the date on which a subsidiary<br />
was formed or acquired. IFRS 1 allows cumulative translation<br />
differences for all foreign operations to be deemed zero at<br />
the date of transition to IFRS, with future gains or losses<br />
on subsequent disposal of any foreign operations to exclude<br />
translation differences arising from periods prior to the date<br />
of transition to IFRS. <strong>ShawCor</strong> has made the election to deem<br />
all cumulative translation differences be reset to zero on<br />
transition to IFRS as on January 1, 2010. Consequently, the<br />
Company has transferred a deficit of $126.8 million to retained<br />
earnings from the cumulative translation adjustment account.<br />
b) Property, Plant and Equipment<br />
<strong>The</strong> adjustment to property, plant and equipment at the<br />
January 1, 2010 transition date is a net increase of $14.1 million<br />
to the Net Book Value (“NBV”). NBV increased by $28.4 million<br />
due to the impact of componentization of property, plant and<br />
equipment and revision in the estimated useful life as required<br />
by IAS 16. This increase was partly offset by a combined asset<br />
impairment loss of $14.3 million recognized on certain Pipeline<br />
and Pipe Services segment fixed assets.<br />
Under IFRS, impairment testing is performed by comparing<br />
the carrying amount to the recoverable amount, calculated using<br />
the value in use method, which uses a risk adjusted pre-tax rate<br />
to discount cash flows (i.e. a higher rate than under CGAAP)<br />
to their net present value. Under CGAAP, there is a two<br />
step process:<br />
i) Reasonability test using the sum of the undiscounted cash<br />
flows and comparing them to the carrying value, and if the<br />
test fails<br />
ii) <strong>The</strong> amount of impairment is calculated using a risk adjusted<br />
post-tax rate to discount the cash flows (i.e. a lower rate than<br />
under IFRS) to their net present value.<br />
Under CGAAP, no impairment existed on the above assets as<br />
of December 31, 2010 and 2009.<br />
<strong>ShawCor</strong> recognized an additional impairment at<br />
December 31, 2010 on these fixed assets under IFRS in the<br />
amount of $14.9 million. <strong>The</strong> impairment recognized has been<br />
expensed in the statement of income for the year ended<br />
December 31, 2010 (note 13).<br />
c) Employee Benefits<br />
Under IFRS, the $14.4 million adjustment as at the IFRS<br />
Transition Date resulted from <strong>ShawCor</strong>’s election to use the<br />
IFRS 1 exemption and adopt IAS 19 on a prospective basis.<br />
This ‘fresh start or prospective approach’ allows that any<br />
unrecognized actuarial gains and losses as at the IFRS Transition<br />
Date for all plans be immediately recognized through an<br />
adjustment to the opening retained earnings and an increase<br />
to the defined employee future benefit liability.<br />
For the year ended December 31, 2010, the expense for defined<br />
employee future benefits under IFRS was $3.3 million lower than<br />
that under CGAAP due to the application of IFRIC 14 and IAS 19<br />
on a prospective basis.<br />
d) Decommissioning Liabilities<br />
As at the IFRS Transition Date, the decommissioning obligation<br />
liability increased by $1.1 million on transition to IFRS due to the<br />
use of country specific risk free rates under IFRS, as opposed<br />
to the use of country specific risk-adjusted discount rates under<br />
CGAAP. <strong>The</strong> use of lower discount rates also resulted in the<br />
calculation of higher decommissioning liability balances<br />
throughout 2010 under IFRS, which resulted in an IFRS<br />
transitional adjustment to the property, plant and equipment<br />
account (relating to decommissioning costs) in the amount<br />
of $1.6 million as at December 31, 2010.<br />
e) Deferred Income Tax Effect<br />
<strong>The</strong>se are the required deferred tax effects related to the various<br />
IFRS adjustments (i.e. property, plant and equipment; employee<br />
future benefits; decommissioning liabilities etc.).<br />
f) Amortization of Property, Plant and Equipment<br />
<strong>The</strong> 2010 income statement adjustment was due to the<br />
recalculation of depreciation expense of all fixed assets due<br />
to the application of a more detailed componentization analysis<br />
including their expected useful lives, which in a number of cases<br />
was extended. This resulted in a decrease in the amortization<br />
cost under IFRS versus CGAAP of $5.1 million for the year ended<br />
December 31, 2010.<br />
g) Foreign Exchange<br />
Foreign exchange gains decreased by $0.1 million for the twelve<br />
months ended December 31, 2010 primarily due to the change<br />
in the translation method for certain entities from the Temporal<br />
Method under CGAAP to the Current Rate Method under IFRS.<br />
h) Selling, General and Administration Expense<br />
<strong>The</strong> selling, general and administrative expense for the year<br />
ended December 31, 2010 has decreased by $2.5 million under<br />
IFRS versus CGAAP, because of lower defined employee<br />
future benefits expense under IFRS of $3.3 million due to the<br />
application of IFRIC 14 on transition to IFRS and the application<br />
of IAS 19 on a prospective basis, which was partly offset by<br />
higher decommissioning liabilities expense of $0.5 million.
78 <strong>ShawCor</strong> Ltd. notes to the consolidated financial statements<br />
i) Account Reclassification<br />
Certain accounts were reclassified for financial statement<br />
presentation purposes including deferred tax assets from<br />
current to non-current reflecting the adoption of IAS 12 and<br />
the requirements for provisions to be presented separately<br />
by IAS 37.<br />
j) Stock-based Compensation<br />
Adopting IFRS has resulted in a $145 thousand additional<br />
expense due to revaluing liability settled instruments (Share<br />
Appreciation Rights “SAR”) using the Black-Scholes model,<br />
compared to using the intrinsic value of liability under CGAAP.<br />
k) Adjustment to the Consolidated Statement of Cash Flows<br />
<strong>The</strong> changes to the consolidated statement of income<br />
and consolidated balance sheet have resulted in various<br />
reclassifications on the consolidated statement of cash flows;<br />
however, there were no material changes to the net cash flows.<br />
As a result, no reconciliations have been presented.<br />
note 5<br />
Segment information<br />
<strong>ShawCor</strong>’s operating segments are being reported based on<br />
the financial information provided to the Chief Executive Officer,<br />
who has been identified as the chief operating decision-maker<br />
(“CODM”) in monitoring segment performance and allocating<br />
resources between segments. <strong>The</strong> CODM assesses segment<br />
performance based on segment operating income or loss, which<br />
is measured differently than operating income or loss in the<br />
consolidated financial statements. Interest income, finance<br />
costs and income taxes are managed at a consolidated level<br />
and are not allocated to the reportable operating segments.<br />
As at December 31, 2011, the Company had two reportable<br />
operating segments: Pipeline and Pipe Services and<br />
Petrochemical and Industrial. Inter-segment transactions<br />
between Pipeline and Pipe Services and Petrochemical and<br />
Industrial are accounted for at negotiated transfer prices.<br />
a) Pipeline and Pipe Services<br />
<strong>The</strong> Pipeline and Pipe Services segment comprises the following<br />
business units:<br />
• Bredero Shaw, which provides pipe coating, lining and<br />
insulation products;<br />
• Flexpipe Systems, which provides spoolable composite pipe<br />
systems;<br />
• Canusa–CPS, which manufactures heat-shrinkable sleeves,<br />
adhesives and liquid coatings for pipeline joint protection<br />
applications;<br />
• Shaw Pipeline Services, which provides ultrasonic and<br />
radiographic weld inspection services for land and marine<br />
pipeline construction; and<br />
• Guardian, which provides oilfield tubular management<br />
services and inspection, testing and refurbishment<br />
of oilfield tubular.<br />
b) Petrochemical and Industrial<br />
<strong>The</strong> Petrochemical and Industrial segment comprises the<br />
following business units:<br />
• ShawFlex, which manufactures wire and cable for process<br />
instrumentation and control applications; and<br />
• DSG-Canusa, which manufactures heat-shrinkable tubing<br />
for automotive, electrical, electronic and utility applications.<br />
c) <strong>Financial</strong> and Corporate<br />
<strong>The</strong> financial and corporate division for <strong>ShawCor</strong> only earns<br />
revenue that is considered incidental to the activities of the<br />
Company. As a result, it does not meet the definition of<br />
a reportable operating segment as defined in IFRS.
ANNUAL REPORT 2011 <strong>ShawCor</strong> Ltd.<br />
79<br />
Segment Information<br />
<strong>The</strong> following table sets forth information by segment for the years ended December 31:<br />
(in thousands of Pipeline Petrochemical <strong>Financial</strong> eliminations<br />
Canadian dollars) and pipe services and industrial and corporate and adjustments Total<br />
2011 2010 2011 2010 2011 2010 2011 2010 2011 2010<br />
Revenue<br />
External $ 1,021,099 $ 920,157 $ 138,080 $ 115,783 $ – $ – $ (1,914) $ (1,777) $ 1,157,265 $ 1,034,163<br />
Inter-segment 4,617 2,547 216 88 – – (4,833) (2,635) – –<br />
1,025,716 922,704 138,296 115,871 – – (6,747) (4,412) 1,157,265 1,034,163<br />
Operating<br />
expense 867,981 720,951 116,534 98,298 27,541 22,241 (6,747) (4,412) 1,005,309 837,078<br />
Research and<br />
development 10,220 8,073 1,285 1,259 1,614 1,718 – – 13,119 11,050<br />
Amortization of<br />
property, plant<br />
and equipment 38,045 40,916 2,235 2,734 1,626 1,427 – 41,906 45,077<br />
Amortization of<br />
intangible assets 7,244 5,038 – – – – – 7,244 5,038<br />
Impairment of<br />
property, plant<br />
and equipment 5,244 14,923 – – – – – 5,244 14,923<br />
Impairment of<br />
intangible assets – 958 – – – – – – 958<br />
Impairment<br />
of goodwill – 208 – – – – – – 208<br />
Income (loss)<br />
from operations $ 96,982 $ 131,637 $ 18,242 $ 13,580 $ (30,781) $ (25,386) $ – $ – $ 84,443 $ 119,831<br />
Gain on revaluation<br />
of investment – 13,181 – – – – – – – 13,181<br />
Loss on investment<br />
in associate – – – – (10,133) (1,939) – – (10,133) (1,939)<br />
Interest income – – – – 1,024 1,455 – – 1,024 1,455<br />
Interest expense – – – – (5,531) (4,260) – – (5,531) (4,260)<br />
Income tax expense – – – – (13,120) (33,196) – – (13,120) (33,196)<br />
Goodwill 204,718 199,552 15,616 15,652 – – – – 220,334 215,204<br />
Total assets 1,043,722 1,050,281 75,218 102,505 812,480 931,585 (708,155) (859,435) 1,223,265 1,224,936<br />
Total liabilities 285,930 298,178 20,148 12,547 18,963 72,639 34,163 9,329 359,204 392,693<br />
Additions to<br />
property, plant<br />
and equipment,<br />
net of disposals $ 50,096 $ 43,204 $ 2,975 $ 2,995 $ 1,986 $ 204 $ – $ – $ 55,057 $ 46,403
80 <strong>ShawCor</strong> Ltd. notes to the consolidated financial statements<br />
Geographical Information<br />
<strong>The</strong> following table sets forth information by geographical region for the years ended December 31, the geographic region is<br />
determined by the country or location of operation.<br />
2011<br />
(in thousands of Canadian dollars) Canada usa latin America emar asia Pacific Eliminations total<br />
Revenue<br />
External $ 419,856 $ 208,788 $ 38,499 $ 296,122 $ 195,915 $ (1,915) $ 1,157,265<br />
Inter-segment 4,010 2,223 98 416 – (6,747) –<br />
423,866 211,011 38,597 296,538 195,915 (8,662) 1,157,265<br />
Non-current assets (a) $ 910,464 $ 198,814 $ 77,809 $ 120,395 $ 91,589 $ (706,413) $ 692,658<br />
2010<br />
Canada USA Latin America eMAR Asia Pacific Eliminations Total<br />
Revenue<br />
External $ 317,881 $ 158,794 $ 56,400 $ 234,770 $ 268,095 $ (1,777) $ 1,034,163<br />
Inter-segment 3,040 1,141 – 233 – (4,414) –<br />
320,921 159,935 56,400 235,003 268,095 (6,191) 1,034,163<br />
Non-current assets (a) $ 899,834 $ 331,293 $ 94,701 $ 123,706 $ 79,627 $ (859,434) $ 669,727<br />
(a) Excluding financial instruments, deferred tax assets and post-employment benefits.<br />
Note 6<br />
Acquisition<br />
On April 6, 2011, the Company acquired certain of the coating<br />
assets and business of Altus Energy Services Partnership, Altus<br />
Energy Services Ltd. and Nusco Northern Manufacturing Ltd.<br />
for $12.8 million. <strong>The</strong> assets purchased constitute a business<br />
as defined by IFRS 3, Business Combinations.<br />
<strong>The</strong> coating business, formerly known as CSI, and now known<br />
as <strong>ShawCor</strong> CSI (“CSI”), provides shop applied coatings at<br />
its modern facility in Nisku, Alberta and provides field coating<br />
services throughout Western Canada.<br />
<strong>The</strong> acquisition of the CSI assets will allow the Bredero Shaw<br />
division to supply a broad range of internal and external custom<br />
coating solutions that are complementary to its current range<br />
of anticorrosion, flow efficiency and insulation coatings for<br />
oil and gas gathering and transmission lines. This acquisition<br />
will also allow Bredero Shaw to provide a full range of custom<br />
coating solutions for the oil sands and for pipeline<br />
rehabilitation applications.<br />
<strong>The</strong> following table shows the purchase price allocation for the<br />
acquisition of CSI, and assigns the total consideration paid to the<br />
net assets acquired:<br />
(in thousands of Canadian dollars)<br />
Current assets (excluding cash) $ 339<br />
Property, plant and equipment 6,150<br />
Intangible assets 4,543<br />
Goodwill 1,880<br />
Current liabilities assumed (73)<br />
Net assets acquired, at fair value $ 12,839<br />
Consideration:<br />
Cash $ 12,839<br />
<strong>The</strong> goodwill acquired represents the acquired assembled<br />
workforce and the benefits that the Company expects to earn<br />
from the acquisition due to expected synergies and other<br />
intangible assets that do not meet the criteria for recognition<br />
as identifiable intangible assets.
ANNUAL REPORT 2011 <strong>ShawCor</strong> Ltd.<br />
81<br />
note 7<br />
Employee benefits expense<br />
<strong>The</strong> following table sets forth the Company’s employee benefits<br />
expense for the periods indicated:<br />
(in thousands of Canadian dollars) 2011 2010<br />
Salaries, wages and<br />
employee benefits $ 344,949 $ 299,486<br />
Pension 11,275 6,260<br />
Share-based and other<br />
incentive-based<br />
compensation note 25 4,501 4,487<br />
Total $ 360,725 $ 310,233<br />
note 8<br />
Cash and cash equivalents<br />
<strong>The</strong> following table sets forth the Company’s cash and cash<br />
equivalents as at the periods indicated:<br />
(in thousands of December 31 December 31 January 1<br />
Canadian Dollars) 2011 2010 2010<br />
Cash $ 56,705 $ 59,601 $ 93,011<br />
Cash equivalents 10,571 96,397 156,977<br />
note 9<br />
Accounts receivable<br />
$ 67,276 $ 155,998 $ 249,988<br />
<strong>The</strong> following table sets forth the Company’s trade and other<br />
receivables as at the periods indicated:<br />
(in thousands of December 31 December 31 January 1<br />
Canadian Dollars) 2011 2010 2010<br />
Trade accounts<br />
receivables $ 268,119 $ 225,513 $ 181,505<br />
Allowance for<br />
doubtful<br />
accounts<br />
note 21 (13,967) (3,775) (5,353)<br />
Other 25,172 22,217 15,669<br />
$ 279,324 $ 243,955 $ 191,821<br />
<strong>The</strong> following tables sets forth the aging of the Company’s trade<br />
accounts receivable as at the periods indicated:<br />
(in thousands of December 31 December 31 January 1<br />
Canadian Dollars) 2011 2010 2010<br />
Current $ 157,142 $ 79,549 $ 117,474<br />
Past due<br />
1 to 30 days 44,423 79,610 28,994<br />
Past due<br />
31 to 60 days 28,968 31,160 10,850<br />
Past due<br />
61 to 90 days 13,596 11,392 7,795<br />
Past due for more<br />
than 90 days 23,990 23,802 16,392<br />
Total trade<br />
accounts<br />
receivable 268,119 225,513 181,505<br />
Less: allowance<br />
for doubtful<br />
accounts 13,967 3,775 5,353<br />
Trade accounts<br />
receivable –<br />
net (a) $ 254,152 $ 221,738 $ 176,152<br />
(a) <strong>The</strong> trade accounts receivable – net balance above excludes other<br />
receivables outstanding in the amount of $25,172, $22,217 and $15,669 as<br />
at December 31, 2011, December 31, 2010 and January 1, 2010, respectively.<br />
note 10<br />
Inventories<br />
<strong>The</strong> following table sets forth the Company’s inventories as at<br />
the periods indicated:<br />
(in thousands of December 31 December 31 January 1<br />
Canadian dollars) 2011 2010 2010<br />
Raw materials<br />
and supplies $ 98,688 $ 93,519 $ 74,510<br />
Work-in-progress 14,493 5,253 3,750<br />
Finished goods 43,992 36,071 40,519<br />
Inventory<br />
obsolescence (10,387) (8,711) (9,400)<br />
$ 146,786 $ 126,132 $ 109,379<br />
During the year 2011, the Company recorded an increase<br />
of $2.2 million in the provision for inventory obsolescence,<br />
due to the build up of certain excess raw materials.<br />
During the year 2010, the Company recorded a recovery of<br />
$2.4 million from the provision for inventory obsolescence, due<br />
to certain excess raw materials being allocated to new projects.
82 <strong>ShawCor</strong> Ltd. notes to the consolidated financial statements<br />
note 11<br />
Property, plant and equipment<br />
<strong>The</strong> following table sets forth the Company’s property, plant and equipment as at:<br />
Land and Land Machinery and Capital Projects-<br />
(in thousands of Canadian dollars) Improvements Buildings Equipment In-progress Total<br />
Cost<br />
Balance – January 1, 2010 $ 47,907 $ 154,419 $ 536,257 $ 4,918 $ 743,501<br />
Exchange differences (1,697) (10,282) 25 721 (11,233)<br />
Additions 393 6,563 29,211 12,556 48,723<br />
Acquisitions 229 2,692 10,758 – 13,679<br />
Decommissioning liabilities and other – – 5,798 – 5,798<br />
Disposals (7,897) (21,896) (44,780) – (74,573)<br />
Balance – December 31, 2010 $ 38,935 $ 131,496 $ 537,269 $ 18,195 $ 725,895<br />
Exchange differences 1,465 235 (6,547) (2,804) (7,651)<br />
Additions 13 6,336 45,642 3,991 55,982<br />
Acquisitions – – 6,150 – 6,150<br />
Decommissioning liabilities and other – – 2,026 – 2,026<br />
Disposals (703) (1,988) (13,075) (46) (15,812)<br />
Balance – December 31, 2011 $ 39,710 $ 136,079 $ 571,465 $ 19,336 $ 766,590<br />
Accumulated Amortization<br />
Balance – January 1, 2010 $ (22,792) $ (87,883) $ (344,260) $ – $ (444,935)<br />
Exchange differences 2,366 1,101 5,499 – 8,966<br />
Amortization expense 778 (8,280) (36,063) – (43,565)<br />
Decommissioning liabilities and other – – (1,512) – (1,512)<br />
Eliminated on disposal 7,897 21,884 42,131 – 71,912<br />
Balance – December 31, 2010 $ (11,751) $ (73,178) $ (324,205) $ – $ (409,134)<br />
Exchange differences 947 2,915 1,697 – 5,559<br />
Amortization expense (2,334) (7,925) (28,055) – (38,314)<br />
Decommissioning liabilities and other – – (3,592) – (3,592)<br />
Eliminated on disposal 569 1,494 8,701 – 10,764<br />
Balance – December 31, 2011 $ (12,569) $ (76,694) $ (345,454) $ – $ (434,717)<br />
Accumulated Impairment<br />
Balance – January 1, 2010 $ (1,105) $ (3,312) $ (9,858) $ – $ (14,275)<br />
Exchange differences 1 (3) 136 – 134<br />
Impairment (1,390) (3,011) (10,522) – (14,923)<br />
Decommissioning liabilities and other – – – – –<br />
Eliminated on disposal – – – – –<br />
Balance – December 31, 2010 $ (2,494) $ (6,326) $ (20,244) $ – $ (29,064)<br />
Exchange differences 8 87 1,458 – 1,553<br />
Impairment – (659) (4,585) – (5,244)<br />
Decommissioning liabilities and other – – – – –<br />
Eliminated on disposal – – – – –<br />
Balance – December 31, 2011 $ (2,486) $ (6,898) $ (23,371) $ – $ (32,755)<br />
Net book value<br />
As at January 1, 2010 $ 24,010 $ 63,224 $ 192,139 $ 4,918 $ 284,291<br />
As at December 31, 2010 $ 24,690 $ 51,992 $ 192,820 $ 18,195 $ 287,697<br />
As at December 31, 2011 $ 24,655 $ 52,487 $ 202,640 $ 19,336 $ 299,118
ANNUAL REPORT 2011 <strong>ShawCor</strong> Ltd.<br />
83<br />
note 12<br />
Intangible assets<br />
<strong>The</strong> following table sets forth the Company’s intangible assets as at:<br />
Intellectual Property, Intangible Assets, Intangible Assets,<br />
(in thousands of Canadian dollars) with Limited Life (a) with Limited Life (b) with Indefinite Life (c) Total<br />
Cost<br />
Balance – January 1, 2010 $ 57,576 $ 9,547 $ 1,931 $ 69,054<br />
Additions – 306 – 306<br />
Acquisition of a subsidiary 7,428 26,991 – 34,419<br />
Balance – December 31, 2010 $ 65,004 $ 36,844 $ 1,931 $ 103,779<br />
Exchange differences (665) (2,411) – (3,076)<br />
Additions 351 41 – 392<br />
Acquisition of a subsidiary – 3,868 675 4,543<br />
Disposals and write-offs (227) (400) (331) (958)<br />
Balance – December 31, 2011 $ 64,463 $ 37,942 $ 2,275 $ 104,680<br />
Accumulated Amortization<br />
Balance – January 1, 2010 $ (5,407) $ (863) $ – $ (6,270)<br />
Foreign exchange – (160) – (160)<br />
Amortization (4,091) (947) – (5,038)<br />
Balance – December 31, 2010 $ (9,498) $ (1,970) $ – $ (11,468)<br />
Exchange differences (599) 993 – 394<br />
Amortization (3,731) (3,513) – (7,244)<br />
Balance – December 31, 2011 $ (13,828) $ (4,490) $ – $ (18,318)<br />
Accumulated Impairment<br />
Balance – January 1, 2010 $ – $ – $ – $ –<br />
Impairment (227) (400) (331) (958)<br />
Balance – December 31, 2010 $ (227) $ (400) $ (331) $ (958)<br />
Disposals and write-offs 227 400 331 958<br />
Balance – December 31, 2011 $ – $ – $ – $ –<br />
Net book value<br />
As at January 1, 2010 $ 52,169 $ 8,684 $ 1,931 $ 62,784<br />
As at December 31, 2010 $ 55,279 $ 34,474 $ 1,600 $ 91,353<br />
As at December 31, 2011 $ 50,635 $ 33,452 $ 2,275 $ 86,362<br />
(a) Intellectual property, with limited life, represents the cost of certain technology and know-how and patents obtained in acquisitions. <strong>The</strong> Company amortizes the<br />
cost of intellectual property over its estimated useful life of 15 years.<br />
(b) Intangible assets, with limited life, represents trademarks, customer relationships and non-competition agreements acquired directly or in conjunction with a past<br />
business combination. <strong>The</strong> Company amortizes the cost of intangible assets with limited life over its estimated useful life of 15 years. <strong>The</strong> net book value of<br />
customer relationship as at December 31, 2011 is $32.9 million, and is included in intangible assets with limited life in the table above.<br />
(c) Intangible assets, with indefinite life, represent the value of brands obtained in the Flexpipe acquisition. As the cost of intangible assets with indefinite life is not<br />
amortized, the Company assesses these intangible assets for impairment on an annual basis.
84 <strong>ShawCor</strong> Ltd. notes to the consolidated financial statements<br />
note 13<br />
Impairment of property, plant and equipment<br />
During fiscal 2011, qualitative factors such as line reductions,<br />
reduced levels of drilling activity, project outlook in certain<br />
regions and low capacity utilization coupled with the lingering<br />
impact of the financial crisis of 2008 had an impact on some<br />
CGUs of the Company, which were dependent on a few<br />
major projects that were coming close to completion. More<br />
specifically, indications were that two production plants in the<br />
Company’s Bredero Shaw group of CGUs may be impaired.<br />
<strong>The</strong>se two production plants are located in Leith, Scotland<br />
and Kembla Grange, Australia. In Leith, the existing facility<br />
lease is not likely to be renewed upon expiration and<br />
therefore the Company expects to close the facility in 2013.<br />
In Kembla Grange, Australia, the project outlook for 2012 and<br />
beyond is not encouraging and the Company has decided to<br />
close the facility by the third quarter of 2012. In Sharjah, U.A.E.,<br />
the Company has been awarded a major contract and the<br />
outlook for the next 5 years has improved. Consequently, there<br />
is a reversal of previously recorded impairment. Each one of<br />
these production plants is a separate CGU in the Pipeline and<br />
Pipe services segment.<br />
Camrose,<br />
Portland,<br />
(in thousands of Canadian dollars) Alberta, Canada Oregon, USA Sharjah, U.A.E. Total<br />
January 1, 2010<br />
Land and land improvements $ 1,105 $ – $ – $ 1,105<br />
Buildings 3,312 – – 3,312<br />
Plant, machinery, and equipment 8,420 1,438 – 9,858<br />
Impairment charge $ 12,837 $ 1,438 $ – $ 14,275<br />
December 31, 2010<br />
Land and land improvements $ 1,390 $ – $ – $ 1,390<br />
Buildings 3,011 – – 3,011<br />
Plant, machinery, and equipment 8,494 700 1,328 10,522<br />
Impairment charge $ 12,895 $ 700 $ 1,328 $ 14,923<br />
Kembla Grange<br />
Leith, Scotland Australia Sharjah, U.A.E. Total<br />
December 31, 2011<br />
Land and land improvements $ – $ – $ – $ –<br />
Buildings 218 461 – 679<br />
Plant, machinery, and equipment 1,831 3,491 (757) 4,565<br />
Impairment charge $ 2,049 $ 3,952 $ (757) $ 5,244<br />
Recoverable Amount<br />
<strong>The</strong> Company determines the recoverable amount for its<br />
CGUs as the higher of Value In Use (“VIU”) and the CGUs<br />
Fair Value Less Costs to Sell (“FVLCS”). For the property, plant<br />
and equipment impairment test, the VIU of each of the CGUs<br />
(except for Kembla Grange, Australia) was higher than the<br />
CGUs FVLCS. <strong>The</strong> Company determines the recoverable amount<br />
for its CGUs using the VIU model for the purpose of testing<br />
property, plant and equipment for impairment. VIU calculations<br />
use pre-tax cash flow projections based on three-year financial<br />
business plans (“Business Plans”) approved by the Board of<br />
Directors. Management also determined budgeted gross margin<br />
based on past performance and its expectations of market<br />
developments. Cash flows beyond the three-year period are<br />
extrapolated using estimated growth rates as applicable. <strong>The</strong><br />
growth rate does not exceed the long-term average growth rate<br />
for the business in which the CGU operates.<br />
<strong>The</strong> VIU is determined by discounting the future cash flows<br />
generated from the Company’s continuing use of the respective<br />
CGU. <strong>The</strong> discount rates used are pre-tax and reflect specific<br />
risks relating to the CGU. <strong>The</strong> discounted cash flow model<br />
employed by the Company reflects the specific risks of each<br />
CGU and its business environment. <strong>The</strong> model calculates the<br />
VIU as the present value of the projected free cash flows and<br />
the terminal value of each CGU. To ensure the reasonability<br />
of the VIU estimate, the VIU calculation for each CGU was<br />
compared to the CGUs FVLCS amount.
ANNUAL REPORT 2011 <strong>ShawCor</strong> Ltd.<br />
85<br />
Details relating to the discounted cash flow models used in the<br />
impairment tests of the property, plant and equipment balances<br />
are as follows:<br />
Camrose,<br />
Portland,<br />
Alberta, Canada Oregon, USA Sharjah, U.A.E.<br />
January 1, 2010<br />
Valuation basis Value-in-use Value-in-use Value-in-use<br />
Period of specific<br />
projected<br />
cash flows 5 years 5 years 5 years<br />
Discount rate 18.6% 24.5% 17.2%<br />
Growth rate 0.0% (a) (a)<br />
December 31, 2010<br />
Valuation basis Value-in-use Value-in-use Value-in-use<br />
Period of specific<br />
projected<br />
cash flows 5 years 5 years 3 years<br />
Discount rate 19.1% 24.1% 17.8%<br />
Growth rate 0.0% (a) (a)<br />
Kembla Grange<br />
Leith, Scotland Australia Sharjah, U.A.E.<br />
December 31, 2011<br />
Valuation basis Value-in-use FVLCS Value-in-use<br />
Period of specific<br />
projected<br />
cash flows 2 years 1 year 3 years<br />
Discount rate 20.1% – 17.8%<br />
Growth rate 0.0% n/a (a)<br />
(a) <strong>The</strong> property, plant and equipment at the Portland CGU and the Sharjah CGU<br />
were assumed to have been redeployed to other sites of the Company at the<br />
end of forecast period. <strong>The</strong> terminal values for the redeployed assets were<br />
estimated as the amount that other divisions would be expected to pay for<br />
these redeployed assets; as a result, no terminal growth rates were applied<br />
at these CGUs.<br />
note 14<br />
Investment in associate<br />
<strong>The</strong> following table sets forth the Company’s long-term<br />
investment as at December 31:<br />
(in thousands of December 31 December 31 January 1<br />
Canadian dollars) 2011 2010 2010<br />
Investment in<br />
company<br />
subject to<br />
significant<br />
influence $ 30,095 $ 31,971 $ –<br />
Other long-term<br />
investment<br />
classified<br />
as available<br />
for sale – 24 24<br />
$ 30,095 $ 31,995 $ 24<br />
Investment in Company Subject to Significant Influence –<br />
Fineglade Limited (Ireland)<br />
On July 2, 2010, the Company made an equity investment<br />
in Fineglade Limited (Ireland) (“Fineglade”) in the amount<br />
of US$24.7 million (CDN$25.7 million at the then current<br />
exchange rate) to form an investor group with two private equity<br />
firms, 4D Global Energy Advisors of Paris, France, and Sophia<br />
Capital of Buenos Aires, Argentina, with the Company holding<br />
a 40% interest in the investor group. Fineglade was formed<br />
to complete a share capital investment in Socotherm S.p.A<br />
(“Socotherm”) and has resulted in Fineglade attaining a 95%<br />
ownership interest in Socotherm. <strong>The</strong> Company also entered<br />
into a shareholders’ agreement with the other shareholders of<br />
Fineglade that provides the Company with significant influence<br />
over the strategic operating, investing and financing activities<br />
of Fineglade, without having joint control.<br />
During the fourth quarter of 2010, the Company made<br />
an incremental investment in Fineglade of US$5.1 million<br />
($5.2 million at the then current exchange rate) as its pro<br />
rata share of a secured bridge loan provided by Fineglade<br />
to Socotherm, and a further investment in Socotherm<br />
of US$3.3 million ($3.4 million at the then current exchange<br />
rate) to discharge additional liabilities. On October 29, 2010,<br />
the court of Vicenza issued a homologation decree that approved<br />
the share capital investment, and the acquisition between the<br />
investor group and Socotherm was subsequently completed.<br />
During the year ended December 31, 2011, the Company<br />
invested an additional US$10.7 million ($10.5 million at the then<br />
current exchange rate) in Fineglade as its pro rata share<br />
of a potential future capital increase by Fineglade in Socotherm.<br />
For the year ended December 31, 2011, the Company incurred<br />
an investment loss on its investment in Fineglade in the amount<br />
of $10.1 million. In addition, the Company recorded its pro-rata<br />
share of the associate‘s other comprehensive loss in the amount<br />
of $3.1 million for the year ended December 31, 2011.<br />
In connection with the investment in Fineglade, the Company<br />
also entered into a financial instruments agreement that may<br />
result in the Company increasing its ownership in Fineglade after<br />
January 1, 2013. <strong>The</strong> net fair value of the financial instruments as<br />
at December 31, 2011 was $2.5 million (December 31, 2010 –<br />
$0.8 million) and this long-term liability has been classified under<br />
long-term derivative financial instruments, a financial liability<br />
through profit or loss, on the consolidated balance sheet.<br />
During the third quarter of 2011, the Company advanced a loan<br />
to Fineglade in the amount of US$8.5 million ($8.2 million<br />
at the then current exchange rate) with a maturity date of<br />
December 31, 2013. <strong>The</strong> interest rate on this loan is reset on<br />
a quarterly basis at the three month LIBOR rate plus 2.0%.<br />
During the fourth quarter of 2011, the Company advanced<br />
a loan to Fineglade in the amount of US$2.0 million
86 <strong>ShawCor</strong> Ltd. notes to the consolidated financial statements<br />
($2.1 million at the then current exchange rate), payable<br />
on demand and bearing an upfront fee of 2%. <strong>The</strong> interest on<br />
this loan is fixed at 4% of the principal amount.<br />
note 15<br />
Other assets<br />
<strong>The</strong> following table details the other assets as at December 31:<br />
(in thousands of December 31 December 31 January 1<br />
Canadian dollars) 2011 2010 2010<br />
Long-term<br />
prepaid<br />
expenses $ 9,146 $ 3,828 $ 4,193<br />
Long-term notes<br />
receivable (a) 3,845 3,758 3,943<br />
Long-term loan<br />
to associate (b) 10,824 – –<br />
Defined<br />
employee<br />
future benefit<br />
asset 2,876 2,337 1,472<br />
$ 26,691 $ 9,923 $ 9,608<br />
(a) Long-term notes receivable relate to an amount advanced by the Company<br />
to an external party to support the construction of port facilities at a Bredero<br />
Shaw plant location in Kabil, Indonesia. Interest is payable semi-annually<br />
at US prime plus 0.25%, with principal repayments to be made in four<br />
semi-annual installments beginning no later than March 31, 2018, as set<br />
out in the loan agreement terms.<br />
(b) Long-term loan to Fineglade Limited<br />
note 16<br />
Goodwill<br />
<strong>The</strong> changes in the carrying amount of goodwill are shown below:<br />
(in thousands of December 31 December 31 January 1<br />
Canadian dollars) 2011 2010 2010<br />
Gross amount<br />
of goodwill $ 215,412 $ 214,449 $ 229,059<br />
Accumulated<br />
impairment (208) – –<br />
Balance –<br />
Beginning<br />
of year 215,204 214,449 229,059<br />
Additions to<br />
goodwill on<br />
acquisition 1,880 11,649 –<br />
Impairment<br />
of goodwill – (208) –<br />
Foreign exchange 3,250 (10,686) (14,610)<br />
Balance –<br />
End of year $ 220,334 $ 215,204 $ 214,449<br />
In 2010, goodwill acquired during the year was a result<br />
of the acquisition of <strong>The</strong>rmotite Brasil Ltda. (“TTB Ltd.”)<br />
and BS Servicios de Injeção (“BSSI”) (collectively “BSRTL”).<br />
<strong>The</strong> following table summarizes the significant carrying amount<br />
of goodwill:<br />
(in thousands of December 31 December 31 January 1<br />
Canadian dollars) 2011 2010 2010<br />
Bredero Shaw<br />
(excluding<br />
BSRTL) $ 140,744 $ 133,375 $ 141,825<br />
BSRTL 14,244 16,447 4,927<br />
Flexpipe 49,730 49,730 49,730<br />
DSG-Canusa<br />
GmbH 15,616 15,652 17,759<br />
SIS (Shaw<br />
Inspection<br />
Services) – – 208<br />
$ 220,334 $ 215,204 $ 214,449<br />
(a) Impairment Testing for Each<br />
Reporting Unit Containing Goodwill<br />
<strong>The</strong> Company performed a goodwill impairment test for each<br />
specified group of CGUs (“GCGU”) that contained goodwill<br />
at the IFRS transition date of January 1, 2010 (“IFRS Transition<br />
Date”); a second and third goodwill impairment test was also<br />
completed on the Company’s traditional annual goodwill<br />
impairment testing date of October 31, 2010 and October 31, 2011<br />
(“Annual Goodwill Valuation Date”). At the IFRS Transition Date,<br />
the Company concluded that there was no impairment of<br />
goodwill in any of its GCGUs, as the recoverable amounts for<br />
these GCGUs was higher than their respective carrying amounts.<br />
At the Annual Goodwill Valuation Date of October 31, 2010, the<br />
Company concluded that due to changing market conditions,<br />
goodwill pertaining to the Company’s Shaw Inspection Services<br />
business was impaired, and accordingly a goodwill impairment<br />
charge to selling, general and administrative (“SG&A”) expense<br />
of $208 was recorded in 2010. At the Annual Goodwill<br />
Valuation Date of October 31, 2011, the Company concluded<br />
there was no impairment of goodwill in any of its GCGUs, as<br />
the recoverable amount for these GCGUs was higher than their<br />
respective carrying amount.<br />
(b) Recoverable Amount<br />
<strong>The</strong> Company determines the recoverable amount for its GCGUs<br />
as the higher of VIU and the FVLCS. For the goodwill impairment<br />
test, the FVLCS of each of the GCGUs was higher than its VIU.<br />
FVLCS calculations use post-tax cash flow projections based on<br />
three-year financial Business Plans approved by the Company’s<br />
Board of Directors, which are then projected out for a further<br />
period of two years based on management’s best estimates.<br />
Cash flows beyond the five-year period are extrapolated using<br />
estimated growth rates as applicable. <strong>The</strong> growth rate does not<br />
exceed the long-term average growth rate for the business in<br />
which the GCGUs operate. <strong>The</strong> FVLCS is calculated net of selling<br />
costs that are estimated at 2%.
ANNUAL REPORT 2011 <strong>ShawCor</strong> Ltd.<br />
87<br />
<strong>The</strong> FVLCS is determined by discounting the future free cash<br />
flows generated from the Company’s continuing use of the<br />
respective GCGUs. <strong>The</strong> discount rates used are post-tax and<br />
reflect specific risks relating to the GCGUs. <strong>The</strong> discounted cash<br />
flow model employed by the Company reflects the specific risks<br />
of each GCGU and their business environment. <strong>The</strong> model<br />
calculates the FVLCS as the present value of the projected free<br />
cash flows and the Terminal Value of each group of GCGUs.<br />
<strong>The</strong> calculation of FVLCS for each GCGU is most sensitive to the<br />
following key assumptions:<br />
• Projected Cash Flows<br />
• Market Assumptions<br />
• Discount Rate<br />
• Growth Rate and Terminal Value<br />
Projected Cash Flows<br />
<strong>The</strong> Projected Cash Flows for each GCGU are derived from the<br />
most recently completed Business Plan, which are projected out<br />
for a future time period of two years based on management’s<br />
best estimates. Projected Cash Flows are estimated by adjusting<br />
forecasted annual net income (for the forecast period) for<br />
non-cash items (such as amortization, accretion, and foreign<br />
exchange), investments in working capital and investments<br />
in capital assets. Estimating future earnings requires judgment,<br />
consideration of past and actual performance, as well as<br />
expected developments in the GCGU’s respective markets<br />
and in the overall macroeconomic environment.<br />
Market Assumptions<br />
<strong>The</strong> forecasted revenue for a GCGU in the Business Plan<br />
is based on that GCGU securing an estimated number of<br />
projects. A change in the number of estimated projects to be<br />
secured by a GCGU can have a material impact on the projected<br />
future cash flows for that particular GCGU. <strong>The</strong> gross margin<br />
for each GCGU in the Business Plan is also dependent on<br />
assumptions made about the price of raw materials in the future;<br />
a change in the assumptions of these key inputs can have<br />
a material impact on the projected future cash flows for<br />
a particular GCGU.<br />
Discount Rate<br />
Discount rates represent the current market assessment of the<br />
risks specific to each GCGU, regarding the time value of money<br />
and the individual risks of the underlying assets, which have not<br />
been incorporated in the cash flow estimates. <strong>The</strong> discount rate<br />
calculation is based on the specific circumstances of the<br />
Company and its GCGUs and is derived from the weighted<br />
average cost of capital (“WACC”) for the consolidated<br />
Company. <strong>The</strong> WACC takes into account both debt and equity.<br />
<strong>The</strong> cost of equity is derived from the expected return on<br />
investment by the Company’s investors. <strong>The</strong> cost of debt<br />
is based on the interest bearing borrowings the Company<br />
is obliged to service. GCGU specific risk is incorporated by<br />
applying individual specific risk factors; these specific risk<br />
factors are evaluated annually.<br />
<strong>The</strong> following are the discount rates used in the calculation<br />
of the impairment tests:<br />
October 31, 2011 October 31, 2010 January 1, 2010<br />
Bredero Shaw<br />
(excluding<br />
BSRTL) 11% 11% 11%<br />
BSRTL 14% 14% 14%<br />
Flexpipe 13% 14% 14%<br />
DSG-Canusa<br />
GmbH 12% 12% 12%<br />
SIS (Shaw<br />
Inspection<br />
Services) – 12% 12%<br />
Terminal Value Growth Rate<br />
<strong>The</strong> Terminal Value Growth Rate is used to calculate the<br />
Terminal Value of the GCGUs at the end of the Projected Free<br />
Cash Flow period of five years. A Terminal Value Growth Rate<br />
of 3.0% was used (for all goodwill impairment tests) reflecting<br />
a conservative expectation of long-term growth in energy<br />
infrastructure investment; this figure also reflects the Company’s<br />
best estimate of the set of economic conditions that are<br />
expected to exist over the forecast period.<br />
Sensitivity to Changes in Assumptions<br />
With regard to the assessment of FVLCS of the Bredero<br />
Shaw, BSRTL, Flexpipe and the DSG-Canusa GmbH GCGUs,<br />
management believes that no reasonably possible change in any<br />
of the above key assumptions would cause the carrying value of<br />
the unit to materially exceed its recoverable amount, as<br />
estimated by the GCGU’s FVLCS.<br />
note 17<br />
Accounts payable and accrued liabilities<br />
<strong>The</strong> following table sets forth the Company’s trade and other<br />
payables as at December 31:<br />
(in thousands of December 31 December 31 January 1<br />
Canadian dollars) 2011 2010 2010<br />
Trade payables $ 60,556 $ 50,950 $ 45,859<br />
Accrued<br />
liabilities 95,240 81,793 73,954<br />
$ 155,796 $ 132,743 $ 119,813
88 <strong>ShawCor</strong> Ltd. notes to the consolidated financial statements<br />
note 18<br />
Provisions<br />
<strong>The</strong> following table sets forth the Company’s provisions as at:<br />
Defined<br />
Decommissioning Deferred Purchase Employee Future Other<br />
(in thousands of Canadian dollars) Liabilities Consideration (a) Benefit Liability Provisions Total<br />
Balance – January 1, 2010 $ 16,923 $ – $ 11,933 $ 7,036 $ 35,892<br />
Provision adjustments 7,378 13,819 1,700 3,592 26,489<br />
Settlement of liabilities (3,218) – (5,207) (676) (9,101)<br />
Accretion expense 302 189 – – 491<br />
Foreign exchange differences (1,010) (739) (130) (151) (2,030)<br />
Loss on settlement 310 – – – 310<br />
Other – – 865 – 865<br />
Balance – December 31, 2010 $ 20,685 $ 13,269 $ 9,161 $ 9,801 $ 52,916<br />
Provision adjustments 3,188 – 6,020 6,519 15,727<br />
Settlement of liabilities (1,074) – (5,392) (2,240) (8,706)<br />
Accretion expense 443 1,053 – – 1,496<br />
Foreign exchange differences 157 1,205 8 (121) 1,249<br />
Gain on settlement (18) – – (7) (25)<br />
Other – – 539 (20) 519<br />
Balance – December 31, 2011 $ 23,381 $ 15,527 $ 10,336 $ 13,932 $ 63,176<br />
January 1, 2010<br />
Current 7,333 – – 2,512 9,845<br />
Non-current 9,590 – 11,933 4,524 26,047<br />
$ 16,923 $ – $ 11,933 $ 7,036 $ 35,892<br />
December 31, 2010<br />
Current 3,211 – – 4,681 7,892<br />
Non-current 17,474 13,269 9,161 5,120 45,024<br />
$ 20,685 $ 13,269 $ 9,161 $ 9,801 $ 52,916<br />
December 31, 2011<br />
Current 6,001 – – 6,316 12,317<br />
Non-current 17,380 15,527 10,336 7,616 50,859<br />
$ 23,381 $ 15,527 $ 10,336 $ 13,932 $ 63,176<br />
(a) <strong>The</strong> deferred purchase consideration represents contingent consideration payable in the amount of $15,153 and $374 payable for non-competition agreements as<br />
at December 31, 2011.<br />
Decommissioning Liabilities<br />
<strong>The</strong> total undiscounted cash flows, which are estimated to be<br />
required to settle all decommissioning liabilities, are $26.7<br />
million, $25.4 million and $18.8 million as at December 31, 2011,<br />
December 31, 2010 and January 1, 2010, respectively, and<br />
the current pre-tax risk-free rate at which the estimated cash<br />
flows have been discounted range between 0.15% and 11.12%.<br />
Settlement for all decommissioning liabilities is expected to<br />
be funded by future cash flows from the Company’s operations.
ANNUAL REPORT 2011 <strong>ShawCor</strong> Ltd.<br />
89<br />
note 19<br />
Credit facilities and long-term debt<br />
a) Credit Facilities<br />
<strong>The</strong> following table sets forth the Company’s total credit<br />
facilities as at December 31:<br />
(in thousands of December 31 December 31 January 1<br />
Canadian dollars) 2011 2010 2010<br />
Bank<br />
indebtedness (a) $ 12,281 $ – $ –<br />
Standard letters<br />
of credit for<br />
performance,<br />
bid and surety<br />
bonds note 23 61,555 75,140 61,835<br />
Total utilized<br />
credit<br />
facilities 73,836 75,140 61,835<br />
Total available<br />
credit<br />
facilities (b) 236,168 240,048 251,856<br />
Unutilized credit<br />
facilities $ 162,332 $ 164,908 $ 190,021<br />
(a) Excludes the banking facilities of the Company’s 30% owned joint venture,<br />
Arabian Pipe Coating Company Ltd.<br />
(b) <strong>The</strong> Company guarantees the bank credit facilities of its subsidiaries.<br />
On June 22, 2011, the Company renewed its Unsecured<br />
Committed Bank Credit Facility for a period of four years, with<br />
terms and conditions similar to the prior agreement, except that<br />
the maximum borrowing limit was reduced by US$40.0 million<br />
from US$190.0 million to US$150.0 million, with an option to<br />
increase the credit limit to US$200.0 million with the consent<br />
of lenders.<br />
Debt Covenants<br />
<strong>The</strong> Company has undertaken to maintain certain covenants in<br />
respect of the Senior Notes and its Unsecured Committed Bank<br />
Credit Facility. Specifically, the Company is required to maintain<br />
a Fixed Charge Coverage Ratio (Earnings Before Interest, Taxes,<br />
Depreciation and Amortization (“EBITDA”) divided by interest<br />
expense) of more than 2.5 to 1 and a debt to total capitalization<br />
ratio of less than 0.40 to one. <strong>The</strong> Company is in compliance<br />
with these covenants as at December 31, 2011 and 2010.<br />
b) Long-term Debt<br />
<strong>The</strong> following table sets forth the Company’s long-term debt as at:<br />
(in thousands of December 31 December 31 January 1<br />
Canadian dollars) 2011 2010 2010<br />
Current portion<br />
of long-term<br />
debt $ – $ 25,005 $ 26,235<br />
Long-term debt – – 26,052<br />
$ – $ 25,005 $ 52,287<br />
Long-term debt (Senior Notes)<br />
On June 27, 2003, the Company entered into an agreement<br />
for the issue and sale, at par, on a private placement basis<br />
to institutional investors, of US$75.0 million of Senior Notes due<br />
June 30, 2011. Under the terms of the agreement, the Company<br />
was required to repay the Senior Notes in three equal<br />
installments of US$25.0 million on June 30, 2009, 2010 and<br />
2011. On June 30, 2009, the Company made the first repayments<br />
of US$25.0 million ($28.7 million at the then current exchange<br />
rate). On June 30, 2010, the Company made the second<br />
repayment of US$25.0 million ($26.0 million at the then current<br />
exchange rate). On June 30, 2011, the Company made the third<br />
and final repayment of US$25.0 million ($24.4 million at the<br />
then current exchange rate). Upon extinguishment of the<br />
Senior Notes, foreign exchange gains in the amount of $1.8<br />
million (2010 – $0.2 million) were recognized and included in<br />
the consolidated statement of income for the year ended<br />
December 31, 2011.<br />
note 20<br />
Employee Future benefits<br />
<strong>The</strong> Company provides employee future benefits to its<br />
employees under a number of defined benefit and defined<br />
contribution arrangements. <strong>The</strong> defined benefit pension plans<br />
are in Canada, the U.K. and Norway and include both flat-dollar<br />
plans for hourly employees and final earning plans for salaried<br />
employees. <strong>The</strong> Company also provides a post-retirement<br />
life insurance benefit to its Canadian retirees and a postemployment<br />
benefit to its hourly and salaried employees<br />
in Indonesia.<br />
<strong>The</strong> total cash payments made by the Company to fund defined<br />
benefit and defined contribution pension plans during 2011<br />
were $10.6 million (2010 – $9.9 million). <strong>The</strong> Company measures<br />
the fair value of assets and accrued benefit obligations as<br />
at December 31. Actuarial valuations for the Company‘s<br />
six ongoing registered defined benefit pension plans and SERP<br />
arrangement are generally required at least every three years.<br />
<strong>The</strong> most recent actuarial valuations of the plans were<br />
conducted as at December 31, 2009 (three plans),<br />
August 1, 2010 (one plan), December 31, 2010 (one plan)<br />
and January 1, 2011 (two plans).
90 <strong>ShawCor</strong> Ltd. notes to the consolidated financial statements<br />
<strong>The</strong> principal assumptions made by the actuaries for the<br />
actuarial valuation of the plans were:<br />
2011 2010<br />
Canada<br />
Defined benefit obligation<br />
Discount rate 4.60% 5.30%<br />
Salary increase 4.00% 4.00%<br />
Increases to pensions in pay n/a n/a<br />
Mortality UP94@2020 UP94@2020<br />
Benefit expense of year ended<br />
December 31<br />
Discount rate 5.30% 6.40%<br />
Expected rate of return on assets 6.50% 6.50%<br />
Salary increase 4.00% 4.00%<br />
Norway<br />
Defined benefit obligation<br />
Discount rate 2.60% 4.00%<br />
Salary increase 3.50% 4.00%<br />
Increases to pensions in pay 0.60% 1.90%<br />
Mortality K2005 K2005<br />
Benefit expense of year ended<br />
December 31<br />
Discount rate 4.00% 4.40%<br />
Expected rate of return on assets 5.40% 5.60%<br />
Salary increase 4.00% 4.25%<br />
United Kingdom<br />
Defined benefit obligation<br />
Discount rate 5.00% 5.70%<br />
Salary increase n/a n/a<br />
Increases to pensions in pay 2.20% 3.30%<br />
Mortality S1Pa S1PA<br />
(projected) (projected)<br />
Benefit expense of year ended<br />
December 31<br />
Discount rate 5.70% 5.70%<br />
Expected rate of return on assets 6.19% 6.39%<br />
Salary increase n/a n/a<br />
Indonesia<br />
Defined benefit obligation<br />
Discount rate 6.70% 7.97%<br />
Salary increase 10.00% 10.00%<br />
Inflation rate n/a n/a<br />
Mortality CSO80 CSO80<br />
Benefit expense of year ended<br />
December 31<br />
Discount rate 7.97% 11.00%<br />
Expected rate of return on assets n/a n/a<br />
Salary increase 10.00% 10.00%<br />
<strong>The</strong> overall expected long-term return on plans assets is<br />
management’s best estimate of long-term future investment<br />
returns, taking into account the long-term asset allocation<br />
targets for the plans as outlined in the current investment<br />
policy and the expected long-term return for each asset class.<br />
<strong>The</strong> amounts recognized in the consolidated balance sheet are<br />
as follows:<br />
(in thousands of December 31 December 31 January 1<br />
Canadian dollars) 2011 2010 2010<br />
Accrued<br />
employee<br />
future benefit<br />
asset<br />
Pension plans $ 2,876 $ 2,337 $ 1,472<br />
Post-employment<br />
benefit – – –<br />
Post-retirement<br />
life insurance – – –<br />
Accrued<br />
employee<br />
future benefit<br />
liability<br />
Pension plans (8,309) (7,544) (10,620)<br />
Post-employment<br />
benefit (1,757) (1,357) (1,072)<br />
Post-retirement<br />
life insurance (270) (260) (241)<br />
Net accrued<br />
future<br />
employee<br />
benefit<br />
liability $ (7,460) $ (6,824) $ (10,461)<br />
<strong>The</strong> following were the composition of plan assets at the<br />
balance sheet dates as a percentage of total plan assets<br />
for the registered Canadian employee future benefit plans:<br />
2011 2010<br />
Equities 59% 60%<br />
Fixed income 37% 36%<br />
Real estate 0% 0%<br />
Other 4% 4%<br />
100% 100%
ANNUAL REPORT 2011 <strong>ShawCor</strong> Ltd.<br />
91<br />
<strong>The</strong> following were the composition of plan assets at the balance<br />
sheet dates as a percentage of total invested plan assets for the<br />
SERP plan (a) :<br />
2011 2010<br />
Equities 96% 94%<br />
Fixed income 0% 0%<br />
Real estate 0% 0%<br />
Other 4% 6%<br />
100% 100%<br />
(a) <strong>The</strong> amounts in the above table exclude amounts sitting in the refundable tax<br />
account held by the CRA.<br />
<strong>The</strong> amounts recognized in the consolidated statement of<br />
income are as follows:<br />
(in thousands of Canadian dollars) 2011 2010<br />
Current service cost $ 3,289 $ 2,793<br />
Interest costs 4,475 4,564<br />
Expected return on plan assets (4,537) (4,067)<br />
Past service costs 100 –<br />
Actuarial gains and losses 1,637 35<br />
Currency (gains) losses 8 (130)<br />
Curtailment and settlement – (602)<br />
4,972 2,593<br />
Impact of IAS 19<br />
paragraph 58/IFRIC 14 1,056 (1,023)<br />
Defined benefit expense recognized 6,028 1,570<br />
Defined contribution<br />
expense recognized 5,247 4,690<br />
Total employee benefits expense (a) $ 11,275 $ 6,260<br />
(a) <strong>The</strong> total amount is included in the consolidated statement of income as<br />
SG&A. See note 7 for further information.<br />
Changes in the present value of the defined benefit obligation<br />
are as follows:<br />
(in thousands of Canadian dollars) 2011 2010<br />
Balance – Beginning of year $ 85,192 $ 76,218<br />
Employer portion of<br />
current service cost 3,289 2,793<br />
Actuarial losses (gains) and<br />
changes in assumptions 9,897 7,119<br />
Employee contributions 0 0<br />
Interest cost 4,475 4,564<br />
Foreign exchange differences 90 (802)<br />
Benefits paid (2,452) (4,066)<br />
Curtailment and settlement 0 (634)<br />
Past service cost 100 0<br />
Balance – End of year $ 100,591 $ 85,192<br />
Changes in the fair value of the plan assets are as follows:<br />
(in thousands of Canadian dollars) 2011 2010<br />
Balance – Beginning of year $ 74,107 $ 68,788<br />
Valuation effect (90) (54)<br />
Actuarial gains (losses) (3,357) 918<br />
Expected return on plan assets 4,537 4,067<br />
Employer contributions 5,392 5,207<br />
Employee contributions – –<br />
Benefits paid (2,452) (4,066)<br />
Curtailment and settlement – –<br />
Foreign exchange differences 140 (753)<br />
Balance – End of year $ 78,277 $ 74,107<br />
Amounts for the current and previous period are as follows:<br />
(in thousands of Canadian dollars) 2011 2010<br />
Present value of defined<br />
benefit obligation $ 100,591 $ 85,192<br />
Fair value of plan assets 78,277 74,107<br />
Deficit (surplus) of<br />
the funded plans 22,314 11,085<br />
Unrecognized past service costs – –<br />
Unrecognized actuarial<br />
losses (gains) 17,886 6,215<br />
Liability (asset) before the impact<br />
of IAS 19 paragraph 58/IFRIC 14 4,428 4,870<br />
Impact of IAS 19<br />
paragraph 58/IFRIC 14 3,032 1,954<br />
Liability (asset) in the statement<br />
of financial position $ 7,460 $ 6,824<br />
Percentage of plan assets 9.53% 9.21%<br />
Percentage of plan liabilities 7.42% 8.01%<br />
Actual Return on Plan Assets<br />
<strong>The</strong> actual return on plan assets for the years ended<br />
December 31, 2011 and 2010 amounted to $1.180 million<br />
and $4.985 million, respectively.
92 <strong>ShawCor</strong> Ltd. notes to the consolidated financial statements<br />
Contributions<br />
<strong>The</strong> Company expects to contribute $5.3 million to its defined<br />
benefit plans for the year ended December 31, 2012.<br />
IFRS IFRS IFRS<br />
(in thousands of December 31 December 31 January 1<br />
Canadian dollars) 2011 2010 2010<br />
Present value of<br />
defined benefit<br />
obligations $ 100,591 $ 85,192 $ 76,218<br />
Fair value of<br />
plan assets 78,277 74,107 68,788<br />
Deficit (surplus)<br />
in the plan $ 22,314 $ 11,085 $ 7,430<br />
Actuarial losses<br />
(gains) on<br />
plan liabilities<br />
in year 9,897 7,119 N/A<br />
Actuarial losses<br />
(gains) on plan<br />
assets in year 3,357 (918) N/A<br />
note 21<br />
<strong>Financial</strong> instruments<br />
<strong>The</strong> Company has classified its financial instruments as follows:<br />
(in thousands of December 31 December 31 January 1<br />
Canadian dollars) 2011 2010 2010<br />
Loans and<br />
receivables,<br />
measured at<br />
amortized cost<br />
Cash and cash<br />
equivalents $ 67,276 $ 155,998 $ 249,988<br />
Accounts<br />
receivable 279,324 243,955 191,821<br />
Income taxes<br />
receivable 15,981 13,823 14,055<br />
Long-term notes<br />
receivable 3,845 3,758 3,943<br />
Long-term loan<br />
to associate 10,824 – –<br />
Fair value<br />
through<br />
profit or loss,<br />
measured at<br />
fair value<br />
Derivative<br />
financial<br />
instruments –<br />
asset 270 1,130 1,821<br />
Derivative<br />
financial<br />
instruments –<br />
liability 2,918 1,334 510<br />
Loans and<br />
borrowings,<br />
measured at<br />
amortized cost<br />
Bank<br />
indebtedness 12,281 – –<br />
Loan payable 5,001 5,126 –<br />
Accounts payable<br />
and accrued<br />
liabilities 155,796 132,743 119,813<br />
Income taxes<br />
payable 35,334 44,968 42,971<br />
Deferred<br />
purchase<br />
consideration 15,529 13,269 –<br />
Other provisions 13,930 9,801 7,038<br />
Finance lease<br />
obligations 268 684 863<br />
Long-term debt $ – $ 25,005 $ 52,287
ANNUAL REPORT 2011 <strong>ShawCor</strong> Ltd.<br />
93<br />
Fair Value<br />
IFRS 7, <strong>Financial</strong> Instruments – Disclosure, provides a hierarchy of valuation techniques based on whether the inputs to those valuation<br />
techniques are observable or unobservable. Observable inputs are those which reflect market data obtained from independent<br />
sources, while unobservable inputs reflects the Company’s assumptions with respect to how market participants would price an<br />
asset or liability. <strong>The</strong>se two inputs used to measure fair value fall into the following three different levels of the fair value hierarchy:<br />
<strong>The</strong> following table presents, for each of the fair value hierarchy levels, the assets and liabilities that are measured at fair value<br />
on a recurring basis as at December 31, 2011 and does not include those instruments where the carrying amount is a reasonable<br />
approximation of the fair value:<br />
(in thousands of Canadian dollars) Fair Value Level 1 Level 2 Level 3<br />
Assets<br />
Derivative financial instruments – current $ 270 $ – $ 270 $ –<br />
$ 270 $ – $ 270 $ –<br />
Liabilities<br />
Derivative financial instruments – current $ 419 $ – $ 419 $ –<br />
Derivative financial instruments – long‐term 2,499 – – 2,499<br />
$ 2,918 $ – $ 419 $ 2,499<br />
<strong>The</strong> current derivative financial instruments relate to foreign<br />
exchange forward contracts entered into by the Company (as<br />
described below) and are valued by comparing the rates at the<br />
time the derivatives are acquired to the period-end rates quoted<br />
in the market. <strong>The</strong> long-term derivative financial instrument<br />
liability represents the net fair value of the financial instruments<br />
that were entered into by the Company in conjunction with its<br />
long-term investment in Fineglade, as described in note 14, and<br />
has been valued using a modified Black-Scholes model and<br />
unobservable input data. <strong>The</strong> fair values of the Company’s<br />
remaining financial instruments are not materially different<br />
from their carrying values.<br />
<strong>The</strong> following table presents the changes in the Level 3 fair value<br />
category for the year ended December 31, 2011:<br />
(in thousands of Canadian dollars)<br />
Fair Value<br />
Opening balance – January 1, 2010 $ –<br />
Additions 807<br />
Balance – December 31, 2010 807<br />
Losses recognized in the statement of income 1,692<br />
Closing balance – December 31, 2011 $ 2,499<br />
Foreign Exchange Forward Contracts<br />
and Other Hedging Arrangements<br />
<strong>The</strong> Company utilizes financial instruments to manage the risk<br />
associated with foreign exchange rates. <strong>The</strong> Company formally<br />
documents all relationships between hedging instruments and<br />
the hedge items, as well as its risk management objective and<br />
strategy for undertaking various hedge transactions.<br />
<strong>The</strong> following table sets out the notional amounts outstanding<br />
under foreign exchange contracts, the average contractual<br />
exchange rates and the settlement of these contracts as at<br />
December 31, 2011:<br />
(in thousands, except weighted average rate amounts)<br />
US dollars sold for Canadian dollars<br />
Less than one year<br />
US$18,000<br />
Weighted average rate 1.00<br />
Euros sold for US dollars<br />
Less than one year €5,609<br />
Weighted average rate 1.34<br />
As at December 31, 2011, the Company had notional amounts<br />
of $25.8 million of forward contracts outstanding (2010 –<br />
$41.9 million) with the fair value of the Company’s net benefit<br />
from all foreign exchange forward contracts totalling $1.5 million<br />
(2010 – $0.6 million, net obligation).
94 <strong>ShawCor</strong> Ltd. notes to the consolidated financial statements<br />
<strong>Financial</strong> Risk Management<br />
<strong>The</strong> Company’s operations expose it to a variety of financial risks<br />
including market risk (including foreign exchange and interest<br />
rate risk), credit risk and liquidity risk. <strong>The</strong> Company’s overall<br />
risk management program focuses on the unpredictability of<br />
financial markets and seeks to minimize potential adverse<br />
effects on the Company’s financial position and financial<br />
performance. Risk management is the responsibility of Company<br />
management. Material risks are monitored and are regularly<br />
reported to the Board of Directors.<br />
Foreign Exchange Risk<br />
<strong>The</strong> majority of the Company’s business is transacted outside<br />
of Canada through subsidiaries operating in several countries.<br />
<strong>The</strong> net investments in these subsidiaries as well as their<br />
revenue, operating expenses and non-operating expenses<br />
are based in foreign currencies. As a result, the Company’s<br />
consolidated revenue, expenses and financial position, may<br />
be impacted by fluctuations in foreign exchange rates as these<br />
foreign currency items are translated into Canadian dollars.<br />
As at December 31, 2011, fluctuations of +/– 5% in the Canadian<br />
dollar, relative to those foreign currencies, would impact the<br />
Company’s consolidated revenue, income from operations, and<br />
net income for the year ended by approximately $32.5 million,<br />
$6.5 million and $4.7 million, respectively, prior to hedging<br />
activities. In addition, such fluctuations would impact the<br />
Company’s consolidated total assets, consolidated total<br />
liabilities and consolidated total shareholders’ equity by<br />
$53.5 million, $34.5 million and $19.0 million, respectively.<br />
<strong>The</strong> objective of the Company’s foreign exchange risk<br />
management activities is to minimize transaction exposures<br />
associated with the Company’s foreign currency-denominated<br />
cash streams and the resulting variability of the Company’s<br />
earnings. <strong>The</strong> Company utilizes foreign exchange forward<br />
contracts to manage this foreign exchange risk. <strong>The</strong> Company<br />
does not enter into foreign exchange contracts for speculative<br />
purposes. With the exception of the Company’s US dollar based<br />
operations, the Company does not hedge translation exposures.<br />
Interest Rate Risk<br />
<strong>The</strong> following table summarizes the Company’s exposure to interest rate risk as at December 31, 2011:<br />
Fixed Interest<br />
Rate Maturing in<br />
(in thousands of Canadian dollars) Floating Rate One Year or Less Total<br />
<strong>Financial</strong> assets<br />
Cash equivalents $ – $ 5,978 $ 5,978<br />
Long-term notes receivable 3,845 – 3,845<br />
Long-term loan to related party 8,777 2,047 10,824<br />
$ 12,622 $ 8,025 $ 20,647<br />
<strong>Financial</strong> liabilities<br />
Bank indebtedness $ 12,281 $ – $ 12,281<br />
Loan payable 5,001 – 5,001<br />
$ 17,282 $ – $ 17,282<br />
<strong>The</strong> Company’s interest rate risk arises primarily from its floating rate bank indebtedness and long-term notes receivable and is not<br />
currently considered to be material.<br />
Credit Risk<br />
Credit risk arises from cash and cash equivalents held with<br />
banks, forward foreign exchange contracts, as well as credit<br />
exposure of customers, including outstanding accounts<br />
receivable. <strong>The</strong> maximum credit risk is equal to the carrying<br />
value of the financial instruments.<br />
<strong>The</strong> objective of managing counter-party credit risk is to prevent<br />
losses in financial assets. <strong>The</strong> Company is subject to considerable<br />
concentration of credit risk since the majority of its customers<br />
operate within the global energy industry and are therefore<br />
affected to a large extent by the same macroeconomic<br />
conditions and risks. <strong>The</strong> Company manages this credit risk<br />
by assessing the credit quality of all counter parties, taking<br />
into account their financial position, past experience and other<br />
factors. Management also establishes and regularly reviews<br />
credit limits of counter parties and monitors utilization of those<br />
credit limits on an ongoing basis.<br />
As at December 31, 2011 and 2010, <strong>ShawCor</strong> had<br />
no customers who generated revenue greater than 10%<br />
of total consolidated revenue.
ANNUAL REPORT 2011 <strong>ShawCor</strong> Ltd.<br />
95<br />
<strong>The</strong> carrying value of accounts receivable are reduced through<br />
the use of an allowance for doubtful accounts and the amount<br />
of the loss is recognized in the consolidated statement of<br />
income with a charge to selling, general and administrative<br />
expenses. When a receivable balance is considered to be<br />
uncollectible, it is written off against the allowance for doubtful<br />
accounts. Subsequent recoveries of amounts previously written<br />
off are credited against selling, general and administrative<br />
expenses. As at December 31, 2011, $24.0 million, or 9.0%<br />
of trade accounts receivable, were more than 90 days<br />
overdue, which is consistent with prior period aging analysis.<br />
<strong>The</strong> Company expects to receive full payment on accounts<br />
receivables that are neither past due nor impaired.<br />
<strong>The</strong> following is an analysis of the change in the allowance<br />
for doubtful accounts for the year ended December 31, 2011<br />
and 2010:<br />
December 31 December 31<br />
(in thousands of Canadian dollars) 2011 2010<br />
Balance – Beginning of year $ 3,775 $ 5,353<br />
Bad debt expense 9,160 697<br />
Recovery of previously<br />
written-off bad debts 126 (384)<br />
Write-offs of bad debts (328) (1,469)<br />
Impact of change in<br />
foreign exchange rates 1,234 (422)<br />
Balance – End of year $ 13,967 $ 3,775<br />
Liquidity Risk<br />
<strong>The</strong> Company’s objective in managing liquidity risk is to maintain sufficient, readily available cash reserves in order to meet its<br />
liquidity requirements at any point in time. <strong>The</strong> Company achieves this by maintaining sufficient cash and cash equivalents and<br />
through the availability of funding from committed credit facilities. As at December 31, 2011, the Company has cash and cash<br />
equivalents totalling $67.3 million (2010 – $156.0 million) and has unutilized lines of credit available to use of $162.3 million<br />
(2010 – $164.9 million).<br />
<strong>The</strong> following are the contractual maturities of the Company’s financial liabilities as at December 31, 2011:<br />
(in thousands of Canadian dollars) Less than 1 year 1 – 3 years 3 – 5 years <strong>The</strong>reafter Total<br />
Bank indebtedness $ 12,281 $ – $ – $ – $ 12,281<br />
Loan payable 5,001 – – – 5,001<br />
Accounts payable and accrued liabilities 155,797 – – – 155,797<br />
Decommissioning liabilities 6,001 7,245 2,241 11,205 26,692<br />
Deferred purchase consideration – 16,721 – – 16,721<br />
Other provisions 6,316 7,616 – – 13,932<br />
Income taxes payable 35,334 – – – 35,334<br />
Derivative financial instruments 419 2,499 – – 2,918<br />
$ 221,149 $ 34,081 $ 2,241 $ 11,205 $ 268,676<br />
note 22<br />
Capital management<br />
<strong>The</strong> Company defines capital that it manages as the aggregate<br />
of its shareholders’ equity and interest bearing debt. <strong>The</strong><br />
Company’s objectives when managing capital are to ensure that<br />
the Company will continue to operate as a going concern and<br />
continue to provide products and services to its customers,<br />
preserve its ability to finance expansion opportunities as they<br />
arise, and provide returns to its shareholders.<br />
<strong>The</strong> following table sets forth the Company’s total managed<br />
capital as at:<br />
(in thousands of December 31 December 31 January 1<br />
Canadian dollars) 2011 2010 2010<br />
Bank<br />
indebtedness $ 12,281 $ – $ –<br />
Loan payable 5,001 5,126 –<br />
Current portion of<br />
long-term debt – 25,005 26,235<br />
Long-term debt – – 26,052<br />
Current<br />
obligations<br />
under finance<br />
lease 165 345 371<br />
Obligations under<br />
finance lease 103 339 492<br />
Shareholders’<br />
equity 864,061 832,243 791,015<br />
$ 881,611 $ 863,058 $ 844,165
96 <strong>ShawCor</strong> Ltd. notes to the consolidated financial statements<br />
<strong>The</strong> Company manages its capital structure and makes<br />
adjustments to it in light of changes in economic conditions,<br />
the risk characteristics of the underlying assets and business<br />
investment opportunities. To maintain or adjust the capital<br />
structure, the Company may attempt to issue or re-acquire<br />
shares, acquire or dispose of assets, or adjust the amount of<br />
cash, cash equivalents, bank indebtedness or long-term debt<br />
balances. <strong>The</strong> Company’s capital is not subject to any capital<br />
requirements imposed by any regulators; however, it is limited<br />
by the terms of its credit facility and long-term debt agreements.<br />
Specifically, the Company has undertaken to maintain certain<br />
covenants in respect of its Unsecured Committed Bank Credit<br />
Facility. <strong>The</strong> Company is in compliance with these covenants<br />
as at December 31, 2011.<br />
note 23<br />
Commitments and contingencies<br />
Operating Leases<br />
<strong>The</strong> Company has entered into various commercial leases<br />
on certain motor vehicles, items of machinery and office<br />
and manufacturing sites. <strong>The</strong>se leases have a life of one<br />
to sixteen years with no renewal options.<br />
<strong>The</strong> following table presents the future minimum rental payments<br />
payable under the operating leases as at December 31, 2011:<br />
(in thousands of Canadian dollars) 2011<br />
Within one year $ 9,755<br />
After one year but not more than five years 20,062<br />
More than five years 11,921<br />
$ 41,738<br />
<strong>The</strong> lease expenditure charged to the consolidated statement<br />
of income during the year is $14.0 million.<br />
Finance Leases<br />
<strong>The</strong> Company has finance leases and purchase commitments<br />
in place for various items of plant and machinery. <strong>The</strong>se leases<br />
have terms of renewal but no purchase options. Renewals are<br />
at the option of the specific entity that holds the lease. <strong>The</strong><br />
following table presents the future minimum lease payments<br />
under finance leases with the present value of the net minimum<br />
lease payments:<br />
2011<br />
Minimum Present Value<br />
(in thousands of Canadian dollars) Payments of Payments<br />
Within one year $ 191 $ 165<br />
After one year but not<br />
more than five years 127 103<br />
After more than five years – –<br />
Total minimum lease payments 318 268<br />
Less: Amounts representing<br />
interest charges (50) –<br />
Present value of minimum<br />
lease payments $ 268 $ 268<br />
Legal Claims<br />
In the ordinary course of business activities, the Company may<br />
be contingently liable for litigation and claims with customers,<br />
suppliers and other third parties. Management believes that<br />
adequate provisions have been recorded in the accounts where<br />
required. Although it is not possible to estimate the extent of<br />
potential costs and losses, if any, management believes, but<br />
can provide no assurance, that the ultimate resolution of such<br />
contingencies would not have a material adverse effect on the<br />
consolidated financial position of the Company.<br />
Performance, Bid and Surety Bonds<br />
<strong>The</strong> Company provides standby letters of credit for performance,<br />
bid and surety bonds through financial intermediaries to various<br />
customers in support of project contracts for the successful<br />
execution of these contracts. If the Company fails to perform<br />
under the terms of the contract, the customer has the ability<br />
to draw upon all or a portion of the bond as compensation for<br />
the Company’s failure to perform. <strong>The</strong> contracts, which these<br />
performance bonds support, generally have a term of one to<br />
three years, but could extend up to four years. Bid bonds<br />
typically have a term of less than one year and are renewed,<br />
if required, over the term of the applicable contract. Historically,<br />
the Company has not made and does not anticipate that it will<br />
be required to make material payments under these types<br />
of Bonds.<br />
<strong>The</strong> Company’s utilizes its credit facilities to support the<br />
Company’s Bonds. <strong>The</strong> Company had utilized credit facilities<br />
of $73.8 million as at December 31, 2011 (December 31, 2010 –<br />
$75.1 million; January 1, 2010 – $61.8 million) for support<br />
of its bonds.
ANNUAL REPORT 2011 <strong>ShawCor</strong> Ltd.<br />
97<br />
note 24<br />
Share capital<br />
<strong>The</strong> following table sets forth the Company’s shares outstanding<br />
as at December 31:<br />
2011<br />
class a class b total<br />
Number of shares<br />
Balance outstanding –<br />
Beginning of year 57,578,299 13,058,073 70,636,372<br />
Issued on exercise<br />
of stock options 622,380 – 622,380<br />
Issued on exercise<br />
of RSUs 255 255<br />
Conversions of<br />
Class B into<br />
Class A 273,738 (273,738) –<br />
Purchase –<br />
normal course<br />
issuer bid (642,100) – (642,100)<br />
Balance outstanding –<br />
End of year 57,832,572 12,784,335 70,616,907<br />
(in thousands of<br />
Canadian dollars)<br />
Stated value<br />
Balance outstanding –<br />
Beginning of year $ 205,772 $ 1,003 $ 206,775<br />
Issued – stock<br />
options 9,878 – 9,878<br />
Compensation<br />
cost on<br />
exercised<br />
options 4,122 – 4,122<br />
Compensation<br />
cost on<br />
exercised RSUs 7 – 7<br />
Conversions of<br />
Class B into<br />
Class A 20 (20) –<br />
Purchase –<br />
normal course<br />
issuer (2,401) – (2,401)<br />
Balance outstanding –<br />
End of year $ 217,398 $ 983 $ 218,381<br />
2010<br />
Class A Class B Total<br />
Number of shares<br />
Balance outstanding –<br />
Beginning of year 57,458,183 13,059,983 70,518,166<br />
Issued on exercise<br />
of stock options 118,206 – 118,206<br />
Conversions of<br />
Class B into<br />
Class A 1,910 (1,910) –<br />
Balance outstanding –<br />
End of year 57,578,299 13,058,073 70,636,372<br />
(in thousands of<br />
Canadian dollars)<br />
Stated value<br />
Balance outstanding –<br />
Beginning of year $ 203,148 $ 1,003 $ 204,151<br />
Issued on exercise<br />
of stock options 2,013 – 2,013<br />
Compensation cost<br />
on exercised<br />
options 611 – 611<br />
Conversions of<br />
Class B into<br />
Class A – – –<br />
Balance outstanding –<br />
End of year $ 205,772 $ 1,003 $ 206,775<br />
All shares have been issued and fully paid and have no par value.<br />
<strong>The</strong>re are an unlimited number of Class A subordinate voting<br />
shares (Class A shares) and Class B multiple voting shares<br />
(Class B shares) authorized. Holders of Class A shares are<br />
entitled to one vote per share and receive a non-cumulative<br />
dividend premium of 10% over the dividends paid to holders<br />
of Class B shares. Holders of Class B shares are entitled<br />
to ten votes per share and are convertible at any time into<br />
Class A shares on a one-for-one basis.<br />
Under the terms of the Normal Course Issuer Bid (“NCIB”),<br />
the Company was entitled to repurchase up to 3,000,000 Class<br />
A shares and up to 100,000 Class B shares between<br />
December 1, 2009 and November 30, 2010. <strong>The</strong> repurchase of<br />
shares is made in the open market at prevailing market prices;<br />
however, during the year ended December 31, 2010,<br />
the Company did not repurchase and cancel any Class A or<br />
Class B shares under the NCIB.<br />
<strong>The</strong> NCIB was renewed on November 30, 2010, entitling<br />
the Company to repurchase up to 2,000,000 Class A shares<br />
and up to 100,000 Class B shares between December 1, 2010<br />
and November 30, 2011. <strong>The</strong> NCIB was renewed on<br />
November 30, 2011, entitling the Company to repurchase
98 <strong>ShawCor</strong> Ltd. notes to the consolidated financial statements<br />
up to 3,000,000 Class A shares and up to 100,000 Class B<br />
shares between December 1, 2011 and November 30, 2012.<br />
During the year ended December 31, 2011, 642,100 Class A<br />
shares were repurchased and cancelled for total consideration<br />
of $16.5 million (refer to Statement of Shareholders’ Equity<br />
for details).<br />
In 2011, dividends declared and paid during the year were $0.315<br />
per Class A share and $0.286 per Class B share (2010 – $0.295<br />
per Class A share and $0.268 per Class B share).<br />
note 25<br />
Share-based compensation and<br />
other incentive-based compensation<br />
As at December 31, 2011, the Company had the following<br />
two stock option plans, both of which were initiated in 2001:<br />
i) Under the Company’s 2001 employee stock option plan<br />
(the “2001 Employee Plan”), which is a traditional stock<br />
option plan, the options granted have a term of ten years<br />
from the date of the grant. Exercises are permitted on the<br />
basis of 20% of the optioned shares per year over five years,<br />
on a cumulative basis, commencing one year following the<br />
date of the grant. <strong>The</strong> grant price equals the closing sale price<br />
of the Class A shares on the day prior to the grant.<br />
On March 3, 2010, the Board of Directors (“Board”) approved<br />
the amended 2001 Employee Plan (the “Amended 2001<br />
Employee Plan”). All stock options granted in 2010 under<br />
the Amended 2001 Employee Plan have a tandem share<br />
appreciation right (“SAR”) attached, which allows the option<br />
holder to exercise either the option and receive a share,<br />
or exercise the SAR and receive a cash payment that is<br />
equivalent to the difference between the grant price and fair<br />
market value. All stock options granted under the Amended<br />
2001 Employee Plan have the same characteristics as stock<br />
options that were granted under the original 2001 Employee<br />
Plan, with respect to vesting requirements, term, termination<br />
and other provisions.<br />
On March 31, 2011, the Board modified the Amended 2001<br />
Employee Plan (the “Restated 2001 Employee Plan”) to<br />
facilitate the cash free exercise of stock options and SARs<br />
by the holders of such instruments.<br />
ii) Under the Company’s 2001 director plan (the “2001 Director<br />
Plan”), options are granted on an annual basis and the<br />
maximum number of Class A shares issued in any single<br />
grant shall be equal to the number of Class A shares and<br />
Class B shares of the Company owned by the individual<br />
director, at the date of the option grant, subject to a<br />
maximum of 8,000 Class A shares for each of the Chairman<br />
and Vice Chair, and 4,000 Class A shares for each of the<br />
other eligible directors. <strong>The</strong> options vest immediately and<br />
have a legal life of five years. <strong>The</strong> grant price equals the<br />
closing sale price of the Class A shares on the day prior<br />
to the grant. No options have been granted under the 2001<br />
Director Plan since 2006.<br />
A summary of the status of the Company’s stock option plans and changes during the year presented below:<br />
Stock Options without Tandem Share Appreciation Rights<br />
2011 2010<br />
Weighted Average<br />
Weighted Average<br />
Total Shares Exercise Price Total Shares Exercise Price<br />
Balance outstanding – Beginning of year 2,702,160 $ 18.93 2,826,366 $ 18.86<br />
Granted 102,260 37.32 – –<br />
Exercised (622,380) 15.87 (118,206) 17.02<br />
Forfeited (17,440) 20.06 (6,000) 21.57<br />
Balance outstanding – End of year 2,164,600 20.67 2,702,160 18.93<br />
Options exercisable 1,548,020 $ 19.35 1,874,256 $ $17.45
ANNUAL REPORT 2011 <strong>ShawCor</strong> Ltd.<br />
99<br />
options Outstanding<br />
2011<br />
options Exercisable<br />
W weighted Average<br />
R remaining<br />
Range of Outstanding as at Contractual Weighted Average Exercisable as at Weighted Average<br />
exercise price December 31, 2011 Life (years) Exercise Price December 31, 2011 Exercise Price<br />
$10.00 to $15.00 247,200 1.68 $ 12.06 247,200 $ 12.06<br />
$15.01 to $20.00 1,065,380 4.61 16.32 781,580 16.58<br />
$20.01 to $25.00 44,000 4.55 21.00 38,000 20.85<br />
$25.01 to $30.00 675,760 5.54 27.65 463,240 27.31<br />
$30.01 to $35.00 30,000 6.00 31.77 18,000 31.77<br />
$35.01 to $40.00 102,260 9.00 37.32 – –<br />
2,164,600 4.79 $ 20.67 1,548,020 $ 19.35<br />
Options Outstanding<br />
2010<br />
Options Exercisable<br />
Weighted Average<br />
Remaining<br />
Range of Outstanding as at Contractual Weighted Average Exercisable as at Weighted Average<br />
exercise price December 31, 2010 Life (years) Exercise Price December 31, 2010 Exercise Price<br />
$10.00 to $15.00 454,800 1.86 $ 12.60 454,800 $ 12.60<br />
$15.01 to $20.00 1,473,120 4.63 16.42 1,033,592 16.70<br />
$20.01 to $25.00 46,000 5.66 21.04 30,800 20.87<br />
$25.01 to $30.00 698,240 6.53 27.67 343,064 27.18<br />
$30.01 to $35.00 30,000 7.01 31.77 12,000 31.77<br />
2,702,160 $ 18.93 1,874,256 $ 17.45<br />
<strong>The</strong> Board of Directors approved the granting of 102,260<br />
stock options during the year ended December 31, 2011 under<br />
the 2001 Employee Plan (the “Plan”). <strong>The</strong> total weighted<br />
average fair value of the stock options granted during the<br />
year ended December 31, 2011 was $1.3 million (2010 – nil),<br />
calculated using the Black-Scholes pricing model with the<br />
following assumptions:<br />
2011<br />
Weighted average share price $ 36.31<br />
Exercise price $ 37.32<br />
Expected life of options 7.25<br />
Expected stock price volatility 35%<br />
Expected dividend yield 0.8%<br />
Risk-free interest rate 3.2%<br />
<strong>The</strong> volatility measured at the standard deviation of continuously<br />
compounded share returns is based on statistical analysis<br />
of daily share prices over the last 9.25 years.<br />
<strong>The</strong> fair value of options granted under the Plan will be<br />
amortized to compensation expense over the five-year vesting<br />
period of options. <strong>The</strong> compensation cost from the continuing<br />
amortization of granted stock options for the year ended<br />
December 31, 2011, included in SG&A expenses, was<br />
$1.7 million (2010 – $1.1 million).
100 <strong>ShawCor</strong> Ltd. notes to the consolidated financial statements<br />
Stock Options with Tandem Share Appreciation Rights<br />
2011 2010<br />
Weighted Average<br />
Weighted Average<br />
Total Shares Fair Value (a) Total Shares Fair Value<br />
Balance outstanding – Beginning of year 118,500 $ 12.94 – $ –<br />
Granted 35,800 12.89 118,500 12.94<br />
Exercised – – – –<br />
Forfeited – – – –<br />
Expired – – – –<br />
Balance outstanding – End of year 154,300 $ 12.93 118,500 $ 12.94<br />
Options exercisable – – – –<br />
(a) <strong>The</strong> weighted average fair value refers to the fair value of the underlying shares of the Company on the grant date of the SARs.<br />
<strong>The</strong> mark-to-market liability for the stock options with SARs<br />
as at December 31, 2011, is $0.6 million (2010 – $0.2 million),<br />
all of which is included in accounts payable and accrued<br />
liabilities on the Consolidated Balance Sheets.<br />
On March 3, 2010, the Board approved a new long-term<br />
incentive program (LTIP) for executives and key employees and<br />
a deferred share unit plan (DSU) for directors of the Company.<br />
Additional details with respect to the LTIP and DSU plan<br />
are as follows:<br />
LTIP<br />
<strong>The</strong> LTIP includes the two existing stock option plans discussed<br />
above and two new plans, the value growth plan (“VGP”) and<br />
the employee share unit plan (ESUP).<br />
VGP<br />
<strong>The</strong> VGP is a cash-based awards plan, which rewards executives<br />
and key employees for improving operating income and<br />
revenue over a three year performance period. Units granted<br />
to participants vest on the third year of the performance period<br />
for which they were granted. <strong>The</strong> value of units is determined<br />
based on the growth rate in operating income and revenue on<br />
a cumulative basis for the three consecutive years that comprise<br />
the performance period and is measured against the baseline<br />
period. Compensation cost is recognized on a straight-line basis<br />
over the vesting period. All units granted under the VGP will<br />
be classified as liability instruments in accordance with IFRS<br />
as their terms require that they be settled in cash.<br />
<strong>The</strong> liability as at December 31, 2011 is $2.6 million<br />
(2010 – $1.7 million).<br />
ESUP<br />
<strong>The</strong> ESUP authorizes the Board to grant awards of restricted<br />
units (“RSUs”) to employees of the Company as a form of<br />
incentive compensation. All RSUs are to be settled with Class A<br />
shares and are valued on the basis of the underlying weighted<br />
average trading price of the Class A shares over the five trading<br />
days preceding the grant date. <strong>The</strong> valuation is not subsequently<br />
adjusted for changes in the market price of the Class A shares<br />
prior to the settlement of the award. Each RSU granted under<br />
the ESUP represents one Class A share. <strong>The</strong> ESUP provides that<br />
the maximum number of Class A shares that are reserved for<br />
issuance from time to time shall be fixed at 1,000,000 Class A<br />
shares. <strong>The</strong> RSUs vest in two tranches over a period of one to<br />
five years and four to seven years, respectively, and become<br />
payable once vesting is completed. Compensation cost is<br />
recognized over the vesting period in accordance with IFRS. All<br />
RSUs granted are classified as equity instruments in accordance<br />
with IFRS as their terms require that they be settled in shares.
ANNUAL REPORT 2011 <strong>ShawCor</strong> Ltd.<br />
101<br />
<strong>The</strong> following table sets forth the Company’s RSU reconciliation for the years ended December 31:<br />
2011 2010<br />
Weighted Average<br />
Weighted Average<br />
Grant Date<br />
Grant Date<br />
Total Shares Fair Value (a) Total Shares Fair Value (a)<br />
Balance outstanding – Beginning of year (b) 53,563 $ 26.51 – $ –<br />
Granted 40,772 35.30 53,563 26.51<br />
Exercised (255) 27.69 – –<br />
Forfeited (791) 27.69 – –<br />
Expired – – – –<br />
Balance outstanding – End of year 93,289 $ 30.34 53,563 $ 26.51<br />
RSUs exercisable 6,057 $ 26.72 – $ –<br />
(a) RSU awards do not have an exercise price; as a result grant date weighted average fair value has been calculated.<br />
(b) <strong>The</strong>re were no RSUs issued or granted prior to January 1, 2010.<br />
DSU<br />
Under the Company’s DSU plan, all directors (other than the<br />
president and chief executive officer) of the Company can elect<br />
to receive all or a portion of their compensation for services<br />
rendered as a director of the Company, in share units or a<br />
combination of share units and cash. <strong>The</strong> number of DSUs<br />
received is equal to the amount to be paid in DSUs divided by<br />
the weighted-average trading price of the Class A shares over<br />
the five days immediately preceding the date of the grant. DSUs<br />
are to be settled at the time that the director ceases to be a<br />
member of the Board and each DSU entitles the holder to<br />
receive one Class A share or the cash equivalent. DSUs vest<br />
immediately on the date of the grant. <strong>The</strong> value of a DSU and<br />
the related compensation expense is determined and recorded<br />
based on the current market price of the underlying Class A<br />
shares on the date of the grant. Common shares are purchased<br />
on the open market to settle outstanding share units.<br />
All DSUs granted will be classified as liability instruments on the<br />
date of the grant in accordance with IFRS as the unit holder has<br />
the option to settle in cash or shares.<br />
<strong>The</strong> following table sets forth the Company’s DSU reconciliation for the years ended December 31:<br />
2011 2010<br />
Weighted Average<br />
Weighted Average<br />
Grant Date<br />
Grant Date<br />
Total Shares Fair Value (a) Total Shares Fair Value (a)<br />
Balance outstanding – Beginning of year (b) 30,260 $ 29.53 – $ –<br />
Granted 36,910 28.26 30,260 29.53<br />
Exercised (6,246) 32.55 – –<br />
Expired – – – –<br />
Balance outstanding – End of year 60,924 $ 28.45 30,260 $ 29.53<br />
DSUs exercisable (c) – – – –<br />
(a) DSU awards do not have an exercise price; as a result grant date weighted average fair value has been calculated.<br />
(b) <strong>The</strong>re were no DSUs issued or granted prior to January 1, 2010.<br />
(c) DSU awards cannot be exercised while the director is still a member of the board of directors.<br />
<strong>The</strong> mark-to-market liability for the DSUs as at December 31, 2011<br />
is $1.8 million (2010 – $1.0 million), all of which is included<br />
in accounts payable and accrued liabilities on the consolidated<br />
balance sheet.
102 <strong>ShawCor</strong> Ltd. notes to the consolidated financial statements<br />
Incentive-based Compensation<br />
<strong>The</strong> following table sets forth the incentive-based compensation<br />
expense for the years ended December 31:<br />
(in thousands of Canadian dollars) 2011 2010<br />
Stock option expense $ 1,675 $ 1,096<br />
VGP expense 975 1,665<br />
DSU expense 875 1,030<br />
RSU expense 701 372<br />
SAR expense 275 324<br />
Total incentive-based<br />
compensation expense $ 4,501 $ 4,487<br />
note 26<br />
Key management compensation<br />
Key management includes directors (executive and nonexecutive)<br />
and corporate officers. <strong>The</strong> compensation paid or<br />
payable to key management for employee and director services<br />
is shown below for the year ended December 31:<br />
(in thousands of Canadian dollars) 2011 2010<br />
Salaries and other short-term<br />
employee benefits $ 3,834 $ 2,975<br />
Post-employment benefits 490 396<br />
Share-based and other long-term<br />
incentive payments 1,291 1,110<br />
Director fees and<br />
other compensation 1,632 2,165<br />
$ 7,247 $ 6,646<br />
note 27<br />
Interest in joint ventures<br />
<strong>The</strong> following table presents the joint venture interests<br />
of the Company as at December 31, 2011, which have been<br />
consolidated proportionately:<br />
Country of<br />
Proportion of<br />
incorporation Activity interest held<br />
Hal Shaw Inc. USA Pipe coating 50%<br />
Arabian Pipecoating<br />
Company Ltd. Saudi Arabia Pipe coating 30%<br />
Shaw & Shaw Ltd. Canada Pipe coating 83%<br />
Helicone<br />
Holdings Limited Russia Pipe coating 25%<br />
TTB Ltd. Brazil Pipe coating (a)<br />
BSSI Brazil Pipe coating (a)<br />
(a) On October 5, 2010, the Company completed the acquisition of the<br />
remaining 50% interest in TTB Ltd. and BSSI that they did not previously<br />
own; hence, TTB Ltd. and BSSI were not considered to be joint ventures<br />
subsequent to October 4, 2010. Prior to this date, the Company held 50%<br />
of the interest in each of TTB Ltd. and BSSI.<br />
<strong>The</strong> following table presents the Company’s share of the assets,<br />
liabilities, income and expenses of the jointly controlled entities<br />
described above for the years ended and as at December 31:<br />
(in thousands of Canadian dollars) 2011 2010<br />
Revenue $ 27,790 $ 40,356<br />
Operating expenses 28,420 39,200<br />
Income (loss) before income taxes (630) 1,156<br />
Income taxes (41) 289<br />
Net Income (loss) $ (589) $ 867<br />
Cash provided by (used in)<br />
Operating activities $ 569 $ (2,312)<br />
Investing activities $ (1,331) $ (1,250)<br />
Financing activities $ (124) $ 3,184<br />
Current assets $ 21,981 $ 23,289<br />
Non-current assets 5,687 6,557<br />
Total assets $ 27,668 $ 29,846<br />
Current liabilities $ 11,089 $ 13,368<br />
Non-current liabilities 769 689<br />
Total liabilities $ 11,858 $ 14,057<br />
Net assets $ 15,810 $ 15,789
ANNUAL REPORT 2011 <strong>ShawCor</strong> Ltd.<br />
103<br />
<strong>The</strong> Company’s Russian joint venture has a loan from OOO<br />
ArkhTekhnoProm in the amount of 600 million Russian roubles<br />
($21.3 million at the then current exchange rate) payable on<br />
demand. <strong>The</strong> Company’s portion of this loan that has been<br />
proportionately consolidated and included on the consolidated<br />
balance sheet as at December 31, 2011 in the amount of<br />
$5.0 million or 156 million Russian roubles at the current<br />
exchange rate (December 31, 2010 – $5.1 million or 156 million<br />
Russian roubles at the then current exchange rate). Interest<br />
is calculated on this loan at 9.625% per annum and is to be paid<br />
over the period of actual use. In the event that the Company’s<br />
Russian joint venture fails to repay the outstanding loan within<br />
the time specified by the loan agreement, a penalty in the<br />
amount of 24% per annum will be assessed on the outstanding<br />
loan amount on a daily basis.<br />
note 28<br />
Earnings per share (“EPS”)<br />
<strong>The</strong> following table details the weighted-average number of<br />
shares outstanding for the purposes of calculating basic and<br />
diluted EPS for the following periods:<br />
(in thousands of Canadian dollars<br />
except share and per share amounts) 2011 2010<br />
Income used to calculate EPS<br />
Net income for the year $ 56,086 $ 95,072<br />
Average number of shares<br />
outstanding during the<br />
year – basic<br />
Class A 57,941 57,508<br />
Class B 12,784 13,058<br />
70,725 70,566<br />
Dilutive effect of stock options<br />
Class A 811 879<br />
Class B – –<br />
811 879<br />
Average number of shares<br />
outstanding during the<br />
year – diluted<br />
Class A 58,752 58,386<br />
Class B 12,784 13,058<br />
71,536 71,444<br />
Basic EPS $ 0.79 $ 1.35<br />
Diluted EPS $ 0.78 $ 1.33<br />
note 29<br />
Income taxes<br />
<strong>The</strong> following table sets forth the Company’s income tax<br />
expense for the years ended December 31:<br />
(in thousands of Canadian dollars) 2011 2010<br />
Current income tax<br />
Based on taxable income<br />
of current year $ 37,458 $ 19,052<br />
Adjustment to prior year provision (9,860) 6,693<br />
Total current income tax expense 27,598 25,745<br />
Deferred income tax<br />
Deferred income tax<br />
(benefit) expense (14,478) 7,451<br />
Total deferred income tax<br />
(benefit) expense (14,478) 7,451<br />
Total income tax expense $ 13,120 $ 33,196<br />
Income taxes on items recognized in other comprehensive<br />
income were as follow:<br />
(in thousands of Canadian dollars) 2011 2010<br />
Deferred income tax related<br />
to items booked directly<br />
to equity during the year:<br />
Gain on hedges of unrealized<br />
foreign currency translation $ 103 $ –<br />
Gain (loss) on hedges of<br />
unrealized foreign currency<br />
translation transferred to<br />
net income during period (311) –<br />
Income tax benefit charged<br />
to other comprehensive income $ (208) $ –<br />
<strong>The</strong> following table sets forth a reconciliation of the Company’s<br />
effective income tax rate for the years ended December 31:<br />
2011 2010<br />
Expected income tax expense<br />
based on statutory rate 27.0% 30.5%<br />
Tax rate differential on earnings<br />
of foreign subsidiaries (2.1)% (4.7)%<br />
Benefit of previously unrecognized<br />
tax losses (1.6)% (0.5)%<br />
Unrecognized tax losses<br />
of foreign subsidiaries 8.9% 1.6%<br />
Unrealized gain on share acquisition 0.0% (4.2)%<br />
Adjustment to prior year provision (14.1)% 5.2%<br />
Other 0.7% (2.0)%<br />
Effective income tax rate 18.8% 25.9%<br />
<strong>The</strong> expected income tax rate is computed using the average<br />
Canadian tax rate based on provincial allocations. <strong>The</strong> decrease<br />
in the statutory income tax rate is due to the enacted reduction<br />
in the Federal and Ontario corporation tax rates.
104 <strong>ShawCor</strong> Ltd. notes to the consolidated financial statements<br />
Recognized Deferred Tax Assets and Liabilities<br />
Deferred tax assets and liabilities are offset when there is<br />
a legally enforceable right to offset deferred tax assets against<br />
deferred tax liabilities and they relate to the same tax authority<br />
on the same taxable entity.<br />
Consolidated Balance Sheets<br />
(in thousands of December 31 December 31 January 1<br />
Canadian dollars) 2011 2010 2010<br />
Deferred<br />
tax assets<br />
Amortizable<br />
property, plant<br />
and equipment $ 2,470 $ 17,502 $ 23,463<br />
Provisions<br />
and future<br />
expenditures 24,008 16,053 17,952<br />
Net operating<br />
losses 3,580 0 0<br />
Deferred<br />
tax assets $ 30,058 $ 33,555 $ 41,415<br />
Deferred tax<br />
liabilities<br />
Amortizable<br />
property, plant<br />
and equipment (36,873) (43,455) (38,208)<br />
Provisions and<br />
future<br />
expenditures (20,111) (31,711) (37,368)<br />
Deferred<br />
tax liabilities (56,984) (75,166) (75,576)<br />
Net deferred<br />
tax liability $ (26,926) $ (41,611) $ (34,161)<br />
<strong>The</strong> Company has recorded deferred tax assets of $3.6 million<br />
and $nil at December 31, 2011 and 2010, respectively, pertaining<br />
to loss carry forwards based on management’s financial<br />
projections and the relevant tax legislation in each jurisdiction.<br />
Consolidated Statements of Income<br />
(in thousands of Canadian dollars) 2011 2010<br />
Deferred tax assets<br />
Amortizable property,<br />
plant and equipment $ 15,032 $ 5,961<br />
Provisions and<br />
future expenditures (7,747) 1,899<br />
Net operating losses (3,580) 0<br />
Deferred tax assets $ 3,705 $ 7,860<br />
Deferred tax liabilities<br />
Amortizable property,<br />
plant and equipment (6,582) 5,247<br />
Provisions and future expenditures (11,601) (5,656)<br />
Deferred tax liabilities (18,183) (409)<br />
Deferred tax (recovery) expense $ (14,478) $ 7,451<br />
<strong>The</strong> Company has recognised a deferred tax liability for taxes<br />
that would be payable on the unremitted earnings of certain<br />
of the Company’s subsidiaries, associates and joint ventures<br />
of $nil and $nil for the years ended December 31, 2011 and<br />
2010 respectively as the Company has determined that the<br />
undistributed profits of its subsidiaries will not be distributed<br />
in the foreseeable future. <strong>The</strong> temporary difference associated<br />
with investments in subsidiaries, associates and joint ventures,<br />
for which a deferred tax liability has not been recognized,<br />
aggregates to $181.9 million and $204.4 million for the years<br />
ended December 31, 2011 and 2010, respectively.<br />
<strong>The</strong> Company has net operating losses of $21.9 million and<br />
$15.8 million for the years ended December 31, 2011 and 2010,<br />
respectively, in various jurisdictions for which no deferred tax<br />
asset has been recognized. <strong>The</strong>se losses expire subsequent<br />
to the 2016 fiscal year. <strong>The</strong> Company has capital losses of<br />
$19.3 million and $19.9 million for the years ended December 31,<br />
2011 and 2010, respectively, in various jurisdictions for which no<br />
deferred tax asset has been recognized. <strong>The</strong>se capital losses<br />
carry forward indefinitely.<br />
<strong>The</strong> Company is subject to income tax laws in various<br />
jurisdictions. Tax laws are complex and potentially subject<br />
to different interpretations by the taxpayer and the relevant<br />
tax authority. <strong>The</strong> provision for income taxes and deferred tax<br />
represents management’s interpretation of the relevant tax laws<br />
and its estimate of current and future income tax implications<br />
of the transactions and events during the period. <strong>The</strong> Company<br />
may be required to change its provision for income taxes or<br />
deferred tax balances when the ultimate deductibility of certain<br />
items is successfully challenged by taxing authorities or if<br />
estimates used in determining the amount of deferred tax<br />
asset to recognized change significantly, or when receipt<br />
of new information indicates the need for adjustment in the<br />
amount of deferred tax to be recognized. Additionally, future<br />
events, such as changes in tax laws, tax regulations, or<br />
interpretations of such laws or regulations, could have an impact<br />
on the provision for income tax, deferred tax balances and the<br />
effective tax rate. Any such changes could materially affect the<br />
amounts reported in the consolidated financial statements in the<br />
year these changes occur.<br />
note 30<br />
Comparative figures<br />
<strong>The</strong> comparative audited consolidated financial statements<br />
have been reclassified from unaudited financial statements<br />
previously presented to conform to the presentation of the<br />
current year audited consolidated financial statements<br />
in accordance with IFRS.
ANNUAL REPORT 2011 <strong>ShawCor</strong> Ltd.<br />
105<br />
Six-Year Review<br />
(Unaudited)<br />
For the year ended December 31:<br />
(in thousands of Canadian dollars 2011 2010 2009 2008 2007 2006<br />
except per share information) ifrs IFRS CGAAP CGAAP CGAAP CGAAP<br />
(note 5)<br />
OPERATING RESULTS<br />
Revenue $ 1,157,265 $ 1,034,163 $ 1,183,978 $ 1,379,577 $ 1,048,099 $ 1,059,619<br />
EBITDA note 1 138,837 186,035 254,143 262,158 201,076 187,828<br />
Net income note 2 56,086 95,072 131,450 145,733 87,357 92,635<br />
Cash flow<br />
Cash from operating activities $ 45,327 $ 53,244 $ 299,333 $ 154,361 $ 97,514 $ 189,877<br />
Purchases of property, plant<br />
and equipment 55,982 48,723 34,358 89,799 91,855 58,170<br />
FINANCIAL POSITION<br />
Working capital note 3 $ 281,848 $ 283,852 $ 312,966 $ 229,169 $ 255,625 $ 341,375<br />
Long-term debt 25,005 52,287 91,226 72,726 87,480<br />
Shareholders’ equity 864,061 832,243 790,422 732,452 578,787 629,927<br />
Total assets 1,223,265 1,224,936 1,185,977 1,227,289 963,614 1,008,026<br />
PER SHARE INFORMATION<br />
(Class A and Class B)<br />
Net income (loss)<br />
Basic $ 0.79 $ 1.35 $ 1.86 $ 2.06 $ 1.20 $ 1.25<br />
Diluted $ 0.78 $ 1.33 $ 1.85 $ 2.03 $ 1.19 $ 1.25<br />
Dividends<br />
Class A $ 0.315 $ 0.295 $ 0.535 $ 0.253 $ 0.230 $ 0.135<br />
Class B $ 0.286 $ 0.268 $ 0.486 $ 0.229 $ 0.209 $ 0.123<br />
Shareholders’ equity note 4 $ 12.22 $ 11.79 $ 11.21 $ 10.40 $ 8.12 $ 8.51<br />
Quarterly Information<br />
(Unaudited)<br />
(in thousands of Canadian dollars except per share information) First Second Third Fourth Total<br />
Revenue 2011 $ 279,466 $ 264,541 $ 271,478 $ 341,780 $ 1,157,265<br />
2010 $ 224,572 $ 234,546 $ 282,959 $ 292,086 $ 1,034,163<br />
Net income note 2 2011 $ 20,485 $ 15,703 $ (3,144) $ 23,042 $ 56,086<br />
2010 $ 11,739 $ 12,031 $ 32,126 $ 39,176 $ 95,072<br />
Net income per share (Class A and Class B)<br />
Diluted 2011 $ 0.29 $ 0.21 $ (0.04) $ 0.32 $ 0.78<br />
2010 $ 0.16 $ 0.17 $ 0.45 $ 0.55 $ 1.33<br />
Note 1 EBITDA is a Non-GAAP measure calculated by adding back to net income, income taxes, finance costs, amortization of property, plant and equipment and<br />
intangible assets, and impairment of fixed assets. EBITDA does not have a standardized meaning prescribed by GAAP and is not necessarily comparable to<br />
similar measures provided by other companies. EBITDA is used by many analysts in the oil and gas industry as one of several important analytical tools.<br />
Note 2: Attributable to shareholders of the Company.<br />
Note 3: Working capital has been calculated as current assets minus current liabilities.<br />
Note 4: Shareholders’ equity per share is a Non-GAAP measure calculated by dividing shareholders’ equity by the number of Class A and Class B shares outstanding<br />
at the date of the balance sheet.<br />
Note 5: Restated due to the adoption of CICA Handbook section 3064.
106 <strong>ShawCor</strong> Ltd. Shawcor directors<br />
<strong>ShawCor</strong> Directors<br />
J.T. Baldwin<br />
London, England<br />
Mr. Baldwin is the Group<br />
Political Advisor of BP, a<br />
position he has held since<br />
October 2007, and has been<br />
a Director of <strong>ShawCor</strong> Ltd.<br />
since March 2010.<br />
D.S. Blackwood<br />
Houston, Texas<br />
Mr. Blackwood is President<br />
(Americas), Wood Group<br />
PSN, a position he has held<br />
since April 2011, and has been<br />
a Director of <strong>ShawCor</strong> Ltd.<br />
since May 2011.<br />
W.P. Buckley<br />
Toronto, Ontario<br />
Mr. Buckley is President<br />
and CEO of <strong>ShawCor</strong> Ltd.,<br />
a position he has held since<br />
June 2005, and has been<br />
a Director of the Company<br />
since August 2005.<br />
J.W. Derrick<br />
Buffalo, New York<br />
Mr. Derrick is Chief<br />
Executive Officer of Derrick<br />
Corporation, a position he has<br />
held since 1992, and has been<br />
a Director of <strong>ShawCor</strong> Ltd.<br />
since August 2007.<br />
D.H. Freeman<br />
Toronto, Ontario<br />
Mr. Freeman is a Chartered<br />
Accountant and from 1983<br />
to 2011 was a partner at<br />
KPMG LLP. He has been<br />
a Director of <strong>ShawCor</strong> Ltd.<br />
since October 2011.<br />
L.W.J. Hutchison<br />
St. James, Barbados, W.I.<br />
Mr. Hutchison joined<br />
<strong>ShawCor</strong> in 1998 and is<br />
Managing Director of<br />
<strong>ShawCor</strong> Global Services<br />
Limited, a position he has<br />
held since November 2007,<br />
and has been a Director and<br />
Vice Chair of the Company<br />
since February 2008.<br />
J.F. Petch Q.C.<br />
Toronto, Ontario<br />
Mr. Petch is Chair Emeritus<br />
of the Governing Council<br />
of the University of Toronto<br />
and has been a Director<br />
of <strong>ShawCor</strong> Ltd. since<br />
March 2005.<br />
R.J. Ritchie<br />
Calgary, Alberta<br />
Mr. Ritchie was the CEO<br />
and a Director of Canadian<br />
Pacific Railway Limited from<br />
2001 to 2006, and has been<br />
a Director of <strong>ShawCor</strong> Ltd.<br />
since April 1994.<br />
P.G. Robinson<br />
Toronto, Ontario<br />
Mr. Robinson is President<br />
and General Manager of<br />
Litens Automotive Group,<br />
a position he has held since<br />
2001, and has been a<br />
Director of <strong>ShawCor</strong> Ltd.<br />
since August 2001.<br />
H.A. Shaw<br />
Calgary, Alberta<br />
Ms. Shaw is the Executive<br />
Chair of Corus Entertainment<br />
Inc., a position she has<br />
held since September 1999,<br />
and has been a Director<br />
of <strong>ShawCor</strong> Ltd. since<br />
May 2008.<br />
V.L. Shaw<br />
St. James, Barbados, W.I.<br />
Ms. Shaw was appointed<br />
Chair of the Board of<br />
<strong>ShawCor</strong> Ltd. in February<br />
2007, was Vice Chair of the<br />
Board from August 2000<br />
until February 2007, and<br />
has been a Director of the<br />
Company since April 1994.<br />
Z.D. Simo<br />
Oakville, Ontario<br />
Mr. Simo is a former<br />
President and CEO of<br />
Tecsyn International Inc.<br />
and has been a Director<br />
of <strong>ShawCor</strong> Ltd. since<br />
August 1987.<br />
E.C. Valiquette<br />
Pembroke, Ontario<br />
Ms. Valiquette is a Chartered<br />
Accountant and a former<br />
Senior Vice President<br />
and Chief <strong>Financial</strong> Officer<br />
of ING Canada Inc.<br />
and has been a Director<br />
of <strong>ShawCor</strong> Ltd. since<br />
March 2005.
ANNUAL REPORT 2011 <strong>ShawCor</strong> Ltd.<br />
107<br />
Corporate Governance<br />
<strong>The</strong> Board of Directors (the “Board”) and management of the<br />
Company recognize that effective corporate governance is<br />
central to the prudent direction and operation of the Company<br />
in a manner that ultimately enhances shareholder value.<br />
<strong>The</strong> following discussion outlines the Company’s system of<br />
corporate governance.<br />
<strong>The</strong> business and affairs of the Company are managed under the<br />
supervision of the Board. Broadly, the Board approves overall<br />
corporate strategy, assesses management’s implementation of<br />
agreed strategies and reviews the results achieved. <strong>The</strong> Board's<br />
role consists of approval of strategic plans, review of corporate<br />
risks identified by management and monitoring the Company’s<br />
practices and policies for dealing with these risks, management<br />
succession planning, monitoring business practices and<br />
assessment of the integrity of the Company's internal controls,<br />
information and governance systems.<br />
<strong>The</strong> Board oversees the Company’s strategic planning process,<br />
reviews and approves overall corporate strategies and assesses<br />
management's success in implementing these strategies. This is<br />
done regularly and through an annual special purpose Board<br />
Meeting held each year to review and approve the Company’s<br />
strategic and annual business plan. <strong>The</strong> strategic plan is updated<br />
each year so that it always projects the next three-year period.<br />
Management reports to the Board quarterly, highlighting and<br />
commenting upon divisional performance compared with annual<br />
business plan forecasts and prior year results. As part of the<br />
strategic plan review process, the Board identifies and evaluates<br />
the principal opportunities and risks of the Company's<br />
businesses and seeks to ensure that management puts in place<br />
appropriate systems to manage the principal risks.<br />
During 2008, the position of Lead Director was established<br />
and is currently being filled by John F. Petch. <strong>The</strong> Lead Director<br />
facilitates the Board’s ability to function independently of<br />
management of the Company and the non-independent<br />
Directors. <strong>The</strong> Lead Director promotes best practices and high<br />
standards of corporate governance, consistent with enhancing<br />
and promoting the effectiveness and performance of the Board.<br />
<strong>The</strong> Vice Chair of the Board, Leslie W. J. Hutchison, provides<br />
back-up to the Chair, Virginia L. Shaw.<br />
<strong>The</strong> Audit, Compensation and Corporate Governance<br />
Committees of the Board are each comprised of independent<br />
Directors. <strong>The</strong> Executive Committee is comprised of the Chair,<br />
the Chief Executive Officer and three independent Directors.<br />
Ten of thirteen members of the Board are considered to<br />
be independent.<br />
<strong>The</strong> corporate governance practices and policies of the<br />
Company have been developed under the general stewardship<br />
of the Corporate Governance Committee. <strong>The</strong> Committee<br />
believes that the corporate governance practices of the<br />
Company are appropriate for the Company. As a result of<br />
evolving laws, policies and practices, the Corporate Governance<br />
Committee regularly reviews these corporate governance<br />
practices and policies of the Company in order to facilitate<br />
compliance with all applicable requirements and implements<br />
best practices appropriate to its operations.
108 <strong>ShawCor</strong> Ltd. PRimary Operating locations<br />
Primary Operating Locations<br />
Pipeline and Pipe Services<br />
Bredero Shaw<br />
Flexpipe Systems<br />
Shaw Pipeline Services<br />
<strong>ShawCor</strong> Pipe Protection<br />
3838 N. Sam Houston Pkwy. E.<br />
Suite 300<br />
Houston, Texas 77032<br />
T: 281 886 2350<br />
F: 281 886 2351<br />
Bredero Shaw<br />
Lakeside House<br />
1 Furzeground Way<br />
Stockley Park<br />
Uxbridge, Middlesex<br />
England UB11 1BD<br />
Shaw Pipe Protection<br />
3200, 450 1st Street S.W.<br />
Calgary, Alberta T2P 5H1<br />
T: 403 263 2255<br />
F: 403 264 3649<br />
Bredero Shaw<br />
#17-01/02 United Square<br />
101 Thomson Road<br />
Singapore 307591<br />
T: 65 6732 2355<br />
F: 65 6732 9073<br />
3501 54th Avenue S.E.<br />
Calgary, Alberta T2C 0A9<br />
T: 403 503 0548<br />
F: 403 503 0547<br />
Canusa-CPS<br />
25 Bethridge Road<br />
Toronto, Ontario M9W 1M7<br />
T: 416 743 7111<br />
F: 416 743 5927<br />
4250 N. Sam Houston Pkwy. E.<br />
Suite 180<br />
Houston, Texas 77032<br />
T: 832 601 0850<br />
F: 281 442 1593<br />
Guardian<br />
950 – 78th Avenue<br />
Edmonton, Alberta T6P 1L7<br />
T: 780 440 1444<br />
F: 780 440 4261<br />
T: 44 208 622 3071<br />
F: 44 208 622 3169<br />
Petrochemical and Industrial<br />
DSG-Canusa<br />
25 Bethridge Road<br />
Toronto, Ontario M9W 1M7<br />
T: 416 743 7111<br />
F: 416 743 7752<br />
ShawFlex<br />
25 Bethridge Road<br />
Toronto, Ontario M9W 1M7<br />
T: 416 743 7111<br />
F: 416 743 2565<br />
Design: Craib Design & Communications www.craib.com Printed in Canada
Corporate Information<br />
Corporate Officers<br />
Operations Management<br />
V.L. Shaw<br />
Chair of the Board<br />
L.W.J. Hutchison<br />
Vice Chair of the Board<br />
W.P. Buckley<br />
President and<br />
Chief Executive Officer<br />
G.S. Love<br />
Vice President, Finance and<br />
Chief <strong>Financial</strong> Officer<br />
D.R. Ewert<br />
Corporate Secretary<br />
M.J. Simmons<br />
Group President<br />
<strong>ShawCor</strong> Ltd.<br />
D.L. Broussard<br />
President<br />
Flexpipe Systems<br />
J.D. Tikkanen<br />
President<br />
Bredero Shaw<br />
J.L. Barkhouse<br />
Senior Vice President<br />
Americas & Global Operations<br />
Bredero Shaw<br />
P.L. Evans<br />
Senior Vice President<br />
Asia Pacific<br />
Bredero Shaw<br />
F. Cistrone<br />
Vice President and<br />
General Manager, Operations<br />
<strong>ShawCor</strong> Ltd.<br />
R.J. Dunn<br />
Vice President and<br />
General Manager<br />
Canusa-CPS<br />
S.J. Edmondson<br />
Vice President<br />
Research & Development<br />
<strong>ShawCor</strong> Ltd.<br />
F. Gallina<br />
Vice President<br />
Special Projects<br />
<strong>ShawCor</strong> Ltd.<br />
B. Garces<br />
Vice President<br />
<strong>ShawCor</strong> Manufacturing System<br />
<strong>ShawCor</strong> Ltd.<br />
D.R. Gibb<br />
Vice President<br />
Information Technology<br />
<strong>ShawCor</strong> Ltd.<br />
G.L. Graham<br />
Vice President<br />
Corporate Development<br />
<strong>ShawCor</strong> Ltd.<br />
S.A. Haberer<br />
Vice President<br />
Market Development &<br />
Acquisitions <strong>ShawCor</strong> Ltd.<br />
T.L. Hutzul<br />
Vice President, Legal<br />
<strong>ShawCor</strong> Ltd.<br />
P.A. Pierroz<br />
Vice President<br />
Human Resources<br />
<strong>ShawCor</strong> Ltd.<br />
G.R. Prentice<br />
Vice President and<br />
General Manager<br />
Shaw Pipeline Services<br />
E.W. Reynolds<br />
Vice President and<br />
General Manager<br />
DSG-Canusa, ShawFlex<br />
H.A.A.M. Tausch<br />
Vice President and<br />
General Manager<br />
Europe, Middle East, Africa, Russia<br />
Bredero Shaw<br />
J.A. Teppan<br />
Vice President and<br />
Assistant General Manager<br />
Guardian<br />
K.C. Willson<br />
Vice President and<br />
General Manager<br />
Guardian<br />
Corporate Address, Stock Information and Annual Meeting<br />
HEAD OFFICE<br />
25 Bethridge Road<br />
Toronto, Ontario<br />
Canada M9W 1M7<br />
Telephone: 416 743 7111<br />
Facsimile: 416 743 7199<br />
Auditors<br />
Ernst & Young LLP<br />
Transfer Agent and<br />
Registrar<br />
CIBC Mellon Trust Company<br />
c/o Canadian Stock Transfer<br />
Company Inc.<br />
P.O. Box 700, Station B<br />
Montreal, Quebec<br />
Canada H3B 3K3<br />
Telephone: 800 387 0825<br />
416 682 3860<br />
Facsimile: 888 249 6189<br />
E-mail: inquiries@canstockta.com<br />
Stock Listing<br />
<strong>The</strong> Toronto Stock Exchange<br />
Class “A” Subordinate Voting<br />
Shares<br />
Trading Symbol: SCL.A<br />
Class “B” Multiple Voting Shares<br />
Trading Symbol: SCL.B<br />
Annual Meeting<br />
Tuesday, May 8, 2012<br />
4:00 p.m.<br />
<strong>The</strong> Fairmont Royal York Hotel<br />
Toronto, Ontario<br />
Canada<br />
www.shawcor.com
Why <strong>ShawCor</strong>?<br />
Global Leadership<br />
More than 70 manufacturing and service facilities in over<br />
15 countries give <strong>ShawCor</strong> unrivalled proximity to every major<br />
energy-producing region.<br />
Superior Execution<br />
<strong>The</strong> industry’s most advanced continuous improvement<br />
program helps us execute complex customer projects safely,<br />
on-time and on-budget, providing superior customer satisfaction.<br />
Technological Innovation<br />
Continuing research and development of market-leading,<br />
proprietary technology has created a powerful<br />
competitive advantage.<br />
Organizational Excellence<br />
We are becoming a high-performing organization in which<br />
everyone is aligned and motivated to advance our<br />
strategies for growth.<br />
Strong Industry Fundamentals<br />
Global demand for oil and gas is expected to increase 36%<br />
between 2011 and 2035 due to rapid economic growth in<br />
developing countries.<br />
Proven Performance<br />
In the past 10 years, <strong>ShawCor</strong>’s Class A Shares have delivered a<br />
total return to shareholders of 125%, equivalent to a compound<br />
annual return of 31%.