pab bankshares, inc. - SNL Financial
pab bankshares, inc. - SNL Financial
pab bankshares, inc. - SNL Financial

You also want an ePaper? Increase the reach of your titles
YUMPU automatically turns print PDFs into web optimized ePapers that Google loves.
2009 Annual Report
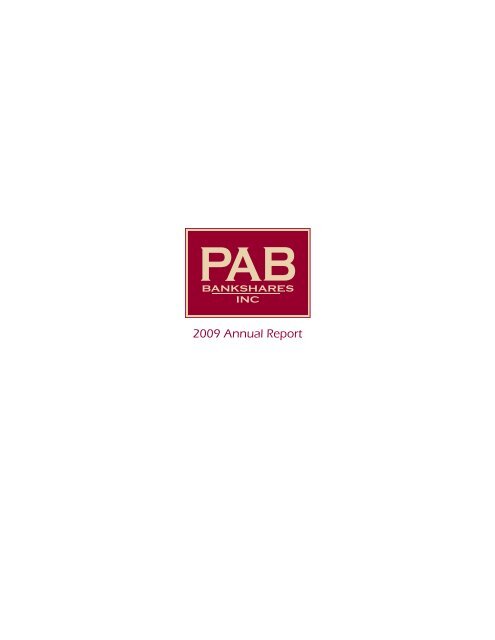
ATLANTA<br />
Stockbridge<br />
★<br />
★<br />
★<br />
Oakwood<br />
★<br />
Athens<br />
McDonough<br />
Description<br />
of Business<br />
PAB Bankshares, Inc. is the<br />
bank holding company for The<br />
Park Avenue Bank, a $1.2<br />
billion state-chartered, commercial<br />
bank headquartered in<br />
Valdosta, Georgia. Founded in<br />
1956, the Bank currently operates<br />
18 branch offices in 11<br />
counties in Georgia and Florida.<br />
Additional information on the<br />
Bank’s locations and the products<br />
and services offered by the<br />
Bank is available on the Internet<br />
at www.parkavebank.com. The<br />
Company’s common stock is<br />
listed on the NASDAQ Global<br />
Select Market under the symbol<br />
PABK. More information on the<br />
Company is available on the Internet<br />
at www.<strong>pab</strong><strong>bankshares</strong>.com.<br />
Bainbridge<br />
3 Locations<br />
★ ★<br />
Cairo<br />
TALLAHASSEE<br />
MACON<br />
★<br />
Statesboro<br />
2 Locations<br />
Adel<br />
VALDOSTA<br />
★<br />
Lake Park<br />
★<br />
★<br />
★<br />
★<br />
★<br />
★<br />
Hazlehurst<br />
Baxley<br />
3 Locations<br />
PAB<br />
Bankshares<br />
Home Office<br />
Ocala<br />
Branch Locations<br />
Mission Statement:<br />
Develop lasting, quality relationships<br />
through exemplary customer service.
UNITED STATES<br />
SECURITIES AND EXCHANGE COMMISSION<br />
Washington, D.C. 20549<br />
FORM 10-K<br />
Annual Report Pursuant to Section 13 or 15 (d) of the Securities Exchange Act of 1934<br />
For the Fiscal Year Ended December 31, 2009<br />
Commission File Number 000-25422<br />
PAB BANKSHARES, INC.<br />
(A Georgia Corporation)<br />
IRS Employer Identification Number: 58-1473302<br />
3250 North Valdosta Road, Valdosta, Georgia 31602<br />
Telephone Number: (229) 241-2775<br />
SECURITIES REGISTERED PURSUANT TO SECTION 12(B) OF THE ACT:<br />
Title of each class<br />
Common Stock, no par value<br />
Name of exchange on which registered<br />
The NASDAQ Stock Market LLC<br />
(NASDAQ Global Select Market)<br />
SECURITIES REGISTERED PURSUANT TO SECTION 12(G) OF THE ACT:<br />
None<br />
Indicate by check mark if the registrant is a well-known seasoned issuer, as defined in Rule 405 of the Securities Exchange Act. Yes [ ] No [X]<br />
Indicate by check mark if the registrant is not required to file reports pursuant to Section 13 or 15(d) of the Exchange Act. Yes [ ] No [X]<br />
Indicate by check mark whether the registrant has submitted electronically and posted on its corporate Web site, if any, every Interactive Data File<br />
required to be submitted and posted pursuant to Rule 405 of Regulation S-T during the preceding 12 months (or for such shorter period that the<br />
registrant was required to submit and post such files).Yes No <br />
Indicate by check mark whether the registrant (1) has filed all reports required to be filed by Section 13 or 15 (d) of the Securities Exchange Act of<br />
1934 during the preceding 12 months (or for such shorter period that the registrant was required to file such reports), and (2) has been subject to<br />
such filing requirements for the past 90 days. Yes [X] No [ ]<br />
Indicate by check mark if disclosure of delinquent filers pursuant to Item 405 of Regulation S-K is not contained herein and will not be contained,<br />
to the best of the registrant’s knowledge, in definitive proxy or information statements <strong>inc</strong>orporated by reference in Part III of this Form 10-K or<br />
any amendment to this Form 10-K. [X]<br />
Indicate by check mark whether the registrant has submitted electronically and posted on its corporate Web site, if any, every Interactive Data File<br />
required to be submitted and posted pursuant to Rule 405 of Regulation S-T during the preceding 12 months (or for such shorter period that the<br />
registrant was required to submit and post such files). Yes [ ] No [ ]<br />
Indicate by check mark whether the registrant is a large accelerated filer, an accelerated filer, a non-accelerated filer, or a smaller reporting<br />
company. See definition of “accelerated filer,” “large accelerated filer” and “smaller reporting company” in Rule 12b-2 of the Exchange Act.<br />
Large accelerated filer [ ] Accelerated filer [ ] Non-accelerated filer [ ] Smaller reporting company [X]<br />
Indicate by check mark whether the registrant is a shell company (as defined in Rule 12b-2 of the Exchange Act). Yes [ ] No [X]
The aggregate market value of voting common stock held by non-affiliates on June 30, 2009 was approximately $17.7 million (based on shares held<br />
by non-affiliates at $2.56 per share, the closing stock price on the NASDAQ Stock Market on June 30, 2009).<br />
As of February 26, 2010 (the latest practicable date), the registrant had 13,795,040 shares of common stock outstanding.<br />
DOCUMENTS INCORPORATED BY REFERENCE<br />
Document<br />
Parts into which <strong>inc</strong>orporated<br />
None<br />
N/A<br />
2
TABLE OF CONTENTS<br />
Item<br />
Page<br />
Cautionary Notice Regarding Forward-Looking Statements 4<br />
PART I<br />
1. BUSINESS<br />
General 5<br />
Supervision and Regulation 9<br />
1A. RISK FACTORS 15<br />
1B. UNRESOLVED STAFF COMMENTS 23<br />
2. PROPERTIES 23<br />
3. LEGAL PROCEEDINGS 24<br />
PART II<br />
4. RESERVED 24<br />
5. MARKET FOR REGISTRANT’S COMMON EQUITY, RELATED STOCKHOLDER<br />
MATTERS AND ISSUER PURCHASES OF EQUITY SECURITIES 24<br />
6. SELECTED FINANCIAL DATA 26<br />
7. MANAGEMENT’S DISCUSSION AND ANALYSIS OF FINANCIAL CONDITION<br />
AND RESULTS OF OPERATIONS<br />
Overview of Key <strong>Financial</strong>, Strategic and Performance Factors 27<br />
Statistical Disclosures 32<br />
Liquidity and Capital Resources 45<br />
Results of Operations 48<br />
7A. QUANTITATIVE AND QUALITATIVE DISCLOSURES ABOUT MARKET RISK 52<br />
8. FINANCIAL STATEMENTS AND SUPPLEMENTARY DATA<br />
Quarterly <strong>Financial</strong> Summary for 2009 and 2008 54<br />
Management’s Report On Internal Control Over <strong>Financial</strong> Reporting 55<br />
Auditor’s Attestation Report 56<br />
Reports of Independent Registered Public Accounting Firm 58<br />
Consolidated Balance Sheets at December 31, 2009 and 2008 59<br />
Consolidated Statements of Income (Loss) for the Three Years Ended December 31, 2009 60<br />
Consolidated Statements of Comprehensive Income (Loss) for the Three Years Ended<br />
December 31, 2009 61<br />
Consolidated Statements of Stockholders’ Equity for the Three Years Ended<br />
December 31, 2009 62<br />
Consolidated Statements of Cash Flows for the Three Years Ended December 31, 2009 63<br />
Notes to Consolidated <strong>Financial</strong> Statements 65<br />
9. CHANGES IN AND DISAGREEMENTS WITH ACCOUNTANTS ON ACCOUNTING<br />
AND FINANCIAL DISCLOSURE 105<br />
9A. CONTROLS AND PROCEDURES 105<br />
9B. OTHER INFORMATION 106<br />
PART III<br />
10. DIRECTORS AND EXECUTIVE OFFICERS AND CORPORATE GOVERNANCE 106<br />
11. EXECUTIVE COMPENSATION 113<br />
12. SECURITY OWNERSHIP OF CERTAIN BENEFICIAL OWNERS AND MANAGEMENT<br />
AND RELATED STOCKHOLDER MATTERS 128<br />
13. CERTAIN RELATIONSHIPS AND RELATED TRANSACTIONS, AND DIRECTOR<br />
INDEPENDENCE 130<br />
14. PRINCIPAL ACCOUNTANT FEES AND SERVICES 131<br />
PART IV<br />
15. EXHIBITS AND FINANCIAL STATEMENT SCHEDULES 132<br />
SIGNATURES 135<br />
3
CAUTIONARY NOTICE REGARDING FORWARD-LOOKING STATEMENTS<br />
Certain statements set forth in this Report or <strong>inc</strong>orporated herein by reference, <strong>inc</strong>luding, without limitation, matters<br />
discussed under the caption “Management's Discussion and Analysis of <strong>Financial</strong> Condition and Results of<br />
Operations” are “forward-looking statements” within the meaning of the federal securities laws, <strong>inc</strong>luding, without<br />
limitation, statements regarding our outlook on earnings, stock performance, asset quality, economic conditions, real<br />
estate markets and projected growth, and are based upon management’s beliefs as well as assumptions made based on<br />
data currently available to management. In this Report, the terms “PAB”, the “Company”, “we”, “us”, or “our” refer<br />
to PAB Bankshares, Inc. When words like “anticipate”, “believe”, “intend”, “plan”, “may”, “continue”, “project”,<br />
“would”, “expect”, “estimate”, “could”, “should”, “will”, and similar expressions are used, you should consider them<br />
as identifying forward-looking statements. These forward-looking statements are not guarantees of future<br />
performance, and a variety of factors could cause our actual results to differ materially from the anticipated or<br />
expected results expressed in these forward-looking statements. Many of these factors are beyond our ability to<br />
control or predict, and readers are cautioned not to put undue reliance on such forward-looking statements. The<br />
following list, which is not intended to be an all-encompassing list of risks and uncertainties affecting us, summarizes<br />
several factors that could cause our actual results to differ materially from those anticipated or expected in these<br />
forward-looking statements: (1) general economic conditions (both generally and in our markets) may be less<br />
favorable than expected, resulting in, among other things, a continued deterioration in credit quality, a further<br />
reduction in demand for credit and/or a further decline in real estate values; (2) the general decline in the real estate<br />
and lending market, particularly the market areas surrounding metropolitan Atlanta, may continue to negatively affect<br />
our financial results; (3) our ability to raise additional capital may be impaired if current levels of market disruption<br />
and volatility continue or worsen; (4) restrictions or conditions imposed by our regulators on our operations, <strong>inc</strong>luding<br />
the terms of our written agreement with the Federal Reserve Board, may make it more difficult for us to achieve our<br />
goals; (5) legislative or regulatory changes, <strong>inc</strong>luding changes in accounting standards and compliance requirements,<br />
may adversely affect the businesses in which we are engaged; (6) competitive pressures among depository and other<br />
financial institutions may <strong>inc</strong>rease significantly; (7) changes in the interest rate environment may reduce margins or<br />
the volumes or values of the loans we make; (8) competitors may have greater financial resources and develop<br />
products that enable those competitors to compete more successfully than we can; (9) our ability to attract and retain<br />
key personnel can be affected by the <strong>inc</strong>reased competition for experienced employees in the banking industry;<br />
(10) adverse changes may occur in the bond and equity markets; (11) war or terrorist activities may cause further<br />
deterioration in the economy or cause instability in credit markets; (12) we may not close the sale of five of our South<br />
Georgia branches when we anticipate or at all; (13) economic, governmental or other factors may prevent the<br />
projected population, residential and commercial growth in the markets in which we operate; and (14) the risk factors<br />
discussed from time to time in the Company’s Periodic Reports filed with the Securities and Exchange Commission<br />
(the “SEC”), <strong>inc</strong>luding but not limited to, this Annual Report on Form 10-K (the “Report”). We undertake no<br />
obligation to, and we do not intend to, update or revise these statements following the date of this filing, whether as a<br />
result of new information, future events or otherwise, except as may be required by law. All written or oral forwardlooking<br />
statements attributable to us are expressly qualified in their entirety by this Cautionary Note. Our actual<br />
results may differ significantly from those we discuss in these forward-looking statements. For other factors, risks<br />
and uncertainties that could cause our actual results to differ materially from estimates and projections contained in<br />
these forward-looking statements, please read the “Risk Factors” section of this report. Any forward-looking<br />
statement speaks only as of the date that the statement was made, and, except as required by law, we expressly<br />
disclaim any obligation or undertaking to disseminate any updates or revisions to any forward-looking statement to<br />
reflect events or circumstances after the date on which we made the statement or to reflect the occurrence of<br />
unanticipated events.<br />
4
PART I<br />
ITEM 1. BUSINESS<br />
General<br />
PAB is a bank holding company headquartered in Valdosta, Lowndes County, Georgia. PAB was organized and<br />
<strong>inc</strong>orporated in 1982 under the laws of the State of Georgia as the holding company for The Park Avenue Bank (the<br />
“Bank”). S<strong>inc</strong>e our <strong>inc</strong>orporation in 1982, we have acquired five other Georgia financial institutions and one Florida<br />
financial institution, and subsequently merged those institutions into the Bank. The Bank was founded in Valdosta in<br />
1956, and it became a state-chartered commercial bank in 1971. In 2001, the Bank became a state member bank of<br />
the Federal Reserve System. Currently, the Bank operates 13 branches located in seven counties in South Georgia;<br />
four branches located in three counties in North Georgia; and one branch located in Ocala, Florida. On February 23,<br />
2010, we entered into a Purchase and Assumption Agreement whereby we agreed to sell five of our branches in South<br />
Georgia to HeritageBank of the South. The closing of the transaction is subject to regulatory approval and other<br />
customary closing conditions and is expected to be completed in the second quarter of 2010. Additional information<br />
on each of the markets that we serve is provided below under the caption “Markets and Competition.”<br />
Unless the context indicates otherwise, all references in this report to “PAB,” “we,” “us” and “our” refer to PAB<br />
Bankshares, Inc. and our wholly owned subsidiary, The Park Avenue Bank, except that in the discussion of our capital<br />
stock and related matters, these terms refer solely to PAB Bankshares, Inc. and not to its subsidiary. All references to<br />
the “Bank” refer to The Park Avenue Bank only.<br />
The Bank<br />
The Bank offers traditional banking products and services to commercial and individual customers in our markets.<br />
Our product line <strong>inc</strong>ludes, among other things, loans to small- and medium-sized businesses, residential and<br />
commercial construction and development loans, commercial real estate loans, farmland and agricultural production<br />
loans, residential mortgage loans, home equity loans, consumer loans, and a variety of commercial and consumer<br />
demand, savings and time deposit products. We also offer internet banking, on-line cash management, electronic bill<br />
payment services, safe deposit box rentals, telephone banking, credit and debit card services, remote depository<br />
products and the availability of a network of ATMs to our customers. In addition, through an agreement with a thirdparty<br />
broker-dealer and investment advisory firm, we are able to offer securities brokerage and investment advisory<br />
services to our customers.<br />
Markets and Competition<br />
The financial services industry is highly competitive. In our markets, we face competitive pressures from both larger<br />
regional banks and smaller community banks and thrifts in attracting and retaining commercial and consumer<br />
accounts. The competitive environment is amplified in some of our smaller markets as there are more financial<br />
service providers competing for fewer customers. The pr<strong>inc</strong>ipal factors in competing for such accounts <strong>inc</strong>lude<br />
interest rates, fee structures, the range of products and services offered, convenience of office and ATM locations, and<br />
flexible office hours. Other competition for such accounts comes from credit unions, internet banks, retail brokerage<br />
firms, mortgage companies, insurance companies and consumer finance offices. Other investment alternatives such as<br />
stocks and mutual funds made readily accessible by the internet have also had an effect on our ability to grow deposits<br />
in our markets.<br />
When it comes to competing with the larger financial institutions in our markets, we believe that our people make the<br />
difference. Our experience and strong community relationships in our markets allow us to deliver a higher level of<br />
customer service to the small- and medium-sized commercial businesses and to individual consumers. Being smaller<br />
and less bureaucratic than our regional and national competitors allows us to provide a more timely response and<br />
greater flexibility in serving the needs of our customers. At the same time, we have invested in systems and support to<br />
provide a product line that we believe gives us a competitive edge over many of the smaller financial institutions in<br />
our markets.<br />
5
A brief description on the characteristics of our markets and our history in those markets is provided below.<br />
South Georgia<br />
The Bank has a proud tradition of community banking in South Georgia spanning over five decades, and we have<br />
developed a large market share in many of these communities. As previously mentioned, we have been in Valdosta<br />
s<strong>inc</strong>e 1956. We also have branches in Adel (Cook County), Bainbridge (Decatur County), Baxley (Appling County),<br />
Statesboro (Bulloch County), Hazlehurst (Jeff Davis County) and Cairo (Grady County). Collectively, we refer to<br />
these seven communities as our “South Georgia” market in this Report. In 2001, we began consolidating the separate<br />
charters of our banks into one charter, The Park Avenue Bank. The charter consolidation was completed in April<br />
2002, and all of our banking offices now operate under the “PAB” logo. Overall, we have the ninth largest market<br />
share 1 with 2.73% of the total deposits in the state’s southern tier 2 . Our branch network in South Georgia has allowed<br />
us to deliver retail banking services in these communities more effectively. Therefore, our primary focus in South<br />
Georgia is on providing traditional community banking products and services to consumers, businesses, and<br />
municipalities. The timber and farming industries and agricultural-related businesses are vital to the local economies<br />
in each of our South Georgia markets.<br />
On February 23, 2010, we entered into a Purchase and Assumption Agreement whereby we agreed to sell our<br />
branches located in Adel, Statesboro, Baxley, and Hazlehurst to HeritageBank of the South. The closing of the<br />
transaction is subject to regulatory approval and other customary closing conditions and is expected to be completed<br />
in the second quarter of 2010.<br />
Valdosta and Adel are located off Interstate 75 in the middle of South Georgia. Valdosta is the county seat of<br />
Lowndes County and is 18 miles north of the Florida state line. The Valdosta Metropolitan Statistical Area (“MSA”)<br />
is comprised of Lowndes, Brooks, Berrien, and Echols Counties. Adel is in Cook County and is 21 miles north of<br />
Valdosta. We have 56 employees, five branches, and nine ATM’s serving our customers in these communities. The<br />
Company’s administrative and operational facilities and 93 additional employees are also located in Valdosta. Prior to<br />
its merger with the Bank in 2001, the Adel office operated under a separate bank charter called Farmers and<br />
Merchants Bank. Moody Air Force Base, Valdosta State University, and several transportation and distribution<br />
facilities of regional and national firms are some of the major economic contributors to the area.<br />
Bainbridge and Cairo are 82 and 58 miles, respectively, west of Valdosta along U.S. Highway 84 in the southwest<br />
corner of the state in the heart of Georgia’s “Plantation Trace”, a region dotted with historic antebellum-era<br />
plantations and farms. Also, both communities are within 42 miles of the Tallahassee, Florida MSA. We have 32<br />
employees, four branches, and five ATM’s serving our customers in these communities. Prior to their merger with the<br />
Bank in 2002, the Bainbridge and Cairo offices were part of the First Community Bank of Southwest Georgia charter,<br />
with the Cairo office using the trade name Bank of Grady County. First Community Bank of Southwest Georgia was<br />
formed in 1998 from the merger of First Federal Savings Bank and Bainbridge National Bank.<br />
Statesboro, 161 miles northeast of Valdosta, sits at the intersection of U.S. Highway 80 and U.S. Highway 301, near<br />
Interstate 16, in Southeast Georgia. Statesboro is also 53 miles west of the Savannah MSA. We have 18 employees,<br />
two branches, and three ATM’s in this community. Prior to its merger with the Bank in 2002, the Statesboro offices<br />
had operated under the Eagle Bank and Trust charter. Georgia Southern University is located in Statesboro.<br />
Baxley and Hazlehurst are both approximately 90 miles northeast of Valdosta. The two communities are located 16<br />
miles apart along U.S. Highway 341 in Southeast Georgia. We have 16 employees, two branches, and two ATM’s<br />
serving our customers in these communities. Prior to its merger with the Bank in 2002, the Baxley and Hazlehurst<br />
offices operated under the Baxley Federal Savings Bank thrift charter. The Georgia Power Company’s Edwin I.<br />
Hatch Nuclear Power Plant located in Appling County is one of the area’s largest employers.<br />
1 Based on the FDIC/OTS Summary of Deposits report as of June 30, 2009.<br />
2 Regions 9-12 (58 counties) as defined by the Georgia Department of Community Affairs.<br />
6
North Georgia<br />
During the fourth quarter of 2000, we adopted an expansion strategy to enter into higher growth metropolitan markets<br />
that would complement our South Georgia market and leverage the excess deposits of our South Georgia franchise.<br />
This expansion began with the opening of an office in McDonough (Henry County) on the south side of the Atlanta<br />
MSA in October 2000. In October 2001, we opened an office in Oakwood (Hall County), north of Atlanta in the<br />
Gainesville MSA. Both the McDonough and Oakwood offices initially began as loan production offices and were<br />
subsequently developed into full service branches. In October 2003, we opened a loan production office in Athens<br />
(Clarke County), east of Atlanta. In October 2006, the Athens loan production office was converted into our full<br />
service branch in Oconee County in the Athens MSA. In July 2004, we expanded our presence in Henry County with<br />
the opening of a branch office in Stockbridge. In April 2005, we opened a loan production office in Cobb County,<br />
and in December 2005, we opened a loan production office in Snellville (Gwinnett County) on the east side of the<br />
Atlanta MSA. In February 2007, we opened a branch in Snellville and a loan production office in Cumming (Forsyth<br />
County) on the north side of the Atlanta MSA. In March 2007, due to the departure of a key production officer at that<br />
location, we closed the loan production office in Cobb County and shifted the remaining resources to our Henry<br />
County market. In January 2009, we closed our branch and loan production office in Snellville due to the economic<br />
downturn and disappointing results from the market. In January 2010, we closed our loan production office in<br />
Cumming due to a shift in our strategic plan. Our offices in Henry, Hall and Oconee counties and our former offices<br />
in Cobb, Clarke, Gwinnett, and Forsyth counties are referred to collectively as our “North Georgia” market in this<br />
Report. Due to our relative newness and the lack of a large retail branch network, we do not have a significant retail<br />
presence or deposit market share in the North Georgia market. Thus far, we have primarily catered to residential and<br />
commercial builders and developers and small- to medium-sized commercial operations in the North Georgia market.<br />
McDonough and Stockbridge are located along Interstate 75 in Henry County. Henry County is the southern-most<br />
county of the Atlanta MSA. McDonough is 30 miles south of Downtown Atlanta. We have 16 employees, two<br />
branches, and four ATM’s serving our customers in these communities. Our McDonough office opened in 2000 and<br />
our Stockbridge location opened in 2004.<br />
Oakwood is eight miles south of Gainesville along Interstate 985 in Hall County. Oakwood is 50 miles northeast of<br />
Downtown Atlanta and 12 miles north of the Mall of Georgia retail shopping complex in Gwinnett County. Oakwood<br />
is part of the Gainesville MSA. We have eight employees, one branch, and one ATM serving our customers in this<br />
community. The poultry industry has been a significant economic factor for the region over the past several decades.<br />
As the Atlanta MSA experienced its urban sprawl, Hall County experienced significant growth over the past several<br />
years. Our primary focus in Hall County has been in commercial lending.<br />
Athens is 70 miles east of Downtown Atlanta. The consolidated city/county government of Athens-Clarke County<br />
and neighboring Oconee County comprise the Athens-Clarke County MSA. The University of Georgia is located in<br />
Athens and is the single largest economic factor in the Athens-Clarke County MSA. Prior to October 2006, we had<br />
one loan production office in Athens. In October 2006, we closed the loan production office and opened a full service<br />
branch in neighboring Oconee County. We have seven employees and one ATM serving our customers in this<br />
community through this branch.<br />
Florida<br />
In December 2000, we acquired Friendship Community Bank in Ocala (Marion County). The acquired bank was<br />
merged into the Bank in 2001. In September 2003, we opened a loan production office in St. Augustine (St. Johns<br />
County), but we closed this office in January 2010 due to a shift in our strategic plan. In 2006, we opened a branch in<br />
the Jacksonville (Duval County) market, but we closed this branch in January 2009 due to the economic downturn and<br />
disappointing results from the market. Our office in Ocala and our former offices in St. Johns and Duval counties are<br />
collectively referred to as our “Florida” market.<br />
Our Ocala office is near several retirement communities and has served primarily as a deposit gathering facility for<br />
the Bank. Ocala is located in Central Florida, 130 miles south of Valdosta along Interstate 75. We have 11<br />
employees, one branch, and two ATMs serving our customers in Ocala. Ocala is known for its equestrian training<br />
facilities and retirement communities due to its mild year-round climate.<br />
7
The table below provides basic information and summary demographic data on each of our current markets. Further<br />
discussion regarding local real estate market conditions is provided in Item 7, “Management’s Discussion and<br />
Analysis of <strong>Financial</strong> Condition and Results of Operations,” of this Report.<br />
Market/<br />
County<br />
Number<br />
Of<br />
Offices<br />
Total<br />
Loans 1<br />
Total<br />
Deposits 1<br />
Market<br />
Population<br />
Share (%) 2 Population 3 Growth (%) 4<br />
Employment<br />
Growth (%) 5<br />
Unemployment<br />
Rate (%) 6<br />
South Georgia<br />
Lowndes 4 $ 239,918 $ 244,465 20.32 104,583 13.5 -3.4 8.2<br />
Cook 7 1 11,688 49,558 26.04 16,608 5.3 -3.3 12.0<br />
Decatur 3 38,295 114,200 29.64 28,823 2.1 -2.3 12.7<br />
Grady 1 11,423 20,287 8.48 25,115 6.2 -2.6 9.8<br />
Appling 7 1 13,200 37,771 15.39 18,038 3.6 2.0 10.3<br />
Jeff Davis 7 1 8,966 47,874 29.14 13,486 6.3 -4.2 14.2<br />
Bulloch 7 2 32,737 50,515 4.87 67,761 21.0 -2.1 9.2<br />
13 $ 356,227 $ 564,670<br />
North Georgia<br />
Henry 2 $161,750 $65,780 3.47 191,502 60.5 -6.7 10.3<br />
Hall 1 138,732 39,084 1.62 184,814 32.7 -5.5 9.2<br />
Oconee 1 41,926 15,515 1.97 32,221 22.9 -2.8 6.2<br />
4 $342,408 $120,379<br />
State of Georgia 20.1 -5.5 10.3<br />
Florida<br />
Marion 1 $71,407 $174,221 3.36 329,628 27.3 -4.7 13.0<br />
State of Florida 16.0 -4.6 11.1<br />
National Total 9.1 -3.7 9.6<br />
Employees<br />
As of December 31, 2009, we had a total of 270 full-time and seven part-time employees. We consider our relationship<br />
with our employees to be excellent.<br />
Availability of Information<br />
More information on the Company is available on our internet website at www.<strong>pab</strong><strong>bankshares</strong>.com and on the Bank at<br />
www.parkavebank.com. We are not <strong>inc</strong>orporating by reference into this Report the information contained on our websites<br />
and, therefore, the content of our websites is not a part of this Report. Copies of this Report and other reports filed or<br />
furnished pursuant to Section 13(a) or 15(d) of the Exchange Act, <strong>inc</strong>luding exhibits, are available free of charge on our<br />
website under the “Investor Relations” link as soon as reasonably practicable after they have been filed or furnished<br />
electronically to the SEC. Copies of these filings may also be obtained free of charge on the SEC’s website at<br />
www.sec.gov.<br />
1 Dollar amounts are presented in thousands as of December 31, 2009. Amounts exclude $35.3 million in loans and $185.9 million in deposits assigned<br />
to the “Treasury” that are not allocated to any particular market (i.e. participation loans, employee and director accounts, brokered deposits, official<br />
checks, etc.).<br />
2 Based on the FDIC/OTS Summary of Deposits report as of June 30, 2009.<br />
3 Estimated July 1, 2008 population provided by the U.S. Census Bureau.<br />
4 Estimated percentage population change from 2000 to 2008 for counties and change from 2000 to 2009 for states and national totals provided by the<br />
U.S. Census Bureau.<br />
5 Total employment growth (not seasonally adjusted) for the Third Quarter 2009 Year-To-Date percentage change from the prior year’s Year-To-Date<br />
data provided by the Bureau of Labor Statistics Household Survey.<br />
6 Unemployment rate (not seasonally adjusted) for the Third Quarter 2009 provided by the Bureau of Labor Statistics.<br />
7 We entered into a Purchase and Assumption Agreement on February 23, 2010 to sell our branches in these markets.<br />
8
Supervision and Regulation<br />
The banking industry is heavily regulated at both the federal and state levels. Legislation and regulations authorized by<br />
legislation influence, among other things:<br />
• How, when and where we may expand geographically;<br />
• Into what product or service market we may enter;<br />
• How we must manage our assets; and<br />
• Under what circumstances money may or must flow between the parent bank holding company and the<br />
subsidiary bank.<br />
Written Agreement with the Federal Reserve and the Georgia Department<br />
On July 14, 2009, we entered into a Written Agreement with the Board of Governors of the Federal Reserve (the “Federal<br />
Reserve”) and the Georgia Department of Banking and Finance (the “Georgia Department”). The Written Agreement is<br />
based on the findings of the Federal Reserve and the Georgia Department during an examination conducted as of<br />
January 19, 2009 (the “Examination”). Under the terms of the Written Agreement, the Bank is required to prepare and<br />
submit written plans and reports to the regulators that address the following items: strengthening the Bank’s credit risk<br />
management practices; improving loan underwriting and loan administration; improving asset quality, <strong>inc</strong>luding improving<br />
the Bank’s position on problem loans through repayment, additional collateral or other means; reviewing and revising as<br />
necessary the Bank’s allowance for loan and lease losses policy; maintaining sufficient capital at the Bank; revising and<br />
implementing a profitability plan and comprehensive budget to improve and sustain the Bank’s earnings; and improving<br />
the Bank’s liquidity position and funds management practices. We initially submitted the requested plans to the regulators<br />
for their review on August 26, 2009 and we continue to supplement these plans and reports in response to comments and<br />
requests from our regulators. While the Written Agreement remains in place, we may not pay dividends and we may not<br />
<strong>inc</strong>rease debt or redeem any shares of our stock without the prior written consent of our regulators.<br />
S<strong>inc</strong>e the completion of the Examination, the boards of directors of PAB and the Bank have aggressively taken steps to<br />
address the findings of the Examination. We have taken an active role in working with the Federal Reserve and the<br />
Georgia Department to improve the condition of the Bank and are addressing the items <strong>inc</strong>luded in the Written Agreement<br />
on a continuing basis, <strong>inc</strong>luding establishing new commercial real estate loan concentration limits, new policies on the use<br />
of interest reserves, and comprehensive underwriting criteria for commercial credit analysis. We have also developed<br />
plans to strengthen our problem asset management function and to reduce the level of problem assets on our balance sheet<br />
over a period of time. We are engaged in ongoing dialogue with our regulators to comply with the terms of the Written<br />
Agreement.<br />
In September 2009, the Federal Reserve and Georgia Department conducted a subsequent examination. In response to<br />
concerns raised by our regulators in this examination, we have engaged an independent consultant to evaluate the<br />
qualifications of our directors and executive officers, and we hired W. Keith Morris, a banker with over 30 years<br />
experience in lending, credit management and problem asset resolution, to lead our Special Assets Group in resolving our<br />
problem loans.<br />
If we fail to adequately address the regulatory concerns in the Written Agreement, our banking regulators may take further<br />
action <strong>inc</strong>luding, but not limited to, additional requirements for maintaining sufficient capital under the Written<br />
Agreement. An ongoing failure to adequately address the concerns of our regulators could ultimately result in the eventual<br />
appointment of a receiver or conservator of the Bank’s assets.<br />
Set forth below is an explanation of the major pieces of legislation affecting our industry and how that legislation affects<br />
our actions.<br />
General<br />
PAB is a bank holding company registered with the Federal Reserve and the Georgia Department under the Bank Holding<br />
Company Act of 1956, as amended (the “BHC Act”) and the <strong>Financial</strong> Institutions Code of Georgia, respectively.<br />
The Bank is a member of the Federal Deposit Insurance Corporation (“FDIC”), and as such, our deposits are insured by<br />
the FDIC to the maximum extent provided by law. The Bank is also a state member bank of the Federal Reserve and it is<br />
subject to regulation, supervision, and examination by the Federal Reserve and the Georgia Department. These regulatory<br />
agencies regularly examine our operations and are given authority to approve or disapprove mergers, consolidations, the<br />
establishment of branches, and similar corporate actions. The agencies also have the power to prevent the continuance or<br />
development of unsafe or unsound banking practices or other violations of law.<br />
9
Acquisitions<br />
The BHC Act requires every bank holding company to obtain the prior approval of the Federal Reserve before: (i) it may<br />
acquire direct or indirect ownership or control of any voting shares of any bank if, after such acquisition, the bank holding<br />
company will directly or indirectly own or control more than 5% of the voting shares of the bank; (ii) it or any of its<br />
subsidiaries, other than a bank, may acquire all or substantially all of the assets of any bank; or (iii) it may merge or<br />
consolidate with any other bank holding company.<br />
Under the Riegle-Neal Interstate Banking and Branching Efficiency Act, the restrictions on interstate acquisitions of banks<br />
by bank holding companies were repealed. As a result, PAB, and any other bank holding company located in Georgia, is<br />
able to acquire a bank located in any other state, and a bank holding company located outside of Georgia can acquire any<br />
Georgia-based bank, in either case subject to certain deposit percentage and other restrictions. De novo branching by an<br />
out-of-state bank is permitted only if it is expressly permitted by the laws of the host state. Georgia does not permit de<br />
novo branching by an out-of-state bank. Therefore, the only method by which an out-of-state bank or bank holding<br />
company may enter Georgia is through an acquisition.<br />
Activities<br />
The BHC Act has generally prohibited a bank holding company from engaging in activities other than banking or<br />
managing or controlling banks or other permissible subsidiaries and from acquiring or retaining direct or indirect control<br />
of any company engaged in any activities other than those determined by the Federal Reserve to be closely related to<br />
banking or managing or controlling banks as to be a proper <strong>inc</strong>ident thereto. Provisions of the Gramm-Leach-Bliley Act<br />
(the “GLB Act”), discussed below, have expanded the permissible activities of a bank holding company that qualifies as a<br />
financial holding company. In determining whether a particular activity is permissible, the Federal Reserve must consider<br />
whether the performance of such an activity can be reasonably expected to produce benefits to the public, such as a greater<br />
convenience, <strong>inc</strong>reased competition, or gains in efficiency, that outweigh possible adverse effects such as undue<br />
concentration of resources, decreased or unfair competition, conflicts of interest, or unsound banking practices.<br />
Gramm-Leach-Bliley Act<br />
The GLB Act implemented major changes to the statutory framework for providing banking and other financial services in<br />
the United States. The GLB Act, among other things, eliminated many of the restrictions on affiliations among banks and<br />
securities firms, insurance firms, and other financial service providers. A bank holding company that qualifies as a<br />
financial holding company is permitted to engage in activities that are financial in nature or <strong>inc</strong>idental or complimentary to<br />
a financial activity. The GLB Act specifies certain activities that are deemed to be financial in nature, <strong>inc</strong>luding<br />
underwriting and selling insurance, providing financial and investment advisory services, underwriting, dealing in, or<br />
making a market in securities, limited merchant banking activities, and any activity currently permitted for bank holding<br />
companies under Section 4(c)(8) of the BHC Act.<br />
To become eligible for these expanded activities, a bank holding company must qualify as a financial holding company.<br />
To qualify as a financial holding company, each insured depository institution controlled by the bank holding company<br />
must be well-capitalized, well-managed, and have at least a satisfactory rating under the Community Reinvestment Act. In<br />
addition, the bank holding company must file a declaration with the Federal Reserve of its intention to become a financial<br />
holding company.<br />
The GLB Act designates the Federal Reserve as the overall umbrella supervisor of financial holding companies. The GLB<br />
Act adopts a system of functional regulation where the primary regulator is determined by the nature of activity rather than<br />
the type of institution. Under this pr<strong>inc</strong>iple, securities activities are regulated by the SEC and other securities regulators,<br />
insurance activities by the state insurance authorities, and banking activities by the appropriate banking regulator. As a<br />
result, to the extent that we engage in non-banking activities permitted under the GLB Act, we will be subject to the<br />
regulatory authority of the SEC or state insurance authority, as applicable.<br />
10
Payment of Dividends<br />
PAB is a legal entity separate and dist<strong>inc</strong>t from its subsidiaries. Its pr<strong>inc</strong>ipal source of cash flow is dividends from its<br />
subsidiary bank. There are statutory and regulatory limitations on the payment of dividends by its operating subsidiary,<br />
the Bank, to PAB, as well as by PAB to its stockholders. Under the terms of the Written Agreement, we may not pay<br />
dividends without prior written consent of our regulators.<br />
The federal banking agencies have indicated that paying dividends that deplete a depository institution's capital base to an<br />
inadequate level would be an unsafe and unsound banking practice. Under the Federal Deposit Insurance Corporation<br />
Improvement Act of 1991 (“FDICIA”), a depository institution may not pay any dividend if payment would cause it to<br />
become undercapitalized or if it already is undercapitalized. See “Prompt Corrective Action”. Moreover, the federal<br />
agencies have issued policy statements that provide that bank holding companies and insured banks should generally pay<br />
dividends only out of current operating earnings.<br />
In addition, the Federal Reserve, through guidance reissued on February 24, 2009, also has supervisory policies and<br />
guidance that:<br />
• may restrict the ability of a bank or financial services holding company from paying dividends on any class of<br />
capital stock or any other Tier 1 capital instrument if the holding company is not deemed to have a strong capital<br />
position,<br />
• states that a holding company should reduce or eliminate dividends when<br />
• the holding company’s net <strong>inc</strong>ome available to shareholders for the past four quarters, net of dividends<br />
previously paid during that period, is not sufficient to fully fund the dividends;<br />
• the holding company’s prospective rate of earnings retention is not consistent with the holding<br />
company’s capital needs and overall current and prospective financial condition; or<br />
• the holding company will not meet, or is in danger of not meeting, its minimum regulatory capital<br />
adequacy ratios.<br />
• requires that a holding company must inform the Federal Reserve in advance of declaring or paying a dividend<br />
that exceeds earnings for the period (e.g., quarter) for which the dividend is being paid or that could result in a<br />
material adverse change to the organization’s capital structure. Declaring or paying a dividend in either<br />
circumstance could raise supervisory concerns.<br />
In the current financial and economic environment, the Federal Reserve has indicated that bank holding companies should<br />
carefully review their dividend policy and has discouraged payment ratios that are at maximum allowable levels unless<br />
both asset quality and capital are very strong. During 2008, PAB paid a total of $.24 per share in cash dividends and a 2%<br />
stock dividend to its stockholders. In the third quarter of 2008, we suspended our quarterly dividends to shareholders due<br />
to a decline in earnings. We did not pay a dividend during 2009 and we do not intend to pay a dividend in 2010 due to<br />
continued pressure on earnings and capital and as a result of the Written Agreement.<br />
Capital Adequacy<br />
We are required to comply with the capital adequacy standards established by the federal banking agencies. There are two<br />
basic measures of capital adequacy for bank holding companies that have been promulgated by the Federal Reserve: a riskbased<br />
measure and a leverage measure. All applicable capital standards must be satisfied for a bank holding company to<br />
be considered in compliance.<br />
The risk-based capital standards are designed to make regulatory capital requirements more sensitive to differences in risk<br />
profiles among banks and bank holding companies, to account for off-balance-sheet exposure, and to minimize<br />
dis<strong>inc</strong>entives for holding liquid assets. Assets and off-balance-sheet items are assigned to broad risk categories, each with<br />
appropriate weights. The resulting capital ratios represent capital as a percentage of total risk-weighted assets and offbalance-sheet<br />
items.<br />
11
The minimum guideline for the ratio of Total Capital to risk-weighted assets (<strong>inc</strong>luding certain off-balance-sheet items,<br />
such as standby letters of credit) is 8.0%. Total Capital consists of Tier 1 Capital, which is comprised of common stock,<br />
undivided profits, minority interests in the equity accounts of consolidated subsidiaries and non-cumulative perpetual<br />
preferred stock, less goodwill and certain other intangible assets, and Tier 2 Capital, which consists of subordinated debt,<br />
other preferred stock, and a limited amount of loan loss reserves. At December 31, 2009, our consolidated Total Capital<br />
Ratio and our Tier 1 Capital Ratio were 8.08% and 6.81%, respectively, and we had the requisite capital level to qualify as<br />
“adequately capitalized” under the regulatory framework for prompt corrective action.<br />
In addition, the Federal Reserve has established minimum leverage ratio guidelines for bank holding companies. These<br />
guidelines provide for a minimum ratio (the “Leverage Ratio”) of Tier 1 Capital to average assets, less goodwill and<br />
certain other intangible assets, of 3.0% for bank holding companies that meet certain specified criteria, <strong>inc</strong>luding those<br />
having the highest regulatory rating. All other bank holding companies generally are required to maintain a Leverage<br />
Ratio of at least 3.0%, plus an additional cushion of 100 to 200 basis points. Our Leverage Ratio at December 31, 2009<br />
was 4.73%. The guidelines also provide that bank holding companies experiencing internal growth or making acquisitions<br />
will be expected to maintain strong capital positions substantially above the minimum supervisory levels without<br />
significant reliance on intangible assets. Furthermore, the Federal Reserve has indicated that it will consider a “tangible<br />
Tier 1 Capital Leverage Ratio” (deducting all intangibles) and other indicators of capital strength in evaluating proposals<br />
for expansion or new activities.<br />
The Bank is subject to risk-based and leverage capital requirements adopted by its federal banking regulators, which are<br />
substantially similar to those adopted by the Federal Reserve for bank holding companies.<br />
Failure to meet capital guidelines could subject a bank or bank holding company to a variety of enforcement remedies,<br />
<strong>inc</strong>luding issuance of a capital directive, the termination of deposit insurance by the FDIC, a prohibition on the taking of<br />
brokered deposits, and certain other restrictions on its business. As described below, substantial additional restrictions can<br />
be imposed upon FDIC-insured depository institutions that fail to meet applicable capital requirements. See “Prompt<br />
Corrective Action.”<br />
The federal bank agencies continue to indicate their desire to raise capital requirements applicable to banking<br />
organizations beyond their current levels. In this regard, the Federal Reserve and the FDIC require regulators to consider<br />
interest rate risk (when the interest rate sensitivity of an institution's assets does not match the sensitivity of its liabilities or<br />
its off-balance-sheet position) in the evaluation of a bank's capital adequacy. The regulatory agencies have proposed a<br />
methodology for evaluating interest rate risk that would require banks with excessive interest rate risk exposure to hold<br />
additional amounts of capital against such exposures.<br />
Support of Subsidiary Institutions<br />
Under Federal Reserve policy, we are expected to act as a source of financial strength for, and to commit resources to<br />
support, the Bank. This support may be required at times when, absent such Federal Reserve policy, we may not be<br />
<strong>inc</strong>lined to provide such support. In addition, any capital loans by a bank holding company to any of its banking<br />
subsidiaries are subordinate in right of payment to deposits and to certain other indebtedness of such subsidiary banks. In<br />
the event of a bank holding company's bankruptcy, any commitment by a bank holding company to a federal bank<br />
regulatory agency to maintain the capital of a banking subsidiary will be assumed by the bankruptcy trustee and entitled to<br />
a priority of payment.<br />
Prompt Corrective Action<br />
FDICIA established a system of prompt corrective action to resolve the problems of undercapitalized institutions. Under<br />
this system, the federal banking regulators have established five capital categories (well capitalized, adequately<br />
capitalized, undercapitalized, significantly undercapitalized and critically undercapitalized), and are required to take<br />
certain mandatory supervisory actions, and are authorized to take other discretionary actions, with respect to institutions in<br />
the three undercapitalized categories. The severity of the action will depend upon the capital category in which the<br />
institution is placed. Generally, subject to a narrow exception, the banking regulator must appoint a receiver or<br />
conservator for an institution that is critically undercapitalized. The federal banking agencies have specified by regulation<br />
the relevant capital level for each category.<br />
12
An institution that is categorized as undercapitalized, significantly undercapitalized, or critically undercapitalized is<br />
required to submit an acceptable capital restoration plan to its appropriate federal banking agency. A bank holding<br />
company must guarantee that a subsidiary depository institution meets its capital restoration plan, subject to certain<br />
limitations. The controlling holding company's obligation to fund a capital restoration plan is limited to the lesser of 5.0%<br />
of an undercapitalized subsidiary's assets or the amount required to meet regulatory capital requirements. An<br />
undercapitalized institution is also generally prohibited from <strong>inc</strong>reasing its average total assets, making acquisitions,<br />
establishing any branches or engaging in any new line of business, except under an accepted capital restoration plan or<br />
with FDIC approval. In addition, the appropriate federal banking agency may treat an undercapitalized institution in the<br />
same manner as it treats a significantly undercapitalized institution if it determines that those actions are necessary.<br />
At December 31, 2009, the Bank had the requisite capital level to qualify as “adequately capitalized” under the regulatory<br />
framework for prompt corrective action. If the Bank were to fail to meet capital guidelines for “adequately capitalized,”<br />
the Bank could be subject to a variety of enforcement remedies from its regulators.<br />
FDIC Insurance Assessments<br />
The FDIC establishes rates for the payment of premiums by federally insured banks and thrifts for deposit insurance.<br />
Member institutions pay deposit insurance assessments to the Deposit Insurance Fund (the “DIF”). The FDIC recently<br />
amended its risk-based assessment system to implement authority that the FDIC was granted under the Federal Deposit<br />
Insurance Reform Act of 2005 (the “Reform Act”). Under the revised system, insured institutions are assigned to one of<br />
four risk categories based on supervisory evaluations, regulatory capital levels and other factors. The new regulation<br />
allows the FDIC to more closely tie each financial institution’s deposit insurance premiums to the risk it poses to the DIF.<br />
The assessment rate of an institution depends upon the category to which it is assigned. Risk Category I contains the least<br />
risky depository institutions and Risk Category IV contains the most risky depository institutions. The Risk Category is<br />
based on whether the institution is Well Capitalized, Adequately Capitalized, or Undercapitalized in regard to the<br />
institutions capital ratios. The CAMELS rating of the institution is also used in the determination of the Risk Category.<br />
Risk Category I, unlike the other risk categories, contains further risk differentiation based on the FDIC’s analysis of<br />
financial ratios, examination components and other information. In the first quarter of 2009, the FDIC <strong>inc</strong>reased the<br />
amount to be assessed from financial institutions by <strong>inc</strong>reasing its risk-based deposit insurance assessment scale uniformly<br />
due to the <strong>inc</strong>reased and anticipated number of bank failures. Thus, the assessment scale ranges from twelve basis points<br />
of assessable deposits for the strongest institutions (Risk Category I) to forty-five basis points for the weakest (Risk<br />
Category IV). In 2008 the FDIC <strong>inc</strong>reased the amount of deposits it insures from $100,000 to $250,000. This <strong>inc</strong>rease in<br />
insured deposits is temporary and will continue through December 31, 2013.<br />
In addition to the assessments for deposit insurance, institutions are required to make payments on bonds which were<br />
issued in the late 1980s by the Financing Corporation in order to recapitalize the predecessor to the Savings Association<br />
Insurance Fund. During 2008, Financing Corporation payments for Savings Association Insurance Fund members<br />
approximated 1.12 basis points of assessable deposits. These assessments, which are adjusted quarterly, will continue until<br />
the Financing Corporation bonds mature in 2017.<br />
The FDIC may terminate its insurance of deposits if it finds that the institution has engaged in unsafe and unsound<br />
practices, is in an unsafe or unsound condition to continue operations or has violated any applicable law, regulation, rule,<br />
order or condition imposed by the FDIC.<br />
On October 14, 2008, the FDIC announced the creation of the Temporary Liquidity Guarantee Program (the “TLGP”),<br />
which seeks to strengthen confidence and encourage liquidity in the banking system. The TLGP has two primary<br />
components that are available on a voluntary basis to financial institutions: (1) the Transaction Account Guarantee<br />
Program (“TAGP”) and (2) the Debt Guarantee Program (“DGP”) The TAGP provides unlimited deposit insurance<br />
coverage through June 30, 2010 for noninterest-bearing transaction accounts (typically business checking accounts) and<br />
certain funds swept into noninterest-bearing savings accounts. Institutions participating in the TAGP pay a 15 to 25 basis<br />
points fee (annualized), according to the institution’s risk category on the balance of each covered account in excess of<br />
$250,000, while the extra deposit insurance is in place. Under the DGP the FDIC guarantees certain senior unsecured debt<br />
of FDIC-insured institutions and their holding companies. The unsecured debt must have been issued on or after October<br />
14, 2008 and not later than June 30, 2009, and the guarantee is effective through the earlier of the maturity date or June 30,<br />
2012. The DGP coverage limit is generally 125% of the eligible entity’s eligible debt outstanding on September 30, 2008<br />
and scheduled to mature on or before June 30, 2009 or, for certain insured institutions, 2% of their liabilities as of<br />
September 30, 2008. Depending on the term of the debt maturity, the nonrefundable DGP fee ranges from 50 to 100 basis<br />
points (annualized) for covered debt outstanding until the earlier of maturity or June 30, 2012. The TAGP and DGP are in<br />
effect for all eligible entities, unless the entity opted out on or before December 5, 2008. The Bank did not opt out of the<br />
program and we are participating in both the TAGP and the DGP. In February 2009, we issued $20 million of three-year<br />
unsecured debt under the DGP.<br />
13
Safety and Soundness Standards<br />
The Federal Deposit Insurance Act, as amended by the FDICIA and the Riegle Community Development and Regulatory<br />
Improvement Act of 1994, requires the federal bank regulatory agencies to prescribe standards, by regulations or<br />
guidelines, relating to internal controls, information systems and internal audit systems, loan documentation, credit<br />
underwriting, interest rate risk exposure, asset growth, asset quality, earnings, stock valuation and compensation, fees and<br />
benefits, and such other operational and managerial standards as the agencies deem appropriate. The federal bank<br />
regulatory agencies have adopted a set of guidelines prescribing safety and soundness standards pursuant to FDICIA, as<br />
amended. The guidelines establish general standards relating to internal controls and information systems, internal audit<br />
systems, loan documentation, credit underwriting, interest rate exposure, asset growth and compensation and fees and<br />
benefits. In general, the guidelines require, among other things, appropriate systems and practices to identify and manage<br />
the risks and exposures specified in the guidelines. The guidelines prohibit excessive compensation as an unsafe and<br />
unsound practice and describe compensation as excessive when the amounts paid are unreasonable or disproportionate to<br />
the services performed by an executive officer, employee, director, or pr<strong>inc</strong>ipal shareholder. In addition, the agencies<br />
adopted regulations that authorize, but do not require, an agency to order an institution that has been given notice by an<br />
agency that it is not satisfying any of such safety and soundness standards to submit a compliance plan. If, after being so<br />
notified, an institution fails to submit an acceptable compliance plan or fails in any material respect to implement an<br />
acceptable compliance plan, the agency must issue an order directing action to correct the deficiency and may issue an<br />
order directing other actions of the types to which an undercapitalized institution is subject under the “prompt corrective<br />
action” provisions of FDICIA. See “Prompt Corrective Action”. If an institution fails to comply with such an order, the<br />
agency may seek to enforce such order in judicial proceedings and to impose civil money penalties. The federal regulatory<br />
agencies also proposed guidelines for asset quality and earnings standards.<br />
Community Reinvestment Act<br />
Under the Community Reinvestment Act (“CRA”) the Bank, as an FDIC insured institution, has a continuing and<br />
affirmative obligation to help meet the credit needs of the entire community, <strong>inc</strong>luding low- and moderate-<strong>inc</strong>ome<br />
neighborhoods, consistent with safe and sound banking practices. The CRA requires the appropriate federal regulator, in<br />
connection with its examination of an insured institution, to assess the institution's record of meeting the credit needs of its<br />
community and to take such record into account in its evaluation of certain applications, such as applications for a merger<br />
or the establishment of a branch. An unsatisfactory rating may be used as the basis for the denial of an application by the<br />
federal banking regulator. The Bank received satisfactory ratings in its most recent CRA examinations.<br />
Restrictions on Transactions with Affiliates<br />
PAB and the Bank are subject to the provisions of Section 23A of the Federal Reserve Act. Section 23A places limits on:<br />
the amount of a bank’s loans or extensions of credit to affiliates; a bank’s investment in affiliates; assets a bank may<br />
purchase from affiliates, except for real and personal property exemption by the Federal Reserve; the amount of loans or<br />
extensions of credit to third parties collateralized by the securities or obligations of affiliates; and a bank’s guarantee,<br />
acceptance or letter of credit issued on behalf of an affiliate.<br />
The total amount of the above transactions is limited in amount, as to any one affiliate, to 10.0% of a bank’s capital and<br />
surplus and, as to all affiliates combined, to 20.0% of a bank’s capital and surplus. In addition to the limitation on the<br />
amount of these transactions, each of the above transactions must also meet specified collateral requirements. The Bank<br />
must also comply with other provisions designed to avoid the taking of low-quality assets.<br />
PAB and the Bank are also subject to the provisions of Section 23B of the Federal Reserve Act which, among other things,<br />
prohibit an institution from engaging in the above transactions with affiliates unless the transactions are on terms<br />
substantially the same, or at least as favorable to the institution or its subsidiaries, as those prevailing at the time for<br />
comparable transactions with nonaffiliated companies.<br />
The Bank is also subject to restrictions on extensions of credit to its executive officers, directors, pr<strong>inc</strong>ipal shareholders<br />
and their related interests. These extensions of credit must be made on substantially the same terms, <strong>inc</strong>luding interest<br />
rates and collateral, as those prevailing at the time for comparable transactions with third parties, and must not involve<br />
more than the normal risk of repayment or present other unfavorable features.<br />
Effect of Governmental Monetary Policies<br />
The earnings of the Bank are affected by domestic and foreign conditions, particularly by the monetary and fiscal policies<br />
of the United States government and its agencies. The Federal Reserve has had, and will continue to have, an important<br />
impact on the operating results of commercial banks through its power to implement monetary policy in order, among<br />
other things, to mitigate recessionary and inflationary pressures by regulating the national money supply. The techniques<br />
used by the Federal Reserve <strong>inc</strong>lude setting the reserve requirements of member banks and establishing the discount rate<br />
on member bank borrowings. The Federal Reserve also conducts open market transactions in United States government<br />
securities.<br />
14
USA Patriot Act of 2001<br />
In October 2001, the USA Patriot Act of 2001 (the “Patriot Act”) was enacted in response to the terrorist attacks in New<br />
York, Pennsylvania, and Washington, D.C. that occurred on September 11, 2001. The Patriot Act impacts financial<br />
institutions in particular through its anti-money laundering and financial transparency laws. The Patriot Act amended the<br />
Bank Secrecy Act and the rules and regulations of the Office of Foreign Assets Control to establish regulations which,<br />
among others, set standards for identifying customers who open an account and promoting cooperation with law<br />
enforcement agencies and regulators in order to effectively identify parties that may be associated with, or involved in,<br />
terrorist activities or money laundering.<br />
On March 2, 2006, Congress passed the USA Patriot Act Improvement and Reauthorization Act of 2005. This act<br />
reauthorized all provisions of the Patriot Act that would otherwise have expired, made 14 of the 16 sunsetting provisions<br />
permanent, and extended the sunset period of the remaining two for an additional four years.<br />
Recent Legislation and Regulatory Action<br />
New regulations and statutes are regularly proposed that contain wide-ranging proposals for altering the structures,<br />
regulations, and competitive relationships of the nation’s financial institutions. Included among current proposals are<br />
discussions around restructuring the regulatory framework in which we and our subsidiary bank operate. Further, under<br />
the Emergency Economic Stabilization Act of 2008 (“EESA”), Congress has the ability to impose “after-the-fact” terms<br />
and conditions on participants in the Capital Purchase Program administered under the Troubled Asset Relief Program<br />
(“TARP”). We did not participate in the Capital Purchase Program. On February 10, 2009, the Treasury announced the<br />
<strong>Financial</strong> Stability Plan under the EESA (the “<strong>Financial</strong> Stability Plan”) which is intended to further stabilize financial<br />
institutions and stimulate lending across a broad range of economic sectors. On February 18, 2009, President Obama<br />
signed the America Recovery and Reinvestment Act (“ARRA”), a broad economic stimulus package that <strong>inc</strong>luded<br />
additional restrictions on, and potential additional regulation of, financial institutions. Additional regulations adopted as<br />
part of the EESA, the <strong>Financial</strong> Stability Plan, the ARRA, or other legislation may subject us to additional regulatory<br />
requirements. We cannot predict whether or in what form any proposed regulation or statute will be adopted or the extent<br />
to which our business may be affected by any new regulation or statute.<br />
ITEM 1A. RISK FACTORS<br />
Our business is subject to certain risks, <strong>inc</strong>luding those described below. The risks below do not describe all risks<br />
applicable to our business and are intended only as a summary of certain material factors that affect our operations in our<br />
industry and markets. New risks may emerge at any time, and we cannot predict such risks or estimate the extent to which<br />
they may affect our financial performance in which we operate. More detailed information concerning these and other<br />
risks is contained in other sections of this Report, <strong>inc</strong>luding “Business” and “Management’s Discussion and Analysis of<br />
<strong>Financial</strong> Condition and Results of Operations.”<br />
We have entered into a written agreement with our regulators that requires us to take specified actions.<br />
On July 14, 2009, we entered into a Written Agreement with the Federal Reserve Bank of Atlanta and the Georgia<br />
Department of Banking and Finance. The failure to comply with the terms of the Written Agreement could result in<br />
significant enforcement actions against us of <strong>inc</strong>reasing severity, up to and <strong>inc</strong>luding a regulatory takeover of our bank<br />
subsidiary. Under the terms of the Written Agreement, the Bank has prepared and submitted written plans and reports to<br />
the regulators that address the following items: strengthening the Bank’s credit risk management practices; improving loan<br />
underwriting and loan administration; improving asset quality, <strong>inc</strong>luding improving the Bank’s position on problem loans<br />
through repayment, additional collateral or other means; reviewing and revising as necessary the Bank’s allowance for<br />
loan and lease losses policy; maintaining sufficient capital at the Bank; revising and implementing a profitability plan and<br />
comprehensive budget to improve and sustain the Bank’s earnings; and improving the Bank’s liquidity position and funds<br />
management practices. We may supplement these plans and reports in the future in response to comments and requests<br />
from our regulators. In addition, we may have to agree to maintain higher capital ratios than we currently maintain.<br />
While the Written Agreement remains in place, we may not pay dividends and take certain other actions, and we may not<br />
<strong>inc</strong>rease debt or redeem any shares of our stock without the prior written consent of the regulators. The Bank’s regulators<br />
have considerable discretion in whether to grant required approvals, and we may not be able to obtain those approvals if<br />
requested, which would affect our ability to resume payments of dividends or distributions in the future.<br />
If we fail to comply with the terms of our Written Agreement, the regulators have broad authority to take additional<br />
actions against PAB, <strong>inc</strong>luding assessing civil fines and penalties, imposing cease and desist orders and removing officers<br />
and directors, as well as taking control of the Bank.<br />
15
Difficult market conditions and economic trends have adversely affected our industry and our business and may<br />
continue to do so.<br />
Our business has been directly affected by market conditions, trends in industry and finance, legislative and regulatory<br />
changes, and changes in governmental monetary and fiscal policies and inflation, all of which are beyond our control.<br />
Beginning in the second half of 2007 and continuing through 2010, the financial markets were highlighted by significant<br />
volatility associated with subprime mortgages, <strong>inc</strong>luding adverse impacts on credit quality and liquidity within the<br />
financial markets. As a result of this significant downturn, we have experienced dramatic declines in the housing market<br />
with decreasing home prices and <strong>inc</strong>reasing delinquencies and foreclosures, which have negatively impacted the credit<br />
performance of our loans and resulted in <strong>inc</strong>reases in the level of our nonperforming assets and charge-offs of problem<br />
loans. At the same time, competition among depository institutions for deposits has <strong>inc</strong>reased significantly. Bank and<br />
bank holding company stock prices have been negatively affected, as has the ability of banks and bank holding companies<br />
to raise capital or borrow in the debt markets compared to recent years. These market conditions and the tightening of<br />
credit have led to <strong>inc</strong>reased deficiencies in our loan portfolio, <strong>inc</strong>reased market volatility and widespread reduction in<br />
general business activity.<br />
As a result of the negative developments in the financial industry, new federal and state laws and regulations regarding<br />
lending and funding practices and liquidity standards have been enacted, and bank regulatory agencies have been, and are<br />
expected to continue to be, aggressive in responding to concerns and trends identified in examinations. Difficult market<br />
conditions and the impact of the new legislation in response to those developments could restrict our business operations,<br />
<strong>inc</strong>luding our ability to originate loans. If the communities in which we operate do not recover and grow as anticipated or<br />
if prevailing economic conditions locally or nationally do not improve, our business may continue to be negatively<br />
impacted. The current economic downturn, <strong>inc</strong>rease in unemployment, and other events that have negatively affected<br />
household and/or corporate <strong>inc</strong>omes both nationally and locally have decreased the demand for loans and our other<br />
products and services and have <strong>inc</strong>reased the number of customers who fail to pay interest or pr<strong>inc</strong>ipal on their loans.<br />
Furthermore, if the economy improves in the future, we may not benefit from any market growth or favorable economic<br />
conditions in our market areas if they do occur.<br />
Due to our high concentration of loans secured by real estate, deteriorating conditions in our North Georgia and<br />
Florida markets have adversely affected us and may continue to do so, leading to higher loan charge-offs or an<br />
<strong>inc</strong>rease in our provision for loan losses.<br />
As of December 31, 2009, approximately 86% of our total loans were secured by real estate. In 2007, the housing and real<br />
estate sectors in our markets experienced an economic downturn that accelerated through 2009 and has continued in 2010.<br />
The downturn has most affected us in our North Georgia market, particularly on the south side of Atlanta, and in our<br />
Florida market. We had a significant presence in residential construction and development lending in both of these<br />
markets. At December 31, 2009, approximately 51% of our residential construction and development loans, 25% of our<br />
residential mortgages and approximately 59% of our nonperforming assets were in our North Georgia markets, while 15%<br />
of our residential construction and development loans, 5% of our residential mortgages and approximately 23% of our<br />
nonperforming assets were in our Florida market. The majority of our customers who were residential builders carried<br />
inventories of lots for new construction. The supply of vacant, developed lots has <strong>inc</strong>reased dramatically as the number of<br />
new building permits and housing starts decreased. In addition, between August 2008 and February 2010, the FDIC<br />
placed over 50 Georgia- and Florida-based financial institutions into receivership, and we believe that others will be placed<br />
in receivership in the future. The subsequent sale of the assets of these financial institutions at depressed prices could<br />
continue to negatively affect the value of our real estate collateral and other real estate owned. We believe that it may take<br />
more than five years for the market to fully absorb the existing lot inventories in some areas on the south side of the<br />
Atlanta market. If economic conditions continue to worsen or deteriorate, it could lead to additional charge-offs and<br />
further <strong>inc</strong>reases in our allowance for loan losses.<br />
16
If our allowance for loan losses is not sufficient to cover actual loan losses, or if credit delinquencies <strong>inc</strong>rease, our<br />
losses could <strong>inc</strong>rease.<br />
Our success depends, to a significant extent, on the quality of our assets, particularly loans. Like other financial<br />
institutions, we face the risk that our customers will not repay their loans, that the collateral securing the payment of those<br />
loans may be insufficient to assure repayment, and that we may be unsuccessful in recovering the remaining loan balances.<br />
The risk of loss varies with, among other things, general economic conditions, the type of loan being made, the<br />
creditworthiness of the borrower over the term of the loan and, for many of our loans, the value of the real estate and other<br />
assets serving as collateral. Management makes various assumptions and judgments about the collectibility of our loan<br />
portfolio after considering these and other factors. Based in part on those assumptions and judgments, we maintain an<br />
allowance for loan losses in an attempt to cover any loan losses that may occur. In determining the size of the allowance,<br />
we also rely on an analysis of our loan portfolio based on historical loss experience, volume and types of loans, trends in<br />
classification, delinquencies and non-accruals, national and local economic conditions and other pertinent information,<br />
<strong>inc</strong>luding the results of external loan reviews. Despite our efforts, our loan assessment techniques may fail to properly<br />
account for potential loan losses, and, as a result, our established loan loss reserves may prove insufficient. If we are<br />
unable to generate <strong>inc</strong>ome to compensate for these losses, they could have a material adverse effect on our operating<br />
results.<br />
In addition, federal and state regulators periodically review our allowance for loan losses and may require us to <strong>inc</strong>rease<br />
our allowance for loan losses or recognize further loan charge-offs, based on judgments different than those of our<br />
management. Higher charge-off rates and an <strong>inc</strong>rease in our allowance for loan losses may hurt our overall financial<br />
performance and may <strong>inc</strong>rease our cost of funds. For the year ended December 31, 2009, we recorded $51.19 million as a<br />
provision for loan losses, compared to $18.05 million recorded in 2008. The <strong>inc</strong>rease was due primarily to the<br />
$37.8 million <strong>inc</strong>rease in the level of nonperforming loans during 2009. Although we expect to continue to <strong>inc</strong>rease our<br />
allowance for loan losses in 2010, our allowance may not be adequate to cover future loan losses given current and future<br />
market conditions.<br />
We are subject to extensive regulation that could limit or restrict our activities and adversely affect our earnings.<br />
We operate in a highly regulated industry and are subject to examination, supervision and comprehensive regulation by<br />
various federal and state agencies. Our compliance with these regulations is costly and restricts certain of our activities,<br />
<strong>inc</strong>luding payment of dividends, mergers and acquisitions, investments, loans and interest rates charged, interest rates paid<br />
on deposits and locations of offices. Our failure to comply with these requirements can lead to, among other remedies,<br />
administrative enforcement actions, termination or suspension of our licenses, rights of rescission for borrowers, and class<br />
action lawsuits. Many of these regulations are intended to protect depositors, the public and the FDIC rather than<br />
shareholders. The laws and regulations applicable to the banking industry are changing rapidly to reflect the government’s<br />
concerns about the economy and the banking system, and these changes may adversely affect our business and<br />
profitability. Changes to statutes, regulations or regulatory policies, and the interpretation and implementation of new<br />
statutes, regulations or policies could affect us in substantial and unpredictable ways, <strong>inc</strong>luding limiting the types of<br />
financial services and products we may offer and/or <strong>inc</strong>reasing the ability of nonbanks to offer competing financial<br />
services and products.<br />
In addition, like other registrants, we are subject to the requirements of the Sarbanes-Oxley Act of 2002. Failure to have in<br />
place adequate programs and procedures could cause us to have gaps in our internal control environment, putting PAB and<br />
its shareholders at risk of loss.<br />
These and other potential changes in government regulation or policies could <strong>inc</strong>rease our costs of doing business and<br />
could adversely affect our operations and the manner in which we conduct our business.<br />
Recent legislative and regulatory initiatives to address the current difficult market and economic conditions may not<br />
achieve the desired effect.<br />
Beginning in October 2008, a host of legislation has been enacted in response to the financial crises affecting the banking<br />
system and financial markets and the threats to investment banks and other financial institutions. These <strong>inc</strong>lude the<br />
following:<br />
• On October 3, 2008, President Bush signed into law the Emergency Economic Stabilization Act (“EESA”), under<br />
which the U.S. Treasury Department has the authority, among other things, to purchase up to $700 billion of<br />
mortgages, mortgage-backed securities and certain other financial instruments from financial institutions under<br />
the Troubled Asset Relief Program for the purpose of stabilizing and providing liquidity to the U.S. financial<br />
markets.<br />
17
• On October 14, 2008, the Treasury Department announced the Capital Purchase Plan under the EESA pursuant to<br />
which it would purchase senior preferred stock and warrants to purchase common stock from participating<br />
financial institutions.<br />
• On November 21, 2008, the FDIC adopted a Final Rule with respect to its Temporary Liquidity Guarantee<br />
Program pursuant to which the FDIC will guarantee certain “newly-issued unsecured debt” of banks and certain<br />
holding companies and also guarantee, on an unlimited basis, non-interest bearing bank transaction accounts.<br />
• On February 10, 2009, the Treasury Department announced the <strong>Financial</strong> Stability Plan under the EESA, which is<br />
intended to further stabilize financial institutions and stimulate lending across a broad range of economic sectors.<br />
• On February 18, 2009, President Obama signed the American Recovery and Reinvestment Act, a broad economic<br />
stimulus package that <strong>inc</strong>luded additional restrictions on, and potential additional regulation of, financial<br />
institutions.<br />
• On March 18, 2009, the Federal Reserve announced its decision to purchase as much as $300 billion of long-term<br />
treasuries in an effort to maintain low interest rates.<br />
• On March 23, 2009, the Treasury Department announced the Public-Private Investment Program, which will<br />
purchase real estate related loans from banks and securities from the broader markets, and is intended to create a<br />
market for those distressed debt and securities.<br />
Each of these programs was implemented to help stabilize and provide liquidity to the financial system. However, the<br />
long-term effect that these or any other governmental program may have on the financial markets or our business or<br />
financial performance is unknown. A continuation or worsening of current financial market conditions could materially<br />
and adversely affect our business, financial condition, results of operations, access to credit or the trading price of our<br />
common stock.<br />
Regulatory reform of the U.S. banking system may adversely affect us.<br />
On June 17, 2009, the Obama Administration announced a comprehensive plan for regulatory reform of the financial<br />
services industry. The plan set forth five separate initiatives that will be the focus of the regulatory reform, <strong>inc</strong>luding<br />
requiring strong supervision and appropriate regulation of all financial firms, strengthening regulation of core markets and<br />
market infrastructure, strengthening consumer protection, strengthening regulatory powers to effectively manage failing<br />
institutions and improving international regulatory standards and cooperation.<br />
Other recent developments <strong>inc</strong>lude:<br />
• the Federal Reserve’s proposed guidance on <strong>inc</strong>entive compensation policies at banking organizations;<br />
• proposals to limit a lender’s ability to foreclose on mortgages or make such foreclosures less<br />
economically viable, <strong>inc</strong>luding by allowing Chapter 13 bankruptcy plans to “cram down” the value of<br />
certain mortgages on a consumer’s pr<strong>inc</strong>ipal residence to its market value and/or reset interest rates and<br />
monthly payments to permit defaulting debtors to remain in their home; and<br />
• accelerating the effective date of various provisions of the Credit Card Accountability Responsibility<br />
and Disclosure Act of 2009, which restrict certain credit and charge card practices, require expanded<br />
disclosures to consumers and provide consumers with the right to opt out of interest rate <strong>inc</strong>reases<br />
(with limited exceptions).<br />
These initiatives may <strong>inc</strong>rease our expenses or decrease our <strong>inc</strong>ome by, among other things, making it harder for us to<br />
foreclose on mortgages. Further, the overall effects of these and other legislative and regulatory efforts on the financial<br />
markets remain uncertain and they may not have the intended stabilization results. These efforts may even have<br />
unintended harmful consequences on the U.S. financial system and our business. Should these or other legislative or<br />
regulatory initiatives have unintended effects, our business, financial condition, results of operations and prospects could<br />
be materially and adversely affected.<br />
In addition, we may need to modify our strategies and business operations in response to these changes. We may also<br />
<strong>inc</strong>ur <strong>inc</strong>reased capital requirements and constraints or additional costs to satisfy new regulatory requirements. Given the<br />
volatile nature of the current market and the uncertainties underlying efforts to mitigate or reverse disruptions, we may not<br />
timely anticipate or manage existing, new or additional risks, contingencies or developments in the current or future<br />
environment. Our failure to do so could materially and adversely affect our business, financial condition, results of<br />
operations and prospects.<br />
18
Our net interest <strong>inc</strong>ome could be negatively affected by the lower level of short-term interest rates, recent developments<br />
in the credit and real estate markets and competition in our primary market area.<br />
As a financial institution, our earnings significantly depend on our net interest <strong>inc</strong>ome, which is the difference between the<br />
<strong>inc</strong>ome that we earn on interest-earning assets, such as loans and investment securities, and the expense that we pay on<br />
interest-bearing liabilities, such as deposits and borrowings. Therefore, any change in general market interest rates,<br />
<strong>inc</strong>luding changes resulting from changes in the Federal Reserve’s fiscal and monetary policies, affects us more than nonfinancial<br />
institutions and can have a significant effect on our net interest <strong>inc</strong>ome and net <strong>inc</strong>ome.<br />
The Federal Reserve reduced interest rates on three occasions in 2007 by a total of 100 basis points, to 4.25%, and by<br />
another 400 basis points, to a range of 0% to 0.25%, during 2008. Rates remained steady in 2009. On March 18, 2009,<br />
the Federal Reserve announced its decision to purchase as much as $300 billion of long-term treasuries in an effort to<br />
maintain low interest rates. A significant portion of our loans, <strong>inc</strong>luding residential construction and development loans<br />
and other commercial loans, bears interest at variable rates. The interest rates on a significant part of these loans decrease<br />
when the Federal Reserve reduces interest rates, while the interest that we earn on our assets may not change in the same<br />
amount or at the same rates. Accordingly, <strong>inc</strong>reases in interest rates may reduce our net interest <strong>inc</strong>ome. In addition, an<br />
<strong>inc</strong>rease in interest rates may decrease the demand for consumer and commercial credit, <strong>inc</strong>luding real estate loans, which<br />
are a major component of our loan portfolio. Furthermore, <strong>inc</strong>reases in interest rates will add to the expenses of our<br />
borrowers, which may adversely affect their ability to repay their loans with us.<br />
Changes in the level of interest rates also may negatively affect our ability to originate real estate loans, the value of our<br />
assets and our ability to realize gains from the sale of our assets, all of which ultimately affect our earnings. A decline in<br />
the market value of our assets may limit our ability to borrow additional funds or result in our lenders requiring additional<br />
collateral from us under our loan agreements. As a result, we could be required to sell some of our loans and investments<br />
under adverse market conditions, upon terms that are not favorable to us, to maintain our liquidity. If those sales are made<br />
at prices lower than the recorded amounts of the investments and loans, we will <strong>inc</strong>ur losses. Changes in Federal Reserve<br />
Board policies and laws are beyond our control.<br />
Increased nonperforming loans and the decrease in interest rates reduced our net interest <strong>inc</strong>ome during 2008 and 2009 and<br />
could cause additional pressure on net interest <strong>inc</strong>ome in future periods. This reduction in net interest <strong>inc</strong>ome may also be<br />
exacerbated by the high level of competition that we face in our primary market area in South Georgia. Any significant<br />
reduction in our net interest <strong>inc</strong>ome could negatively affect our business and could have a material adverse impact on our<br />
capital, financial condition and results of operations.<br />
We may fail to complete the proposed sale of our five South Georgia branches or realize the anticipated benefits of the<br />
disposition.<br />
The proposed sale of our five South Georgia branches is subject to a variety of conditions, <strong>inc</strong>luding regulatory approvals<br />
for both the buyer and us. All regulatory applications have been filed with the appropriate regulators. The regulators may<br />
not grant these approvals as we anticipate, or the approvals may require material changes to the terms of the sale or<br />
otherwise contain material adverse conditions that would preclude closing the sale. Further, the parties may be unable to<br />
satisfy all the closing conditions. Even if we sell the braches as we expect, we may not realize the anticipated benefits to<br />
our capital and earnings.<br />
We face strong competition from other financial services providers.<br />
We operate in competitive markets for the products and services we offer. The competition among financial services<br />
providers to attract and retain customers is strong. Customer loyalty can be easily influenced by a competitor’s new<br />
products, especially offerings that could provide cost savings or a higher return to the customer. Some of our competitors<br />
may be better able to provide a wider range of products and services over a greater geographic area. We compete with<br />
commercial banks, credit unions, savings and loan associations, mortgage banking firms, consumer finance companies,<br />
securities brokerage firms, insurance companies, money market funds, and other mutual funds, as well as other superregional,<br />
national and international financial institutions that operate in our market areas and elsewhere. Moreover, this<br />
competitive industry could become even more competitive as a result of legislative, regulatory and technological changes<br />
and continued consolidation. Many of our competitors have fewer regulatory constraints and some have lower cost<br />
structures. While we believe we can and do successfully compete with these other financial institutions in our market<br />
areas, we may face a competitive disadvantage as a result of our smaller size, lack of geographic diversification and<br />
inability to spread our marketing costs across a broader market.<br />
19
As of December 31, 2009, we are not considered “well capitalized” by our banking regulators. As a result, we are<br />
unable to access brokered deposits, which may adversely affect our liquidity and our ability to meet our obligations,<br />
<strong>inc</strong>luding the payout of deposit accounts.<br />
As of December 31, 2009, the Bank did not meet the regulatory capital ratios required to meet “well-capitalized”<br />
standards. Because we do not have sufficient capital to maintain our “well capitalized” status, we are unable to renew any<br />
brokered certificates of deposit or attract new brokered certificates of deposit without prior regulatory approval. As of<br />
December 31, 2009, we had approximately $133 million in brokered deposits, which represented approximately 12.73% of<br />
our total deposits, a reduction from 18.39% as of December 31, 2008. If we are unable to continue to attract deposits and<br />
maintain sufficient liquidity, our ability to meet our obligations, <strong>inc</strong>luding the payout of deposit accounts, may be<br />
adversely affected. If our liquidity becomes severely impaired and we are unable to meet our financial obligations,<br />
<strong>inc</strong>luding the payout of deposit accounts, our banking regulators may subject the Bank to regulatory enforcement action,<br />
<strong>inc</strong>luding receivership.<br />
If we were to suffer loan losses similar to those predicted by a SCAP test, those losses could have a material adverse<br />
effect on our results of operation, our capital and the price, and market for, our common stock.<br />
The federal banking regulators, in connection with the Federal Reserve’s Supervisory Capital Assessment Program, or<br />
SCAP, administered a stress test to the nation’s 19 largest U.S. bank holding companies during the first quarter of 2009.<br />
Neither the Federal Reserve nor any other bank regulatory authority has administered a SCAP test to test our loan<br />
portfolio. The SCAP test attempts to assess the near-term capital needs of a company using a two-year cumulative loan<br />
loss assumption under two scenarios, a “baseline” scenario that assumed a consensus forecast for certain economic<br />
variables and a “more adverse” than expected scenario to project a more significant downturn. These scenarios use the<br />
assumptions developed by the Federal Reserve with input from the 19 largest U.S. bank holding companies and therefore<br />
do not reflect specific adjustments based on more current economic data reflective of the market areas in which our loans<br />
are located or the specific characteristics of our loan portfolio. After applying the SCAP methodology to our loan<br />
portfolio, our potential cumulative loan losses over the next two years under either scenario of the SCAP test would be<br />
significantly higher than the level of loan losses we have <strong>inc</strong>urred historically.<br />
The results of the SCAP test involve many assumptions about the economy and future loan losses and default rates, and<br />
may not accurately reflect the impact on our financial condition if the economy does not improve or continues to<br />
deteriorate. Any continued deterioration of the economy could result in credit losses that are significantly higher than we<br />
have historically experienced or those that may be predicted by the SCAP test. Accordingly, if we were to suffer loan<br />
losses similar or higher in amounts to those that were predicted by the SCAP test, these losses could have a material<br />
adverse effect on our results of operation and on the price and market for our stock. In addition, these losses could reduce<br />
our capital and thus require us to seek additional capital on unfavorable terms.<br />
Departures of our key personnel may harm our ability to operate successfully.<br />
Our success has been and continues to depend largely on the services of our senior management team, <strong>inc</strong>luding our senior<br />
loan officers, and our board of directors, many of whom have significant relationships with our customers. Our success<br />
will depend, to a significant extent, on the continued service of these key personnel. The unexpected loss of any additional<br />
members of our senior management team could have an adverse effect on our financial condition and results of operations.<br />
We cannot be assured of the continued service of our senior management team or our board of directors.<br />
Our new executive team may not be able to successfully work together to meet our business objectives, which would<br />
adversely affect our business.<br />
During our recent management restructuring, a significant number of our executive officers were promoted to positions of<br />
greater responsibility. S<strong>inc</strong>e their promotion, the new management team has devoted substantial efforts to significantly<br />
change our business strategy and related activities. While this new management team has previously worked together at<br />
PAB and the Bank, they have not worked together in their new positions and may not be able to successfully implement<br />
our strategy in this difficult economic environment. The failure of the new management team to address our new business<br />
objectives and strategy could materially adversely affect our business and our future operating results.<br />
20
We may need to raise additional capital in the future, but that capital may not be available when we need it or may be<br />
dilutive.<br />
We are required by federal and state regulatory authorities to maintain adequate levels of capital to support our operations.<br />
We may at some point need to raise additional capital to support our operations and any future growth, as well as to protect<br />
against any further deterioration in our loan portfolio.<br />
Our ability to raise additional capital, if needed, will depend on conditions in the capital markets at that time and on our<br />
financial performance. Recently, the volatility and disruption in the capital and credit markets have reached unprecedented<br />
levels. In some cases, the markets have produced downward pressure on stock prices and credit availability for certain<br />
issuers without regard to those issuers’ underlying financial strength. If current levels of market disruption and volatility<br />
continue or worsen, our ability to raise additional capital may be disrupted. If we cannot raise additional capital when<br />
needed, our results of operations and financial condition may be adversely affected, and our banking regulators may<br />
subject the Bank to regulatory enforcement action, <strong>inc</strong>luding receivership. In addition, the issuance of additional shares of<br />
our common stock will dilute the ownership interest of our common shareholders.<br />
Diminished access to alternative sources of liquidity could adversely affect our net <strong>inc</strong>ome, net interest margin and<br />
overall liquidity.<br />
We have historically had access to a number of alternative sources of liquidity, but given the recent and dramatic downturn<br />
in the credit and liquidity markets, we may not be able to obtain liquidity on terms that are favorable to us, or at all. As<br />
noted above, we are presently unable to renew any brokered certificates of deposit or attract new brokered certificates of<br />
deposit without prior regulatory approval. In addition, financial institutions may be unwilling to extend credit to banks<br />
because of concerns about the banking industry and the economy generally, and there may not be a viable market for<br />
raising equity capital. If our access to these sources of liquidity is diminished, or if it is only available on unfavorable<br />
terms, then our net <strong>inc</strong>ome, net interest margin and overall liquidity could be adversely affected.<br />
Fluctuations in our expenses and other costs may hurt our financial results.<br />
Our expenses and other costs, such as operating and marketing expenses, directly affect our earnings results. In light of<br />
the extremely competitive environment in which we operate, and because the size and scale of many of our competitors<br />
provides them with <strong>inc</strong>reased operational efficiencies, we must successfully manage those expenses. As our business<br />
develops, changes or expands, additional expenses can arise.<br />
Higher FDIC deposit insurance premiums and assessments could adversely affect our financial condition.<br />
FDIC insurance premiums <strong>inc</strong>reased substantially in 2009, and we expect to pay significantly higher FDIC premiums in<br />
the future. As the large number of recent bank failures continues to deplete the Deposit Insurance Fund, the FDIC adopted<br />
a revised risk-based deposit insurance assessment schedule in February 2009, which raised deposit insurance premiums.<br />
The FDIC also implemented a five basis point special assessment of each insured depository institution’s assets minus Tier<br />
1 capital as of June 30, 2009. This special assessment amount was capped at 10 basis points times the institution’s<br />
assessment base for the second quarter of 2009. The amount of our special assessment on September 30, 2009 was<br />
approximately $600,000. In addition, the FDIC required financial institutions, such as the Bank, to prepay their estimated<br />
quarterly risk-based assessments for the fourth quarter of 2009 and for all of 2010 through and <strong>inc</strong>luding 2012 to recapitalize<br />
the Deposit Insurance Fund, although the FDIC exempted the Bank from this prepayment requirement. The rule<br />
also provides for <strong>inc</strong>reasing the FDIC-assessment rates by three basis points effective January 1, 2011. If FDIC deposit<br />
insurance premiums and assessments continue to <strong>inc</strong>rease, it could adversely affect our financial condition.<br />
We must respond to rapid technological changes, which may be more difficult or expensive than anticipated.<br />
If our competitors introduce new products and services embodying new technologies, or if new industry standards and<br />
practices emerge, our existing product and service offerings, technology and systems may become obsolete. Further, if we<br />
fail to adopt or develop new technologies or to adapt our products and services to emerging industry standards, we may<br />
lose current and future customers, which could have a material adverse effect on our business, financial condition and<br />
results of operations. The financial services industry is changing rapidly, and to remain competitive, we must continue to<br />
enhance and improve the functionality and features of our products, services and technologies. These changes may be<br />
more difficult or expensive than we anticipate.<br />
21
Our directors and executive officers own a significant portion of our common stock.<br />
Our directors and executive officers, as a group, beneficially owned approximately 29% of our outstanding common stock<br />
as of February 28, 2010. As a result of their ownership, the directors and executive officers will have the ability, by voting<br />
their shares in concert, to significantly influence the outcome of all matters submitted to our shareholders for approval,<br />
<strong>inc</strong>luding the election of directors.<br />
Our common stock trading volume has been low compared with larger bank holding companies<br />
The trading volume in our common stock on the NASDAQ Global Select Market has generally been lower than other<br />
similarly sized bank holding companies s<strong>inc</strong>e our shares trading on the NASDAQ Global Select Market. Furthermore, this<br />
trading volume does not compare with more seasoned companies listed on other stock exchanges. Thus, the market in our<br />
common stock is somewhat limited in scope relative to some other companies, and a more active and liquid trading market<br />
for our common stock may not develop in the future. As a result, it may be more difficult for you to sell a substantial<br />
number of shares for the same price at which you could sell a smaller number of shares.<br />
Sales of substantial amounts of common stock in the market, or the potential for large amounts of sales in the market, may<br />
cause the price of our common stock to decline or impair our future ability to raise capital through sales of our common<br />
stock.<br />
The price of our common stock may fluctuate significantly, which may make it difficult for you to resell common stock<br />
at times or at prices you find favorable.<br />
Our stock price has been volatile in the past, and several factors could cause the price to fluctuate substantially in the<br />
future. These factors <strong>inc</strong>lude:<br />
• actual or anticipated variations in earnings;<br />
• changes in analysts’ recommendations or projections;<br />
• our announcements of developments related to our businesses;<br />
• operating and stock performance of other companies deemed to be peers;<br />
• actions by government regulators;<br />
• new technology used or services offered by traditional and non-traditional competitors; and<br />
• news reports of trends, concerns and other issues related to the financial services industry.<br />
Our stock price may fluctuate significantly in the future, and these fluctuations may be unrelated to our performance.<br />
General market price declines or market volatility in the future could adversely affect the price of our common stock, and<br />
the current market price of our common stock may not be indicative of future market prices.<br />
In addition, in recent months, the stock market in general has experienced extreme price and volume fluctuations. This<br />
volatility has had a significant effect on the market price of securities issued by many companies and particularly those in<br />
the financial services and banking sector, <strong>inc</strong>luding for reasons unrelated to their operating performance. These broad<br />
market fluctuations may adversely affect our stock price, notwithstanding our operating results.<br />
22
If we fail to continue to meet all applicable continued listing requirements of the NASDAQ Global Select Market and<br />
NASDAQ determines to delist our common stock, the market liquidity and market price of our common stock could<br />
decline, and our ability to access the capital markets could be negatively affected.<br />
Our common stock is listed on the NASDAQ Global Select Market. To maintain that listing, we must satisfy minimum<br />
financial and other continued listing requirements. For example, NASDAQ rules require that we maintain a minimum bid<br />
price of $1.00 per share for our common stock. Our common stock has recently traded near this minimum bid price<br />
requirement, and it may fall below the requirement in the future. If our stock price falls below $1.00 or we fail to meet<br />
other requirements for continued listing on the NASDAQ Global Select Market, and we are unable to cure the events of<br />
noncompliance in a timely or effective manner, our common stock could be delisted from the NASDAQ Global Select<br />
Market. If our common stock were threatened with delisting from the NASDAQ Global Select Market, we may,<br />
depending on the circumstances, seek to extend the period for regaining compliance with NASDAQ listing requirements<br />
by moving our common stock to the NASDAQ Capital Market. If our common stock is not eligible for quotation on<br />
another market or exchange, trading of our common stock could be conducted in the over-the-counter market or on an<br />
electronic bulletin board established for unlisted securities such as the Pink OTC Markets or the OTC Bulletin Board. In<br />
that event, it could become more difficult to dispose of, or obtain accurate quotations for the price of, our common stock,<br />
and there would likely also be a reduction in our coverage by the news media, which could cause the price of our common<br />
stock to decline further. In addition, the delisting of our common stock from a national exchange could materially<br />
adversely affect our access to the capital markets, and any limitation on market liquidity or reduction in the price of our<br />
common stock as a result of that delisting could adversely affect our ability to raise capital, if needed, on terms acceptable<br />
to us or at all.<br />
We suspended payment of dividends during the third quarter of 2008 and currently are not permitted to declare or pay<br />
any dividend without the prior written approval of our regulators. As a result, capital appreciation, if any, of our<br />
common stock may be your sole opportunity for gains on your investment for the foreseeable future.<br />
In the third quarter of 2008, we suspended payment of dividends on our common stock. In addition, as a result of the<br />
Written Agreement, we are not permitted to declare or pay any dividend without the prior written approval of our<br />
regulators. As a result, we currently cannot declare a dividend on our common shares. We do not expect to be granted a<br />
waiver or be released from this restriction until our financial performance improves significantly. Assuming our regulators<br />
permit us to pay dividends in the future, our ability to pay dividends will be limited by regulatory restrictions and the need<br />
to maintain sufficient consolidated capital. Holders of our common stock are only entitled to receive the dividends that our<br />
board of directors declares out of funds legally available for those payments.<br />
ITEM 1B. UNRESOLVED STAFF COMMENTS<br />
None.<br />
ITEM 2. PROPERTIES<br />
We currently operate 18 bank branches, an operations center, an administrative office suite and an administrative office.<br />
With the exception of our Ocala, Florida branch and our Stockbridge, Georgia branch, we own all of the real property<br />
and/or buildings in which our bank branch offices are located. The Ocala office is under a five-year operating lease that<br />
expires in December 2013. The Stockbridge office is under a six-year operating lease that expires in June 2014. We own<br />
the real property where our Snellville, Georgia loan production office was located prior to its closure January 30, 2009,<br />
although this property is now being used as an administrative condo while it is marketed for sale. The 4,300 square-foot<br />
administrative office suite in McDonough, Georgia is located in leased office space. In addition, we own a three-story,<br />
10,000 square-foot administrative building, which houses our corporate offices, and a 12,000 square-foot operations center<br />
in Valdosta, Georgia. All of the properties are in a good state of repair and are designed for the purposes for which they<br />
are used.<br />
We also currently own two parcels of land that we were holding for potential future expansion in Valdosta, Lowndes<br />
County, Georgia. The two lots in Valdosta <strong>inc</strong>lude land behind our main office building and a lot near the initial Park<br />
Avenue Bank location.<br />
On February 23, 2010, we entered into a Purchase and Assumption Agreement whereby we agreed to sell our branches<br />
located in Adel, Statesboro, Baxley, and Hazlehurst to HeritageBank of the South. The closing of the transaction is subject<br />
to regulatory approval and other customary closing conditions and is expected to be completed in the second quarter of<br />
2010.<br />
23
ITEM 3. LEGAL PROCEEDINGS<br />
The nature of the business of PAB and the Bank ordinarily results in a certain amount of litigation. Accordingly, we are<br />
party to a limited number of lawsuits <strong>inc</strong>idental to our respective businesses. In our opinion, the ultimate disposition of<br />
these matters will not have a material adverse impact on our consolidated financial position or results of operations.<br />
PART II<br />
ITEM 4. RESERVED<br />
ITEM 5. MARKET FOR REGISTRANT’S COMMON EQUITY, RELATED STOCKHOLDER MATTERS<br />
AND ISSUER PURCHASES OF EQUITY SECURITIES<br />
Our common stock has been traded on NASDAQ under the symbol “PABK” s<strong>inc</strong>e November 1, 2005. Prior to that time,<br />
our common stock was listed s<strong>inc</strong>e 1996 for quotation on the American Stock Exchange under the symbol “PAB”. On<br />
February 26, 2010, there were 2,135 holders of record of our common stock.<br />
Our ability to pay dividends is primarily dependent on earnings from operations, the adequacy of capital and the<br />
availability of liquid assets for distribution. Our ability to generate liquid assets for distribution is primarily dependent on<br />
the ability of the Bank to pay dividends up to the parent holding company. The payment of dividends is an integral part of<br />
our goal to retain sufficient capital to support future growth and to meet regulatory requirements while providing a<br />
competitive return on investment to our stockholders. When possible, it was our intent to pay out 35-50% of our net<br />
earnings in the form of cash dividends to our stockholders on a quarterly basis. However, in the third quarter of 2008, we<br />
suspended our quarterly dividends to shareholders due to a decline in earnings. We did not pay a dividend in 2009 and we<br />
do not intend to pay a dividend in 2010 due to continued pressure on earnings and capital. Further, under the terms of the<br />
Written Agreement, we are not permitted to declare or pay any dividend without the prior written approval of our<br />
regulators. As a result, we currently cannot declare a dividend on our common shares. We do not expect to be granted a<br />
waiver or be released from this restriction until our financial performance improves significantly. Assuming our regulators<br />
permit us to pay dividends in the future, our ability to pay dividends will be limited by regulatory restrictions and the need<br />
to maintain sufficient consolidated capital. For a discussion on the statutory and regulatory limitations on our ability to<br />
pay dividends, see “Business – Supervision and Regulation.” Holders of our common stock are only entitled to receive<br />
the dividends that our board of directors declare out of funds legally available for those payments. We can provide no<br />
assurances regarding whether, and if so when, we will be able to resume payments of dividends in the future.<br />
In addition, on September 4, 2009, we began exercising our right to defer quarterly interest payments on our Floating Rate<br />
Junior Subordinated Debentures we issued to PAB Bankshares Capital Trust II, a statutory business trust created for the<br />
sole purpose of issuing trust preferred securities and investing the proceeds in the debentures. We expect to defer the<br />
interest payments indefinitely. During this period of deferral, we are precluded from paying dividends on our common<br />
stock.<br />
The following table sets forth, for the indicated periods, the high and low closing sales prices for our common stock, the<br />
cash dividends declared, and the diluted earnings per share. All per share information prior to June 30, 2008 has been<br />
adjusted for the 2% stock dividend paid on July 15, 2008.<br />
Sales Price<br />
Calendar Period High Low Dividends Earnings<br />
2008<br />
First Quarter $ 14.02 $ 11.59 $ 0.142 $ 0.14<br />
Second Quarter 14.40 8.33 0.093* 0.15<br />
Third Quarter 9.02 6.66 - (0.32)<br />
Fourth Quarter 6.95 3.87 - (0.60)<br />
2009<br />
First Quarter $ 4.90 $ 1.98 $ - $ (0.03)<br />
Second Quarter 4.20 2.51 - 0.04<br />
Third Quarter 3.69 2.45 - (1.93)<br />
Fourth Quarter 3.35 1.09 - (2.27)<br />
*plus a 2% stock dividend<br />
24
Performance Graph<br />
The following graph compares our yearly percentage change in cumulative, five-year shareholder return with the<br />
NASDAQ – Composite Index and the <strong>SNL</strong> Southeast Bank Index. We have determined that the <strong>SNL</strong> Southeast Bank<br />
Index provides an appropriate and accurate comparison with our industry peers. The graph assumes that the value of the<br />
investment in the Company’s common stock and in each index was $100 on December 31, 2004 and that all dividends<br />
were reinvested. The change in cumulative total return is measured by dividing (i) the sum of (a) the cumulative amount<br />
of dividends for the period, and (b) the change in share price between the beginning and the end of the period, by (ii) the<br />
share price at the beginning of the period.<br />
Period Ending<br />
Index 12/31/04 12/31/05 12/31/06 12/31/07 12/31/08 12/31/09<br />
PAB Bankshares, Inc. 100.00 143.43 172.21 104.13 38.35 19.18<br />
NASDAQ Composite Index 100.00 101.37 111.03 121.92 72.49 104.31<br />
<strong>SNL</strong> Southeast Bank Index 100.00 102.36 120.03 90.42 36.60 36.75<br />
The foregoing Total Return Performance Graph shall not be deemed to be “soliciting material” or to be “filed” with the SEC, nor shall such<br />
information be <strong>inc</strong>orporated by reference into any future filing under the Securities Act of 1933, as amended, or the Exchange Act, except to the extent<br />
the Company specifically <strong>inc</strong>orporates it by reference into such filing.<br />
Stock Buyback Plan<br />
On December 18, 2007, the Board of Directors authorized a plan to repurchase up to 200,000 shares of the Company’s<br />
common stock over a 12 month period. The plan expired on December 18, 2008 with 126,185 shares remaining<br />
unpurchased. There were no repurchases of the Company’s common stock during 2009.<br />
25
ITEM 6. SELECTED FINANCIAL DATA<br />
The following table presents selected consolidated financial data for PAB. This selected financial data is derived in part<br />
from, and should be read in conjunction with, the Consolidated <strong>Financial</strong> Statements and the Notes in Item 8 and<br />
Management’s Discussion and Analysis of <strong>Financial</strong> Condition and Results of Operations in Item 7 of this Report.<br />
(In thousands, except per share and other data) 2009 2008 2007 2006 2005<br />
Summary of Operations:<br />
Interest <strong>inc</strong>ome $ 59,881 $ 70,984 $ 84,676 $ 77,566 $ 59,371<br />
Interest expense 31,571 36,218 42,210 33,555 20,398<br />
Net interest <strong>inc</strong>ome 28,310 34,766 42,466 44,011 38,973<br />
Provision for loan losses 51,188 18,050 2,400 - 1,189<br />
Other <strong>inc</strong>ome 4,535 4,403 5,991 5,380 5,813<br />
Other expense 40,573 30,584 29,590 28,167 24,778<br />
Income before <strong>inc</strong>ome tax expense (58,916) (9,465) 16,467 21,224 18,819<br />
Income tax expense (7,744) (3,554) 5,681 7,488 6,366<br />
Net <strong>inc</strong>ome $ (51,172) $ (5,911) $ 10,786 $ 13,736 $ 12,453<br />
Net interest <strong>inc</strong>ome on a taxable-equivalent basis $ 28,634 $ 35,432 $ 43,120 $ 44,507 $ 39,195<br />
Selected Average Balances:<br />
Total assets $ 1,307,027 $ 1,238,875 $ 1,165,307 $ 1,067,362 $ 948,457<br />
Earning assets 1,205,340 1,165,625 1,096,918 1,004,981 890,337<br />
Loans 915,674 955,253 883,334 792,278 706,052<br />
Deposits 1,069,352 1,011,596 948,613 859,216 741,409<br />
Stockholders’ equity 89,140 96,877 98,055 91,611 85,431<br />
Selected Year End Balances:<br />
Total assets $ 1,231,945 $ 1,350,103 $ 1,198,671 $ 1,120,804 $ 1,017,326<br />
Earning assets 1,095,456 1,259,495 1,116,776 1,048,239 957,918<br />
Loans 805,314 956,687 921,349 820,304 752,938<br />
Allowance for loan losses 29,314 19,374 12,906 11,006 11,079<br />
Deposits 1,045,215 1,123,703 980,149 908,483 815,681<br />
Stockholders’ equity 50,587 91,601 97,676 95,316 87,001<br />
Common Share Data:<br />
Outstanding at year end** 13,795,040 9,324,407 9,406,956 9,688,708 9,652,756<br />
Weighted average outstanding** 10,708,466 9,335,376 9,602,535 9,683,173 9,698,514<br />
Diluted weighted average outstanding** 10,708,466 9,335,376 9,744,063 9,890,728 9,870,633<br />
Per Share Ratios:<br />
Net <strong>inc</strong>ome – basic** $ (4.78) $ (0.63) $ 1.12 $ 1.42 $ 1.28<br />
Net <strong>inc</strong>ome – diluted** (4.78) (0.63) 1.11 1.39 1.26<br />
Dividends declared** - 0.24 0.568 0.529 0.466<br />
Book value** 3.67 9.82 10.38 9.84 9.01<br />
Tangible book value** 3.67 9.18 9.75 9.22 8.39<br />
Profitability Ratios:<br />
Return on average assets -3.92% -0.48% 0.93% 1.29% 1.31%<br />
Return on average equity -57.41% -6.10% 11.00% 14.99% 14.58%<br />
Net interest margin 2.38% 3.04% 3.93% 4.43% 4.40%<br />
Efficiency ratio 112.30% 70.01% 60.74% 55.88% 54.94%<br />
Liquidity Ratios:<br />
Total loans to total deposits 77.05% 85.14% 94.00% 90.29% 92.31%<br />
Average loans to average earning assets 75.97% 81.95% 80.53% 78.84% 79.30%<br />
Noninterest-bearing deposits to total deposits 9.61% 8.11% 9.12% 11.11% 13.23%<br />
Capital Adequacy Ratios:<br />
Average equity to average assets 6.82% 7.82% 8.41% 8.58% 9.01%<br />
Dividend payout ratio 0.00% -37.16% 50.43% 37.36% 36.29%<br />
Asset Quality Ratios:<br />
Net charge-offs to average loans 4.50% 1.21% 0.06% 0.01% -0.12%<br />
Nonperforming loans to total loans 11.57% 5.79% 1.24% 0.49% 1.04%<br />
Nonperforming assets to total assets 15.04% 5.98% 1.49% 0.45% 0.78%<br />
Allowance for loan losses to total loans 3.64% 2.03% 1.40% 1.34% 1.47%<br />
Allowance for loan losses to nonperforming loans 31.46% 34.96% 112.79% 271.95% 140.98%<br />
**2007 and prior periods adjusted for 2% stock dividend paid on July 15, 2008.<br />
26
GAAP Reconciliation and Management Explanation for Non-GAAP <strong>Financial</strong> Measures<br />
Certain financial information <strong>inc</strong>luded in “Selected <strong>Financial</strong> Data” above is determined by methods other than in<br />
accordance with GAAP. “Tangible book value per share” is a non-GAAP financial measure that our management uses in<br />
its analysis of our performance.<br />
“Tangible book value” is defined as total equity reduced by recorded intangible assets divided by total common shares<br />
outstanding. This measure is important to investors interested in changes from period to period in book value per share<br />
exclusive of changes in intangible assets. Goodwill, an intangible asset that is recorded in a purchase business<br />
combination, has the effect of <strong>inc</strong>reasing total book value while not <strong>inc</strong>reasing the tangible assets of the company. For<br />
companies that have engaged in multiple business combinations, purchase accounting can result in the recording of<br />
significant amounts of goodwill related to such transactions.<br />
These disclosures should not be viewed as a substitute for results determined in accordance with GAAP, and are not<br />
necessarily comparable to non-GAAP performance measures which may be presented by other companies. The following<br />
reconciliation table provides a more detailed analysis of these non-GAAP performance measures.<br />
2009 2008 2007 2006 2005<br />
Book value per common share** $ 3.67 $ 9.82 $ 10.38 $ 9.84 $ 9.01<br />
Effect of intangible assets per share** - 0.64 0.63 0.62 0.62<br />
Tangible book value per common share** $ 3.67 $ 9.18 $ 9.75 $ 9.22 $ 8.39<br />
**2007 and prior periods adjusted for 2% stock dividend paid on July 15, 2008.<br />
ITEM 7. MANAGEMENT’S DISCUSSION AND ANALYSIS OF FINANCIAL CONDITION<br />
AND RESULTS OF OPERATIONS<br />
The following discussion and analysis of the consolidated financial condition and results of operations of PAB should be<br />
read in conjunction with the Consolidated <strong>Financial</strong> Statements and related Notes, and is qualified in its entirety by the<br />
foregoing and other more detailed financial information appearing elsewhere. Historical results of operations and the<br />
percentage relationships among any amounts <strong>inc</strong>luded, and any trends which may appear to be inferred, should not be<br />
taken as being necessarily indicative of trends in operations or results of operations for any future periods.<br />
We have made, and will continue to make, various forward-looking statements with respect to financial and business<br />
matters. Comments regarding our business which are not historical facts are considered forward-looking statements that<br />
involve inherent risks and uncertainties. Actual results may differ materially from those contained in these forwardlooking<br />
statements. For additional information regarding our cautionary disclosures, see the “Cautionary Notice<br />
Regarding Forward-Looking Statements” at the beginning of this Report.<br />
OVERVIEW OF KEY FINANCIAL, STRATEGIC AND PERFORMANCE FACTORS<br />
PAB Bankshares, Inc. is a bank holding company headquartered in Valdosta, Georgia. Our company was organized and<br />
<strong>inc</strong>orporated in 1982 under the laws of the State of Georgia as the holding company for The Park Avenue Bank, a state<br />
chartered bank that was founded in 1956. We have a tradition of community banking in South Georgia spanning more<br />
than five decades. In 2000, we expanded into higher growth metropolitan markets in North Georgia and Florida to<br />
leverage the excess deposits of our South Georgia franchise. Currently, the Bank operates with 13 branches located in<br />
seven counties in South Georgia, where we have developed a leading market share in several of these communities; four<br />
branches located in three counties in North Georgia; and one branch located in Ocala, Florida. We provide traditional<br />
banking products and services to both commercial and individual customers in our markets. For additional information on<br />
our markets, see the “Markets and Competition” section in Part I of this Report. As a bank, we operate in a highly<br />
regulated and competitive environment. Our primary objective is to <strong>inc</strong>rease the return on our stockholders’ investment<br />
over the long-term by accepting deposits and borrowing additional funds as needed at low costs and investing those funds<br />
in a safe and sound manner in loans and investments at a higher yield. Competition, regulation, credit risk, and interest<br />
rate risk are the primary factors that we must manage in order to be successful.<br />
As described in the “Supervision and Regulation” section in Part I of this Report, we have been operating under a Written<br />
Agreement with the Federal Reserve and the Georgia Department s<strong>inc</strong>e July 14, 2009.<br />
27
The Bank offers traditional banking products and services to commercial and individual customers in our markets. Our<br />
product line <strong>inc</strong>ludes loans to small- and medium-sized businesses, residential and commercial construction and<br />
development loans, commercial real estate loans, farmland and agricultural production loans, residential mortgage loans,<br />
home equity loans, consumer loans and a variety of commercial and consumer demand, savings and time deposit products.<br />
We originate conforming residential mortgages for customers in our markets and sell these mortgages to third-party<br />
mortgage investors. We also offer internet banking, on-line cash management, electronic bill payment services, safe<br />
deposit box rentals, telephone banking, credit and debit card services, remote depository products and the availability of a<br />
network of ATMs to our customers. In addition, through an agreement with a third-party broker-dealer and investment<br />
advisory firm, we offer securities brokerage and investment advisory services to our customers.<br />
In response to the current economic downturn that has adversely affected our financial condition, we have proactively<br />
taken measures to address our credit quality, improve our capital position and preserve our liquidity, <strong>inc</strong>luding the<br />
following:<br />
• we raised $13.4 million in September 2009 in Tier 1 capital through two private placements of preferred<br />
stock that immediately converted to common stock;<br />
• we restructured our executive management team<br />
• we strengthened our credit department through the creation of a Special Assets Group and the<br />
recruitment of several senior personnel whose sole focus is the resolution of our problem assets;<br />
• we improved the identification, tracking and resolution of our problem assets by implementing a robust<br />
credit review process and creating an internal accounting system that isolates and tracks all of our<br />
nonperforming assets through a virtual “bad bank”;<br />
• we entered into a definitive agreement in February 2010 to sell five of our branches in markets that do<br />
not fit within our long term strategic plan, a transaction that we expect to be accretive to our earnings<br />
and capital position;<br />
• we reduced our operational costs by implementing several cost cutting measures over the past 18<br />
months; and<br />
• we maintained a strong liquidity position while reducing our reliance on brokered deposits.<br />
Like many financial institutions across the United States, our operations have been severely affected by the current<br />
economic crisis. The recession has reduced liquidity and credit quality within the banking system and the labor, capital<br />
and real estate markets. Dramatic declines in the housing market, specifically in our North Georgia and Florida markets,<br />
have negatively affected the credit performance of our residential construction and development loans. The economic<br />
recession has also lowered commercial real estate values in all of our markets and substantially reduced general business<br />
activity and investment. Combined, the deterioration in the residential and the commercial real estate markets has<br />
materially <strong>inc</strong>reased our level of nonperforming assets and charge-offs of problem loans. These market conditions and the<br />
tightening of credit have led to <strong>inc</strong>reased delinquencies in our loan portfolio, <strong>inc</strong>reased market volatility, added pressure on<br />
our capital, a lower net interest margin and net losses.<br />
Earnings<br />
We recorded a net loss of $51.2 million in 2009, a 766% <strong>inc</strong>rease in the net loss from the $5.9 million net loss we recorded<br />
in 2008. Our diluted earnings (loss) per share (“EPS”) decreased 659% from -$0.63 in 2008 to -$4.78 in 2009. Our total<br />
revenues (which is net interest <strong>inc</strong>ome plus noninterest <strong>inc</strong>ome) decreased 16% from $39.17 million in 2008 to $32.85<br />
million in 2009. Our return on average assets (“ROA”) decreased from -0.48% in 2008 to -3.92% and our return on<br />
average equity (“ROE”) declined from -6.10% in 2008 to -57.41% in 2009.<br />
28
The three primary reasons for this decline in earnings are an <strong>inc</strong>rease in provision for loan loss expense, a decrease in net<br />
interest <strong>inc</strong>ome and an <strong>inc</strong>rease in noninterest expenses. We recorded a $51.19 million provision for loan loss expense in<br />
2009, compared to the $18.05 million provision for loan loss expense recorded in 2008. During 2009, our net interest<br />
<strong>inc</strong>ome decreased $6.5 million, from $34.8 million in 2008 to $28.3 million in 2009, and our net interest margin declined<br />
66 basis points from 3.04% in 2008 to 2.38% in 2009. Our noninterest expenses <strong>inc</strong>reased 33%, from $30.6 million in<br />
2008 to $40.6 million in 2009. This <strong>inc</strong>rease in noninterest expenses is attributable to carrying charges on our<br />
nonperforming assets, goodwill impairment, and <strong>inc</strong>reased deposit insurance premiums. Earnings from core operations<br />
were $16.7 million for 2009, a 9% <strong>inc</strong>rease compared to $15.3 million for 2008. The improvement in earnings from core<br />
operations is primarily the result of operating expense control. We define earnings from core operations as pre-tax, preprovision<br />
earnings less other identified items as shown below in the reconciliation of earnings from core operations to net<br />
loss. Additional discussion regarding our earnings for 2009 and our outlook for 2010 are outlined in the section titled<br />
“Results of Operations” below.<br />
Management uses the non-GAAP measure of “earnings from core operations” in our analysis of our performance. This<br />
measure, as we use it, adjusts net <strong>inc</strong>ome (loss) determined in accordance with GAAP to exclude the effects of taxes, the<br />
provision for loan losses and other expenses as detailed in the following table. Because certain of these items and their<br />
impact on our performance are difficult to predict, management believes presentation of financial measures excluding the<br />
impact of those items provides useful supplemental information in evaluating the operating results of our core business and<br />
assessing trends in our core operations reflected in the current quarter and year-to-date results. These disclosures should<br />
not be viewed as a substitute for net <strong>inc</strong>ome (loss) as determined in accordance with GAAP, nor are they necessarily<br />
comparable to non-GAAP performance measures that may be presented by other companies. The reconciliation of net loss<br />
to earnings from core operations, as defined as net loss adjusted to exclude provision for loan loss expense, charges and<br />
losses related to nonperforming assets and <strong>inc</strong>ome tax benefit follows:<br />
Twelve months ended<br />
12/31/09 12/31/08 12/31/07<br />
(Dollars In Thousands)<br />
Net <strong>inc</strong>ome (loss) $ (51,172) $ (5,911) $ 10,786<br />
Provision for loan losses 51,188 18,050 2,400<br />
Loss (gain) on sale and writedown of other assets 5,015 1,853 (81)<br />
Carrying charges related to nonperforming assets 3,291 956 199<br />
Lost interest on nonaccrual loans 5,951 3,593 753<br />
Deposit insurance premiums 4,138 327 108<br />
Goodwill impairment 5,985 - -<br />
Valuation allowance for deferred tax assets 11,136 - -<br />
Current <strong>inc</strong>ome tax expense (benefit) (18,880) (3,554) 5,681<br />
Earnings from core operations $ 16,652 $ 15,314 $ 19,846<br />
Loan and Deposit Composition<br />
Total assets decreased $118.2 million, or 8.8%, from $1.35 billion at the end of 2008 to $1.23 billion at the end of 2009.<br />
Total loans decreased $151.4 million, or 15.8%, to $805.3 million and total deposits decreased $78.5 million, or 7.0%, to<br />
$1.05 billion during 2009. In our South Georgia market, loans decreased $32.9 million, or 8.4%, in 2009 due primarily to<br />
a $21.5 million decrease in residential mortgages and a $6.7 million decrease in commercial loans, while deposits<br />
decreased $68.1 million, or 10.8%. In our North Georgia market, loans decreased $98.1 million, or 22.3%, due primarily<br />
to a $78.5 million decrease in construction and development loans and a $9.6 million decrease in commercial loans, while<br />
deposits only decreased 0.6%. In our Florida market, loans decreased $30.0 million, or 29.6%, due to a $28.7 million<br />
decrease in construction and development loans, while deposits <strong>inc</strong>reased $15.0 million, or 9.4%.<br />
29
A breakdown of loans and deposits for each region as of December 31, 2009 and 2008 and the percentage of net growth<br />
(or contraction) during 2009 is provided in the table below.<br />
Market/<br />
Number<br />
of Total Loans Total Deposits<br />
County Offices 2009 2008 % Chg 2009 2008 % Chg<br />
(Dollars in Thousands)<br />
South Georgia 13 $ 356,227 $ 389,085 (8.4) $ 564,670 $ 632,901 (10.8)<br />
Percent of Total 44.2 40.7 54.0 56.3<br />
North Georgia 5 $ 342,408 $ 440,500 (22.3) $ 120,379 $ 121,058 (0.6)<br />
Percent of Total 42.5 46.0 11.5 10.8<br />
Florida 2 $ 71,407 $ 101,442 (29.6) $ 174,221 $ 159,190 9.4<br />
Percent of Total 8.9 10.6 16.7 14.2<br />
Treasury - $ 35,272 $ 25,661 37.5 $ 185,945 $ 210,554 (11.7)<br />
Percent of Total 4.4 2.7 17.8 18.7<br />
Total $ 805,314 $ 956,688 (15.8) $1,045,215 $1,123,703 (7.0)<br />
In addition to the geographic concentrations noted in the tables above, we had approximately $61.6 million in loans<br />
secured by real estate in Florida to customers of our South Georgia, North Georgia and Treasury offices at December 31,<br />
2009.<br />
A breakdown of loans and deposits by type as of December 31, 2009 and 2008 and the percentage of net growth (or<br />
contraction) during 2009 is provided in the table below.<br />
Loans<br />
2009 2008<br />
(Dollars in Thousands)<br />
Percentage<br />
Change<br />
Commercial and financial $ 84,771 $ 87,530 (3.2)<br />
Agricultural (<strong>inc</strong>luding loans secured by farmland) 40,215 48,647 (17.3)<br />
Real estate - construction and development 204,663 315,786 (35.2)<br />
Real estate – commercial 275,927 276,645 (0.3)<br />
Real estate – residential 174,879 196,306 (10.9)<br />
Installment loans to individuals and others 24,949 32,084 (22.2)<br />
805,404 956,998 (15.8)<br />
Deferred loan fees and unearned interest, net (90) (310) (71.0)<br />
Total loans 805,314 956,688 (15.8)<br />
Allowance for loan losses (29,314) (19,374) 51.3<br />
Net loans $ 776,000 $ 937,314 (17.2)<br />
Deposits<br />
Noninterest-bearing demand $ 100,458 $ 91,114 10.3<br />
Interest-bearing demand and savings 250,232 252,122 (0.7)<br />
Time less than $100,000 314,148 328,329 (4.3)<br />
Time greater than or equal to $100,000 217,833 198,845 9.5<br />
Retail time placed in CDARS program 29,532 46,690 (36.7)<br />
Brokered 133,012 206,603 (35.6)<br />
Total deposits $ 1,045,215 $ 1,123,703 (7.0)<br />
30
At December 31, 2009, commercial real estate loans represented 34.3% of our total loans, and this segment of our<br />
portfolio was equivalent to 460.9% of our regulatory Tier 1 capital. An additional 25.4% of our loan portfolio was<br />
comprised of construction and development loans, which represents 341.9% of our regulatory Tier 1 capital.<br />
In an effort to diversify our loan portfolio from commercial real estate (which <strong>inc</strong>ludes construction and development<br />
lending and commercial mortgages), we began focusing on originating non-real estate secured commercial loans and<br />
residential mortgages in early 2008. As a percentage of total loans, the commercial loans segment of our portfolio<br />
<strong>inc</strong>reased from 9.2% at the end of 2008 to 10.5% at the end of 2009.<br />
Overall, our construction and development loans decreased $111.1 million, or 35.2%, while our residential mortgages<br />
decreased $21.4 million, or 10.9%, during 2009 as compared to 2008. Beginning in the fourth quarter of 2006 and<br />
continuing throughout 2009, we have observed a significant slowdown in residential construction and development<br />
activities in our markets. This slowdown has been more severe in certain sections of our North Georgia and Florida<br />
markets.<br />
Real Estate Market Conditions on the south side of the Atlanta MSA<br />
With approximately 14% of our loan portfolio concentrated in residential construction and development loans and an<br />
additional 22% of our loan portfolio in residential mortgages, we monitor and evaluate economic trends in our residential<br />
real estate markets. S<strong>inc</strong>e the second half of 2007, finished housing inventories and the supply of vacant developed lots<br />
have continued to <strong>inc</strong>rease in several of our markets in the Atlanta MSA as the number of home sales, new building<br />
permits and housing starts have decreased. The table below summarizes, from data available to the Company, the<br />
inventory supply trends for housing and vacant developed lots for select counties on the south side of the Atlanta MSA<br />
where we have a significant presence in residential real estate construction and development loans and other real estate<br />
owned. These statistics are based on estimated absorption rates using actual house sales compared to the number of houses<br />
for sale and housing starts and/or building permits compared to the number of vacant developed lots available. The actual<br />
absorption periods may differ from these estimates given changes in the future volume of home sales and housing starts.<br />
For the Quarter Ended Dec-09 Dec-08 Dec-07 Dec-06<br />
Housing Inventory:<br />
(Number of Months Supply)<br />
Henry County 9.4 14.0 11.5 9.1<br />
Clayton County 9.1 15.1 9.5 12.2<br />
Newton County 10.7 14.5 11.1 7.4<br />
South Fulton County 10.4 9.5 8.0 7.8<br />
Vacant Developed Lots Inventory:<br />
Henry County 300.1 291.0 86.0 27.0<br />
Clayton County 304.4 169.0 53.0 26.0<br />
Newton County 620.5 326.0 64.0 24.0<br />
South Fulton County 291.8 126.0 57.0 23.0<br />
The table below sets forth, based on data from the U.S. Census Bureau, the number of single family housing permits<br />
issued in select counties on the south side of the Atlanta MSA over the past four years.<br />
For the Year Ended Dec-09 Dec-08 Dec-07 Dec-06<br />
Housing Permits:<br />
(Number of Single Family Housing Permits Issued)<br />
Henry County 243 492 1,650 2,992<br />
Clayton County 84 403 1,238 2,226<br />
Newton County 54 188 952 1,678<br />
31
STATISTICAL DISCLOSURES<br />
Distribution of Assets, Liabilities and Stockholders’ Equity; Interest Rates and Interest Differential<br />
From September 2007 to December 2008, the Federal Open Market Committee of the Federal Reserve (“FOMC”) reduced<br />
the federal funds rate 10 times, in various <strong>inc</strong>rements, from 5.25% to 0.25%. Being in an asset-sensitive interest rate<br />
position on our balance sheet (our earning assets reprice more frequently than our rate-sensitive liabilities), we benefited<br />
during the period of rising interest rates from June 2004 to June 2006. Conversely, our earnings decreased in the recent<br />
declining interest rate environment. We discuss our interest rate risk in further detail in Item 7A. Below, we have<br />
summarized the impact that changes in interest rates and changes in our balance sheet have had on our earnings over the<br />
past three years.<br />
Rate / Volume Analysis<br />
The following table shows a summary of the changes in interest <strong>inc</strong>ome and interest expense on a fully taxable equivalent<br />
basis resulting from changes in volume and changes in rates for each category of interest-earning assets and interestbearing<br />
liabilities. The change in interest attributable to rate has been determined by applying the change in rate between<br />
years to average balances outstanding in the later year. The change in interest due to volume has been determined by<br />
applying the rate from the earlier year to the change in average balances outstanding between years. Thus, changes that<br />
are not solely due to volume have been consistently attributed to rate.<br />
For the Years Ended December 31, 2009 vs. 2008 2008 vs. 2007<br />
Increase Changes Due To Increase Changes Due To<br />
(Decrease) Rate Volume (Decrease) Rate Volume<br />
(Dollars In Thousands)<br />
Increase (decrease) in<br />
<strong>inc</strong>ome from interest-earning assets:<br />
Loans $ (9,379) $ (6,823) $ (2,556) $ (12,374) $ (18,404) $ 6,030<br />
Taxable investment securities (1,056) (763) (293) (532) 105 (637)<br />
Nontaxable investment securities (994) 33 (1,027) 93 (5) 98<br />
Other short-term investments (2) (1,084) 1,082 (865) (1,255) 390<br />
Total interest <strong>inc</strong>ome (11,431) (8,637) (2,794) (13,678) (19,559) 5,881<br />
Increase (decrease) in<br />
expense from interest-bearing liabilities:<br />
Demand deposits (4,048) (2,878) (1,170) (5,811) (4,469) (1,342)<br />
Savings deposits (115) (118) 3 (360) (332) (28)<br />
Time deposits (858) (5,396) 4,538 598 (4,569) 5,167<br />
FHLB advances 195 139 56 (113) (637) 524<br />
Notes payable 424 (506) 930 (187) (187) -<br />
Other short-term borrowings (245) (144) (101) (118) (195) 77<br />
Total interest expense (4,647) (8,903) 4,256 (5,991) (10,389) 4,398<br />
Net interest <strong>inc</strong>ome $ (6,784) $ 266 $ (7,050) $ (7,687) $ (9,170) $ 1,483<br />
During 2009, we had an average investment in impaired loans of $68.2 million. If these impaired loans had remained<br />
current and on accrual status during 2009, we would have recorded an additional $6.0 million of interest <strong>inc</strong>ome. This is<br />
compared to $3.6 million of lost interest <strong>inc</strong>ome on an average investment of $38.8 million of impaired loans during 2008.<br />
32
Average Balances, Interest and Yields<br />
The following table details the average balance of interest-earning assets and interest-bearing liabilities, the amount of<br />
interest earned and paid, and the average yields and rates realized for each of the last three years. Federally tax-exempt<br />
<strong>inc</strong>ome is presented on a taxable-equivalent basis assuming a 34% Federal tax rate in 2009 and 2008 and a 35% Federal<br />
tax rate in 2007. Loan average balances <strong>inc</strong>lude loans on nonaccrual status. Other short-term investments <strong>inc</strong>lude federal<br />
funds sold and interest-bearing deposits in other banks.<br />
For the Years Ended<br />
December 31, 2009 2008 2007<br />
Interest Average Interest Average Interest Average<br />
Average Income/ Yield/ Average Income/ Yield/ Average Income/ Yield/<br />
Balance Expense Rate Balance Expense Rate Balance Expense Rate<br />
(Dollars In Thousands)<br />
ASSETS<br />
Interest-earning assets:<br />
Loans $ 915,674 $ 52,307 5.71% $ 955,253 $ 61,686 6.46% $ 883,334 $ 74,060 8.38%<br />
Investment securities:<br />
Taxable 141,513 6,622 4.68% 147,125 7,679 5.22% 159,510 8,211 5.15%<br />
Nontaxable 15,526 952 6.14% 32,616 1,961 6.01% 30,998 1,868 6.03%<br />
Other short-term<br />
investments 132,627 324 0.24% 30,631 326 1.06% 23,076 1,191 5.16%<br />
Total interestearning<br />
assets 1,205,340 60,205 4.99% 1,165,625 71,652 6.15% 1,096,918 85,330 7.78%<br />
Noninterest-earning assets:<br />
Cash 14,760 18,412 20,534<br />
Allowance for loan losses (24,300) (15,670) (11,264)<br />
Unrealized gain (loss)<br />
on securities<br />
available for sale 2,364 (323) (1,993)<br />
Other assets 105,863 70,831 61,112<br />
Total assets $ 1,304,027 $ 1,238,875 $ 1,165,307<br />
LIABILITIES AND<br />
STOCKHOLDERS' EQUITY<br />
Interest-bearing liabilities:<br />
Demand deposits $ 210,874 $ 1,190 0.56% $ 271,498 $ 5,238 1.93% $ 309,037 $ 11,049 3.58%<br />
Savings deposits 35,846 89 0.25% 35,381 204 0.58% 37,231 564 1.51%<br />
Time deposits 713,315 25,014 3.51% 606,878 25,873 4.26% 503,870 25,275 5.02%<br />
FHLB advances 101,390 4,151 4.09% 99,975 3,956 3.96% 88,569 4,069 4.59%<br />
Notes payable 28,063 964 3.43% 10,310 540 5.24% 10,310 727 7.05%<br />
Other short-term<br />
borrowings 10,698 163 1.52% 14,199 408 2.88% 12,392 526 4.25%<br />
Total interestbearing<br />
liabilities 1,100,186 31,571 2.87% 1,038,241 36,219 3.49% 961,409 42,210 4.39%<br />
Noninterest-bearing liabilities<br />
and stockholders' equity:<br />
Demand deposits 109,317 97,839 98,475<br />
Other liabilities 5,382 5,918 7,368<br />
Stockholders' equity 89,142 96,877 98,055<br />
Total liabilities and<br />
stockholders' $ 1,304,027 $ 1,238,875 $ 1,165,307<br />
equity<br />
Interest rate spread 2.13% 2.66% 3.39%<br />
Net interest <strong>inc</strong>ome $ 28,634 $ 35,433 $ 43,120<br />
Net interest margin 2.38% 3.04% 3.93%<br />
33
Investment Portfolio<br />
The book value of investment securities at the indicated dates are presented below. Changes in the mix of our investment<br />
portfolio will vary over time in response to changes in market conditions and liquidity needs of the Bank. During 2009,<br />
we reduced our exposure to mortgage-backed securities and we also reduced state and municipal securities due to a<br />
decrease in our ability to realize the tax benefits which they were originally purchased to provide. Overall, in 2009 we<br />
elected to shrink the size of our investment portfolio for liquidity purposes.<br />
As of December 31, 2009 2008 2007<br />
$ Amount % to Total $ Amount % to Total $ Amount % to Total<br />
(Dollars in Thousands)<br />
U. S. Government agency securities $ 30,468 25.2% $ 35,303 19.0% $ 70,235 36.1%<br />
State and municipal securities 9,721 8.0% 30,361 16.3% 32,332 16.6%<br />
Mortgage-backed securities 67,523 55.8% 103,413 55.7% 77,201 39.6%<br />
Corporate debt securities 3,829 3.2% 6,965 3.8% 6,507 3.3%<br />
Equity securities 9,460 7.8% 9,731 5.2% 8,519 4.4%<br />
Total investments $ 121,001 100.0% $ 185,773 100.0% $ 194,794 100.0%<br />
Total investments as a percentage of total assets 9.8% 13.8% 16.3%<br />
At December 31, 2009, the estimated fair market value of our investment portfolio was approximately $695,000, or 0.6%,<br />
above our amortized cost; however, market values may fluctuate significantly as interest rates change.<br />
Our investment portfolio policy stresses quality and liquidity. The bonds which are purchased as investments carry an “A”<br />
rating or better by either Standard and Poor’s or Moody’s Investors Service, Inc. or have been reviewed for credit and<br />
market risk and deemed appropriate for the Bank’s portfolio by management. The portfolio is monitored to assure there is<br />
no unreasonable concentration of securities in the obligations of a single issuer. We do not carry any “sub-prime”<br />
mortgages, structured investment vehicles, or collateralized debt obligations in our portfolio. We also monitor the insurers<br />
of our state and municipal securities, and the distribution of such securities among the insurers. At December 31, 2009,<br />
four different carriers, with no one carrier insuring more than 25% of the total, insured our state and municipal securities.<br />
The table below shows the distribution by insurer of our state and municipal securities as of December 31, 2009.<br />
As of December 31, 2009 $ Amount % to Total<br />
(Dollars in Thousands)<br />
CIFG Assurance North America $ 774 8.0%<br />
MBIA Corporation 614 6.3%<br />
<strong>Financial</strong> Security Assurance Inc. 737 7.6%<br />
Assured Guaranty Corporation 2,408 24.8%<br />
Uninsured 5,188 53.3%<br />
Total state and municipal securities $ 9,721 100.00%<br />
The following table shows the maturities of non-equity investment securities at December 31, 2009 and the weightedaverage<br />
yields (on a fully taxable basis assuming a 34% tax rate) on such securities. The maturities presented for<br />
mortgage-backed securities are based on the average lives of those bonds at the then projected prepayment speeds. Actual<br />
maturities usually differ from contractual maturities because certain security issuers have the right to call or prepay<br />
obligations with or without call or prepayment penalties. Of the investments in U.S. Government agency securities<br />
maturing after one year, approximately $17.1 million, or 56%, are potentially callable at par value within one year.<br />
U.S. Government State and Municipal Mortgage-Backed Corporate Debt<br />
Agency Securities Securities Securities Securities<br />
As of December 31, 2009 Amount Yield Amount Yield Amount Yield Amount Yield<br />
(Dollars in Thousands)<br />
Due in one year or less $ - - $ - - $ - - $ - -<br />
Due after one year through five years - - - - - - 857 6.75%<br />
Due after five years through ten years 15,357 4.42% 493 3.86% 776 4.52% - -<br />
Due after ten years 15,111 4.48% 9,228 4.11% 66,747 4.27% 2,972 4.86%<br />
Total $ 30,468 4.45% $ 9,721 4.10% $ 67,523 4.27% $ 3,829 5.28%<br />
34
Loan Portfolio<br />
We make both secured and unsecured loans to individuals, corporations, and other entities with the goals of safety,<br />
soundness, profitability and responsiveness to community needs. Our loan portfolio contains no foreign or energy-related<br />
loans or significant concentrations in any one industry or loan type, with the exception of loans secured by residential and<br />
commercial real estate in our market areas.<br />
Types of Loans<br />
The amount of loans outstanding at the indicated dates is presented in the following table according to type of loan.<br />
As of December 31, 2009 2008 2007 2006 2005<br />
(Dollars in Thousands)<br />
Commercial and financial $ 84,771 $ 87,530 $ 78,730 $ 66,376 $ 50,860<br />
Agricultural (<strong>inc</strong>luding loans secured by farmland) 40,215 48,647 41,861 43,302 55,830<br />
Real estate - construction and development 204,663 315,786 352,732 295,246 268,629<br />
Real estate - commercial 275,927 276,645 248,272 255,462 231,601<br />
Real estate – residential 174,879 196,306 174,157 142,501 127,326<br />
Installment loans to individuals and other 24,949 32,084 26,011 18,414 20,380<br />
805,404 956,998 921,763 821,301 754,626<br />
Deferred loan fees and unearned interest, net (90) (310) (414) (997) (1,688)<br />
805,314 956,688 921,349 820,304 752,938<br />
Allowance for loans losses (29,314) (19,374) (12,906) (11,006) (11,079)<br />
Loans, net $ 776,000 $ 937,314 $ 908,443 $ 809,298 $ 741,859<br />
The percentage of loans outstanding at the indicated dates is presented in the following table according to type of loan.<br />
As of December 31, 2009 2008 2007 2006 2005<br />
Commercial and financial 10.53% 9.15% 8.55% 8.09% 6.75%<br />
Agricultural (<strong>inc</strong>luding loans secured by farmland) 4.99% 5.08% 4.54% 5.28% 7.41%<br />
Real estate - construction and development 25.41% 33.01% 38.28% 35.99% 35.68%<br />
Real estate - commercial 34.26% 28.92% 26.95% 31.14% 30.76%<br />
Real estate – residential 21.72% 20.52% 18.90% 17.37% 16.91%<br />
Installment loans to individuals and other 3.10% 3.35% 2.82% 2.24% 2.71%<br />
100.01% 100.03% 100.04% 100.12% 100.22%<br />
Deferred loan fees and unearned interest, net -0.01% -0.03% -0.04% -0.12% -0.22%<br />
100.00% 100.00% 100.00% 100.00% 100.00%<br />
Allowance for loans losses -3.64% -2.03% -1.40% -1.34% -1.47%<br />
Loans, net 96.36% 97.97% 98.60% 98.66% 98.53%<br />
During 2009, the loan portfolio decreased $151.4 million, or 15.8%, from $956.7 million at December 31, 2008 to<br />
$805.3 million at December 31, 2009. Over the past five years, the composition of the loan portfolio has shifted as<br />
commercial real estate mortgages <strong>inc</strong>reased from 30.8% of our portfolio in 2005 to 34.3% in 2009, and construction and<br />
land development loans decreased from 35.7% of our portfolio to 25.4% of our portfolio during that same time. The<br />
majority of our construction and development loans are in our North Georgia market. Of the $204.7 million in<br />
construction and development loans outstanding at the end of 2009, $103.4 million, or 50.5%, originated in our North<br />
Georgia offices.<br />
35
Below is a table showing the collateral distribution of our construction and development and commercial real estate loan<br />
portfolios as of December 31, 2009, 2008 and 2007.<br />
2009 2008 2007<br />
$ Amount % to Total $ Amount % to Total $ Amount % to Total<br />
(Dollars in Thousands)<br />
Construction and development:<br />
Acquisition and development:<br />
1-4 family residential $ 83,868 41.0% $ 129,412 41.0% $ 130,097 36.9%<br />
Commercial and multi-family 58,477 28.6% 95,934 30.4% 105,718 30.0%<br />
Construction:<br />
1-4 family residential spec 10,364 5.1% 19,182 6.1% 40,392 11.4%<br />
1-4 family residential pre-sold 304 0.1% 112 0.1% 1,604 0.4%<br />
1-4 family residential other 14,501 7.1% 23,423 7.4% 26,694 7.6%<br />
Commercial owner-occupied 704 0.3% 3,340 1.0% 5,685 1.6%<br />
Commercial not owner-occupied 27,994 13.7% 27,038 8.5% 17,497 5.0%<br />
Hotel/motel 2,427 1.2% 7,949 2.5% 12,909 3.7%<br />
Industrial - 0.0% - 0.0% - 0.0%<br />
Multi-family properties 4,512 2.2% 6,538 2.1% 7,789 2.2%<br />
Special purpose property 1,512 0.7% 2,858 0.9% 2,337 0.6%<br />
Other - 0.0% - 0.0% 2,010 0.6%<br />
Total construction and development loans $ 204,663 100.0% $ 315,786 100.0% $ 352,732 100.0%<br />
% of total loans 25.41% 33.0% 38.3%<br />
2009 2008 2007<br />
$ Amount % to Total $ Amount % to Total $ Amount % to Total<br />
Commercial real estate:<br />
Owner-occupied:<br />
Office $ 40,718 14.8% $ 41,617 15.0% $ 34,291 13.8%<br />
Retail 18,576 6.7% 21,062 7.6% 22,114 8.9%<br />
Other 39,783 14.4% 40,413 14.6% 34,263 13.8%<br />
Not owner-occupied:<br />
Office 27,342 9.9% 25,425 9.2% 29,210 11.8%<br />
Retail 36,525 13.2% 36,085 13.1% 36,780 14.8%<br />
Other 24,035 8.7% 24,656 8.9% 27,418 11.0%<br />
Other:<br />
Hotel/motel 25,756 9.3% 15,812 5.7% 11,399 4.6%<br />
Industrial 4,300 1.6% 4,677 1.7% 2,626 1.1%<br />
Multi-family properties 19,462 7.1% 22,685 8.2% 14,894 6.0%<br />
Special purpose property 38,748 14.0% 39,240 14.2% 34,876 14.0%<br />
Other 683 0.3% 4,973 1.8% 401 0.2%<br />
Total commercial real estate loans $ 275,927 100.0% $ 276,645 100.0% $ 248,272 100.0%<br />
% of total loans 34.3% 28.9% 26.9%<br />
36
A summary of loans from each market outstanding at December 31, 2009 is presented in the following table.<br />
South Georgia North Georgia Florida<br />
Market Market Market Treasury Total<br />
(Dollars in Thousands)<br />
Commercial and financial $ 27,866 $ 41,013 $ 3,497 $ 12,395 $ 84,771<br />
Agricultural (<strong>inc</strong>luding loans secured by farmland) 31,296 2,754 6,165 - 40,215<br />
Real estate - construction and development 69,842 103,359 29,756 1,706 204,663<br />
Real estate - commercial 97,417 145,317 22,501 10,692 275,927<br />
Real estate – residential 117,375 44,485 9,494 3,525 174,879<br />
Installment loans to individuals and others 12,237 5,607 114 6,991 24,949<br />
356,033 342,535 71,527 35,309 805,404<br />
Deferred loan fees and unearned interest, net 194 (127) (120) (37) (90)<br />
356,227 342,408 71,407 35,272 805,314<br />
Allowance for loan losses (9,658) (12,785) (1,541) (5,330) (29,314)<br />
$ 346,569 $ 329,623 $ 69,866 $ 29,942 $ 776,000<br />
Maturities and Sensitivities of Loans to Changes in Interest Rates<br />
A schedule of loans maturing, based on contractual terms, is presented in the following table for selected loan types.<br />
Commercial Real Estate - Real Estate - Real Estate - All Other<br />
As of December 31, 2009 & <strong>Financial</strong> Agricultural Construction Commercial Residential Loans Total<br />
(Dollars in Thousands)<br />
Due in one year or less $ 67,375 $ 28,118 $ 163,419 $ 80,252 $ 47,755 $ 4,320 $ 391,239<br />
Due after one year through five years 16,906 11,406 37,973 157,834 80,061 13,779 317,959<br />
Due after five years 490 691 3,271 37,841 47,063 6,850 96,206<br />
Total $ 84,771 $ 40,215 $ 204,663 $ 275,927 $ 174,879 $ 24,949 $ 805,404<br />
Of the above loans maturing after one<br />
year,<br />
those with predetermined fixed rates $ 11,984 $ 7,836 $ 9,550 $ 144,394 $ 91,303 $ 4,987 $ 270,054<br />
those with floating or adjustable rates 5,412 4,261 31,694 51,281 35,821 15,642 144,111<br />
Total maturing after one year $ 17,396 $ 12,097 $ 41,244 $ 195,675 $ 127,124 $ 20,629 $ 414,165<br />
Prior to 2006, we historically preferred to offer loans to our commercial customers on a floating rate basis, usually tied to a<br />
prime interest rate. This preference has contributed to our asset-sensitive interest rate risk position. During 2006 and<br />
2007, we moderated our preferences and began competing for more fixed-rate commercial and residential mortgages. At<br />
December 31, 2009, approximately 66% of our loan portfolio will either mature or reprice within the next 12 months. We<br />
began implementing interest rate floors on our variable rate loans during the third quarter of 2008. As of December 31,<br />
2009, we had <strong>inc</strong>luded interest rate floors on approximately $290 million of our variable rate loans with a weighted<br />
average floor of 5.65%. In contrast, the remaining approximately $92 million variable rate loans without interest rate<br />
floors carried a weighted average rate of 4.37%.<br />
37
Nonaccrual, Past Due and Restructured Loans<br />
Our nonperforming loans <strong>inc</strong>reased $37.8 million, from $55.4 million at December 31, 2008 to $93.2 million at December<br />
31, 2009, due primarily to the adverse economic and real estate market conditions in our North Georgia and Florida<br />
markets. As a percentage of total loans, nonperforming loans as a percentage of total loans <strong>inc</strong>reased 578 basis points to<br />
11.57% at December 31, 2009 from 5.79% at December 31, 2008. Approximately 55% of nonperforming loans at<br />
December 31, 2009 were construction and development loans, and these loans represented approximately 25% of our total<br />
portfolio of construction and development loans. A schedule of our nonperforming loans at December 31, 2009 is<br />
presented in the following table.<br />
Net Carrying<br />
Category<br />
Value * Collateral Description Average Carrying Value/ Unit<br />
Construction and Development<br />
$30.5 million<br />
24 parcels of undeveloped<br />
land totaling 2,813 acres<br />
$9,400 per residential acre<br />
$14,900 per commercial acre<br />
Construction and Development $5.1 million 310 residential lots $16,500 per lot<br />
1-4 Family Residential $10.8 million 82 houses $132,000 per house<br />
Commercial Real Estate $29.5 million 33 commercial properties $892,200 per property<br />
Agriculture<br />
$2.0 million<br />
3 parcels of farm land<br />
totaling 373 acres<br />
$5,400 per acre<br />
Commercial and Industrial $357,000 Non-real estate collateral $35,700 per loan<br />
Multi-Family Residential $2.1 million 9 condominium units $232,700 per unit<br />
Consumer $373,000 Non-real estate collateral $53,000 per loan<br />
Total<br />
$80.7 million<br />
* The term “net carrying value” represents the book value of the loan less any allocated allowance for loan losses.<br />
The table below summarizes our levels of nonperforming loans and the level of reserves allocated to those loans at the<br />
indicated dates.<br />
As of December 31, 2009 2008 2007 2006 2005<br />
(Dollars in Thousands)<br />
Loans accounted for on a nonaccrual basis $ 92,272 $ 54,903 $ 11,405 $ 4,013 $ 7,856<br />
Accruing loans which are contractually past due<br />
90 days or more as to pr<strong>inc</strong>ipal or interest payments 15 206 37 34 2<br />
Troubled debt restructurings not <strong>inc</strong>luded above 881 311 - - -<br />
Total nonperforming loans $ 93,168 $ 55,420 $ 11,442 $ 4,047 $ 7,858<br />
Ratio of nonperforming loans to total loans (%) 11.57 5.79 1.24 0.49 1.04<br />
Reserves allocated to nonperforming loans:<br />
Specific Reserves (FAS 114) $ 12,056 $ 2,888 $ 1,577 $ - $ 1,155<br />
General Reserves (FAS 5) 388 1,188 397 602 80<br />
Total reserves allocated to nonperforming loans $ 12,444 $ 4,076 $ 1,974 $ 602 $ 1,235<br />
Total reserves allocated as a percentage of nonperforming loans 13.36% 7.35% 17.25% 14.86% 15.71%<br />
38
The following table summarizes our nonperforming assets by type and market as of December 31, 2009.<br />
North<br />
Georgia<br />
South<br />
Georgia Florida Treasury Total<br />
(Dollars In Thousands)<br />
Loans accounted for on a nonaccrual basis $ 36,840 $ 29,525 $ 25,907 $ - $ 92,272<br />
Accruing loans which are contractually past due<br />
90 days or more as to pr<strong>inc</strong>ipal or interest payments - - - 15 15<br />
Troubled debt restructurings not <strong>inc</strong>luded above 881 - - - 881<br />
Foreclosed assets 71,999 2,882 17,236 - 92,117<br />
Total nonperforming assets $ 109,720 $ 32,407 $ 43,143 $ 15 $ 185,285<br />
The accrual of interest on loans is discontinued when, in our judgment, the borrower may be unable to meet payments as<br />
they become due, unless the loan is well secured. All interest accrued for loans that are placed on nonaccrual status is<br />
reversed against interest <strong>inc</strong>ome. Interest <strong>inc</strong>ome on nonaccrual loans is subsequently recognized only to the extent cash<br />
payments are received or until the loan is returned to accrual status. For the year ended December 31, 2009, the gross<br />
interest <strong>inc</strong>ome that would have been recorded if our nonperforming loans had been current in accordance with their<br />
original terms was approximately $6.0 million. The amount of interest <strong>inc</strong>ome on the above nonperforming loans that was<br />
<strong>inc</strong>luded in net <strong>inc</strong>ome for the year ended December 31, 2009 was approximately $104,000. The allowance for loan losses<br />
related to our nonperforming loans amounted to approximately $12.4 million and $4.1 million at December 31, 2009 and<br />
2008, respectively.<br />
Potential Problem Loans<br />
In addition to our nonperforming loans discussed above, we have identified $28.9 million in potential problem loans as of<br />
December 31, 2009. These are construction and land development loans that were past due 30 to 89 days at year-end.<br />
Potential problem loans are loans where known credit problems of the borrowers causes management doubt the ability of<br />
such borrowers to comply with the present repayment terms. This may result in disclosure of such loans as nonperforming<br />
in future periods.<br />
At December 31, 2009, we had $57.3 million in total delinquent loans (loans past due 30 days or more) and still accruing<br />
interest, or 7.11% of total loans, representing an <strong>inc</strong>rease from 2.25% of total loans at December 31, 2008.<br />
Other real estate owned<br />
Our foreclosed assets <strong>inc</strong>reased $66.8 million in 2009, from $25.3 million at December 31, 2008 to $92.1 million at<br />
December 31, 2009. Due to economic conditions primarily in the Atlanta area, some builders and developers have been<br />
unable to satisfy their obligations to us and we have foreclosed on their collateral. However, we have decided to select<br />
certain parcels of foreclosed assets to hold rather than to force distressed sales of these properties in this market. A<br />
schedule of the foreclosed real estate held at December 31, 2009 is presented in the following table. In addition to the real<br />
estate listed in the table, we also own $904,000 in foreclosed non-real estate collateral at December 31, 2009.<br />
Category Book Value Description Average Value/ Unit<br />
Construction and Development $39.3 million<br />
33 parcels of undeveloped $11,300 per residential acre<br />
land totaling 1,773 acres $72,300 per commercial acre<br />
Construction and Development $17.8 million 794 residential lots $22,400 per lot<br />
1-4 Family Residential $8.6 million 69 houses $132,200 per house<br />
Commercial Real Estate $19.1 million 28 commercial properties $681,500 per property<br />
Multi-Family Residential $6.4 million 8 condominium units $800,000 per unit<br />
Total<br />
$91.2 million<br />
39
Allowance For Loan Losses<br />
At December 31, 2009, our allowance for loan losses as a percentage of total loans was 3.64%, compared to 2.03% at<br />
December 31, 2008. We consider the current level of the allowance for loan losses adequate to absorb losses from loans in<br />
the portfolio. As an integral part of our credit risk management process, we regularly review loans in our portfolio for<br />
credit quality and documentation of collateral. The lenders are primarily responsible for assigning a risk grade to each<br />
loan in their portfolio. Early in 2008 we created a Special Assets Group, which reports to our chief credit officer and is<br />
comprised of bankers, workout specialists, real estate professionals and collections and recovery department personnel.<br />
Once a loan is classified as a troubled loan or falls into a default or collection/ workout situation, it is turned over to our<br />
Special Assets Group to manage the resolution process. The Special Assets Group provides assessments and progress<br />
reports to our Problem Asset Committee. Our Problem Asset Committee consists of senior members of management with<br />
expertise in credit administration, collections, accounting and real estate. The Problem Asset Committee has direct<br />
responsibility for assessing the adequacy of the risk-grading process, determining the specific allowance valuations and<br />
affirming the methodology used for determining the adequacy of our allowance for loan losses. The Problem Asset<br />
Committee reviews the assessments on all nonperforming assets over $100,000 on a quarterly basis and all nonperforming<br />
assets over $500,000 on a monthly basis. The assessments prepared by the Special Assets Group are supplemented with<br />
independent reviews conducted by our credit administration and internal audit departments. We have also engaged an<br />
independent, external loan review firm to perform quarterly targeted reviews of a cross-section of our loan portfolio.<br />
These independent loan reviews are designed to verify the accuracy of our internal risk-grading process and compliance<br />
with our loan policy and regulatory and accounting guidance. Further, we have engaged a commercial real estate<br />
brokerage firm to serve as external real estate advisors for the management, marketing and disposition of our other real<br />
estate owned (“OREO”).<br />
Appraisals or other collateral value assessments are generally updated when one of several different circumstances occur;<br />
when doing loan renewals or modifications, when loans are down-graded to non-pass risk rating grades, when it becomes<br />
apparent that a loan is collaterally dependent, and/or when the Bank determines it is in its best interest to take possession<br />
of the underlying collateral. Factors typically used in determining the need to obtain a current appraisal <strong>inc</strong>lude the<br />
existence of any adverse physical changes in the condition of the collateral s<strong>inc</strong>e the last appraisal, whether there have<br />
been any material changes in market conditions which would adversely effect collateral value, whether there has been any<br />
material adverse change in the financial condition of the borrower and/or guarantors, whether the original appraisal<br />
contained assumptions that are no longer valid and whether or not the use, or planned use of the collateral is different from<br />
the use identified in the last appraisal. In addition, other factors <strong>inc</strong>lude whether or not any additional funds are being<br />
advanced under a renewal or modification, the nature of and reasons behind a modification, whether or not the loan can be<br />
repaid via verifiable sources other than the sale of the underlying collateral, and the age of the existing collateral<br />
evaluation. When the Bank takes possession of collateral, a current collateral evaluation is required to document the<br />
carrying value of the asset on the Bank’s balance sheet and policy requires all value assessments to be updated annually for<br />
assets with a carrying value of $250,000 or greater, or reviewed and updated as needed for assets with carrying values<br />
below $250,000. We began implementing these new procedures to better track those loan relationships that, by policy,<br />
require annual reviews of the loan/relationship in September 2009 and we conducted a full review of all real estate secured<br />
loans of $250,000 or more that were rated 6(special mention) or worse to ensure current appraisals were in the loan file in<br />
November 2009.<br />
Procedures followed by the Bank each month in monitoring the Bank’s problem loans <strong>inc</strong>lude the following: the Bank’s<br />
Problem Asset Committee reviews problem loans in the amount of $500,000 or greater on a monthly basis; quarterly the<br />
Bank’s Problem Asset Committee reviews problem loans in the amount of $100,000 or greater. Loan officers prepare<br />
written updates on all problem loans of $100,000 or greater on a quarterly basis. These regular meetings also <strong>inc</strong>lude a<br />
review of Other Real Estate Owned and Other Assets where the Bank has taken ownership as full or partial satisfaction of<br />
debt. If the Bank receives information on property sales in an area or appraisals of similar properties in an area near the<br />
property in question, the Bank may take write downs or establish specific reserves on these assets prior to receiving<br />
updated appraisals. The loan officer reviews the status of these loans on an ongoing basis with the market president and/or<br />
credit administration.<br />
We have a comprehensive methodology for determining the adequacy of our allowance for loan losses. We perform an<br />
allowance analysis quarterly that is broken down into the following three components: (1) specific allowances for<br />
individual loans, (2) allowances for pools of loans identified by credit risk grades or delinquency status, and (3) general<br />
allowances for all other loans pooled by loan type. The Problem Asset Committee has the responsibility for assessing the<br />
risk elements, determining the specific allowance valuations, and affirming the methodology used. The Board of Directors<br />
reviews management’s assessment and affirms the amount recorded.<br />
40
The first component of the allowance for loan loss methodology covers the measurement of specific allowances for<br />
individual impaired loans as required by FASB ASC 310-10-35, Accounting by Creditors for Impairment of a Loan. Each<br />
loan relationship with amounts due in excess of $500,000 that has been identified for potential credit weakness is<br />
evaluated for impairment. A loan is impaired when, based on current information and events, it is probable that the<br />
borrower will be unable to pay all amounts due according to the contractual terms of the loan agreement. By definition,<br />
we consider all loans on nonaccrual status and all loans whose terms have been modified in a troubled debt restructuring as<br />
impaired. If impairment is determined, a specific valuation is assessed on that loan based on realizable collateral values (if<br />
collateral dependent), discounted cash flows, or observable market values. As of December 31, 2009, we had current<br />
(dated within 12 months of December 31, 2009) third party appraisals of the collateral on $91.8 million, or 68%, of our<br />
impaired loans. We had pending sales contracts on the collateral on $9.1 million, or 7%, of our impaired loans. We had<br />
current collateral valuations (completed by a MAI appraiser) on collateral of $3.2 million, or 2%, of our impaired loans.<br />
The third party appraisals we had on the remaining $30.2 million, or 23% of our impaired loans were not current (dated<br />
over 12 months prior to December 31, 2009). For the 23% of our impaired loans where third party appraisers that were not<br />
current at December 31, 2009, 9% were appraisals dated between 12 months and 18 months old, 16% were appraisals<br />
dated between 18 months and 24 months old, 74% were appraisals dated greater than 24 months old, and 1% was non-real<br />
estate collateral. For the appraisals dated greater than 24 months old, we used recent area sales of equivalent properties,<br />
listing prices from local realtors, recent offers on the properties, current tax assessor values or local realtor estimates to<br />
estimate collateral value rather than the outdated appraisal. At December 31, 2009, we had $15.55 million in specific<br />
reserves on $134.32 million in individually evaluated impaired and other significant potential problem loans, compared to<br />
$3.41 million in specific reserves on $59.86 million in individually evaluated impaired and other significant potential<br />
problem at December 31, 2008. As of December 31, 2009, we reviewed $134.3 million of impaired loans and determined<br />
that no specific valuation was necessary on $80.9 million of these loans due to the underlying collateral value on these<br />
loans and the effect of previous charge-offs taken on these loans to reduce the pr<strong>inc</strong>ipal balance down to the underlying<br />
collateral value. When we partially charge-off a loan, the remaining loan balance remains in non-performing status.<br />
However, as we implement the new regulatory guidance on prudent commercial real estate workouts, we may begin to<br />
treat the remaining portion as performing, if it meets the qualifications under the new regulatory guidance.<br />
The second component of the allowance for loan loss methodology addresses all loans not individually evaluated for<br />
impairment but are either internally rated, criticized by our banking examiners, or past due 30 days or more. The<br />
allowance factors are based on industry standards and supported by our own historical loss analysis. At December 31,<br />
2009, we had $6.02 million in general reserves allocated to $203.9 million rated and delinquent loans. This is a decrease<br />
from the $7.39 million reserved on a lower balance of $200.5 million rated and delinquent loans at December 31, 2008 due<br />
to changes in environmental factors and historical loss analysis. However, we had $2.2 million of unallocated reserves at<br />
December 31, 2009 as discussed below.<br />
The third component of the allowance addresses general allowances on all loans not individually reserved due to<br />
impairment, rating or delinquency status. These loans are divided into smaller homogenous groups based on loan type.<br />
The allowances are determined by applying loss factors to each pool of loans with similar characteristics. The factors used<br />
are based on historical loss percentages for each pool adjusted by current known and documented internal and external<br />
environmental factors. The environmental factors considered in developing our loss measurements <strong>inc</strong>lude:<br />
• lending policies and procedures, <strong>inc</strong>luding changes in underwriting standards and collection, charge-off and<br />
recovery practices;<br />
• changes in international, national, regional and local economic and business conditions that affect the collectibility<br />
of the portfolio;<br />
• changes in the nature and volume of the loan portfolio;<br />
• experience, ability, and depth of lending management and other relevant staff;<br />
• levels of and trends in delinquencies and impaired loans;<br />
• changes in the quality of our loan review system;<br />
• value of underlying collateral for collateral-dependent loans;<br />
• existence and effect of any concentrations of credit, and changes in the level of such concentrations; and<br />
• other external factors such as competition and legal and regulatory requirements.<br />
41
The quantitative risk factors used in determining these general reserves require a high degree of management judgment.<br />
At December 31, 2009, we had $5.58 million in general reserves on $467.1 million in loans compared to $7.79 million in<br />
general reserves on $696.4 million in loans one year ago. In addition, we had $2.2 million of unallocated reserves at<br />
December 31, 2009, compared to $785,000 of unallocated reserves at December 31, 2008. This <strong>inc</strong>rease in unallocated<br />
reserves is primarily due to the continued deterioration of overall economic conditions.<br />
This evaluation is inherently subjective as it requires estimates that are susceptible to significant revision as more<br />
information becomes available. While we use the best information available to make the evaluation, future adjustments to<br />
the allowance may be necessary if there are significant changes in economic conditions or other environmental factors. In<br />
addition, regulatory agencies, as an integral part of their examination process, periodically review the Bank’s allowance<br />
for loan losses, and may require the Bank to make additions to the allowance based on their judgment about information<br />
available to them at the time of their examinations.<br />
Allocation of the Allowance for Loan Losses<br />
We have allocated the allowance for loan losses according to the amount deemed to be reasonably necessary at each year<br />
end to provide for the possibility of losses being <strong>inc</strong>urred within the categories of loans set forth in the table below. The<br />
allocation of the allowance to each category is not necessarily indicative of future losses and does not restrict the use of the<br />
allowance to absorb losses in any other category. The components of the allowance for loan losses for each of the past<br />
five years are presented below.<br />
As of December 31, 2009 2008 2007 2006 2005<br />
Percentage of Percentage of Percentage of Percentage of Percentage of<br />
Loans in Loans in Loans in Loans in Loans in<br />
Category Category Category Category Category<br />
to Total to Total to Total to Total to Total<br />
Amount Loans Amount Loans Amount Loans Amount Loans Amount Loans<br />
(Dollars in Thousands)<br />
Commercial and financial $ 1,415 10.5% $ 1,382 9.1% $ 229 8.6% $ 972 8.1% $ 2,670 6.7%<br />
Agricultural (<strong>inc</strong>luding<br />
loans secured by farmland) 196 5.0% 112 5.1% 1,029 4.5% 1,184 5.3% 323 7.4%<br />
Real estate - construction 16,828 25.4% 11,950 33.0% 8,383 38.2% 4,875 35.9% 4,427 35.5%<br />
Real estate - commercial 5,121 34.3% 2,552 28.9% 2,008 27.0% 2,276 31.1% 2,280 30.8%<br />
Real estate - residential 3,179 21.7% 2,417 20.5% 815 18.9% 547 17.4% 208 16.9%<br />
Consumer and other loans 415 3.1% 176 3.4% 215 2.8% 255 2.2% 512 2.7%<br />
Unallocated 2,160 N/A 785 N/A 227 N/A 897 N/A 659 N/A<br />
Total $ 29,314 100.0% $ 19,374 100.0% $ 12,906 100.0% $ 11,006 100.0% $ 11,079 100.0%<br />
42
Summary of Loan Loss Experience<br />
The following table summarizes the activity in the allowance for loan losses, the average balance of loans outstanding, and<br />
the ratio of net losses experienced for each of the last five years.<br />
For the Years Ended December 31, 2009 2008 2007 2006<br />
(Dollars in Thousands)<br />
Balance at beginning of year $ 19,374 $ 12,906 $ 11,006 $ 11,079 $ 9,066<br />
Charge-offs:<br />
Commercial and financial 5,965 709<br />
66 115 31<br />
Agricultural (<strong>inc</strong>luding loans secured by farmland) 1,108 -<br />
10 - -<br />
Real estate - construction and development 21,212 8,022<br />
324 24 -<br />
Real estate – commercial 4,906 25<br />
257 314 7<br />
Real estate – residential 3,063 3,188<br />
65 208 43<br />
Installment loans to individuals and other loans 5,494 183<br />
146 160 200<br />
41,748 12,127<br />
868 821 281<br />
Recoveries:<br />
Commercial and financial 138 38<br />
55 118 111<br />
Agricultural (<strong>inc</strong>luding loans secured by farmland) 38 38<br />
56 41 247<br />
Real estate - construction and development 8 2<br />
- - -<br />
Real estate – commercial 19 340<br />
28 335 394<br />
Real estate – residential 38 33<br />
108 87 148<br />
Installment loans to individuals and other loans 259 94<br />
121 167 205<br />
500 545 368 748 1,105<br />
Net charge-offs (recoveries) 41,248 11,582 500 73 (824)<br />
Additions provided to the allowance<br />
charged to operations 51,188 18,050 2,400 - 1,189<br />
Balance at end of year $ 29,314 $ 19,374 $ 12,906 $ 11,006 $ 11,079<br />
2005<br />
Average balance of loans outstanding $ 915,674 $ 955,253 $ 883,334 $ 792,278 $ 706,052<br />
Ratio of net charge-offs (recoveries) during the year to<br />
average loans outstanding during the year (%) 4.50 1.21 0.06 0.01 (0.12)<br />
Deposits<br />
Our total deposit portfolio decreased $78.5 million, or 7.0%, in 2009. Brokered deposits decreased $73.6 million during<br />
2009, from $206.6 million at December 31, 2008 to $133.0 million at December 31, 2009. Noninterest-bearing demand<br />
deposits <strong>inc</strong>reased $9.3 million, while non-brokered time deposits decreased $12.3 million and interest-bearing demand<br />
and savings decreased $1.9 million. The average rate paid on time deposits decreased 75 basis points from 4.26% in 2008<br />
to 3.51% in 2009. As with most community banks in the Southeast, loan volume has been the driver for the remainder of<br />
our balance sheet. When we have had strong loan demand, we have been more competitive for retail time deposits within<br />
our markets and when loan demand is less, we have been less competitive in pricing for retail time deposits in our markets.<br />
The amounts on deposit at the indicated dates are presented in the following table according to type of deposit account:<br />
As of December 31, 2009 2008 2007 2006 2005<br />
(Dollars in Thousands)<br />
Noninterest-bearing demand $ 100,458 $ 91,114 $ 89,423 $ 100,911 $ 107,917<br />
Interest-bearing demand and savings 250,232 252,122 354,743 328,828 284,126<br />
Retail time deposits < $100,000 314,148 328,329 312,722 279,936 250,250<br />
Retail time deposits > $100,000 217,833 198,845 187,662 161,054 131,279<br />
Retail time deposits placed in CDARS program 29,532 46,690 - - -<br />
Brokered time deposits 133,012 206,603 35,599 37,754 42,109<br />
Total deposits $ 1,045,215 $ 1,123,703 $ 980,149 $ 908,483 $ 815,681<br />
43
The percentage of total deposits at the indicated dates is presented in the following table according to type of deposit<br />
account.<br />
As of December 31, 2009 2008 2007 2006 2005<br />
Noninterest-bearing demand 9.61% 8.11% 9.12% 11.11% 13.23%<br />
Interest-bearing demand and savings 23.94% 22.44% 36.19% 36.19% 34.83%<br />
Retail time deposits < $100,000 30.06% 29.22% 31.91% 30.81% 30.68%<br />
Retail time deposits > $100,000 20.84% 17.69% 19.15% 17.73% 16.10%<br />
Retail time deposits placed in CDARs<br />
program 2.82% 4.15% 0.00% 0.00% 0.00%<br />
Brokered time deposits 12.73% 18.39% 3.63% 4.16% 5.16%<br />
Total deposits 100.00% 100.00% 100.00% 100.00% 100.00%<br />
The following table summarizes average balances of deposits and related weighted average rates of interest paid for each<br />
of the three years presented.<br />
For the Year Ended December 31, 2009 2008 2007<br />
Average<br />
Balance<br />
Rate<br />
Average<br />
Balance<br />
Rate<br />
(Dollars in Thousands)<br />
Average<br />
Balance<br />
Noninterest-bearing demand $ 109,317 - $ 97,839 - $ 98,475 -<br />
Interest-bearing demand 210,874 0.56% 271,498 1.93% 309,037 3.58%<br />
Savings 35,846 0.25% 35,381 0.58% 37,231 1.51%<br />
Retail time deposits < $100,000 321,626 3.67% 307,170 4.47% 300,618 5.06%<br />
Retail time deposits > $100,000 201,462 3.05% 183,151 4.05% 168,842 4.94%<br />
Retail time deposits placed in CDARS program 45,138 2.19% 8,973 3.17% - -<br />
Brokered time deposits 145,089 4.19% 107,584 4.12% 34,410 5.03%<br />
Total deposits $ 1,069,352 2.46% $ 1,011,596 3.10% $ 948,613 3.89%<br />
Rate<br />
The maturities of time deposits as of December 31, 2009 are summarized below.<br />
Retail time<br />
deposits<br />
< $100,000<br />
Retail time<br />
deposits<br />
> $100,000<br />
Retail time<br />
deposits<br />
placed in<br />
CDARS<br />
program<br />
Brokered time<br />
deposits<br />
(Dollars in Thousands)<br />
Total<br />
deposits<br />
Three months or less $ 61,233 $ 34,475 $ 18,260 $ 19,311 $ 133,279<br />
Over three through six months 88,013 50,393 5,089 16,580 160,075<br />
Over six months through twelve months 82,646 59,067 6,183 17,362 165,258<br />
Over twelve months 102,422 53,797 - 79,694 235,913<br />
Total deposits $ 334,314 $ 197,732 $ 29,532 $ 132,947 $ 694,525<br />
44
The following table summarizes our deposit portfolio by type and market as of December 31, 2009.<br />
South Georgia North Georgia Florida<br />
Market Market Market Treasury Total deposits<br />
(Dollars in Thousands)<br />
Noninterest-bearing demand $ 77,661 $ 15,635 $ 2,576 $ 4,586 $ 100,458<br />
Interest-bearing demand and savings 191,209 28,727 29,495 801 250,232<br />
Retail time deposits < $100,000 165,026 44,844 95,351 8,927 314,148<br />
Retail time deposits > $100,000 103,672 28,743 46,799 38,619 217,833<br />
Retail time deposits placed in CDARS program 27,311 2,430 - (209) 29,532<br />
Brokered time deposits > $100,000 - - - 133,012 133,012<br />
Total deposits $ 564,879 $ 120,379 $ 174,221 $ 185,736 $ 1,045,215<br />
LIQUIDITY AND CAPITAL RESOURCES<br />
Liquidity is an important factor in our financial condition and affects our ability to meet the borrowing needs and deposit<br />
withdrawal requirements of our customers. Assets, consisting primarily of loans and investment securities, are funded by<br />
customer deposits, borrowed funds, and retained earnings. Maturities in the investment and loan portfolios also provide a<br />
steady flow of funds for reinvestment. In addition, our liquidity continues to be enhanced by a relatively stable core<br />
deposit base.<br />
If necessary, the Bank has the ability to sell a portion of its unpledged investment securities to manage its<br />
liquidity. Unpledged securities totaled $20.2 million at December 31, 2009. However, s<strong>inc</strong>e the Bank is not considered<br />
“well capitalized” as of December 31, 2009, it is unable to accept, rollover, or renew any brokered deposits without prior<br />
regulatory approval. Approximately $53.3 million of the Bank’s existing brokered deposits are scheduled to mature in<br />
2010. Based on current and expected liquidity needs and sources, the Company expects to be able to meet its obligations<br />
through December 31, 2010.<br />
At December 31, 2009, our ratio of liquid assets (defined as the sum of cash and due from bank balances, interest-bearing<br />
deposits in other banks, federal funds sold, and investment securities) to total assets was 24.2%, compared to 23.9% at<br />
December 31, 2008. It is our policy to maintain a ratio of liquid assets to total assets of at least 15%. During 2009, we<br />
utilized the $20.0 million proceeds from the issuance of a three year unsecured debt at an interest rate of 2.74% under the<br />
FDIC’s Temporary Liquidity Guarantee Program, the $151.4 million decrease in loans, the $65.1 million decrease in<br />
investment securities and the $12.8 million in net proceeds from capital raised to offset the $78.5 million decrease in<br />
deposits, the $19.6 million decrease in advances from the FHLB, the $66.8 million <strong>inc</strong>rease in foreclosed assets and the<br />
$51.5 million <strong>inc</strong>rease in interest bearing deposits in other banks.<br />
At December 31, 2009, our liquidity position, which is an internally-calculated ratio of short-term funds available to shortterm<br />
and potentially volatile liabilities, was 39.62%. Our net noncore funding dependency ratio, which is the difference<br />
between regulatory defined non-core liabilities and short-term investments, divided by long-term assets, was 34.33%. Our<br />
liquidity and funding policy provides that we maintain a liquidity position of greater than or equal to 15% and a net<br />
noncore funding dependency ratio of less than or equal to 35%.<br />
In October 2008, the TLGP was established by the FDIC. Under the TLGP, the FDIC will fully guarantee, until June 30,<br />
2010, all noninterest-bearing transaction accounts with interest rates of 0.5% or less. The TLGP also guarantees all senior<br />
unsecured debt of insured depository institutions or their qualified holding companies issued between October 14, 2008<br />
and June 30, 2009 with a stated maturity greater than 30 days. After the initial 30 day grace period, institutions were<br />
required to opt-out of the program if they did not want to participate. We decided not to opt-out of the program and are<br />
participating in both the transaction account guarantee program and the debt guarantee portions of the TLGP.<br />
Investment Portfolio<br />
The Bank’s investment portfolio is another primary source of liquidity. Maturities of securities provide a constant flow of<br />
funds that are available for cash needs. In addition, mortgage-backed securities and securities with call provisions create<br />
cash flows earlier than the contractual maturities. Estimates of prepayments on mortgage-backed securities and call<br />
provisions on Federal agency and state and municipals <strong>inc</strong>rease the forecasted cash flows from the investment portfolio.<br />
The following table summarizes the differences between the contractual maturities and the expected available cash flows<br />
from our non-equity investments.<br />
45
As of December 31, 2009<br />
Contractual<br />
Maturities<br />
Expected<br />
Cash Flows Difference<br />
(Dollars in Thousands)<br />
Due in one year or less $ - $24,467 $24,467<br />
Due after one year through five years 857 47,282 46,425<br />
Due after five years through ten years 16,626 23,200 6,574<br />
Due after ten years 94,058 16,592 (77,466)<br />
Total $ 111,541 $ 111,541 $ -<br />
Our liquidity from investments is somewhat limited s<strong>inc</strong>e we pledge certain investments to secure public deposits and<br />
certain borrowing arrangements. At December 31, 2009, approximately 81.9% of our $111.5 million investment portfolio<br />
was pledged as collateral to others.<br />
Borrowings<br />
During 2008, we faced aggressive advertising for deposits from competitors offering higher interest rates in our North<br />
Georgia and Florida markets. During the second half of 2008, we decided not to compete in those markets for these<br />
higher-priced deposits, and we reduced our excess liquidity to limit the impact on our earnings in the declining-rate<br />
environment. We elected to use brokered deposits and advances from the FHLB, which then were at lower rates than<br />
those market retail deposits, to fund our balance sheet in the first half of 2008. Then, during the third quarter of 2008, as<br />
concerns over global market instability and economic weakness <strong>inc</strong>reased, we further used brokered deposits to build up<br />
our liquidity and strengthen our balance sheet. During this time, brokered deposits <strong>inc</strong>reased by $171 million, and<br />
advances from the FHLB <strong>inc</strong>reased $23.4 million during 2008. (The total <strong>inc</strong>rease in brokered deposits excludes retail<br />
deposits placed in the Certificate of Deposit Account Registry Service, or CDARS, reciprocal deposits program. CDARS<br />
deposits must be classified as brokered deposits under applicable regulations.). However, during 2009 we began to reduce<br />
our reliance on these funding sources as we began to see stabilized rates in our local retail markets. During 2009, we<br />
reduced our brokered deposits by $73.6 million and reduced our advances from the FHLB by $19.6 million. We also<br />
issued $20.0 million of three year unsecured debt at an interest rate of 2.74% under the FDIC’s Temporary Liquidity<br />
Guarantee Program during 2009. At December 31, 2009, we had $14.9 million in available secured credit line with the<br />
FHLB.<br />
As of December 31, 2009, the Bank did not meet the regulatory capital ratios required to meet “well-capitalized”<br />
standards. Accordingly, we are unable to renew any brokered certificates of deposit or attract new brokered certificates of<br />
deposit without prior regulatory approval. Further, the Written Agreement required us to submit to our banking regulators<br />
a timetable to reduce our reliance on borrowing and short-term wholesale funding, <strong>inc</strong>luding brokered deposits, and we are<br />
currently meeting the timetable we submitted. In the future, we plan to rely primarily on retail deposits in our North<br />
Georgia, South Georgia and Florida markets to fund our banking operations. Regulatory restrictions on the rates offered<br />
for deposit accounts in our markets took effect in January 2010 and we believe those restrictions will help reduce<br />
aggressive pricing of many of our competitors in North Georgia and Florida and eventually result in lowering our cost of<br />
funds in these markets.<br />
On October 5, 2006, PAB Bankshares Capital Trust II (“PAB Trust II”) issued $10 million of Floating Rate Capital<br />
Securities, also referred to as “trust preferred securities”. We formed PAB Trust II, a statutory business trust created under<br />
the laws of the State of Delaware, for the sole purpose of issuing the trust preferred securities and investing the proceeds in<br />
Floating Rate Junior Subordinated Debentures (the “Trust II Debentures”) issued by us. The interest rates on both the trust<br />
preferred securities and the Trust II Debentures are reset quarterly at the three-month London Interbank Offered Rate<br />
(“LIBOR”) plus 1.63% (1.88% at December 31, 2009). We entered into agreements which, taken collectively, fully,<br />
irrevocably and unconditionally guarantee, on a subordinated basis, all of PAB Trust II’s obligations under the trust<br />
preferred securities. PAB Trust II’s sole asset is the Trust II Debentures issued by us. The Trust II Debentures will mature<br />
on December 31, 2036, but are callable at par at our option in whole or in part anytime on or after December 31, 2011.<br />
The proceeds from the issuance of these trust preferred securities qualify as Tier 1 capital under the risk-based capital<br />
guidelines established by the Federal Reserve.<br />
46
On September 4, 2009, the Company began exercising its right to defer quarterly interest payments for its Debentures. We<br />
have provided notice of our deferral of the two interest payments from September 30, 2009 to December 31, 2009. We<br />
expect to defer the interest payments into the foreseeable future. During this period of deferral, the Company is precluded<br />
from repurchasing shares of common stock and from paying dividends on outstanding common stock. We will continue to<br />
accrue for the interest payable after the deferral period in our consolidated statement of <strong>inc</strong>ome (loss).<br />
Contractual Obligations<br />
Summarized below are our contractual obligations as of December 31, 2009.<br />
1 year Over 1 Over 3 More than<br />
Contractual Obligations Total or less to 3 years to 5 years 5 years<br />
(Dollars in Thousands)<br />
FHLB Advances $ 90,140 $ 5,658 $40,745 $24,371 $19,366<br />
Operating Lease Obligations 1,097 345 521 231 -<br />
Other Borrowings 20,000 - 20,000 - -<br />
Guaranteed Preferred Beneficial Interests in Debentures 10,310 - - - 10,310<br />
$ 121,547 $ 6,003 $61,266 $24,602 $29,676<br />
Off-Balance Sheet Financing<br />
Our financial statements do not reflect various commitments and contingent liabilities that arise in the normal course of<br />
business. These off-balance sheet financial instruments <strong>inc</strong>lude commitments to extend credit and standby letters of credit.<br />
These financial instruments are <strong>inc</strong>luded in the financial statements when funds are distributed or the instruments become<br />
payable. We use the same credit policies in making these commitments as we do for on-balance sheet instruments. Our<br />
exposure to credit loss in the event of nonperformance by the other party to the financial instrument for commitments to<br />
extend credit, standby letters of credit and credit card commitments is represented by the contractual amount of those<br />
instruments. At December 31, 2009, we had outstanding commitments to extend credit through open lines of credit of<br />
approximately $89.1 million and outstanding standby letters of credit of approximately $3.7 million.<br />
In June 2006, we entered into a $50 million notional amount, 3-year, 8.25% Prime rate floor contract to hedge against<br />
interest rate risk in a declining rate environment. In January 2008, we entered into a $25 million notional amount, 3-year<br />
5.75%/6.50% Prime rate collar contract and a $25 million notional amount, 5-year 6.00%/7.25% Prime rate collar contract<br />
and in April 2008, we entered into a $25 million notional amount, 3-year 2.975% 1-month LIBOR cap contract to further<br />
hedge against interest rate risk. In April 2009, we terminated the two Prime rate collar contracts. The Prime rate floor<br />
contract expired July 1, 2009. At December 31, 2009, the only derivative contract outstanding is the LIBOR cap contract.<br />
Notional amounts provide the basis for calculating payments between counterparties and do not represent amounts to be<br />
exchanged between parties, and are not a measure of financial risk. The risk of loss with our counterparty is limited to a<br />
small fraction of the notional amount. We only deal with counterparties that have investment grade credit ratings, are well<br />
capitalized and are approved by our Board of Directors. Due to these factors, we feel our credit risk exposure under these<br />
hedging arrangements at December 31, 2009 was not material.<br />
Commitments of Capital<br />
At December 31, 2009, there were no binding commitments for material capital expenditures outstanding.<br />
Stockholders’ Equity<br />
We are required to comply with capital adequacy standards established by our regulatory agencies. At December 31,<br />
2009, the Bank had the requisite capital level to qualify as “adequately capitalized” under the regulatory framework for<br />
prompt corrective action. See the section titled “Capital Adequacy” under the caption “Supervision and Regulation” in<br />
Item 1 of this Report for more information on the regulatory capital adequacy standards.<br />
The following table summarizes our consolidated regulatory capital ratios at December 31, 2009, 2008 and 2007.<br />
Minimum<br />
Regulatory<br />
2009 2008 2007 Requirement<br />
Total Capital to Risk Weighted Assets 8.1% 10.3% 11.3% 8.0%<br />
Tier 1 Capital to Risk Weighted Assets 6.8% 9.0% 10.0% 4.0%<br />
Tier 1 Capital to Average Assets (Leverage Ratio) 4.7% 7.0% 8.5% 4.0%<br />
47
Stockholders’ equity represented 4.1% of total assets at December 31, 2009, a decrease compared to 6.8% at December 31,<br />
2008. Total stockholders’ equity has decreased $41.0 million, or 44.8%, s<strong>inc</strong>e December 31, 2008. This decrease is<br />
primarily the net result of our net loss of $51.2 million, a $3.0 million decrease in accumulated other comprehensive gains,<br />
offset by the $12.8 million of new stock issued. We did not declare a dividend for the year 2009 or in the third or fourth<br />
quarters of 2008. However, we paid a $0.142 per common share cash dividend for the first quarter of 2008 and a $0.093<br />
per common share cash dividend for the second quarter of 2008. We also declared a 2% stock dividend in the second<br />
quarter of 2008. In setting our dividend on a quarterly basis, we evaluate our capital adequacy and the quality of our<br />
earnings, and we estimate our capital requirements and our earnings outlook for the next year. Based on these evaluations,<br />
we suspended our quarterly dividend in the third quarter of 2008 and we do not intend to pay a common stock dividend in<br />
2010 due to continued pressure on earnings and capital. Under the terms of the written agreement with the Federal<br />
Reserve Board, the company is restricted from paying dividends or repurchasing shares of its common stock without prior<br />
written approval of the Federal Reserve Board.<br />
RESULTS OF OPERATIONS<br />
We reported a net loss of $51.2 million, or $4.78 loss per diluted share, for the year ended December 31, 2009, compared<br />
to a net loss of $5.9 million, or $0.63 loss per diluted share, for 2008. The $45.3 million decrease in net loss is the net<br />
result of a $6.5 million decrease in net interest <strong>inc</strong>ome, a $33.1 million <strong>inc</strong>rease in the provision for loan losses, and a<br />
$10.0 million <strong>inc</strong>rease in other expenses, offset by a $4.2 million decrease in <strong>inc</strong>ome tax expense. During 2009, we<br />
reported a $6.0 million decrease in net interest <strong>inc</strong>ome caused by nonperforming loans, a $5.1 million net loss realized on<br />
other real estate owned, and a $3.8 million <strong>inc</strong>rease in deposit insurance expense. At December 31, 2009, the Company<br />
recorded an $11.1 million valuation allowance on its deferred tax assets that will be reversed when the Company returns to<br />
a level of sustained profitability. Our return on average assets (“ROA”) and return on average equity (“ROE”) for the year<br />
ended December 31, 2009 were -3.92% and -57.41%, respectively, compared to a -0.48% ROA and a -6.10% ROE for<br />
2008.<br />
The reasons for these changes are discussed in more detail below.<br />
Net Interest Income<br />
The primary component of a financial institution’s profitability is net interest <strong>inc</strong>ome, or the difference between the<br />
interest <strong>inc</strong>ome earned on assets, primarily loans and investments, and interest paid on liabilities, primarily deposits and<br />
other borrowed funds. Our net interest <strong>inc</strong>ome for 2009, on a tax equivalent basis, decreased by $6.78 million, or 19.1%,<br />
over 2008. Interest <strong>inc</strong>ome (on a tax equivalent basis) decreased $11.43 million, or 16.0%, and interest expense decreased<br />
by $4.65 million, or 12.8%, during 2009. The decrease in interest <strong>inc</strong>ome is the result of a 116 basis point decline in the<br />
average yield on our earning assets during the year, from 6.15% in 2008 to 4.99% in 2009, offset by a $39.7 million<br />
<strong>inc</strong>rease in the average balance of those earning assets. The decrease in interest expense is the result of a 62 basis point<br />
decline in the average rate paid on our interest-bearing liabilities, from 3.49% in 2008 to 2.87% in 2009, offset by a $62.0<br />
million <strong>inc</strong>rease in the average balance of those interest-bearing liabilities.<br />
Our net interest <strong>inc</strong>ome for 2008, on a tax equivalent basis, decreased by $7.69 million, or 17.8%, over 2007. Interest<br />
<strong>inc</strong>ome (on a tax equivalent basis) decreased $13.68 million, or 16.0%, and interest expense decreased by $5.99 million, or<br />
14.2%, during 2008. The decrease in interest <strong>inc</strong>ome is the result of a 163 basis point decline in the average yield on our<br />
earning assets during the year, from 7.78% in 2007 to 6.15% in 2008, offset by a $68.7 million <strong>inc</strong>rease in the average<br />
balance of those earning assets. The decrease in interest expense is the result of a 90 basis point decline in the average rate<br />
paid on our interest-bearing liabilities, from 4.39% in 2007 to 3.49% in 2008, offset by a $76.8 million <strong>inc</strong>rease in the<br />
average balance of those interest-bearing liabilities.<br />
The net interest margin is net interest <strong>inc</strong>ome expressed as a percentage of average earning assets. Our net interest margin<br />
decreased from 3.04% in 2008 to 2.38% in 2009, a 66 basis point decline. The reduction in short-term interest rates during<br />
the fourth quarter of 2007 and first quarter of 2008 caused our earning assets to re-price downwards faster than our<br />
interest-bearing liabilities re-priced downwards. The reduction of interest <strong>inc</strong>ome due to our nonperforming assets also<br />
negatively impacted the net interest margin by 49 basis points during 2009, which was significantly higher than the 31<br />
basis point impact in 2008. We do not expect our net interest margin to materially decrease in 2010, as compared to 2009<br />
levels, considering the <strong>inc</strong>rease in our nonperforming assets, the interest rate environment and the narrowing spreads on<br />
our earning assets that we endured in 2009.<br />
48
Provision for Loan Losses<br />
The provision for loan losses is the charge to operating earnings necessary to maintain an adequate allowance for loan<br />
losses. Through the provision, we maintain an allowance for loan losses that we believe is adequate to absorb losses<br />
inherent in our loan portfolio. However, future additions to the allowance may be necessary based on growth in the loan<br />
portfolio, changes in economic conditions and other internal and external environmental factors. In addition, various<br />
regulatory agencies, as an integral part of their examination procedures, periodically review our allowance for loan losses.<br />
Based on their judgments about information available to them at the time of their examination, such agencies may require<br />
us to recognize additions to the allowance for loan losses.<br />
For the year ended December 31, 2009, we recorded $51.19 million as a provision for loan losses, compared to the $18.05<br />
million provision for loan losses we recorded in 2008. The <strong>inc</strong>rease is due to the significant <strong>inc</strong>rease in the level of<br />
nonperforming loans at December 31, 2009. We recorded $41.7 million in loan charge-offs against the allowance for loan<br />
losses in 2009, a significant <strong>inc</strong>rease compared to $12.1 million in charge-offs in 2008. However, we recovered $501,000<br />
in previously charged-off loans during 2009, bringing our net charge-offs to $41.2 million, or 4.50% of average loans, for<br />
the year.<br />
Noninterest Income<br />
The following table summarizes noninterest <strong>inc</strong>ome during the last three years.<br />
For the Year Ended December 31, 2009 2008 2007<br />
Percentage<br />
Percentage<br />
Change<br />
Change<br />
Amount 2009 vs. 2008 Amount 2008 vs. 2007 Amount<br />
(Dollars In Thousands)<br />
Service charges on deposit accounts $ 3,528 -4.2% $ 3,683 1.8% $ 3,617<br />
Mortgage origination fees 781 10.2% 709 75.1% 405<br />
Brokerage commissions and fees 11 -35.3% 17 30.8% 13<br />
ATM / debit card fee <strong>inc</strong>ome 844 14.5% 737 14.6% 643<br />
Other commissions and fees 314 51.7% 207 -6.3% 221<br />
Securities transactions, net 2,056 813.8% 225 -28.1% 313<br />
Earnings of bank-owned life insurance 572 35.9% 421 3.7% 406<br />
Gain (loss) on disposal / write-down of assets (5,015) 170.6% (1,853) -2387.7% 81<br />
Gain (loss) on derivative instrument 1,002 6362.5% (16) -100.0% -<br />
Other noninterest <strong>inc</strong>ome 442 61.9% 273 -6.5% 292<br />
Total Noninterest Income $ 4,535 3.0% $ 4,403 -26.5% $ 5,991<br />
Fee <strong>inc</strong>ome from ATM and debit cards <strong>inc</strong>reased as the volume of point-of-sale transactions continued to <strong>inc</strong>rease from<br />
previous years. However, we are offering a no-fee ATM deposit product in select markets for competitive reasons, which<br />
may reduce our ATM fee <strong>inc</strong>ome opportunities going forward.<br />
We <strong>inc</strong>urred net gains of $2.1 million, $225,000 and $313,000 on securities transactions for the last three years ended<br />
December 31, 2009, 2008, and 2007 respectively. During 2009, we sold higher risk-weighted investment securities and<br />
recorded a $1.8 million realized gain on the sale of these securities. This was offset by a $261,000 write-down of our<br />
investment in Silverton Bank stock. Silverton Bank was placed into receivership on May 1, 2009.<br />
Earnings on bank-owned life insurance <strong>inc</strong>reased primarily as a result of a higher rate of return on these policies compared<br />
to previous years.<br />
During 2009, we recorded a net loss on the sale and write-down of foreclosed assets of $5.1 million, compared to a net loss<br />
of $1.3 million in 2008 and a net gain of $94,000 in 2007. We recorded a write-down in 2008 of leasehold improvements,<br />
equipment and land of $609,000 related to the closing of our Jacksonville, Florida and Snellville, Georgia branches.<br />
During 2009, we recorded a $1.0 million gain on our hedging activities, while we did not have any recorded gain on<br />
hedging activities in the previous years.<br />
Other noninterest <strong>inc</strong>ome <strong>inc</strong>ludes <strong>inc</strong>reased premiums on SBA loans and rental <strong>inc</strong>ome on our foreclosed assets during<br />
2009 compared to previous years. However, in December 2009, we closed our SBA loan department and the premiums<br />
49
earned and corresponding expenses in 2009 are not expected in 2010.<br />
Noninterest Expense<br />
The following table summarizes noninterest expense during the last three years.<br />
For the Year Ended December 31, 2009 2008 2007<br />
Percentage<br />
Percentage<br />
Change<br />
Change<br />
Amount 2009 vs. 2008 Amount 2008 vs. 2007 Amount<br />
(Dollars In Thousands)<br />
Salaries and wages $ 13,461 -15.6% $ 15,940 -3.0% $ 16,431<br />
Deferred loan cost (1,423) -13.0% (1,635) -17.0% (1,969)<br />
Employee benefits 3,976 4.5% 3,806 -7.6% 4,119<br />
Net occupancy expense of premises 2,305 -29.9% 3,290 38.6% 2,374<br />
Furniture and equipment expense 2,025 0.1% 2,023 -11.2% 2,279<br />
Advertising and business development 396 -32.0% 582 -7.0% 626<br />
Supplies and printing 360 -7.7% 390 -15.8% 463<br />
Telephone and internet charges 651 -16.2% 777 22.4% 635<br />
Postage and courier 545 -4.9% 573 -11.2% 645<br />
Legal and accounting fees 1,000 116.0% 463 -17.2% 559<br />
Consulting fees 212 271.9% 57 -72.7% 209<br />
Director fees and expenses 547 -12.5% 625 57.0% 398<br />
Service charges and fees 436 -26.7% 595 -4.3% 622<br />
Deposit insurance expense 4,138 1165.4% 327 202.8% 108<br />
Foreclosure and reposession expenses 3,291 244.2% 956 380.4% 199<br />
Goodwill impairment 5,985 100.0% - 0.0% -<br />
Other noninterest expense 2,668 47.0% 1,815 -4.1% 1,892<br />
Total Noninterest Expense $ 40,573 32.7% $ 30,584 3.4% $ 29,590<br />
Noninterest expense <strong>inc</strong>reased 32.7% in 2009, from $30.6 million in 2008 to $40.6 million in 2009. As a percentage of<br />
average assets, noninterest expense was 3.10%, 2.47% and 2.54% in 2009, 2008 and 2007, respectively. Our overhead<br />
efficiency ratio, a measure of noninterest expense as a percentage of net interest <strong>inc</strong>ome plus other noninterest <strong>inc</strong>ome,<br />
<strong>inc</strong>reased from 70.01% in 2008 to 95.74% in 2009.<br />
Salaries and wages expense decreased 15.6% during 2009 due to the 9.7% reduction of our staff from 299 full time<br />
equivalent employees at December 31, 2008 to 270 at December 31, 2009. The decreases in salary due to these reductions<br />
were offset by a one-time severance accrual of $730,000 in the first quarter of 2009 related to the retirement of our<br />
President and Chief Executive Officer and severance expenses of $185,000 for workforce reductions in the second quarter<br />
of 2009. Deferred loan costs, which are credits against salaries and wages, decreased due to a decrease in loan volume.<br />
The <strong>inc</strong>rease in occupancy expense in 2008 was due to a $751,000 one-time lease charge we <strong>inc</strong>urred in the fourth quarter<br />
of 2008 related to the branch closures in Jacksonville, Florida and Snellville, Georgia. Furniture and equipment expense<br />
decreased and stabilized from 2007 due to a reduction in depreciation expense on several large pieces of operations<br />
equipment that became fully depreciated during the third quarter of 2007.<br />
Advertising and business development expenses, office supplies and printing charges and telephone and internet fees<br />
decreased during 2009 due to cost-saving awareness and efforts among our locations to reduce noninterest expenses. The<br />
decrease in postage and courier fees is due to a reduction in our courier’s schedule as part of our cost-saving awareness<br />
efforts.<br />
Our deposit insurance premiums <strong>inc</strong>reased from $327,000 during 2008 to $4.14 million in 2009 due to rate <strong>inc</strong>reases, a<br />
$600,000 special assessment from the FDIC during the second quarter, and an additional $1.8 million of FDIC insurance<br />
expense during the fourth quarter related to a change in the timing and expensing of FDIC insurance premiums.<br />
Foreclosure and repossession expenses <strong>inc</strong>reased significantly from $956,000 during 2008 to $3.3 million in 2009 due to<br />
the <strong>inc</strong>reased level of foreclosed assets owned by the Company. These <strong>inc</strong>reased expenses <strong>inc</strong>lude property taxes, repairs<br />
and maintenance, insurance and legal and collection expenses.<br />
50
Income Taxes<br />
The provision for <strong>inc</strong>ome tax expense (benefit) as a percentage of pre-tax <strong>inc</strong>ome (loss) was (13.1%), (37.6%) and 34.5%<br />
for 2009, 2008 and 2007, respectively. There is a difference between the effective rate and the statutory federal rate of<br />
35% due to <strong>inc</strong>ome earned on tax-exempt municipalities, goodwill, deferred tax valuation allowance, earnings on the cash<br />
value of our bank-owned life insurance and state <strong>inc</strong>ome taxes. During 2009, we recorded an $11.1 million valuation<br />
allowance on our deferred tax assets that will be reversed when our financial results return to a level of sustained<br />
profitability.<br />
Fourth Quarter Results<br />
For the fourth quarter of 2009, we recorded a net loss of $31.3 million, or $2.27 per diluted share, compared to net loss of<br />
$5.8 million, or $0.60 per diluted share, posted in the fourth quarter of 2008. In the fourth quarter of 2009, we provided<br />
$16.0 million to the allowance for loan losses, compared to the $8.5 million provision expense we recorded in the fourth<br />
quarter of 2008. During the fourth quarter of 2009, we also recorded a $6.0 million nonrecurring charge to earnings for the<br />
impairment of goodwill due primarily to the decline in the market value of the Company’s common stock. We also<br />
recorded an $11.1 million valuation allowance on our deferred tax assets that will be reversed when we return to a level of<br />
sustained profitability. In addition to the above charges, we recorded an additional $1.8 million of FDIC insurance<br />
expense during the fourth quarter related to a change in the timing and expensing of FDIC insurance premiums. Our net<br />
interest margin for the fourth quarter of 2009 was 2.05% compared to 2.40% in the fourth quarter of 2008. The average<br />
yield on earning assets decreased 101 basis points to 4.44% in the fourth quarter of 2009 from 5.45% in the fourth quarter<br />
of 2008. The average rate paid on interest-bearing liabilities decreased 81 basis points, from 3.38% in the fourth quarter of<br />
2008 to 2.57% in the fourth quarter of 2009.<br />
Impact of Inflation<br />
Inflation impacts the growth in total assets in the banking industry and causes a need to <strong>inc</strong>rease equity capital at higher than<br />
normal rates to meet capital adequacy requirements. We cope with the effects of inflation through managing our interest rate<br />
sensitivity gap position, by periodically reviewing and adjusting our pricing of services to consider current costs, and through<br />
managing our dividend payout policy relative to our level of <strong>inc</strong>ome. There has been minimal inflation experienced in the last<br />
three years.<br />
Critical Accounting Policies<br />
The preparation of financial statements and the related disclosures in conformity with accounting pr<strong>inc</strong>iples generally<br />
accepted in the United States requires that management make estimates and assumptions which affect the reported<br />
amounts of assets and liabilities and disclosure of contingent assets and liabilities at the date of the financial statements<br />
and the reported amounts of revenues and expenses during the reporting period. Actual results could differ from those<br />
estimates. We believe that our determination of the allowance for loan losses and the fair value of assets, <strong>inc</strong>luding the<br />
impairment of goodwill, affect our most significant judgments and estimates used in the preparation of our consolidated<br />
financial statements. The Company’s accounting policies are described in detail in Note 1 of our Consolidated <strong>Financial</strong><br />
Statements provided in Item 8 of this Report. The following is a brief description of the Company’s critical accounting<br />
policies involving significant management valuation judgment. Management has discussed these critical accounting<br />
policies with the Audit Committee.<br />
51
Allowance for Loan Losses<br />
The allowance for loan losses represents management’s estimate of losses inherent in the existing loan portfolio. The<br />
allowance for loan losses is <strong>inc</strong>reased by the provision for loan losses charged to expense and reduced by loans charged<br />
off, net of recoveries. The allowance for loan losses is determined based on management’s assessment of several factors<br />
<strong>inc</strong>luding, but not limited to, reviews and evaluations of specific loans, changes in the nature and volume of the loan<br />
portfolio, current economic conditions and the related impact on segments of the loan portfolio, historical loan loss<br />
experiences and the level of classified and nonperforming loans.<br />
Loans are considered impaired if, based on current information and events, it is probable that the Bank will be unable to<br />
collect the scheduled payments of pr<strong>inc</strong>ipal or interest when due according to the contractual terms of the loan agreement.<br />
The measurement of impaired loans is based on either the fair value of the underlying collateral, the present value of the<br />
future cash flows discounted at the historical effective interest rate stipulated in the loan agreement, or the estimated<br />
market value of the loan. In measuring the fair value of the collateral, management uses assumptions (e.g., discount rate)<br />
and methodologies (e.g., comparison to the recent selling price of similar assets) consistent with those that would be<br />
utilized by unrelated third parties.<br />
Management’s assessment is inherently subjective, as it requires estimates that are susceptible to significant revision as<br />
more information becomes available. Changes in various internal and external environmental factors <strong>inc</strong>luding, but not<br />
limited to, the financial condition of individual borrowers, economic conditions, historical loss experience, or the condition<br />
of the various markets in which collateral may be sold may affect the required level of the allowance for loan losses and<br />
the associated provision for loan losses. Should these environmental factors change, a different amount may be reported<br />
for the allowance for loan losses and the associated provision for loan losses.<br />
Estimates of Fair Value<br />
The estimation of fair value is significant to a number of the Company’s assets, <strong>inc</strong>luding, but not limited to, investment<br />
securities, goodwill, other real estate owned, and other repossessed assets. These are all recorded at either fair value or at<br />
the lower of cost or fair value. Fair values are volatile and may be influenced by a number of factors. Circumstances that<br />
could cause estimates of the fair value of certain assets and liabilities to change <strong>inc</strong>lude a change in prepayment speeds,<br />
discount rates, or market interest rates. Our estimates and assumptions are reviewed periodically and the effects of<br />
revisions are reflected in the consolidated financial statements in the period they are determined to be necessary.<br />
Fair values for most investment securities are based on quoted market prices. If quoted market prices are not available,<br />
fair values are based on the quoted prices of similar instruments. The fair values of other real estate owned are typically<br />
determined based on appraisals by third parties, less estimated costs to sell.<br />
Estimates of fair value are also required in performing an impairment analysis of goodwill. The Company reviews<br />
goodwill for impairment on at least an annual basis and whenever events or circumstances indicate the carrying value may<br />
not be recoverable. An impairment would be indicated if the carrying value exceeds the fair value of a reporting unit.<br />
Recent Accounting Pronouncements<br />
In management’s opinion, there are no recent accounting pronouncements that have had a material impact on PAB’s<br />
earnings or financial position as of or for the year ended December 31, 2009. For more detailed disclosure on recent<br />
accounting developments, see Note 1 to the Consolidated <strong>Financial</strong> Statements <strong>inc</strong>luded in Item 8 of this Report.<br />
ITEM 7A. QUANTITATIVE AND QUALITATIVE DISCLOSURES ABOUT MARKET RISK<br />
We are subject to exposure from U.S. dollar interest rate changes and accordingly, we manage our exposure by<br />
considering the possible changes in the net interest margin. We do not engage in trading activity nor do we classify any<br />
portion of the investment portfolio as held for trading. Finally, we have no material direct exposure to foreign currency<br />
exchange rate risk, commodity price risk, and other market risks.<br />
Interest rates play a major part in the net interest <strong>inc</strong>ome of a financial institution. The sensitivity to rate changes is known<br />
as “interest rate risk.” The repricing of interest earning assets and interest-bearing liabilities can influence the changes in<br />
net interest <strong>inc</strong>ome. As part of our asset/liability management program, the timing of repriced assets and liabilities is<br />
referred to as gap management. It is our policy to maintain a gap ratio in the one-year time horizon between 0.80 and 1.20.<br />
At December 31, 2009, our one-year management-adjusted gap ratio of 0.89 was within our policy guidelines. Although<br />
we are now showing a liability-sensitive balance sheet gap position (
We have reduced the level of asset-sensitivity on the Company’s balance sheet in recent years in an effort to better<br />
mitigate our interest rate risk in a declining interest rate environment. We have accomplished this by conscientiously<br />
lengthening the duration of our earning assets, shortening the duration of our deposits and other borrowings and utilizing<br />
off-balance sheet derivative instruments to further hedge against interest rate risk in a declining rate environment.<br />
The table below shows our contractual maturity gap at December 31, 2009. A positive maturity gap (a gap ratio > 1.00)<br />
occurs when more assets are maturing than liabilities for any given time period, and generally equates to a lower liquidity<br />
risk. A negative maturity gap (a gap ratio < 1.00) for any given time period results in a higher liquidity risk and could<br />
indicate potential liquidity problems exist.<br />
Cumulative Maturity Gap Analysis<br />
Regulatory Defined<br />
3-Month 6-Month 1-Year 3-Year Total<br />
(Dollars in Thousands)<br />
Rate Sensitive Assets (RSA) $ 205,978 $ 299,953 $ 426,398 $ 675,605 $ 1,231,945<br />
Rate Sensitive Liabilities (RSL) 149,409 311,078 479,174 727,041 $ 1,231,945<br />
RSA minus RSL (Gap) $ 56,569 $ (11,125) $ (52,776)<br />
$<br />
(51,436) $ -<br />
Maturity Gap Ratio (RSA/RSL)<br />
1.38 0.96 0.89 0.93 1.00<br />
The table below has two measures of our repricing gap: regulatory and management-adjusted. The regulatory gap<br />
considers only contractual maturities or repricings. The management-adjusted gap <strong>inc</strong>ludes assumptions regarding<br />
prepayment speeds on certain rate sensitive assets, the repricing frequency of interest-bearing demand and savings<br />
accounts, and the stability of core deposit levels, all of which are adjusted periodically as market conditions change. The<br />
management-adjusted gap indicates we are highly asset sensitive in relation to changes in market interest rates in the shortterm.<br />
Being asset sensitive (a gap ratio > 1.00) would result in net interest <strong>inc</strong>ome <strong>inc</strong>reasing in a rising rate environment<br />
and decreasing in a declining rate environment.<br />
Cumulative Repricing Gap Analysis<br />
Regulatory Defined<br />
3-Month 6-Month 1-Year 3-Year Total<br />
(Dollars in Thousands)<br />
Rate Sensitive Assets (RSA) $ 596,519 $ 640,157 $ 715,247 $ 901,759 $ 1,231,945<br />
Rate Sensitive Liabilities (RSL) 457,754 616,162 781,979 1,002,513 $ 1,231,945<br />
RSA minus RSL (Gap) $ 138,765 $ 23,995 $ (66,732)<br />
$<br />
(100,754) $ -<br />
Repricing Gap Ratio (RSA/RSL) 1.30 1.04 0.91 0.90 1.00<br />
Management-Adjusted<br />
Rate Sensitive Assets (RSA) $ 599,710 $ 645,529 $ 723,753 $ 914,480 $ 1,231,945<br />
Rate Sensitive Liabilities (RSL) 466,027 631,993 811,021 1,065,865 $ 1,231,945<br />
RSA minus RSL (Gap) $ 133,683 $ 13,536 $ (87,268)<br />
$<br />
(151,385) $ -<br />
Repricing Gap Ratio (RSA/RSL) 1.29 1.02 0.89 0.86 1.00<br />
We use simulation analysis to monitor changes in net interest <strong>inc</strong>ome due to the impact that changes in market interest<br />
rates have on our financial instruments. The simulation of rising, declining, and flat interest rate scenarios allows us to<br />
monitor and adjust interest rate sensitivity to minimize the impact of market interest rate swings. The analysis of the<br />
impact on net interest <strong>inc</strong>ome over a twelve-month period is subjected to <strong>inc</strong>reases or decreases in market rates on net<br />
interest <strong>inc</strong>ome and is monitored on a quarterly basis. Our policy states that net interest <strong>inc</strong>ome cannot be reduced by<br />
more than 20% using this analysis. As of December 31, 2009, the simulation model projected net interest <strong>inc</strong>ome would<br />
<strong>inc</strong>rease 9.7% over the next year if market rates immediately rose by 100 basis points and the model projected net interest<br />
<strong>inc</strong>ome would decrease 1.60% over the next year if market rates immediately fell by 25 basis points.<br />
53
The following table shows the results of these projections for net interest <strong>inc</strong>ome expressed as a percentage change over<br />
net interest <strong>inc</strong>ome in a flat rate scenario for both a gradual change in market interest rates over a twelve-month period and<br />
an immediate change, or “shock”, in market interest rates.<br />
Market<br />
Effect on Net Interest Income<br />
Rate Change Gradual Immediate<br />
+300 bps 14.94% 30.28%<br />
+200 bps 13.21% 19.85%<br />
+100 bps 8.12% 9.72%<br />
-25 bps -1.60% -1.60%<br />
ITEM 8. FINANCIAL STATEMENTS AND SUPPLEMENTARY DATA<br />
Quarterly <strong>Financial</strong> Summary for 2009 and 2008<br />
(The sum of the quarterly results presented may not agree with the results for the full year due to rounding.)<br />
Quarterly Period Ended<br />
March 31 June 30 September 30 December 31<br />
Year ended December 31, 2009:<br />
Interest <strong>inc</strong>ome $ 16,151 $ 16,090 $ 14,816 $ 12,824<br />
Interest expense 8,959 8,104 7,562 6,946<br />
Net interest <strong>inc</strong>ome 7,192 7,986<br />
7,254 5,878<br />
Provision for loan losses<br />
1,750 2,000 31,438 16,000<br />
Net interest <strong>inc</strong>ome<br />
after provision for<br />
loan losses<br />
5,442 5,986 (24,184) (10,122)<br />
Other <strong>inc</strong>ome 2,106 2,487 889<br />
(946)<br />
Other expenses<br />
8,126 8,102 7,284 17,061<br />
Income before<br />
<strong>inc</strong>ome taxes (578) 371<br />
(30,579) (28,129)<br />
Income tax (283) 29 (10,623)<br />
3,133<br />
Net <strong>inc</strong>ome $ (295) $ 342 $ (19,956) $ (31,262)<br />
Basic earnings per share $ (0.03) $ 0.04 $ (1.93) $ (2.27)<br />
Diluted earnings per share $ (0.03) $ 0.04 $ (1.93) $ (2.27)<br />
Year ended December 31, 2008:<br />
Interest <strong>inc</strong>ome $ 19,030 $ 17,460 $ 17,680 $ 16,814<br />
Interest expense 9,685 8,598<br />
8,460 9,476<br />
Net interest <strong>inc</strong>ome 9,345 8,862 9,220 7,338<br />
Provision for loan losses 1,200<br />
1,050 7,300 8,500<br />
Net interest <strong>inc</strong>ome<br />
after provision for<br />
loan losses 8,145 7,812<br />
1,920 (1,162)<br />
Other <strong>inc</strong>ome 1,643 1,572 1,081 107<br />
Other expenses<br />
7,829 7,191 7,510 8,053<br />
Income before<br />
<strong>inc</strong>ome taxes 1,959 2,193 (4,509) (9,108)<br />
Income tax 662<br />
730 (1,649) (3,297)<br />
Net <strong>inc</strong>ome $ 1,297 $ 1,463 $ (2,860) $ (5,811)<br />
Basic earnings per share $ 0.14 $ 0.16 $ (0.31) $ (0.62)<br />
Diluted earnings per share $ 0.14 $ 0.15 $ (0.32) $ (0.60)<br />
54
MANAGEMENT’S REPORT ON<br />
INTERNAL CONTROL OVER FINANCIAL REPORTING<br />
The management of PAB Bankshares, Inc. (the “Company”) is responsible for establishing and maintaining adequate<br />
internal control over financial reporting. This internal control system has been designed to provide reasonable assurance to<br />
the Company’s management and board of directors regarding the preparation and fair presentation of the Company’s<br />
published financial statements.<br />
All internal control systems, no matter how well designed, have inherent limitations, <strong>inc</strong>luding the possibility of human<br />
error and the circumvention or overriding of controls. Therefore, even those systems determined to be effective can<br />
provide only reasonable assurance with respect to financial statement preparation and presentation. Further, because of<br />
changes in conditions, the effectiveness of internal control over financial reporting may vary over time.<br />
The management of the Company has assessed the effectiveness of the Company’s internal control over financial reporting<br />
as of December 31, 2009. To make this assessment, we used the criteria for effective internal control over financial<br />
reporting described in “Internal Control – Integrated Framework”, issued by the Committee of Sponsoring Organizations<br />
of the Treadway Commission. Based on our assessment, we believe that, as of December 31, 2009, the Company’s<br />
internal control over financial reporting was effective.<br />
Our independent auditors have issued an attestation report on our assessment of the Company’s internal control over<br />
financial reporting. A copy of the auditor’s attestation report is <strong>inc</strong>luded in this Annual Report on Form 10-K.<br />
PAB BANKSHARES, INC.<br />
/s/ Donald J. Torbert, Jr<br />
Donald J. Torbert, Jr.<br />
President and<br />
Chief Executive Officer<br />
/s/ Nicole S. Stokes<br />
Nicole S. Stokes<br />
Executive Vice President and<br />
Chief <strong>Financial</strong> Officer<br />
March 8, 2010 March 8, 2010<br />
Date<br />
Date<br />
55
Certified Public Accountants, LLC<br />
REPORT OF INDEPENDENT REGISTERED PUBLIC ACCOUNTING FIRM<br />
To the Board of Directors and Stockholders<br />
PAB Bankshares, Inc.<br />
Valdosta, Georgia<br />
We have audited PAB Bankshares, Inc.’s internal control over financial reporting as of<br />
December 31, 2009, based on criteria established in Internal Control - Integrated Framework issued<br />
by the Committee of Sponsoring Organizations of the Treadway Commission (COSO). PAB<br />
Bankshares, Inc.'s management is responsible for maintaining effective internal control over financial<br />
reporting and for its assessment of the effectiveness of internal control over financial reporting<br />
<strong>inc</strong>luded in the accompanying “Management’s Report on Internal Control over <strong>Financial</strong> Reporting.”<br />
Our responsibility is to express an opinion on the Company’s internal control over financial reporting<br />
based on our audit.<br />
We conducted our audit in accordance with the standards of the Public Company Accounting<br />
Oversight Board (United States). Those standards require that we plan and perform the audit to<br />
obtain reasonable assurance about whether effective internal control over financial reporting was<br />
maintained in all material respects. Our audit <strong>inc</strong>luded obtaining an understanding of internal control<br />
over financial reporting, assessing the risk that a material weakness exists, and testing and<br />
evaluating the design and operating effectiveness of internal control based on the assessed risk. Our<br />
audit also <strong>inc</strong>luded performing such other procedures as we considered necessary in the<br />
circumstances. We believe that our audit provides a reasonable basis for our opinion.<br />
A company's internal control over financial reporting is a process designed to provide<br />
reasonable assurance regarding the reliability of financial reporting and the preparation of financial<br />
statements for external purposes in accordance with generally accepted accounting pr<strong>inc</strong>iples. A<br />
company's internal control over financial reporting <strong>inc</strong>ludes those policies and procedures that (1)<br />
pertain to the maintenance of records that, in reasonable detail, accurately and fairly reflect the<br />
transactions and dispositions of the assets of the Company; (2) provide reasonable assurance that<br />
transactions are recorded as necessary to permit preparation of financial statements in accordance<br />
with generally accepted accounting pr<strong>inc</strong>iples, and that receipts and expenditures of the Company<br />
are being made only in accordance with authorizations of management and directors of the<br />
Company; and (3) provide reasonable assurance regarding prevention or timely detection of<br />
unauthorized acquisition, use, or disposition of the Company's assets that could have a material<br />
effect on the financial statements.<br />
56
Because of its inherent limitations, internal control over financial reporting may not prevent or<br />
detect misstatements. Also, projections of any evaluation of effectiveness to future periods are<br />
subject to the risk that controls may become inadequate because of changes in conditions, or that<br />
the degree of compliance with the policies or procedures may deteriorate.<br />
In our opinion, PAB Bankshares, Inc. maintained, in all material respects, effective internal<br />
control over financial reporting as of December 31, 2009, based on criteria established in Internal<br />
Control - Integrated Framework issued by the Committee of Sponsoring Organizations of the<br />
Treadway Commission (COSO).<br />
We have also audited, in accordance with the standards of the Public Company Accounting<br />
Oversight Board (United States), the consolidated balance sheets of PAB Bankshares, Inc. and<br />
subsidiaries, and the related consolidated statements of <strong>inc</strong>ome (loss), comprehensive <strong>inc</strong>ome (loss),<br />
stockholders' equity and cash flows of PAB Bankshares, Inc., and our report dated, March 8, 2010,<br />
expressed an unqualified opinion.<br />
Albany, Georgia<br />
March 8, 2010<br />
57
Certified Public Accountants, LLC<br />
REPORT OF INDEPENDENT REGISTERED PUBLIC ACCOUNTING FIRM<br />
To the Board of Directors<br />
PAB Bankshares, Inc.<br />
Valdosta, Georgia<br />
We have audited the accompanying balance sheets of PAB Bankshares, Inc. and<br />
Subsidiaries as of December 31, 2009 and 2008, and the related consolidated statements of <strong>inc</strong>ome<br />
(loss), stockholders' equity and comprehensive <strong>inc</strong>ome (loss), and cash flows for each of the years in<br />
the three-year period ended December 31, 2009. These financial statements are the responsibility of<br />
the Company’s management. Our responsibility is to express an opinion on these financial<br />
statements based on our audits.<br />
We conducted our audits in accordance with the standards of the Public Company Accounting<br />
Oversight Board (United States). Those standards require that we plan and perform the audits to<br />
obtain reasonable assurance about whether the financial statements are free of material<br />
misstatement. Our audit of financial statements <strong>inc</strong>luded examining, on a test basis, evidence<br />
supporting the amounts and disclosures in the financial statements, assessing the accounting<br />
pr<strong>inc</strong>iples used and significant estimates made by management, and evaluating the overall financial<br />
statement presentation. We believe that our audits provide a reasonable basis for our opinion.<br />
In our opinion, the financial statements referred to above present fairly, in all material<br />
respects, the financial position of PAB Bankshares, Inc. and Subsidiaries as of December 31, 2009<br />
and 2008, and the results of their operations and their cash flows for each of the years in the threeyear<br />
period ended December 31, 2009 in conformity with accounting pr<strong>inc</strong>iples generally accepted in<br />
the United States of America.<br />
We also have audited, in accordance with the standards of the Public Company Accounting<br />
Oversight Board (United States), PAB Bankshares and Subsidiaries’ internal control over financial<br />
reporting as of December 31, 2009, based on criteria established in Internal Control - Integrated<br />
Framework issued by the Committee of Sponsoring Organizations of the Treadway Commission<br />
(COSO) and our report dated March 8, 2010, expressed an unqualified opinion.<br />
Albany, Georgia<br />
March 8, 2010<br />
58
PAB BANKSHARES, INC. AND SUBSIDIARIES<br />
CONSOLIDATED BALANCE SHEETS<br />
DECEMBER 31, 2009 AND 2008<br />
2009 2008<br />
ASSETS<br />
Cash and balances due from banks $ 16,641,978 $ 18,104,521<br />
Interest-bearing deposits in other banks 169,732,493 118,244,771<br />
Federal funds sold 103,825 1,054,719<br />
Investment securities<br />
111,541,113 176,613,411<br />
Restricted equity securities 9,459,600 9,159,904<br />
Loans<br />
805,313,687 956,687,391<br />
Allowance for loan losses (29,314,145) (19,373,625)<br />
Net loans<br />
775,999,542 937,313,766<br />
Premises and equipment, net 18,609,472 19,984,288<br />
Goodwill - 5,984,604<br />
Cash value of bank-owned life insurance policies 12,874,651 12,302,586<br />
Foreclosed assets 92,117,123 25,268,901<br />
Other assets 24,864,778 26,071,460<br />
Total assets $ 1,231,944,575 $ 1,350,102,931<br />
LIABILITIES AND STOCKHOLDERS' EQUITY<br />
Deposits:<br />
Noninterest-bearing demand $ 100,458,230 $ 91,114,337<br />
Interest-bearing demand and savings 250,232,355 252,122,046<br />
Time 694,524,617 780,466,875<br />
Total deposits 1,045,215,202 1,123,703,258<br />
Federal funds purchased and securities sold under agreements to repurchase 10,011,024 8,954,253<br />
Advances from the Federal Home Loan Bank of Atlanta 90,139,501 109,703,917<br />
Guaranteed preferred beneficial interests in debentures (trust preferred securities) 10,310,000 10,310,000<br />
Other borrowings 20,000,000<br />
-<br />
Other liabilities 5,682,200 5,830,761<br />
Total liabilities 1,181,357,927 1,258,502,189<br />
Stockholders' equity:<br />
Preferred stock, no par value; 1,500,000 shares authorized; no shares issued - -<br />
Common stock, no par value; 98,500,000 shares authorized;<br />
13,795,040 and 9,324,407 shares issued and outstanding 1,217,065 1,217,065<br />
Additional paid-in capital 37,348,508 24,225,407<br />
Retained earnings 11,295,000 62,467,000<br />
Accumulated other comprehensive <strong>inc</strong>ome 726,075 3,691,270<br />
Total stockholders' equity 50,586,648 91,600,742<br />
Total liabilities and stockholders' equity $ 1,231,944,575 $ 1,350,102,931<br />
See accompanying notes to consolidated financial statements.<br />
59
PAB BANKSHARES, INC. AND SUBSIDIARIES<br />
CONSOLIDATED STATEMENTS OF INCOME (LOSS)<br />
YEARS ENDED DECEMBER 31, 2009, 2008 AND 2007<br />
2009 2008 2007<br />
Interest <strong>inc</strong>ome:<br />
Interest and fees on loans $ 52,307,132 $ 61,686,147 $ 74,060,094<br />
Interest and dividends on investment securities:<br />
Taxable 6,622,165 7,678,742 8,210,696<br />
Nontaxable 628,718 1,294,165 1,214,213<br />
Other interest <strong>inc</strong>ome 323,434 325,028 1,190,678<br />
Total interest <strong>inc</strong>ome 59,881,449 70,984,082 84,675,681<br />
Interest expense:<br />
Interest on deposits 26,293,652 31,314,422 36,887,599<br />
Interest on Federal Home Loan Bank advances 4,150,946 3,955,870 4,068,962<br />
Interest on other borrowings 1,126,633 948,152 1,253,271<br />
Total interest expense 31,571,231 36,218,444 42,209,832<br />
Net interest <strong>inc</strong>ome 28,310,218 34,765,638<br />
42,465,849<br />
Provision for loan losses 51,187,987 18,050,000 2,400,000<br />
Net interest <strong>inc</strong>ome (expense) after provision for loan losses (22,877,769) 16,715,638 40,065,849<br />
Other <strong>inc</strong>ome:<br />
Service charges on deposit accounts 3,528,008 3,682,866 3,616,552<br />
Other fee <strong>inc</strong>ome 1,950,406 1,671,688 1,282,167<br />
Securities transactions, net 2,055,785 225,168 312,988<br />
Gain (loss) on sale and write-down of other assets (5,014,986) (1,853,261) 80,851<br />
Gain (loss) on derivative instrument 1,001,966 (16,011) -<br />
Other noninterest <strong>inc</strong>ome 1,014,088 692,380 698,709<br />
Total other <strong>inc</strong>ome<br />
4,535,267 4,402,830 5,991,267<br />
Other expenses:<br />
Salaries and employee benefits expense 16,014,560 18,110,278 18,581,881<br />
Occupancy expense of premises 2,304,976 3,289,742 2,373,917<br />
Furniture and equipment expense 2,024,677 2,023,117 2,278,600<br />
Deposit insurance expense<br />
4,137,772 327,496 108,263<br />
Foreclosed asset expense 3,291,341 956,405 199,447<br />
Goodwill impairment expense 5,984,604 - -<br />
Other noninterest expense 6,815,293 5,877,030 6,048,057<br />
Total other expenses 40,573,223 30,584,068 29,590,165<br />
Income (loss) before <strong>inc</strong>ome tax expense (benefit) (58,915,725) (9,465,600) 16,466,951<br />
Income tax expense (benefit) (7,743,725) (3,554,335) 5,681,236<br />
Net <strong>inc</strong>ome (loss) $ (51,172,000) $ (5,911,265) $ 10,785,715<br />
Earnings (loss) per common share:<br />
Basic $ (4.78) $ (0.63) $ 1.12<br />
Diluted $ (4.78) $ (0.63) $ 1.11<br />
See accompanying notes to consolidated financial statements.<br />
60
PAB BANKSHARES, INC. AND SUBSIDIARIES<br />
CONSOLIDATED STATEMENTS OF COMPREHENSIVE INCOME (LOSS)<br />
YEARS ENDED DECEMBER 31, 2009 2008 AND 2007<br />
2009 2008 2007<br />
Net <strong>inc</strong>ome (loss) $ (51,172,000) $ (5,911,265) $ 10,785,715<br />
Other comprehensive <strong>inc</strong>ome (loss):<br />
Unrealized gains (losses) on cash flow hedge during the period,<br />
net of tax (benefit) of ($653,162); $784,099; and $281,360 (1,267,899) 1,550,818 506,137<br />
Reclassification adjustment for (gains) losses on cash flow hedge<br />
<strong>inc</strong>luded in net <strong>inc</strong>ome, net of tax (benefit) of $340,668; ($5,444);<br />
and $0 (661,298) 10,567 -<br />
Unrealized holding gains on securities available<br />
for sale arising during the period, net of tax<br />
of $165,020; $734,845; and 809,190 320,820 1,435,381 1,502,781<br />
Reclassification adjustment for gains on securities<br />
available for sale <strong>inc</strong>luded in net <strong>inc</strong>ome, net of tax<br />
of $698,967; $76,557; and $109,546 (1,356,818) (148,611) (203,442)<br />
(2,965,195) 2,848,155 1,805,476<br />
Comprehensive <strong>inc</strong>ome (loss) $ (54,137,195) $ (3,063,110) $ 12,591,191<br />
See accompanying notes to consolidated financial statements.<br />
61
PAB BANKSHARES, INC. AND SUBSIDIARIES<br />
CONSOLIDATED STATEMENTS OF STOCKHOLDERS’ EQUITY<br />
YEARS ENDED DECEMBER 31, 2009, 2008 AND 2007<br />
Accumulated<br />
Additional<br />
Other<br />
Common Stock Paid-in Retained Comprehensive<br />
Shares Stated Value Capital Earnings Income (Loss) Total<br />
Balance, December 31, 2006 9,504,969 $ 1,217,065 $ 27,584,852 $ 67,476,178 $ (962,361) $ 95,315,734<br />
Net <strong>inc</strong>ome - - - 10,785,715 - 10,785,715<br />
Other comprehensive <strong>inc</strong>ome - - - - 1,805,476 1,805,476<br />
Cash dividends declared,<br />
$.58 per share - - - (5,439,041) - (5,439,041)<br />
Stock acquired and cancelled<br />
under stock repurchase plan (344,492) - (5,894,104) - - (5,894,104)<br />
Stock-based compensation - - 410,851 - - 410,851<br />
Stock options exercised 62,740 - 691,341 - - 691,341<br />
Balance, December 31, 2007 9,223,217 1,217,065 22,792,940 72,822,852 843,115 97,675,972<br />
Net loss - - - (5,911,265) - (5,911,265)<br />
Other comprehensive <strong>inc</strong>ome - - - - 2,848,155 2,848,155<br />
Cash dividends declared,<br />
$.24 per share - - - (2,195,622) - (2,195,622)<br />
2% stock dividend declared 183,739 - 2,248,965 (2,248,965) - -<br />
Stock acquired and cancelled<br />
under stock repurchase plan (86,065) - (1,162,521) -<br />
- (1,162,521)<br />
Stock-based compensation - - 310,043 - - 310,043<br />
Stock options exercised 3,516 - 35,980 - -<br />
35,980<br />
Balance, December 31, 2008 9,324,407 1,217,065 24,225,407 62,467,000 3,691,270 $ 91,600,742<br />
Net loss - - - (51,172,000)<br />
- (51,172,000)<br />
Other comprehensive loss - - - - (2,965,195) (2,965,195)<br />
Proceeds from private placement<br />
of capital 4,470,633 - 12,772,471 - - 12,772,471<br />
Stock-based compensation - - 350,630 - - 350,630<br />
Balance, December 31, 2009<br />
13,795,040 $ 1,217,065 $ 37,348,508 $ 11,295,000 $ 726,075 $ 50,586,648<br />
See accompanying notes to consolidated financial statements.<br />
62
PAB BANKSHARES, INC. AND SUBSIDIARIES<br />
CONSOLIDATED STATEMENTS OF CASH FLOWS<br />
YEARS ENDED DECEMBER 31, 2009, 2008 AND 2007<br />
2009 2008 2007<br />
CASH FLOWS FROM OPERATING ACTIVITIES<br />
Net <strong>inc</strong>ome (loss) $ (51,172,000) $ (5,911,265) $ 10,785,715<br />
Adjustments to reconcile net <strong>inc</strong>ome (loss) to net cash<br />
provided by operating activities:<br />
Depreciation, amortization and accretion, net<br />
1,429,840 1,713,629 1,716,530<br />
Provision for loan losses 51,187,987 18,050,000 2,400,000<br />
Provision for deferred taxes 7,847,947 (2,671,456) (644,268)<br />
Goodwill impairment 5,984,604 -<br />
-<br />
Net realized gain on securities transactions (2,055,785) (225,168) (312,988)<br />
Loss (gain) on disposal of assets/writedowns of assets<br />
5,014,986 1,853,261 (70,860)<br />
Net realized (gain) loss on derivative instruments (1,001,966) 16,011 -<br />
Stock-based compensation expense 350,630<br />
310,043 410,851<br />
Increase in cash value of bank-owned life insurance<br />
(572,065) (421,202) (406,420)<br />
Increase (decrease) in deferred compensation accrual 154,052 (235,904) (226,951)<br />
Decrease in retirement and severance accruals - - (159,799)<br />
Decrease in interest receivable 1,138,406 1,684,196<br />
8,761<br />
Increase (decrease) in interest payable (386,209) 133,993 78,775<br />
Net change in taxes receivable and taxes payable (11,155,122) (2,512,780) (957,764)<br />
Net decrease in accrued expenses and other liabilities (721,442) (1,539,556) (485,914)<br />
Net cash provided by operating activities 6,043,863 10,243,802 12,135,668<br />
CASH FLOWS FROM INVESTING ACTIVITIES<br />
(Increase) decrease in interest-bearing deposits in other banks (51,487,722) (117,851,495) 157,031<br />
(Increase) decrease in federal funds sold 950,894 (495,275) 41,053,284<br />
Purchase of debt securities (62,147,885) (57,790,529) (43,392,095)<br />
Proceeds from sales of debt securities<br />
85,415,386 36,459,026 19,540,964<br />
Proceeds from calls of debt securities<br />
Proceeds from maturities and paydowns of debt securities<br />
15,602,000<br />
26,155,093<br />
21,182,927<br />
12,693,713<br />
2,996,778<br />
11,734,367<br />
Purchase of equity securities<br />
(670,523) (1,664,593) (65,858)<br />
Redemption of equity securities 691,123 452,100<br />
886,151<br />
Net (<strong>inc</strong>rease) decrease in loans<br />
Purchase of premises and equipment<br />
28,876,191<br />
(592,617)<br />
(70,519,785)<br />
(2,341,941)<br />
(108,962,052)<br />
(1,243,446)<br />
Proceeds from disposal of assets 11,397,940 3,991,067 2,234,053<br />
Net cash provided by (used in) investing activities 54,189,880 (175,884,785) (75,060,823)<br />
63
PAB BANKSHARES, INC. AND SUBSIDIARIES<br />
CONSOLIDATED STATEMENTS OF CASH FLOWS<br />
YEARS ENDED DECEMBER 31, 2009, 2008 AND 2007<br />
2009 2008 2007<br />
CASH FLOWS FROM FINANCING ACTIVITIES<br />
Net <strong>inc</strong>rease (decrease) in deposits (78,238,056) 143,554,240 71,666,026<br />
Net <strong>inc</strong>rease (decrease) in federal funds purchased and securities<br />
sold under repurchase agreements 1,056,771 (7,221,117) 8,526,706<br />
Advances from Federal Home Loan Bank 15,000,000 41,000,000 47,500,000<br />
Payments on Federal Home Loan Bank advances (34,564,416) (17,593,788) (51,392,997)<br />
Proceed from issuance of long-term debt 20,000,000 - -<br />
Proceeds from termination of cash flow hedge derivative instrument 2,276,944 - -<br />
Proceeds from private placement of capital 12,772,471 - -<br />
Dividends paid - (3,532,990) (5,432,369)<br />
Proceeds from the exercise of stock options - 35,980 691,341<br />
Purchase of cash flow hedge derivative instrument - (786,000) -<br />
Acquisition of stock under stock repurchase plans - (1,162,521) (5,894,104)<br />
Net cash provided by (used in) financing activities (61,696,286) 154,293,804 65,664,603<br />
Net <strong>inc</strong>rease (decrease) in cash and balances due from banks $ (1,462,543) $ (11,347,179) $ 2,739,448<br />
Cash and balances due from banks at beginning of period 18,104,521 29,451,700 26,712,252<br />
Cash and balances due from banks at end of period $ 16,641,978 $ 18,104,521 $ 29,451,700<br />
SUPPLEMENTAL DISCLOSURES OF CASH FLOW INFORMATION<br />
Cash paid (received) during the period for:<br />
Interest $ 31,957,440 $ 36,084,451 $ 42,131,057<br />
Taxes $ (3,959,872) $ 2,044,000 $ 5,770,337<br />
NONCASH INVESTING AND FINANCING TRANSACTIONS<br />
Increase (decrease) in unrealized gains on securities available for sale $ (1,569,945) $ 1,945,058 $ 1,998,983<br />
Increase (decrease) in unrealized gains on cash flow hedge $ (2,917,308) $ 2,350,929 $ 787,496<br />
Transfer of loans to foreclosed assets $ 81,250,046 $ 23,598,987 $ 7,417,079<br />
See accompanying notes to consolidated financial statements.<br />
64
PAB BANKSHARES, INC. AND SUBSIDIARIES<br />
NOTES TO CONSOLIDATED FINANCIAL STATEMENTS<br />
NOTE 1.<br />
SUMMARY OF SIGNIFICANT ACCOUNTING POLICIES<br />
Nature of Business<br />
PAB Bankshares, Inc. (the “Company”) is a bank holding company whose business is conducted primarily by its whollyowned<br />
commercial bank subsidiary, The Park Avenue Bank (the “Bank”). The Bank is a state-chartered member bank of<br />
the Federal Reserve System that was founded in 1956 in Valdosta, Lowndes County, Georgia. Through the Bank, the<br />
Company offers a broad range of commercial and consumer banking products and services to customers located primarily<br />
in the local market areas listed below. The Company and the Bank are subject to the regulations of certain federal and<br />
state agencies and are periodically examined by those regulatory agencies. The following is a listing of the Bank’s offices<br />
as of December 31, 2009:<br />
Banking Locations<br />
Number of Offices<br />
South Georgia Market:<br />
Valdosta, Lowndes County<br />
3 (<strong>inc</strong>luding the main office)<br />
Lake Park, Lowndes County 1<br />
Adel, Cook County 1 1<br />
Bainbridge, Decatur County 3<br />
Cairo, Grady County 1<br />
Statesboro, Bulloch County 1 2<br />
Baxley, Appling County 1 1<br />
Hazlehurst, Jeff Davis County 1 1<br />
North Georgia Market:<br />
McDonough, Henry County 1<br />
Stockbridge, Henry County 1<br />
Oakwood, Hall County 1<br />
Athens, Oconee County 1<br />
Cumming, Forsyth County 2<br />
1 (loan production office)<br />
Florida Market:<br />
Ocala, Marion County 1<br />
St. Augustine, St. Johns County 2<br />
1 (loan production office)<br />
The Company also owns PAB Bankshares Capital Trust II, a Delaware statutory business trust. This non-operating<br />
subsidiary was created in 2006 for the sole purpose of issuing trust preferred securities and investing the proceeds in<br />
subordinated debt issued by the Company, all of which are described more fully in Note 11.<br />
1 The Company entered into a Purchase and Assumption Agreement on February 23, 2010 to sell these offices. Subject to regulatory<br />
approval, the sale is expected to close during the second quarter of 2010.<br />
2 These offices were closed January 31, 2010.<br />
65
NOTES TO CONSOLIDATED FINANCIAL STATEMENTS<br />
NOTE 1.<br />
SUMMARY OF SIGNIFICANT ACCOUNTING POLICIES (Continued)<br />
Basis of Presentation and Accounting Estimates<br />
The consolidated financial statements <strong>inc</strong>lude the accounts of the Company and its subsidiaries. Significant intercompany<br />
transactions and balances are eliminated in consolidation.<br />
In preparing the consolidated financial statements in accordance with accounting pr<strong>inc</strong>iples generally accepted in the<br />
United States of America, management is required to make estimates and assumptions that affect the reported amounts of<br />
assets and liabilities and the disclosure of contingent assets and liabilities as of the balance sheet date and the reported<br />
amounts of revenues and expenses during the reporting period. Actual results could differ from those estimates. Material<br />
estimates that are particularly susceptible to significant change relate to the determination of the allowance for loan losses,<br />
the valuation of goodwill, the valuation of foreclosed assets, the valuation of deferred taxes, other-than-temporary<br />
impairment of securities, and fair value measurements.<br />
In May 2008, the Company declared a 2% stock dividend on the Company’s common stock, payable on July 15, 2008 to<br />
holders of record on June 30, 2008. The weighted average number of shares and all other share and per share data<br />
<strong>inc</strong>luded in this Report has been restated for all periods presented to reflect this stock dividend.<br />
Cash and Balances Due from Banks and Cash Flows<br />
For purposes of reporting cash flows, cash and balances due from banks <strong>inc</strong>lude cash on hand, cash items in process of<br />
collection and amounts due from banks. Cash flows from loans, federal funds sold, interest bearing deposits in other<br />
banks, federal funds purchased and securities sold under repurchase agreements and deposits are reported net. At various<br />
times throughout the year, cash balances held at other financial institutions will exceed federally insured limits.<br />
Interest Bearing Deposits in Other Banks<br />
Interest-bearing deposits in other banks are primarily overnight funds or funds which mature within one year and are<br />
carried at cost.<br />
Investment Securities<br />
All debt securities are classified as available for sale and recorded at fair value with unrealized gains and losses excluded<br />
from earnings and reported in accumulated other comprehensive <strong>inc</strong>ome, net of the related deferred tax effect. Equity<br />
securities are comprised of marketable equity securities recorded at fair value, and other equity securities, which consisted<br />
of an investment in the common stock of a non-publicly traded correspondent bank in 2008. The equity securities without<br />
readily determinable fair values are periodically evaluated for impairment. The investment in the common stock of the<br />
non-publicly traded correspondent bank was deemed fully impaired during 2009. At December 31, 2009, there were no<br />
known events that have occurred to require an impairment evaluation for the other investments.<br />
The amortization of purchase premiums and accretion of discounts are recognized in interest <strong>inc</strong>ome using the interest<br />
method over the terms of the securities. Realized gains and losses on securities transactions, determined using the specific<br />
identification method, are <strong>inc</strong>luded in earnings on the settlement date. Declines in the fair value of securities below their<br />
cost that are deemed to be other-than-temporary are reflected in earnings as realized losses. The <strong>Financial</strong> Accounting<br />
Standards Board (“FASB”) recently issued accounting guidance related to the recognition and presentation of other-thantemporary<br />
impairment (FASB ASC 320-10). See the “Recent Accounting Pronouncement” section for additional<br />
information. Prior to the adoption of the recent accounting guidance on April 1, 2009, management considered, in<br />
determining whether other-than-temporary impairment exists, (1) the length of time and the extent to which the fair value<br />
has been less than cost, (2) the financial condition and near-term prospects of the issuer, and (3) the intent and ability of<br />
the Company to retain its investment in the issuer for a period of time sufficient to allow for any anticipated recovery in<br />
fair value.<br />
66
NOTES TO CONSOLIDATED FINANCIAL STATEMENTS<br />
NOTE 1.<br />
SUMMARY OF SIGNIFICANT ACCOUNTING POLICIES (Continued)<br />
Restricted Equity Securities<br />
The Company is required to maintain an investment in capital stock of various entities. Based on redemption provisions of<br />
these entities, the stock has no quoted market value and is carried at cost. At their discretion, these entities may declare<br />
dividends on the stock. Management reviews for impairment based on the ultimate recoverability of the cost basis in these<br />
stocks.<br />
Loans<br />
Loans that management has the intent and ability to hold for the foreseeable future or until maturity or payoff are reported<br />
at their outstanding pr<strong>inc</strong>ipal balances less unearned <strong>inc</strong>ome, net deferred fees and costs on originated loans, and the<br />
allowance for loan losses. Interest <strong>inc</strong>ome is accrued on the outstanding pr<strong>inc</strong>ipal balance. Loan origination fees, net of<br />
certain direct loan origination costs, are deferred and recognized as an adjustment to the related loan yield over the life of<br />
the loan using the interest method except for loans which provide no scheduled payment terms or revolving lines of credit,<br />
which are recognized on the straight-line method.<br />
The accrual of interest on loans is discontinued when, in management's opinion, the borrower may be unable to meet<br />
payments as they become due, unless the loan is well-secured. Past due status is based on contractual terms of the loan. In<br />
all cases, loans are placed on nonaccrual or charged off at an earlier date if collection of pr<strong>inc</strong>ipal or interest is considered<br />
doubtful. All interest accrued but not collected for loans that are placed on nonaccrual status or charged off is reversed<br />
against interest <strong>inc</strong>ome, unless management believes that the accrued interest is recoverable through the liquidation of<br />
collateral. Interest <strong>inc</strong>ome on nonaccrual loans is subsequently recognized only to the extent cash payments are received<br />
until the loan is returned to accrual status. Loans are returned to accrual status when all the pr<strong>inc</strong>ipal and interest amounts<br />
contractually due are brought current and future payments are reasonably assured.<br />
A loan is considered impaired when it is probable, based on current information and events, the Company will be unable to<br />
collect all pr<strong>inc</strong>ipal and interest payments due in accordance with the contractual terms of the loan agreement. Factors<br />
considered by management in determining impairment <strong>inc</strong>lude payment status, collateral value, and the probability of<br />
collecting scheduled pr<strong>inc</strong>ipal and interest when due. Loans that experience insignificant payment delays and payment<br />
shortfalls are not classified as impaired. Impaired loans are measured by either the present value of expected future cash<br />
flows discounted at the loan’s effective interest rate, the loan’s obtainable market price, or the fair value of the collateral if<br />
the loan is collateral dependent. Interest on accruing impaired loans is recognized as long as such loans do not meet the<br />
criteria for nonaccrual status Large groups of smaller balance homogeneous loans are collectively evaluated for<br />
impairment.<br />
Allowance for Loan Losses<br />
The allowance for loan losses is established through a provision for loan losses charged to expense. Loan losses are<br />
charged against the allowance when management believes the collectibility of the pr<strong>inc</strong>ipal is unlikely. Subsequent<br />
recoveries, if any, are credited to the allowance.<br />
The allowance is an amount that management believes will be adequate to absorb estimated losses relating to specifically<br />
identified loans, as well as probable credit losses inherent in the balance of the loan portfolio. The allowance for loan<br />
losses is evaluated on a regular basis by management and is based upon management’s periodic review of the<br />
uncollectibility of loans in light of historical experience, the nature and volume of the loan portfolio, overall portfolio<br />
quality, review of specific problem loans, current economic conditions that may affect the borrower's ability to pay,<br />
estimated value of any underlying collateral and prevailing economic conditions. This evaluation is inherently subjective<br />
as it requires estimates that are susceptible to significant revision as more information becomes available. This evaluation<br />
does not <strong>inc</strong>lude the effects of expected losses on specific loans or groups of loans that are related to future events or<br />
expected changes in economic conditions. While management uses the best information available to make its evaluation,<br />
future adjustments to the allowance may be necessary if there are significant changes in economic conditions. In addition,<br />
regulatory agencies, as an integral part of their examination process, periodically review the Company's allowance for loan<br />
losses, and may require the Company to make additions to the allowance based on their judgment about information<br />
available to them at the time of their examinations.<br />
67
NOTES TO CONSOLIDATED FINANCIAL STATEMENTS<br />
NOTE 1.<br />
SUMMARY OF SIGNIFICANT ACCOUNTING POLICIES (Continued)<br />
The allowance consists of specific, general and unallocated components. The specific component relates to loans that are<br />
classified as impaired. For impaired loans, an allowance is established when the discounted cash flows, collateral value, or<br />
observable market price of the impaired loan is lower than the carrying value of that loan. The general component covers<br />
non-impaired loans and is based on historical loss experience adjusted for other qualitative factors. Other adjustments may<br />
be made to the allowance for pools of loans after an assessment of internal or external influences on credit quality that are<br />
not fully reflected in the historical loss or risk rating data. An unallocated component may be maintained to cover<br />
uncertainties that could affect management’s estimate of probable losses. The unallocated component of the allowance<br />
reflects the margin of imprecision inherent in the underlying assumptions used in the methodologies for estimating specific<br />
and general losses in the portfolio.<br />
Premises and Equipment<br />
Land is carried at cost. Buildings and equipment are stated at cost less accumulated depreciation computed pr<strong>inc</strong>ipally by<br />
the straight-line method over the estimated useful lives of the assets, ranging from 10-40 years for buildings and<br />
improvements, and 3-10 years for furniture, fixtures and equipment. Generally, furniture, fixtures and equipment with a<br />
cost per unit of less than $1,000 are expensed as <strong>inc</strong>urred and are not capitalized.<br />
Goodwill<br />
Goodwill represents the excess of cost over the fair value of the net assets purchased in business combinations. Goodwill<br />
is required to be tested annually for impairment, or whenever events occur that may indicate that the recoverability of the<br />
carrying amount is not probable. In the event of impairment, the amount by which the carrying amount exceeds the fair<br />
value would be charged to earnings. The Company performed its annual test of impairment in the fourth quarter and<br />
determined that there was full impairment of the recorded goodwill. Therefore, the $5,984,604 carrying value of goodwill<br />
was charged to earnings during 2009.<br />
There were no changes in the carrying amount of goodwill during the years ended December 31, 2008 and 2007.<br />
Foreclosed Assets<br />
Foreclosed assets acquired through, or in lieu of, loan foreclosure are held for sale and are initially recorded at fair value<br />
less selling costs. Any write-down to fair value at the time of transfer to foreclosed assets is charged to the allowance for<br />
loan losses. Subsequent to foreclosure, valuations are periodically performed by management and the assets are carried at<br />
the lower of carrying amount or fair value less costs to sell. Costs of improvements are capitalized, whereas costs relating<br />
to holding foreclosed assets and subsequent write-downs to the value are expensed.<br />
Income Taxes<br />
The Company accounts for <strong>inc</strong>ome taxes in accordance with <strong>inc</strong>ome tax accounting guidance (FASB ASC 740, Income<br />
Taxes). On January 1, 2009, the Company adopted the recent accounting guidance related to accounting for uncertainty in<br />
<strong>inc</strong>ome taxes, which sets out a consistent framework to determine the appropriate level of tax reserves to maintain for<br />
uncertain tax positions.<br />
The <strong>inc</strong>ome tax accounting guidance results in two components of <strong>inc</strong>ome tax expense: current and deferred. Current<br />
<strong>inc</strong>ome tax expense reflects taxes to be paid or refunded for the current period by applying the provisions of the enacted<br />
tax law to the taxable <strong>inc</strong>ome or excess of deductions over revenues. The Company determines deferred <strong>inc</strong>ome taxes<br />
using the liability (or balance sheet) method. Under this method, the net deferred tax asset or liability is based on the tax<br />
effects of the differences between the book and tax bases of assets and liabilities, and enacted changes in tax rates and laws<br />
are recognized in the period in which they occur.<br />
68
NOTES TO CONSOLIDATED FINANCIAL STATEMENTS<br />
NOTE 1.<br />
SUMMARY OF SIGNIFICANT ACCOUNTING POLICIES (Continued)<br />
Deferred <strong>inc</strong>ome tax expense results from changes in deferred tax assets and liabilities between periods. Deferred tax<br />
assets are recognized if it is more likely than not, based on the technical merits, that the tax position will be realized or<br />
sustained upon examination. The term more likely than not means a likelihood of more than 50 percent; the terms<br />
examined and upon examination also <strong>inc</strong>lude resolution of the related appeals or litigation processes, if any. A tax<br />
position that meets the more-likely-than-not recognition threshold is initially and subsequently measured as the largest<br />
amount of tax benefit that has a greater than 50 percent likelihood of being realized upon settlement with a taxing authority<br />
that has full knowledge of all relevant information. The determination of whether or not a tax position has met the morelikely-than-<br />
not recognition threshold considers the facts, circumstances, and information available at the reporting date<br />
and is subject to management’s judgment. Deferred tax assets may be reduced by deferred tax liabilities and a valuation<br />
allowance if, based on the weight of evidence available, it is more likely than not that some portion or all of a deferred tax<br />
asset will not be realized. Accordingly, a valuation allowance has been established in the amount of $11,403,899 against<br />
such benefits at December 31, 2009, compared to $267,960 at December 31, 2008.<br />
Stock Based Compensation Plans<br />
Stock compensation accounting guidance (FASB ASC 718, Compensation - Stock Compensation) requires that the<br />
compensation cost relating to share-based payment transactions be recognized in financial statements. That cost will be<br />
measured based on the grant date fair value of the equity or liability instruments issued. The stock compensation<br />
accounting guidance covers a wide range of share-based compensation arrangements <strong>inc</strong>luding stock options, restricted<br />
share plans, performance-based awards, share appreciation rights, and employee share purchase plans.<br />
The stock compensation accounting guidance requires that compensation cost for all stock awards be calculated and<br />
recognized over the employees’ service period, generally defined as the vesting period. For awards with graded-vesting,<br />
compensation cost is recognized on a straight-line basis over the requisite service period for the entire award. A Black-<br />
Scholes model is used to estimate the fair value of stock options, while the market price of the Company’s common stock<br />
at the date of grant is used for restricted stock awards and stock grants.<br />
Earnings Per Share<br />
Basic earnings per share represents <strong>inc</strong>ome available to common stockholders divided by the weighted-average number of<br />
common shares outstanding during the period. Diluted earnings per share reflects additional potential common shares that<br />
would have been outstanding if dilutive potential common shares had been issued, as well as any adjustment to <strong>inc</strong>ome<br />
that would result from the assumed issuance. Potential common shares that may be issued by the Corporation relate solely<br />
to outstanding stock options, and are determined using the treasury stock method.<br />
Comprehensive Income (Loss)<br />
Accounting pr<strong>inc</strong>iples generally require that recognized revenue, expenses, gains and losses be <strong>inc</strong>luded in net <strong>inc</strong>ome.<br />
Although certain changes in assets and liabilities, such as unrealized gains and losses on available for sale securities and<br />
cash flow hedge derivative instruments, are reported as a separate component of the equity section of the balance sheet,<br />
such items, along with net <strong>inc</strong>ome, are components of comprehensive <strong>inc</strong>ome.<br />
Transfers of <strong>Financial</strong> Assets<br />
Transfers of financial assets are accounted for as sales, when control over the assets has been surrendered. Control over<br />
transferred assets is deemed to be surrendered when (1) the assets have been isolated from the Corporation - put<br />
presumptively beyond the reach of the transferor and its creditors, even in bankruptcy or other receivership, (2) the<br />
transferee obtains the right (free of conditions that constrain it from taking advantage of that right) to pledge or exchange<br />
the transferred assets, and (3) the Corporation does not maintain effective control over the transferred assets through an<br />
agreement to repurchase them before their maturity or the ability to unilaterally cause the holder to return specific assets.<br />
69
NOTES TO CONSOLIDATED FINANCIAL STATEMENTS<br />
NOTE 1.<br />
SUMMARY OF SIGNIFICANT ACCOUNTING POLICIES (Continued)<br />
Advertising Costs<br />
Advertising costs are expensed as <strong>inc</strong>urred.<br />
Reclassification<br />
Certain amounts in the 2008 consolidated financial statements have been reclassified to conform to the 2009 presentation.<br />
Fair Value of <strong>Financial</strong> Instruments<br />
Fair values of financial instruments are estimates using relevant market information and other assumptions, as more fully<br />
disclosed in Note 25. Fair value estimates involve uncertainties and matters of significant judgment. Changes in<br />
assumptions or in market conditions could significantly affect the estimates.<br />
Recent Accounting Standards<br />
Effective July 1, 2009, the Company adopted a new accounting guidance related to U.S. GAAP (FASB ASC 105,<br />
Generally Accepted Accounting Pr<strong>inc</strong>iples). This guidance establishes FASB ASC as the source of authoritative U.S.<br />
GAAP recognized by FASB to be applied by nongovernmental entities. Rules and interpretive releases of the SEC under<br />
authority of federal securities laws are also sources of authoritative U.S. GAAP for SEC registrants. FASB ASC<br />
supersedes all existing non-SEC accounting and reporting standards. All other nongrandfathered, non-SEC accounting<br />
literature not <strong>inc</strong>luded in FASB ASC has become nonauthoritative. FASB will no longer issue new standards in the form<br />
of Statements, FASB Staff Positions, or Emerging Issues Task Force Abstracts. Instead, it will issue Accounting<br />
Standards Updates (ASUs), which will serve to update FASB ASC, provide background information about the guidance,<br />
and provide the basis for conclusions on the changes to FASB ASC. FASB ASC is not intended to change U.S. GAAP or<br />
any requirements of the SEC. This guidance is effective for the Company as of December 31, 2009.<br />
Effective April 1, 2009, the Company adopted new accounting guidance related to recognition and presentation of otherthan-temporary<br />
impairment (FASB ASC 320-10). This recent accounting guidance amends the recognition guidance for<br />
other-than-temporary impairments of debt securities and expands the financial statement disclosures for other-thantemporary<br />
impairment losses on debt and equity securities. The recent guidance replaced the “intent and ability”<br />
indication in current guidance by specifying that (a) if a company does not have the intent to sell a debt security prior to<br />
recovery and (b) it is more likely than not that it will not have to sell the debt security prior to recovery, the security would<br />
not be considered other-than-temporarily impaired unless there is a credit loss. When an entity does not intend to sell the<br />
security, and it is more likely than not, the entity will not have to sell the security before recovery of its cost basis, it will<br />
recognize the credit component of an other-than-temporary impairment of a debt security in earnings and the remaining<br />
portion in other comprehensive <strong>inc</strong>ome. For held-to-maturity debt securities, the amount of an other-than-temporary<br />
impairment recorded in other comprehensive <strong>inc</strong>ome for the noncredit portion of a previous other-than-temporary<br />
impairment should be amortized prospectively over the remaining life of the security on the basis of the timing of future<br />
estimated cash flows of the security.<br />
The Company adopted accounting guidance related to fair value measurements and disclosures (FASB ASC 820, Fair<br />
Value Measurements and Disclosures). This guidance defines fair value, establishes a framework for measuring fair<br />
value, and expands disclosures about fair value measurements. This guidance establishes a fair value hierarchy about the<br />
assumptions used to measure fair value and clarifies assumptions about risk and the effect of a restriction on the sale or use<br />
of an asset. The effect of adoption was not material.<br />
FASB issued ASU 2009-05 (FASB ASC 820) which describes the valuation techniques companies should use to measure<br />
the fair value of liabilities for which there is limited observable market data. If a quoted price in an active market is not<br />
available for an identical liability, an entity should use one of the following approaches: (1) the quoted price of the<br />
identical liability when traded as an asset, (2) quoted prices for similar liabilities or similar liabilities when traded as an<br />
asset, or (3) another valuation technique that is consistent with the accounting guidance in FASB ASC for fair value<br />
70
NOTES TO CONSOLIDATED FINANCIAL STATEMENTS<br />
NOTE 1.<br />
SUMMARY OF SIGNIFICANT ACCOUNTING POLICIES (Continued)<br />
measurements and disclosures. When measuring the fair value of liabilities, this guidance reiterates that companies should<br />
apply valuation techniques that maximize the use of relevant observable inputs, which is consistent with existing<br />
accounting provisions for fair value measurements. In addition, this guidance clarifies when an entity should adjust quoted<br />
prices of identical or similar assets that are used to estimate the fair value of liabilities. This guidance is effective for the<br />
Company as of December 31, 2009 with adoption applied prospectively.<br />
In addition, the following accounting pronouncements were issued by FASB, but are not yet effective:<br />
FASB issued accounting guidance (FASB Statement No. 166) which modifies certain guidance contained in the Transfers<br />
and Servicing topic of FASB ASC (FASB ASC 860). This standard eliminates the concept of qualifying special purpose<br />
entities, provides guidance as to when a portion of a transferred financial asset can be evaluated for sale accounting,<br />
provides additional guidance with regard to accounting for transfers of financial assets, and requires additional disclosures.<br />
This guidance is effective for the Company as of January 1, 2010, with adoption applied prospectively for transfers that<br />
occur on or after the effective date.<br />
NOTE 2. REGULATORY OVERSIGHT, CAPITAL ADEQUACY, OPERATING LOSSES, LIQUIDITY AND<br />
MANAGEMENT’S PLANS<br />
Regulatory Oversight<br />
The Company and the Bank are currently operating under heightened regulatory scrutiny and have entered into a Written<br />
Agreement with the Federal Reserve Bank of Atlanta and the Georgia Department of Banking and Finance on July 14,<br />
2009. The Written Agreement places certain requirements and restrictions on the Bank. Under the terms of the Written<br />
Agreement, the Bank is required to prepare and submit written plans and reports to the regulators that address<br />
strengthening the Bank’s credit risk management practices, improving loan underwriting and loan administration,<br />
improving asset quality, <strong>inc</strong>luding improving the Bank’s position on problem loans through repayment, additional<br />
collateral or other means; reviewing and revising as necessary the Bank’s allowance for loan and lease losses policy;<br />
maintaining sufficient capital at the Bank; revising and implementing a profitability plan and comprehensive budget to<br />
improve and sustain the Bank’s earnings; and improving the Bank’s liquidity position and funds management practices.<br />
The Company submitted the requested plans to the regulators for their review on August 26, 2009. The Company may<br />
supplement these plans and reports in the future in response to comments and requests from our regulators. While the<br />
Written Agreement remains in place, the Company may not pay dividends and may not <strong>inc</strong>rease debt or redeem any shares<br />
of our stock without the prior written consent of the regulators.<br />
S<strong>inc</strong>e the Bank entered into the Written Agreement, it has aggressively taken steps to address the components of the<br />
Written Agreement. The Bank has taken an active role in working with the Federal Reserve and the Georgia Department<br />
to improve its financial condition and are addressing the items <strong>inc</strong>luded in the Written Agreement on a continuing basis,<br />
<strong>inc</strong>luding establishing new commercial real estate loan concentration limits, new policies on the use of interest reserves,<br />
and comprehensive underwriting criteria for commercial credit analysis. The Bank has also developed plans to strengthen<br />
its problem asset management function and to reduce the level of problem assets on its balance sheet over a period of time.<br />
The Bank is in ongoing dialogue with its regulators to remain in compliance with the terms of the Written Agreement.<br />
Failure to adequately address the Written Agreement may result in actions by the banking regulators <strong>inc</strong>luding, the<br />
eventual appointment of a receiver or conservator of the Bank’s assets.<br />
Capital Adequacy<br />
As of December 31, 2009, the Bank was considered “adequately capitalized,” not “well capitalized,” under regulatory<br />
guidelines. Management is pursuing a number of strategic alternatives to improve the capital ratios of the Bank and to<br />
reduce the level of classified assets. Current market conditions for banking institutions, the overall uncertainty in<br />
financial markets and the Bank’s high level of non-performing assets are potential barriers to the success of these<br />
strategies. If current adverse market factors continue for a prolonged period of time, new adverse market factors emerge,<br />
and/or the Bank is unable to successfully execute its plans or adequately address regulatory concerns in a sufficiently<br />
timely manner, it could have a material adverse effect on the Bank’s business, results of operations and financial position.<br />
71
NOTES TO CONSOLIDATED FINANCIAL STATEMENTS<br />
NOTE 2. REGULATORY OVERSIGHT, CAPITAL ADEQUACY, OPERATING LOSSES, LIQUIDITY AND<br />
MANAGEMENT’S PLANS (Continued)<br />
Operating Losses<br />
The Company <strong>inc</strong>urred a net loss of $51.2 million for the year ended December 31, 2009. This loss was largely the result<br />
of <strong>inc</strong>reases in non-performing assets, which caused the Company to record <strong>inc</strong>reased provisions for loan losses, carrying<br />
costs on foreclosed properties and losses on the sale of foreclosed properties, and other non-recurring accounting<br />
adjustments. Carrying costs on foreclosed assets are expected to remain elevated during 2010 as the Company works<br />
towards liquidation of these non-performing assets. Margin compression also contributed to the net loss for 2009. In<br />
addition, during the fourth quarter of 2009, the Company recorded a $6.0 million goodwill impairment charge and a<br />
deferred tax valuation allowance of $11.1 million.<br />
Liquidity<br />
The Bank’s primary sources of liquidity are provided by its deposits, the scheduled repayments on its loans, and interest<br />
and maturities of its investments. Cash and due from banks and federal funds sold can also be utilized to meet liquidity<br />
needs. At December 31, 2009, the Bank had approximately $142.7 million, or approximately 12% of its total assets, in<br />
cash balances on account at the Federal Reserve. All securities have been classified as available for sale, which means<br />
they are carried at fair value with unrealized gains and losses excluded from earnings and reported as a separate<br />
component of other comprehensive <strong>inc</strong>ome. If necessary, the Bank has the ability to sell a portion of its unpledged<br />
investment securities to manage its interest rate sensitivity or liquidity. Unpledged securities totaled $20.2 million at<br />
December 31, 2009. S<strong>inc</strong>e the Bank is not considered “well capitalized” as of December 31, 2009, it is unable to accept,<br />
rollover, or renew any brokered deposits without prior regulatory approval. Approximately $53.3 million of the Bank’s<br />
existing brokered deposits are scheduled to mature in 2010. Based on current and expected liquidity needs and sources,<br />
the Company expects to be able to meet its obligations through December 31, 2010.<br />
NOTE 3.<br />
RESTRICTIONS ON CASH AND BALANCES DUE FROM BANKS<br />
The Bank is required to maintain reserve balances in cash or on deposit with correspondent banks and the Federal Reserve<br />
Bank of Atlanta, based on a percentage of deposits. The total of those reserve balances was approximately $16,579,000<br />
and $6,992,000 at December 31, 2009 and 2008, respectively.<br />
72
NOTES TO CONSOLIDATED FINANCIAL STATEMENTS<br />
NOTE 4.<br />
INVESTMENT SECURITIES<br />
The amortized cost and fair value of securities with gross unrealized gains and losses are summarized as follows:<br />
Securities Available for Sale<br />
December 31, 2009:<br />
Debt securities:<br />
U.S. Government-sponsored<br />
enterprises (GSEs)<br />
Amortized<br />
Cost<br />
Gross<br />
Unrealized<br />
Gains<br />
Gross<br />
Unrealized<br />
Losses<br />
Fair Value<br />
$ 30,452,647 $ 262,292 $ (247,182) $ 30,467,757<br />
State and municipal securities 9,997,494 117,577 (393,701) 9,721,370<br />
Corporate<br />
4,027,832 - (198,492) 3,829,340<br />
Mortgage-backed<br />
GSE residential 65,585,084 1,379,928 (217,795) 66,747,217<br />
Private-label residential 606,719 - (5,271) 601,448<br />
Private-label commercial 176,449 -<br />
(2,468) 173,981<br />
Total securities available for sale $ 110,846,225 $ 1,759,797 $ (1,064,909) $ 111,541,113<br />
Securities Available for Sale<br />
December 31, 2008:<br />
Debt securities:<br />
U.S. Government-sponsored<br />
Amortized<br />
Cost<br />
Gross<br />
Unrealized<br />
Gains<br />
Gross<br />
Unrealized<br />
Losses<br />
Fair Value<br />
enterprises (GSEs) $ 34,425,092 $ 878,996 $ (947) $ 35,303,141<br />
State and municipal securities 31,591,669 151,276 (1,381,782)<br />
30,361,163<br />
Corporate 7,456,382 69,975<br />
(561,857) 6,964,500<br />
Mortgage-backed<br />
GSE residential<br />
Private-label residential<br />
99,167,402<br />
800,188<br />
3,196,157<br />
-<br />
(1,678)<br />
(80,184)<br />
102,361,881<br />
720,004<br />
Private-label commercial 338,951 - (7,384) 331,567<br />
Total debt securities<br />
173,779,684 4,296,404 (2,033,832) 176,042,256<br />
Marketable equity securities 568,894 2,261 - 571,155<br />
Total securities available for sale $ 174,348,578 $ 4,298,665 $ (2,033,832) $ 176,613,411<br />
73
NOTES TO CONSOLIDATED FINANCIAL STATEMENTS<br />
NOTE 4.<br />
INVESTMENT SECURITIES (Continued)<br />
The amortized cost and fair value of investment securities as of December 31, 2009, by contractual maturity, are<br />
shown below. Maturities may differ from contractual maturities in mortgage-backed securities because the mortgages<br />
underlying the securities may be called or repaid without any penalties. Equity securities have a perpetual life and no<br />
stated maturity; therefore, these securities and the mortgage-backed securities are shown separately from the other debt<br />
securities in the following maturity summary.<br />
Amortized<br />
Cost<br />
Fair<br />
Value<br />
Due in one year or less<br />
$ - $ -<br />
Due from one to five years 1,000,000 856,840<br />
Due from five to ten years<br />
15,748,842 15,850,669<br />
Due after ten years<br />
27,729,131 27,310,959<br />
Mortgage-backed securities 66,368,252 67,522,645<br />
$ 110,846,225<br />
$ 111,541,113<br />
Securities with a carrying value of $91,299,710 and $109,607,145 at December 31, 2009 and 2008, respectively, were<br />
pledged to secure public deposits, certain borrowing arrangements and for other purposes.<br />
Gains and losses on sales and calls of investment securities for the years ended December 31, 2009, 2008 and 2007 consist<br />
of the following:<br />
2009 2008<br />
2007<br />
Gross gains on securities transactions $ 2,826,772 $ 338,853 $ 434,217<br />
Gross losses on securities transactions (770,987) (113,685) (121,229)<br />
Net realized gain on<br />
securities transactions $ 2,055,785 $ 225,168 $ 312,988<br />
74
NOTES TO CONSOLIDATED FINANCIAL STATEMENTS<br />
NOTE 4.<br />
INVESTMENT SECURITIES (Continued)<br />
The following table shows the gross unrealized losses and fair value of the entity’s investments with unrealized losses that<br />
are not deemed to be other-than-temporarily impaired, aggregated by investment category and length of time that<br />
individual securities have been in a continuous unrealized loss position at December 31, 2009 and 2008.<br />
Available for sale securities that have been in a continuous unrealized loss position are as follows:<br />
Less Than Twelve Months<br />
Over Twelve Months<br />
Gross<br />
Unrealized<br />
Losses<br />
Fair Value<br />
Gross Unrealized<br />
Losses<br />
Fair Value<br />
Total Unrealized<br />
Losses<br />
Available for Sale Securities<br />
December 31, 2009:<br />
Debt securities:<br />
U.S. Government-sponsored<br />
enterprises (GSEs)<br />
State and municipal securities<br />
$ 247,182<br />
8,504<br />
$ 16,526,513<br />
584,492<br />
$ -<br />
385,197<br />
$ -<br />
4,917,796<br />
$ 247,182<br />
393,701<br />
Corporate<br />
Mortgage-backed<br />
143,160<br />
856,840 55,332 972,500 198,492<br />
GSE residential<br />
Private-label residential<br />
Private-label commercial<br />
217,795<br />
-<br />
-<br />
15,005,641<br />
-<br />
-<br />
-<br />
5,271<br />
2,468<br />
-<br />
601,448<br />
173,981<br />
217,795<br />
5,271<br />
2,468<br />
Total securities available for sale $ 616,641 $ 32,973,486 $ 448,268 $ 6,665,725 $ 1,064,909<br />
Available for Sale Securities<br />
December 31, 2008:<br />
Debt securities:<br />
U.S. Government-sponsored<br />
enterprises (GSEs) $ 947 $ 3,019,053 $ - $ - $ 947<br />
State and municipal securities 1,298,823 18,905,887 82,959<br />
875,407 1,381,782<br />
Corporate 534,776 2,491,548 27,081 470,462 561,857<br />
Mortgage-backed<br />
GSE residential 825 1,844,464 853 886,992 1,678<br />
Private-label residential - - 80,184 720,005<br />
80,184<br />
Private-label commercial 7,384 331,567 -<br />
- 7,384<br />
Total securities available for sale $ 1,842,755 $ 26,592,519 $ 191,077 $ 2,952,866 $ 2,033,832<br />
Management evaluates securities for other-than-temporary impairment at least on an annual basis, and more frequently<br />
when economic or market conditions warrant such evaluation.<br />
At December 31, 2009 there are two private-label mortgage-backed securities, 11 municipal securities (other) and one<br />
corporate debt security in the investment portfolio that have been in a continuous unrealized loss position for twelve<br />
months or longer.<br />
Private-label mortgage-backed securities. The unrealized losses for twelve months or longer associated with two private<br />
residential mortgage-backed securities are primarily driven by higher projected collateral losses, wider credit spreads, and<br />
changes in interest rates. We assess for credit impairment using a cash flow model. Based upon our assessment of the<br />
expected credit losses of the security given the performance of the underlying collateral compared to our credit<br />
enhancement, we expect to recover the entire amortized cost basis of these securities.<br />
75
NOTES TO CONSOLIDATED FINANCIAL STATEMENTS<br />
NOTE 4.<br />
INVESTMENT SECURITIES (Continued)<br />
Corporate bonds. The unrealized losses for twelve months or longer on investment in one corporate bond relates to an<br />
investment in a company within the financial services sector. The unrealized losses are primarily caused by recent<br />
decreases in profitability and profit forecasts by industry analysts. The contractual terms of those investments do not<br />
permit the Company to settle the security at a price less than the par value of the investments. The Company currently<br />
does not believe it is probable that it will be unable to collect all amounts due according to the contractual terms of the<br />
investments. Because the Company does not intend to sell the investment and it is not more likely than not that the<br />
Company will be required to sell the investments before recovery of its par value, which may be maturity, it does not<br />
consider these investments to be other-than-temporarily impaired at December 31, 2009.<br />
State and municipal securities. The unrealized losses for twelve months or longer relates to 11 municipal securities. The<br />
unrealized losses are primarily caused by securities no longer being insured and/or ratings being withdrawn given the<br />
current economic environment. Because the Company does not intend to sell the investments and it is not more likely than<br />
not that the Company will be required to sell the investments before recovery of their amortized cost bases, which may be<br />
maturity, the Company does not consider those investments to be other-than-temporarily impaired at December 31, 2009.<br />
NOTE 5.<br />
RESTRICTED EQUITY SECURITIES<br />
Restricted equity securities consists of the following:<br />
December 31,<br />
2009 2008<br />
Federal Reserve Bank stock $ 2,182,500 $ 1,800,000<br />
Federal Home Loan Bank stock 7,277,100 7,099,100<br />
Silverton <strong>Financial</strong> Services, Inc. - 260,804<br />
$ 9,459,600 $ 9,159,904<br />
NOTE 6.<br />
LOANS AND ALLOWANCE FOR LOAN LOSSES<br />
The composition of the loan portfolio as of December 31, 2009 and 2008 follows.<br />
2009 2008<br />
Commercial and financial $ 84,770,651 $ 87,529,469<br />
Agricultural 40,214,621 48,646,715<br />
Real estate – construction 204,662,668 315,786,248<br />
Real estate – commercial 275,927,260 276,644,846<br />
Real estate – residential 174,879,077 196,306,153<br />
Installment loans to individuals and others<br />
24,854,249 31,616,134<br />
Overdrafts 94,835 467,958<br />
805,403,361 956,997,523<br />
Deferred loan fees and unearned interest, net (89,674) (310,132)<br />
805,313,687 956,687,391<br />
Allowance for loan losses (29,314,145) (19,373,625)<br />
$ 775,999,542 $ 937,313,766<br />
76
NOTES TO CONSOLIDATED FINANCIAL STATEMENTS<br />
NOTE 6.<br />
LOANS AND ALLOWANCE FOR LOAN LOSSES (Continued)<br />
Changes in the allowance for loan losses for the years ended December 31, 2009, 2008 and 2007 follows.<br />
2009 2008<br />
2007<br />
Balance, beginning of year $ 19,373,625 $ 12,905,938 $ 11,006,097<br />
Provision charged to operations<br />
51,187,987 18,050,000 2,400,000<br />
Loans charged-off (41,748,277) (12,127,445) (868,201)<br />
Recoveries 500,810 545,132 368,042<br />
Balance, end of year $ 29,314,145 $ 19,373,625 $ 12,905,938<br />
A summary of information pertaining to impaired loans as of December 31, 2009 and 2008 follows.<br />
2009 2008<br />
Loans accounted for on a nonaccrual basis $ 92,271,684 $ 54,902,747<br />
Troubled debt restructurings not <strong>inc</strong>luded above 881,189 311,051<br />
Loans past due 90 days or more and still accruing 14,987 206,442<br />
Total impaired loans<br />
$ 93,167,860 $ 55,420,240<br />
Valuation allowance related to impaired loans $ 12,444,230 $ 4,075,879<br />
Additional information on impaired loans for the years ended December 31, 2009, 2008 and 2007 follows.<br />
2009 2008 2007<br />
Average recorded investment in impaired loans $ 68,180,885 $ 38,784,878 $ 4,883,934<br />
Approximate amount of interest <strong>inc</strong>ome that would have<br />
been recorded if the impaired loans had remained current<br />
and on an accrual status $ 5,950,857 $ 3,592,700 $ 753,000<br />
Interest <strong>inc</strong>ome recognized on a cash basis on<br />
impaired loans $ 104,166 $ 64,785 $ 33,658<br />
In the ordinary course of business, the Company has granted loans to certain related parties, <strong>inc</strong>luding executive officers,<br />
directors and their affiliates. The interest rates on these loans were substantially the same as rates prevailing at the time of<br />
the transaction and repayment terms are customary for the type of loan. Changes in related party loans for the year ended<br />
December 31, 2009 follows.<br />
Balance, beginning of year $ 37,948,775<br />
Advances 21,348,906<br />
Repayments (30,557,864)<br />
Transactions due to changes in related parties (13,116,069)<br />
Balance, end of year $ 15,623,748<br />
77
NOTES TO CONSOLIDATED FINANCIAL STATEMENTS<br />
NOTE 7.<br />
PREMISES AND EQUIPMENT<br />
Premises and equipment as of December 31, 2009 and 2008 follows.<br />
2009 2008<br />
Land $ 6,201,540 $ 6,201,540<br />
Buildings and improvements 18,008,918 18,075,242<br />
Furniture, fixtures and equipment 10,525,694<br />
34,736,152<br />
10,656,603<br />
34,933,385<br />
Less accumulated depreciation (16,126,680) (14,949,097)<br />
$ 18,609,472 $ 19,984,288<br />
Depreciation expense amounted to $1,435,557, $1,419,799 and $1,701,263, for the years ended December 31, 2009, 2008<br />
and 2007, respectively.<br />
The Company leases office space at six locations. One location is leased on a month-to-month basis. The other locations<br />
are under agreements with minimum contractual obligations as of December 31, 2009 follows.<br />
Year<br />
Amount<br />
2010 345,319<br />
2011 324,831<br />
2012 196,408<br />
2013 182,608<br />
2014 48,000<br />
Later -<br />
$ 1,097,166<br />
The Company also has commitments on various short-term operating leases for equipment. Total lease expense amounted<br />
to $665,340, $756,038 and $611,836 for the years ended December 31, 2009, 2008 and 2007, respectively.<br />
78
NOTES TO CONSOLIDATED FINANCIAL STATEMENTS<br />
NOTE 8.<br />
DEPOSITS<br />
A summary of interest-bearing deposits as of December 31, 2009 and 2008 follows.<br />
2009 2008<br />
Interest-bearing demand $ 214,580,696 $ 219,167,480<br />
Savings 35,651,658 32,954,566<br />
Time, $100,000 and over 379,134,206 361,431,146<br />
Other time 315,390,411 419,035,729<br />
$ 944,756,971 $ 1,032,588,921<br />
The Company had $133,012,000 and $206,603,000 in brokered deposits <strong>inc</strong>luded in time deposits $100,000 and over as of<br />
December 31, 2009 and 2008, respectively. At December 31, 2009 and 2008, the Company had $28,354,787 and<br />
$13,653,243 of retail deposits placed in the CDARS program <strong>inc</strong>luded in the time deposits $100,000 and over,<br />
respectively. At December 31, 2009 and 2008, the Company had $1,177,074 and $33,037,038 of retail deposits placed in<br />
the CDARS program <strong>inc</strong>luded in the other time category, respectively.<br />
Interest expense on deposits for the years ended December 31, 2009, 2008 and 2007 follows.<br />
2009 2008 2007<br />
Interest-bearing demand $ 1,190,085 $ 5,238,099 $ 11,049,142<br />
Savings 89,241<br />
203,947 563,840<br />
Time, $100,000 and over 12,705,483 11,857,118 10,064,962<br />
Other time 12,308,843 14,015,258 15,209,655<br />
$ 26,293,652 $ 31,314,422 $ 36,887,599<br />
The scheduled maturities of time deposits at December 31, 2009 follow.<br />
Year<br />
Amount<br />
2010<br />
$ 458,611,806<br />
2011 134,379,764<br />
2012 57,338,372<br />
2013 30,898,111<br />
2014 13,229,839<br />
Later 66,725<br />
$ 694,524,617<br />
NOTE 9.<br />
FEDERAL FUNDS PURCHASED AND SECURITIES SOLD UNDER AGREEMENTS TO<br />
REPURCHASE<br />
Securities sold under repurchase agreements, which are secured borrowings, generally mature within one day to 90 days<br />
from the transaction date. Securities sold under repurchase agreements are reflected at the amount of cash received in<br />
connection with the transactions. The Company may be required to provide additional collateral based on the fair value of<br />
the underlying securities. The Company monitors the fair value of the underlying securities on a weekly basis. Securities<br />
sold under repurchase agreements at December 31, 2009 and 2008 were $10,011,024 and $8,954,253, respectively.<br />
79
NOTES TO CONSOLIDATED FINANCIAL STATEMENTS<br />
NOTE 10.<br />
ADVANCES FROM THE FEDERAL HOME LOAN BANK<br />
Listed below is a summary of the advances from the Federal Home Loan Bank of Atlanta (the “FHLB”) as of December<br />
31, 2009 and 2008.<br />
2009 2008<br />
Adjustable rate advances due at various dates through<br />
December 18, 2014 with a weighted-average rate of<br />
3.06% at December 31, 2009 $ 15,000,000 $ 3,941,580<br />
Fixed rate advances due at various dates through<br />
February 26, 2024 with a weighted-average rate of 4.23%<br />
at December 31, 2009 24,139,501 39,762,337<br />
Convertible advances due at various dates through<br />
May 19, 2015 with a weighted-average rate of 3.97% at<br />
December 31, 2009 51,000,000 66,000,000<br />
$ 90,139,501 $ 109,703,917<br />
The Bank has provided a blanket lien on its portfolio of qualifying residential and commercial real estate mortgage loans<br />
and has pledged an additional $51,324,485 in investment securities as collateral on the advances from the FHLB.<br />
Contractual maturities of the advances from the FHLB at December 31, 2009 follow. Actual maturities may differ from<br />
contractual maturities because of the conversion option of the convertible advances.<br />
Year<br />
Amount<br />
2010 $ 5,657,456<br />
2011 15,263,803<br />
2012 25,481,174<br />
2013 13,704,982<br />
2014 10,665,812<br />
Later 19,366,274<br />
$ 90,139,501<br />
80
NOTES TO CONSOLIDATED FINANCIAL STATEMENTS<br />
NOTE 11.<br />
GUARANTEED PREFERRED BENEFICIAL INTERESTS IN DEBENTURES<br />
On October 5, 2006, PAB Bankshares Capital Trust II (“PAB Trust II”) issued $10 million of Floating Rate Capital<br />
Securities (“trust preferred securities”). The Company formed PAB Trust II, a statutory business trust created under the<br />
laws of the State of Delaware, for the sole purpose of issuing the trust preferred securities and investing the proceeds in<br />
Floating Rate Junior Subordinated Debentures (the “Debentures”) issued by the Company. The interest rates on both the<br />
trust preferred securities and the Debentures are reset quarterly at the three-month London Interbank Offered Rate<br />
(“LIBOR”) plus 1.63% (currently 1.88%). The Company entered into agreements which, taken collectively, fully,<br />
irrevocably and unconditionally guarantee, on a subordinated basis, all of PAB Trust II’s obligations under the trust<br />
preferred securities. PAB Trust II’s sole asset is the Debentures issued by the Company. The Debentures will mature on<br />
December 31, 2036, but are callable at par by the Company in whole or in part anytime after December 31, 2011. The<br />
proceeds from the issuance of these trust preferred securities qualify as Tier 1 capital under the risk-based capital<br />
guidelines established by the Federal Reserve.<br />
As discussed in Note 1, the Company adopted FASB Interpretation No. 46R (Revised December 2003), Consolidation of<br />
Variable Interest Entities, during the first quarter of 2004. This interpretation addresses consolidation by business entities<br />
of variable interest entities and when such entities are subject to consolidation under the provisions of this interpretation.<br />
The Company determined that the revised provisions required deconsolidation of PAB Trust II. The Company recorded<br />
$310,000 in other assets in the consolidated balance sheet at December 31, 2009 and 2008, respectively, for common<br />
capital securities issued by the issuer trusts.<br />
On September 4, 2009, the Company began exercising its right to defer quarterly interest payments for its Debentures. We<br />
have provided notice of our deferral of the two interest payments from September 30, 2009 to December 31, 2009. We<br />
expect to defer the interest payments into the foreseeable future. Under the terms of the agreements, the Company can<br />
defer the payment of interest for a period of up to twenty (20) consecutive quarterly interest payment periods. During this<br />
period of deferral, the Company is precluded from repurchasing shares of common stock and from paying dividends on<br />
outstanding common stock. We will continue to accrue for the interest payable after the deferral period in our<br />
consolidated statement of <strong>inc</strong>ome(loss).<br />
81
NOTES TO CONSOLIDATED FINANCIAL STATEMENTS<br />
NOTE 12.<br />
INCOME TAXES<br />
The components of <strong>inc</strong>ome tax expense (benefit) for the years ended December 31, 2009, 2008 and 2007<br />
follow.<br />
2009 2008 2007<br />
Current $ (15,591,672) $ (882,879) $ 6,325,504<br />
Deferred tax valuation allowance (3,287,991) (2,671,456) (644,268)<br />
Change in valuation allowance 11,135,938 - -<br />
$ (7,743,725) $ (3,554,335) $ 5,681,236<br />
The Company's <strong>inc</strong>ome tax expense (benefit) differs from the amounts computed by applying the federal <strong>inc</strong>ome tax<br />
statutory rates to <strong>inc</strong>ome before <strong>inc</strong>ome taxes. A reconciliation of the differences for the years ended December 31, 2009,<br />
2008 and 2007 follows.<br />
2009 2008 2007<br />
Tax (benefit) at statutory rate $ (20,031,347) $ (3,218,304) $ 5,763,433<br />
Increase (decrease) resulting from:<br />
Deferred tax valuation allowance 11,208,869 - -<br />
Goodwill impairment 2,034,765 - -<br />
Tax exempt <strong>inc</strong>ome, net (402,519) (543,628) (512,746)<br />
Other items, net (553,493) 207,597 430,549<br />
Income tax expense (benefit) $ (7,743,725) $ (3,554,335) $ 5,681,236<br />
The components of deferred <strong>inc</strong>ome taxes at December 31, 2009 and 2008 follow.<br />
2009 2008<br />
Deferred tax assets (liabilities):<br />
Accrued severance payable $ 12,155 $ 36,425<br />
Allowance for loan losses 9,966,809 6,587,033<br />
Deferred compensation 662,306 609,929<br />
Deferred loan origination cost (454,593) (505,136)<br />
Deferred loan origination fees 483,024 599,691<br />
Other real estate owned<br />
Impaired loan interest<br />
582,680<br />
317,132<br />
262,062<br />
454,508<br />
Accrued lease payable<br />
Excess charitable contributions<br />
Other assets<br />
47,379<br />
54,571<br />
7,977<br />
255,239<br />
29,558<br />
9,657<br />
Premises and equipment<br />
(712,558) (602,306)<br />
Nonqualified stock options 169,056 111,288<br />
State NOL carryforward 340,891 267,960<br />
Deferred tax valuation allowance (11,476,829) (267,960)<br />
Unrealized gain on cash flow<br />
hedge derivative instrument (137,777) (1,131,607)<br />
Unrealized gain on securities<br />
available for sale<br />
(236,262) (770,210)<br />
Net deferred tax assets<br />
(liabilities) $ (374,039) $ 5,946,131<br />
82
NOTES TO CONSOLIDATED FINANCIAL STATEMENTS<br />
NOTE 12.<br />
INCOME TAXES (Continued)<br />
The Company has invested in affordable housing projects to receive State of Georgia low <strong>inc</strong>ome housing tax credits to<br />
help reduce state <strong>inc</strong>ome tax expense. The investment in these projects totaled $1,973,283 and $2,302,919 at December<br />
31, 2009 and 2008, respectively. The projected availability of the unused credits follows:<br />
Year of projected availability:<br />
Amount<br />
2010 $ 797,521<br />
2011 797,521<br />
2012 797,521<br />
2013 797,521<br />
2014 769,318<br />
Later 823,629<br />
Total $ 4,783,031<br />
NOTE 13.<br />
EMPLOYEE BENEFIT PLANS<br />
The Company provides an employee 401(k) plan for qualified employees. The 401(k) plan allows participants to defer a<br />
portion of their compensation and provides that the Company may match a portion of the participants’ deferred<br />
compensation. The plan also provides for non-elective and discretionary profit sharing contributions to be made by the<br />
Company at the sole discretion of the Board of Directors. The Company did not accrue a discretionary profit sharing<br />
contribution for 2009 and 2008. Approximately 3.0% of the participants’ eligible compensation was accrued as the<br />
discretionary profit sharing contributions for 2007. The employer contributions are on a five-year vesting schedule. All<br />
full-time and part-time employees are eligible to participate in the plan provided they have met the eligibility requirements.<br />
Generally, a participant must have completed one month of employment to become eligible, with employer contributions<br />
beginning after six months of employment. Aggregate expense under the plan charged to salaries and employee benefits<br />
expense during 2009, 2008 and 2007 amounted to $268,211, $440,288 and $862,419, respectively.<br />
NOTE 14.<br />
DEFERRED COMPENSATION AND RETIREMENT PLANS<br />
Under separate deferred compensation agreements executed in prior years with certain officers, deferred compensation is<br />
to be payable over a fifteen-year period beginning at the earlier of age 65, death, or disability of each officer. Annual<br />
accruals were made based on actuarial assumptions for the present value of the future obligations. In 2001, the Board of<br />
Directors elected to terminate these plans. At that time, the Company recorded an expense and an accrual of<br />
approximately $898,000 for the net present value of the liability covering two executive officers that were retiring at the<br />
end of 2001. The total accrued liability for these deferred compensation plans was $1,947,960 and $1,793,908 at<br />
December 31, 2009 and 2008, respectively. On an annual basis, the Company re-evaluates the net present value of these<br />
future obligations and records an additional expense (benefit) to account for the accrual. Changes in interest rates affect<br />
the computation of net present value of these obligations. The expense (benefit) for these deferred compensation plans<br />
charged to salaries and employee benefits expense were $319,139, ($70,817) and $99,457 during 2009, 2008 and 2007,<br />
respectively.<br />
83
NOTES TO CONSOLIDATED FINANCIAL STATEMENTS<br />
NOTE 15.<br />
OTHER INCOME AND EXPENSES<br />
Other fee <strong>inc</strong>ome for the years ended December 31, 2009, 2008 and 2007 follows.<br />
2009 2008 2007<br />
Mortgage origination fees $ 781,338 $ 709,489 $ 404,749<br />
Brokerage commissions and fees 11,085 17,199 13,487<br />
ATM and debit card fee <strong>inc</strong>ome 843,620 737,368 642,685<br />
Insurance premiums 11,622 28,405 29,215<br />
Other fee <strong>inc</strong>ome 302,741 179,227 192,031<br />
Total other fee <strong>inc</strong>ome $ 1,950,406 $ 1,671,688 $ 1,282,167<br />
Other noninterest <strong>inc</strong>ome for the years ended December 31, 2009, 2008 and 2007 follows.<br />
2009 2008<br />
2007<br />
Earnings on bank-owned life insurance<br />
$ 572,082 $ 421,264 $ 406,419<br />
Check order revenue 181,739 200,538 217,778<br />
Other noninterest <strong>inc</strong>ome 260,267 54,567 74,512<br />
Total other noninterest <strong>inc</strong>ome $ 1,014,088 $ 676,369 $ 698,709<br />
Other noninterest expense for the years ended December 31, 2009, 2008 and 2007 follows.<br />
2009 2008<br />
2007<br />
Advertising and business development $ 396,360 $ 581,694 $ 625,765<br />
Supplies and printing 359,699 390,273 463,113<br />
Telephone and internet charges 651,284 777,049 634,445<br />
Postage and courier 545,284 572,640 644,774<br />
Legal and accounting fees 999,599 463,040 559,417<br />
Director fees and expenses 547,078 625,236 398,078<br />
Service charges and fees 436,271 594,930 621,923<br />
Other noninterest expenses 2,879,718 1,872,168 2,100,542<br />
Total other noninterest expense $ 6,815,293 $ 5,877,030 $ 6,048,057<br />
84
NOTES TO CONSOLIDATED FINANCIAL STATEMENTS<br />
NOTE 16.<br />
EARNINGS PER COMMON SHARE<br />
The components used to calculate basic and diluted earnings (loss) per share for the years ended December 31, 2009, 2008<br />
and 2007 follows.<br />
2009 2008 2007<br />
Basic earnings (loss) per share:<br />
Net <strong>inc</strong>ome (loss) $ (51,172,000) $ (5,911,265) $ 10,785,715<br />
Weighted average common shares outstanding 10,708,466 9,335,376 9,602,535<br />
Earnings (loss) per common share $ (4.78) $ (0.63) $ 1.12<br />
Diluted earnings (loss) per share:<br />
Net <strong>inc</strong>ome (loss) $ (51,172,000) $ (5,911,265) $ 10,785,715<br />
Weighted average common shares outstanding 10,708,466 9,335,376 9,602,535<br />
Effect of dilutive stock options - - 141,528<br />
Weighted average diluted common<br />
shares outstanding 10,708,466 9,335,376 9,744,063<br />
Earnings (loss) per common share $ (4.78) $ (0.63) $ 1.11<br />
For the years ended December 31, 2009, 2008 and 2007, warrants and options to purchase 1,824,176, 621,961 and<br />
184,404, respectively, were outstanding but not <strong>inc</strong>luded in the computation of earnings per share because they were antidilutive.<br />
NOTE 17.<br />
EMPLOYEE AND DIRECTOR STOCK PURCHASE PROGRAM<br />
On July 1, 2002, the Board of Directors established an Employee and Director Stock Purchase Program to enable the<br />
Company and its participating subsidiaries to provide to their respective employees and directors a convenient means of<br />
purchasing for long term investment, and not for short term speculative gain, common stock of the Company and thereby<br />
promote interest in the Company’s continuing success, growth and development. The program allows for an employee or<br />
director to purchase up to a maximum of $2,000 a year of the Company’s stock with the Company matching 50% of the<br />
participant’s purchase. In order to be eligible, an employee must be full-time and have worked a full month. During the<br />
years ended December 31, 2009, 2008 and 2007, the Company recorded $101,963, $134,671 and $144,329, respectively,<br />
of expense associated with this program. The number of shares in the program at December 31, 2009 and 2008 was<br />
214,151 and 134,810, respectively.<br />
NOTE 18.<br />
DIVIDEND REINVESTMENT AND COMMON STOCK PURCHASE PLAN<br />
In 1993, the Board of Directors approved a dividend reinvestment and common stock purchase plan. The Board of<br />
Directors amended the plan in 2007. The plan is designed to provide stockholders with a simple and convenient means to<br />
reinvest cash dividends and make additional cash purchases of the Company’s common stock. The Company acquires<br />
shares in the open market as needed to fill orders for dividend reinvestment and stock purchases under the plan rather than<br />
issuing additional shares of common stock.<br />
85
NOTES TO CONSOLIDATED FINANCIAL STATEMENTS<br />
NOTE 19.<br />
STOCK PLANS AND STOCK-BASED COMPENSATION<br />
The Company has two fixed stock option plans under which it has granted options to its employees and directors to<br />
purchase common stock at the fair market price on the date of grant. Both plans provide for “<strong>inc</strong>entive stock options” and<br />
“non-qualified stock options”. The <strong>inc</strong>entive stock options are intended to qualify under Section 422 of the Internal<br />
Revenue Code for favorable tax treatment. It is the Company’s policy to issue new shares for stock option exercises.<br />
Under the 1994 Employee Stock Option Plan, the Board of Directors could grant up to 400,000 stock options to employees<br />
of the Company as part of an <strong>inc</strong>entive plan to attract and retain key personnel in the Company. The 1994 Employee<br />
Stock Option Plan expired in 2004. At December 31, 2009, there were 42,483 options outstanding that were granted under<br />
the 1994 Employee Stock Option Plan.<br />
Under the 1999 Stock Option Plan, the Board of Directors can grant up to 600,000 stock options to directors, employees,<br />
consultants and advisors of the Company. On February 28, 2006, the Company’s Board of Directors adopted an<br />
amendment to the 1999 Stock Option Plan to <strong>inc</strong>rease the maximum aggregate number of shares of common stock for<br />
which options may be granted from 600,000 shares to 1,400,000 shares and to extend the term of the Plan for ten years<br />
from the date of the adoption of these amendments. This amendment was subsequently approved at the Company’s annual<br />
meeting of shareholders on May 23, 2006. At December 31, 2009, there were 403,283 stock options available for grant<br />
and there were 870,080 options outstanding that were granted under the 1999 Stock Option Plan.<br />
At December 31, 2009, there was approximately $907,000 of unrecognized compensation cost related to stock-based<br />
payments, which is expected to be recognized over a weighted-average period of 2.04 years.<br />
86
NOTES TO CONSOLIDATED FINANCIAL STATEMENTS<br />
NOTE 19.<br />
STOCK PLANS AND STOCK-BASED EMPLOYEE COMPENSATION (Continued)<br />
A summary of the status of the two fixed plans at December 31, 2009, 2008 and 2007 and changes during the years ended<br />
on those dates follows.<br />
Number<br />
2009 2008 2007<br />
Weighted-<br />
Average<br />
Exercise<br />
Price<br />
Number<br />
Weighted-<br />
Average<br />
Exercise<br />
Price<br />
Number<br />
Weighted-<br />
Average<br />
Exercise<br />
Price<br />
Under option, beginning<br />
of year 699,218 $ 13.83 708,641 $ 14.20 672,474 $ 13.58<br />
Granted<br />
Exercised<br />
419,300<br />
-<br />
2.81<br />
-<br />
61,381<br />
(3,586)<br />
11.55<br />
10.03<br />
110,670<br />
(63,997)<br />
16.17<br />
10.80<br />
Forfeited (41,660) 14.78 (56,304) 15.91 (10,506) 16.22<br />
Expired (164,295) 14.99 (10,914) 15.37 - -<br />
Under option, end of year 912,563 $ 8.52 699,218 $ 13.83 708,641<br />
$ 14.20<br />
Exercisable at end of year 387,395 $ 12.51 482,491 $ 12.95 436,097 $ 12.51<br />
Weighted-average fair<br />
value<br />
per option of options<br />
granted during year $ 1.69 $ 2.46 $ 4.55<br />
Total grant-date fair value<br />
of options vested<br />
during<br />
the year $ 284,000 $ 300,000 $ 433,000<br />
Total intrinsic value of<br />
options exercised during<br />
the year $ - $ 8,500 $ 468,000<br />
The following table presents information on stock options outstanding for the periods shown, less estimated forfeitures.<br />
Year ended<br />
December 31, 2009<br />
Year ended<br />
December 31, 2008<br />
Stock options vested and expected to vest:<br />
Number 885,321 673,120<br />
Weighted average exercise price $ 8.58 $ 13.76<br />
Aggregate intrinsic value $ 28,000 $ -<br />
Weighted average contractual term of options 5.66 years 4.69 years<br />
Stock options vested and currently exercisable:<br />
Number 387,395<br />
482,491<br />
Weighted average exercise price $ 12.51<br />
$ 12.95<br />
Aggregate intrinsic value $ - $ -<br />
Weighted average contractual term of options 3.62 years 3.36 years<br />
87
NOTES TO CONSOLIDATED FINANCIAL STATEMENTS<br />
NOTE 19.<br />
STOCK PLANS AND STOCK-BASED EMPLOYEE COMPENSATION (Continued)<br />
A further summary of the options outstanding at December 31, 2009 follows.<br />
Options Outstanding<br />
Options Exercisable<br />
Range of<br />
Exercise<br />
Prices Number<br />
Weighted-<br />
Average<br />
Contractual<br />
Life in Years<br />
Weighted-<br />
Average<br />
Exercise<br />
Price<br />
Number<br />
Weighted-<br />
Average<br />
Exercise<br />
Price<br />
$ .00 - 2.26 128,100 6.87 $ 1.98 - $ -<br />
2.27 - 4.53 265,200 7.23 3.00 - -<br />
4.54 - 6.80 24,000 9.00 4.90 4,000<br />
4.90<br />
6.81 - 9.06 72,823 3.21 7.76 67,687 7.70<br />
9.07 - 11.33 115,575 1.52 9.92 115,575 9.92<br />
11.34 - 13.60 137,037 5.35 13.04 82,835 13.02<br />
13.61 - 15.87 56,100 4.81 14.22 48,144 14.29<br />
15.88 - 18.13 1,529 5.93 17.51 1,223 17.51<br />
18.14 - 20.40 26,520 6.01 18.14 19,176 18.14<br />
20.41 - 22.67<br />
85,679 6.99 21.01 48,755 20.93<br />
912,563 5.69 $ 8.52 387,395 $ 12.51<br />
The fair value of each option grant is estimated on the date of grant using the Black-Scholes option-pricing model with<br />
the assumptions listed in the table below. Expected volatilities are based on historical volatility of the Company’s<br />
stock. Expected dividends are based on dividend trends and the market price of the Company’s stock price at grant.<br />
Historical data is used to estimate option exercises and employee terminations within the valuation model. The riskfree<br />
rate for periods within the contractual life of the option is based on the U.S. Treasury yield curve in effect at the<br />
time of grant.<br />
2009 2008 2007<br />
Risk-free interest rate 2.02% - 2.98% 2.77% - 4.03% 4.39% - 4.68%<br />
Expected life of the options<br />
7 - 10 years 7 - 10 years 7 - 10 years<br />
Expected dividends (as a percent<br />
of the fair value of the stock) 0.00% 0.00% - 4.66% 2.63% - 3.50%<br />
Weighted average expected dividends (as a<br />
percent of the fair value of the stock) 0.00% 4.12%<br />
3.20%<br />
Expected volatility 34.02% - 62.18% 25.83% - 32.53% 26.62% - 31.62%<br />
Weighted-average expected volatility<br />
54.12% 28.96% 28.23%<br />
NOTE 20.<br />
STOCK WARRANTS<br />
On September 9, 2009, the Company announced that it completed a private placement of approximately $13,412,000 of<br />
additional capital that will be used to support the operations of the Company’s wholly owned banking subsidiary. The<br />
private placement <strong>inc</strong>luded $8,305,000 of the Company’s “Series A Contingent Convertible Perpetual Non-cumulative<br />
Preferred Stock,” no par value per share (the “Series A Preferred Stock”) that had been held in escrow s<strong>inc</strong>e March 5,<br />
2009, along with an additional $5,107,000 of the Company’s “Series B Contingent Convertible Perpetual Non-cumulative<br />
Preferred Stock,” no par value per share (the “Series B Preferred Stock”). The Series A Preferred Stock and the Series B<br />
Preferred Stock was converted into shares of the Company’s no par value per share common stock (the “Common Stock”),<br />
and the holders received warrants to purchase shares of Common Stock equal to 30% of the aggregate value of the Series<br />
B Preferred Stock. At December 31, 2009, there were 1,072,960 warrants outstanding with an exercise price of $3.75.<br />
88
NOTES TO CONSOLIDATED FINANCIAL STATEMENTS<br />
NOTE 21.<br />
STOCK REPURCHASE PLAN<br />
In May 2007, the Company’s Board of Directors renewed its annual plan to repurchase up to 300,000 shares of the<br />
Company’s common stock over the next twelve-month period. In December 2007, the Company’s Board of Directors<br />
approved an additional plan to repurchase up to 200,000 shares of the Company’s common stock over the next twelvemonth<br />
period. During 2008, the Company acquired and canceled 86,065 shares of common stock, for an annual cost of<br />
$1,162,521. The Company did not acquire and cancel any shares of common stock during 2009. No shares remained<br />
available under the plans for repurchase at December 31, 2009, as the plan expired in 2008.<br />
NOTE 22. DERIVATIVE FINANCIAL INSTRUMENTS<br />
Accounting Policy for Derivative Instruments and Hedging Activities<br />
FASB ASC 815 provides the disclosure requirements for derivatives and hedging activities with the intent to provide<br />
users of financial statements with an enhanced understanding of: (a) how and why an entity uses derivative instruments,<br />
(b) how derivative instruments and related hedged items are accounted for under FASB ASC 815, and (c) how derivative<br />
instruments and related hedged items affect an entity’s financial position, financial performance, and cash flows. FASB<br />
ASC 815 requires qualitative disclosures about objectives and strategies for using derivatives, quantitative disclosures<br />
about the fair value of and gains and losses on derivative instruments, and disclosures about credit-risk-related contingent<br />
features in derivative instruments.<br />
As required by FASB ASC 815, the Company records all derivatives on the balance sheet at fair value. The accounting<br />
for changes in the fair value of derivatives depends on the intended use of the derivative, whether the Company has elected<br />
to designate a derivative in a hedging relationship and apply hedge accounting and whether the hedging relationship has<br />
satisfied the criteria necessary to apply hedge accounting. Derivatives designated and qualifying as a hedge of the exposure<br />
to changes in the fair value of an asset, liability, or firm commitment attributable to a particular risk, such as interest rate<br />
risk, are considered fair value hedges. Derivatives designated and qualifying as a hedge of the exposure to variability in<br />
expected future cash flows, or other types of forecasted transactions, are considered cash flow hedges. Derivatives may<br />
also be designated as hedges of the foreign currency exposure of a net investment in a foreign operation. Hedge accounting<br />
generally provides for the matching of the timing of gain or loss recognition on the hedging instrument with the<br />
recognition of the changes in the fair value of the hedged asset or liability that are attributable to the hedged risk in a fair<br />
value hedge or the earnings effect of the hedged forecasted transactions in a cash flow hedge. The Company may enter<br />
into derivative contracts that are intended to economically hedge certain of its risk, even though hedge accounting does not<br />
apply or the Company elects not to apply hedge accounting under FASB ASC 815.<br />
Risk Management Objective of Using Derivatives<br />
The Company is exposed to certain risks arising from both its business operations and economic conditions. The<br />
Company pr<strong>inc</strong>ipally manages its exposures to a wide variety of business and operational risks through management of its<br />
core business activities. The Company manages economic risks, <strong>inc</strong>luding interest rate, liquidity, and credit risk, primarily<br />
by managing the amount, sources, and duration of its assets and liabilities and through the use of derivative financial<br />
instruments. Specifically, the Company enters into derivative financial instruments to manage exposures that arise from<br />
business activities that result in the receipt or payment of future known and uncertain cash amounts, the value of which are<br />
determined by interest rates. The Company’s derivative financial instruments are used to manage differences in the<br />
amount, timing, and duration of the Company’s known or expected cash receipts and its known or expected cash payments<br />
pr<strong>inc</strong>ipally related to certain variable rate loan assets and variable rate borrowings.<br />
89
NOTES TO CONSOLIDATED FINANCIAL STATEMENTS<br />
NOTE 22. DERIVATIVE FINANCIAL INSTRUMENTS (Continued)<br />
Fair Values of Derivative Instruments on the Balance Sheet<br />
The table below presents the fair value of the Company’s derivative financial instruments as well as their<br />
classification on the Balance Sheet as of December 31, 2009 and December 31, 2008.<br />
Asset Derivatives<br />
Liability Derivatives<br />
As of December 31, 2009 As of December 31, 2008 As of December 31, 2009 As of December 31, 2008<br />
Balance<br />
Sheet<br />
Location<br />
Fair<br />
Value<br />
Balance<br />
Sheet<br />
Location<br />
Fair<br />
Value<br />
Balance<br />
Sheet<br />
Location<br />
Fair<br />
Value<br />
Balance<br />
Sheet<br />
Location<br />
Fair<br />
Value<br />
Derivatives designated as hedging instruments under FASB ASC 815:<br />
Interest Rate<br />
Products<br />
Other<br />
Assets $ -<br />
Other<br />
Assets $3,992,797<br />
Other<br />
Liabilities $ -<br />
Other<br />
Liabilities<br />
$ -<br />
Total derivatives designated<br />
as hedging instruments under<br />
FASB ASC 815 $ - $3,992,797 $ -<br />
$ -<br />
Derivatives not designated as hedging instruments under FASB ASC 815:<br />
Interest Rate<br />
Products<br />
Other<br />
Assets $13,757<br />
Other<br />
Assets $ -<br />
Other<br />
Other<br />
Liabilities $ - Liabilities $ -<br />
Total derivatives not<br />
designated as hedging<br />
instruments under FASB ASC<br />
815 $13,757<br />
$ - $ - $ -<br />
Cash Flow Hedges of Interest Rate Risk<br />
The Company’s objectives in using interest rate derivatives are to add stability to interest <strong>inc</strong>ome and expense and to<br />
manage its exposure to interest rate movements. To accomplish this objective, the Company primarily uses interest rate<br />
caps as part of its interest rate risk management strategy. For hedges of the Company’s variable-rate borrowings, an<br />
interest rate cap is designated as cash flow hedge to protect the company against interest rate movements above the strike<br />
rate of the cap in exchange for an upfront premium. Historically the company also has used interest rate collars and floors<br />
as part of its interest rate risk management strategy. Interest rate collars designated as cash flow hedges involve the receipt<br />
of variable-rate amounts from a counterparty if interest rates fall below the strike rate on the purchased floor and the<br />
payment of variable-rate amounts if interest rates rise above the cap rate on the sold cap. Interest rate floors designated as<br />
cash flow hedges involve the receipt of variable-rate amounts from a counterparty if interest rates fall below the strike rate<br />
on the contract in exchange for an up front premium.<br />
90
NOTES TO CONSOLIDATED FINANCIAL STATEMENTS<br />
NOTE 22. DERIVATIVE FINANCIAL INSTRUMENTS (Continued)<br />
During 2009, such derivatives were used to hedge the variable cash outflows and inflows associated with the<br />
Company’s floating rate deposit accounts and prime based floating rate loans. The effective portion of changes in the fair<br />
value of derivatives designated and that qualify as cash flow hedges are recorded in accumulated other comprehensive<br />
<strong>inc</strong>ome and is subsequently reclassified into earnings in the period that the hedged forecasted transaction affects earnings.<br />
The ineffective portions of the change in fair value of the derivatives are recognized directly in earnings as a component of<br />
other non-interest <strong>inc</strong>ome/expense. As of December 31, 2009, the Company had one outstanding interest rate cap with a<br />
notional amount of $25 million that had failed to qualify for hedge accounting due to a mismatch between the cap notional<br />
and the aggregate pr<strong>inc</strong>ipal amount of floating rate deposit accounts. The interest rate cap failed to qualify for hedge<br />
accounting as of September 30, 2009 and accordingly all changes in value subsequent to June 30, 2009 were recognized<br />
directly in earnings. During 2009 the company also had interest rate floors and collars associated with existing pools of<br />
prime-based floating-rate loans. One of the Company’s interest rate collars failed to qualify for hedge accounting as of<br />
March 31, 2009 due to a mismatch between the collar notional and the aggregate pr<strong>inc</strong>ipal amount of the designated loan<br />
pools. All changes in value subsequent to December 31, 2009 were recognized directly in earnings through the date of<br />
termination. Refer to amounts disclosed under the sections entitled “Derivatives Not Designated as Hedging Instruments<br />
under FASB ASC 815” throughout this footnote for information regarding changes in value for derivatives which failed to<br />
qualify in hedging relationships. During the twelve months ended December 31, 2009 the Company recognized a loss of<br />
$22,076, for hedge ineffectiveness. No gain or loss was recognized for ineffectiveness during 2008.<br />
Amounts reported in accumulated other comprehensive <strong>inc</strong>ome related to derivatives will be reclassified to interest<br />
<strong>inc</strong>ome or expense as interest payments are received/made on the Company’s variable-rate assets/liabilities. During the<br />
next twelve months, the Company estimates that $390,352 will be reclassified as an <strong>inc</strong>rease to interest <strong>inc</strong>ome and<br />
$55,631 will be reclassified as an <strong>inc</strong>rease to interest expense. During the twelve months ended December 31, 2009 the<br />
Company accelerated the reclassification of amounts in other comprehensive <strong>inc</strong>ome to earnings as a result of a portion of<br />
the hedged forecasted transactions related to the Company’s interest rate cap and two interest rate collar’s becoming<br />
probable not to occur. The accelerated amount for the twelve months ended December 31, 2009 was a gain of $1,144,244.<br />
Effect of Derivative Instruments on the Income Statement<br />
The tables below present the effect of the Company’s derivative financial instruments on the Income Statement for the<br />
twelve months ended December 31, 2009 and 2008.<br />
Derivatives in<br />
FASB ASC 815<br />
Cash Flow<br />
Hedging<br />
Relationships<br />
Location of<br />
Gain or<br />
(Loss)<br />
Reclassified<br />
from Amount of Gain or (Loss)<br />
Amount of Gain or (Loss) Accumulated Reclassified from<br />
Recognized in OCI on OCI into Accumulated OCI into<br />
Derivative (Effective Portion) Income Income (Effective Portion)<br />
Twelve Months Ended (Effective Twelve Months Ended<br />
December 31,<br />
Portion)<br />
December 31,<br />
2009 2008 2009 2008<br />
Location of<br />
Gain or<br />
(Loss)<br />
Recognized<br />
in Income on<br />
Derivative<br />
(Ineffective<br />
Portion and<br />
Amount<br />
Excluded<br />
from<br />
Effectiveness<br />
Testing)<br />
Amount of Gain or (Loss)<br />
Recognized in Income on<br />
Derivative (Ineffective<br />
Portion and Amount<br />
Excluded from<br />
Effectiveness Testing)<br />
Twelve Months<br />
Ended December 31,<br />
2009<br />
2008<br />
Interest Rate<br />
Products<br />
Interest<br />
Other<br />
$ ( 57,246) $3,968,851 $ 1,604,128 $1,649,984<br />
$(22,076) $16,011<br />
Income<br />
Income<br />
Other Income $1,144,244<br />
Total $ (57,246) $3,968,851<br />
$2,748,372 $1,649,984 $(22,076) $16,011<br />
91
NOTES TO CONSOLIDATED FINANCIAL STATEMENTS<br />
NOTE 22. DERIVATIVE FINANCIAL INSTRUMENTS (Continued)<br />
Non-designated Hedges<br />
The Company does not use derivatives for trading or speculative purposes. Derivatives not designated as hedges are<br />
used to manage the Company’s exposure to interest rate movements and other identified risks but do not meet the strict<br />
hedge accounting requirements of FASB ASC 815. Changes in the fair value of derivatives not designated in hedging<br />
relationships are recorded directly in earnings. As of December 31, 2009 the Company had one outstanding derivative, a<br />
$25 million dollar notional cap, which failed to qualify for hedge accounting as of September 30, 2009 due to a mismatch<br />
between the cap notional and the money market account balances being hedged. Subsequently, the changes in fair value of<br />
the cap from June 30, 2009 through December 31, 2009 were recognized directly in earnings which resulted in a loss for<br />
the period of $15,074.<br />
During the quarter ended June 30, 2009 the Company terminated a $25 million notional collar that failed to qualify for<br />
hedge accounting; accordingly, the changes in fair value of the collar during the six months ended June 30, 2009 of<br />
$137,150 has been recognized directly in earnings as a loss.<br />
Effect of Derivative Instruments on the Income Statement (Continued)<br />
Derivatives Not Designated<br />
as Hedging Instruments<br />
Under FASB ASC 815<br />
Amount of Gain or (Loss) Recognized<br />
in Income on Derivative<br />
Location of Gain or<br />
Twelve Months Ended<br />
(Loss) Recognized in<br />
December 31,<br />
Income on Derivative 2009<br />
2008<br />
Interest Rate Products Other Income / Expense $ (152,224)<br />
$ -<br />
Total $ (152,224) $ -<br />
92
NOTES TO CONSOLIDATED FINANCIAL STATEMENTS<br />
NOTE 23.<br />
COMMITMENTS AND CONTINGENT LIABILITIES<br />
The Bank is a party to financial instruments with off-balance-sheet risk in the normal course of business to meet the<br />
financing needs of its customers. These financial instruments <strong>inc</strong>lude commitments to extend credit and standby letters of<br />
credit. Such commitments involve, to varying degrees, elements of credit risk and interest rate risk in excess of the<br />
amount recognized in the balance sheets. The majority of all commitments to extend credit and standby letters of credit<br />
are variable rate instruments.<br />
The Bank's exposure to credit loss in the event of nonperformance by the other party to the financial instrument for<br />
commitments to extend credit and standby letters of credit is represented by the contractual amount of those instruments.<br />
The Bank uses the same credit policies in making commitments as it does for on-balance-sheet instruments. A summary<br />
of the Bank's commitments as of December 31, 2009 and 2008 follows.<br />
2009<br />
2008<br />
Commitments to extend credit $ 89,064,000 $ 147,187,000<br />
Standby letters of credit $ 3,682,000 $ 4,134,000<br />
Commitments to extend credit are agreements to lend to a customer as long as there is no violation of any condition<br />
established in the contract. S<strong>inc</strong>e many of the commitments are expected to expire without being drawn upon, the total<br />
commitment amounts do not necessarily represent future cash requirements. The amount of collateral obtained, if deemed<br />
necessary by the Bank upon extension of credit, is based on management's credit evaluation of the customer.<br />
Standby letters of credit are conditional commitments issued by the Bank to guarantee the performance of a customer to a<br />
third party. Those guarantees are primarily issued to support public and private borrowing arrangements. The credit risk<br />
involved in issuing letters of credit is essentially the same as that involved in extending loans to customers. Collateral is<br />
required in instances which the Bank deems necessary.<br />
In the normal course of business, the Company is involved in various legal proceedings. In the opinion of management,<br />
any liability resulting from any such pending proceedings would not have a material adverse effect on the Company's<br />
financial statements.<br />
NOTE 24. CONCENTRATIONS OF CREDIT<br />
The Bank originates commercial, agricultural, residential and consumer loans to customers primarily in markets served by<br />
the Bank. The ability of the majority of the Bank's customers to honor their contractual obligations is dependent on the<br />
local economies in the geographical areas served by the Bank. The Bank, as a matter of policy, does not generally extend<br />
credit to any single borrower or group of related borrowers in excess of 25% of the Bank’s statutory capital net of<br />
intangible assets, or approximately $15,488,000.<br />
As of December 31, 2009, approximately 86% of the Bank's loan portfolio is concentrated in loans secured by real estate.<br />
A substantial portion of these loans are in the Bank's primary market areas. In addition, the Bank’s foreclosed assets are<br />
located in those same markets. Accordingly, the ultimate collectability of the Bank's loan portfolio and the recovery of the<br />
carrying amount of foreclosed assets are susceptible to changes in market conditions in the Bank's market areas. As of<br />
December 31, 2009, $283,074,000 or 35% of the Bank’s loan portfolio is in interest only loans. The other significant<br />
concentrations of credit by type of loan are set forth in Note 6.<br />
93
NOTES TO CONSOLIDATED FINANCIAL STATEMENTS<br />
NOTE 25. REGULATORY MATTERS<br />
The Company and the Bank are subject to various regulatory capital requirements administered by the federal banking<br />
agencies. Failure to meet minimum capital requirements can initiate certain mandatory, and possibly additional<br />
discretionary actions by regulators that, if undertaken, could have a direct material effect on the financial statements.<br />
Under capital adequacy guidelines and the regulatory framework for prompt corrective action, the Company and the Bank<br />
must meet specific capital guidelines that involve quantitative measures of the assets, liabilities, and certain off-balancesheet<br />
items as calculated under regulatory accounting practices. Capital amounts and classification are also subject to<br />
qualitative judgments by the regulators about components, risk weightings and other factors. Prompt corrective action<br />
provisions are not applicable to bank holding companies.<br />
Quantitative measures established by regulations to ensure capital adequacy require the Company and the Bank to<br />
maintain minimum amounts and ratios of total and Tier I capital to risk-weighted assets, and of Tier I capital to average<br />
assets, as such terms are defined in the regulations.<br />
As of December 31, 2009, the most recent regulatory notification categorized the Bank as “adequately capitalized” under<br />
the regulatory framework for prompt corrective action. Failure to meet capital guidelines for “adequately capitalized”<br />
status could subject the Bank to a variety of enforcement remedies from its regulators.<br />
Failure to adequately address the regulatory concerns may result in actions by the banking regulators <strong>inc</strong>luding, but not<br />
limited to, additional requirements for maintaining sufficient capital under the Written Agreement described more fully in<br />
Note 2. Ongoing failure to adequately address regulatory concerns could ultimately result in the eventual appointment of a<br />
receiver or conservator of the Bank’s assets.<br />
The Bank is subject to certain restrictions on the amount of dividends that may be declared without prior regulatory<br />
approval. At December 31, 2009, under the terms of the Written Agreement the Company and the Bank may not pay<br />
dividends without prior written consent of the regulators.<br />
94
NOTES TO CONSOLIDATED FINANCIAL STATEMENTS<br />
NOTE 25. REGULATORY MATTERS (Continued)<br />
The Company and the Bank’s actual capital amounts and ratios are presented in the following table. All dollar amounts<br />
have been rounded to the nearest thousand.<br />
As of December 31, 2009:<br />
Actual<br />
For Capital Adequacy<br />
Purposes<br />
To Be Well Capitalized Under<br />
Prompt Corrective Action<br />
Provisions<br />
Total Capital to Risk<br />
Weighted Assets:<br />
Consolidated $ 71,080,000 8.1% $ 70,357,000 8.0% - N/A -<br />
Bank $ 72,562,000 8.3% $ 70,300,000 8.0% $ 87,875,000 10.0%<br />
Tier 1 Capital to Risk<br />
Weighted Assets:<br />
Consolidated<br />
Bank<br />
$<br />
$<br />
59,861,000<br />
61,351,000<br />
6.8%<br />
7.0%<br />
$<br />
$<br />
35,179,000<br />
35,150,000<br />
4.0%<br />
4.0% $<br />
- N/A -<br />
52,725,000 6.0%<br />
Tier 1 Capital to<br />
Average Assets:<br />
Consolidated $ 59,861,000 4.7% $ 50,600,000 4.0% - N/A -<br />
Bank $ 61,351,000 4.9% $ 50,541,000 4.0% $ 63,176,000 5.0%<br />
As of December 31, 2008:<br />
Total Capital to Risk<br />
Weighted Assets:<br />
Consolidated $ 104,718,000 10.3% $ 81,103,000 8.0% - N/A -<br />
Bank $ 104,700,000 10.3% $ 81,019,000 8.0% $ 101,274,000 10.0%<br />
Tier 1 Capital to Risk<br />
Weighted Assets:<br />
Consolidated $ 91,962,000 9.0% $ 40,551,000 4.0% - N/A -<br />
Bank $ 91,957,000 9.0% $ 40,510,000 4.0% $ 60,764,000 6.0%<br />
Tier 1 Capital to<br />
Average Assets:<br />
Consolidated $ 91,962,000 7.0% $ 52,223,000 4.0% - N/A -<br />
Bank<br />
$ 91,957,000 7.0% $ 52,181,000 4.0% $ 65,226,000 5.0%<br />
95
NOTES TO CONSOLIDATED FINANCIAL STATEMENTS<br />
NOTE 26. FAIR VALUE<br />
On January 1, 2008, the Company adopted Fair Value Measurements and Disclosures. It defines fair value, establishes a<br />
framework for measuring fair value, and expands disclosures about fair value measurements. It applies to reported<br />
balances that are required or permitted to be measured at fair value under existing accounting pronouncements;<br />
accordingly, the standard does not require any new fair value measurements of reported balances.<br />
Fair Value Measurements and Disclosures emphasizes that fair value is a market-based measurement, not an entityspecific<br />
measurement. Therefore, a fair value measurement should be determined based on the assumptions that market<br />
participants would use in pricing the asset or liability. As a basis for considering market participant assumptions in fair<br />
value measurements, Fair Value Measurements and Disclosure establishes a fair value hierarchy that distinguishes<br />
between market participant assumptions based on market data obtained from sources independent of the reporting entity<br />
(observable inputs that are classified within Levels 1 and 2 of the hierarchy) and the reporting entity’s own assumptions<br />
about market participant assumptions (unobservable inputs classified within Level 3 of the hierarchy).<br />
Level 1 inputs utilize quoted prices (unadjusted) in active markets for identical assets or liabilities that the Company has<br />
the ability to access. Level 2 inputs are inputs other than quoted prices <strong>inc</strong>luded in Level 1 that are observable for the asset<br />
or liability, either directly or indirectly. Level 2 inputs may <strong>inc</strong>lude quoted prices for similar assets and liabilities in active<br />
markets, as well as inputs that are observable for the asset or liability (other than quoted prices), such as interest rates,<br />
foreign exchange rates and yield curves that are observable at commonly quoted intervals. Level 3 inputs are unobservable<br />
inputs for the asset or liability, which is typically based on an entity’s own assumptions, as there is little, if any, related<br />
market activity. In instances where the determination of the fair value measurement is based on inputs from different levels<br />
of the fair value hierarchy, the level in the fair value hierarchy within which the entire fair value measurement falls is<br />
based on the lowest level input that is significant to the fair value measurement in its entirety. The Company’s assessment<br />
of the significance of a particular input to the fair value measurement in its entirety requires judgment, and considers<br />
factors specific to the asset or liability.<br />
Assets Measured at Fair Value on a Recurring Basis<br />
The following is a description of the valuation methodologies used for instruments measured at fair value on a recurring<br />
basis and recognized in the accompanying balance sheet, as well as the general classification of such instruments pursuant<br />
to the valuation hierarchy.<br />
Where quoted market prices are available in an active market, securities are classified within Level 1 of the valuation<br />
hierarchy. Level 1 securities would <strong>inc</strong>lude highly liquid government bonds, mortgage products and exchange traded<br />
equities. If quoted market prices are not available, then fair values are estimated by using pricing models, quoted prices of<br />
securities with similar characteristics or discounted cash flows. Level 2 securities <strong>inc</strong>lude U.S. agency securities,<br />
mortgage-backed agency securities, obligations of states and political subdivisions and certain corporate, asset backed and<br />
other securities. In certain cases where Level 1 or Level 2 inputs are not available, securities are classified within Level 3<br />
of the hierarchy.<br />
As discussed in Note 21, the Company uses floor and collar derivative contracts to manage its interest rate risk. The<br />
valuation of these instruments is determined using widely accepted valuation techniques <strong>inc</strong>luding discounted cash flow<br />
analysis on the expected cash flows of each derivative. This analysis reflects the contractual terms of the derivatives,<br />
<strong>inc</strong>luding the period to maturity, and uses observable market-based inputs, <strong>inc</strong>luding interest rate curves and implied<br />
volatilities. The fair values of interest rate options are determined using the market standard methodology of discounting<br />
the future expected cash receipts that would occur if variable interest rates fell below the strike rate of the floors or rise<br />
above the strike price of the collar. The variable interest rates used in the calculation of projected receipts on the floor<br />
(cap) are based on an expectation of future interest rates derived from observable market interest rate curves and<br />
volatilities. To comply with the provisions of Fair Value Measurements and Disclosures, the Company <strong>inc</strong>orporates<br />
credit valuation adjustments to appropriately reflect both its own nonperformance risk and the respective counterparty’s<br />
nonperformance risk in the fair value measurements. In adjusting the fair value of its derivative contracts for the effect of<br />
nonperformance risk, the Company has considered the impact of netting and any applicable credit enhancements, such as<br />
collateral postings, thresholds, mutual puts, and guarantees.<br />
96
NOTES TO CONSOLIDATED FINANCIAL STATEMENTS<br />
NOTE 26. FAIR VALUE (Continued)<br />
Although the Company has determined that the majority of the inputs used to value its derivatives fall within Level 2 of<br />
the fair value hierarchy, the credit valuation adjustments associated with its derivatives utilize Level 3 inputs, such as<br />
estimates of current credit spreads to evaluate the likelihood of default by itself and its counterparties. However, as of<br />
December 31, 2009 and 2008, the Company has assessed the significance of the impact of the credit valuation adjustments<br />
on the overall valuation of its derivative positions and has determined that the credit valuation adjustments are not<br />
significant to the overall valuation of its derivatives. As a result, the Company has determined that its derivative valuations<br />
in their entirety are classified in Level 2 of the fair value hierarchy. The Company does not have any fair value<br />
measurements using significant unobservable inputs (Level 3) as of December 31, 2009 and 2008.<br />
The table below presents the Company’s assets and liabilities measured at fair value on a recurring basis as of December<br />
31, 2009 and 2008, aggregated by the level in the fair value hierarchy within which those measurements fall.<br />
Quoted Prices<br />
in Active<br />
Markets for<br />
Identical<br />
Assets<br />
Significant<br />
Other<br />
Observable<br />
Inputs<br />
Significant<br />
Unobservable<br />
Inputs<br />
As of December 31, 2009:<br />
(Level 1) (Level 2) (Level 3)<br />
Total<br />
Assets<br />
Investment securities available-for-sale $ - $ 111,541,113 $ - $ 111,541,113<br />
Restricted equity securities - 9,459,600 - 9,459,600<br />
Derivative financial instruments - 13,757 - 13,757<br />
Total fair value of assets on a<br />
recurring basis $ - $ 121,014,470 $ - $ 121,014,470<br />
Quoted Prices<br />
in Active<br />
Markets for<br />
Identical<br />
Significant<br />
Other<br />
Observable<br />
Significant<br />
Unobservable<br />
As of December 31, 2008:<br />
Assets<br />
Inputs<br />
Inputs<br />
(Level 1) (Level 2) (Level 3)<br />
Total<br />
Assets<br />
Investment securities available-for-sale $ 571,155 $ 176,042,256 $ - $ 176,613,411<br />
Restricted equity securities - 9,159,904 - 9,159,904<br />
Derivative financial instruments - 3,992,797 - 3,992,797<br />
Total fair value of assets on a<br />
recurring basis $ 571,155 $ 189,194,957 $ - $ 189,766,112<br />
Assets Measured at Fair Value on a Nonrecurring Basis<br />
The following is a description of the valuation methodologies used for instruments measured at fair value on a<br />
nonrecurring basis and recognized in the accompanying balance sheet, as well as the general classification of such<br />
instruments pursuant to the valuation hierarchy.<br />
97
NOTES TO CONSOLIDATED FINANCIAL STATEMENTS<br />
NOTE 26. FAIR VALUE (Continued)<br />
Loan impairment is reported when full payment under the loan terms is not expected. Impaired loans are carried at the<br />
present value of estimated future cash flows using the loan's existing rate, or the fair value of collateral if the loan is<br />
collateral dependent. A portion of the allowance for loan losses is allocated to impaired loans if the value of such loans is<br />
deemed to be less than the unpaid balance. If these allocations cause the allowance for loan losses to require an <strong>inc</strong>rease,<br />
such <strong>inc</strong>rease is reported as a component of the provision for loan losses. Loan losses are charged against the allowance<br />
when management believes the uncollectibility of a loan is confirmed. During 2009, certain impaired loans were partially<br />
charged-off or re-evaluated for impairment resulting in a remaining balance for these loans, net of specific allowances, of<br />
$80,723,630 as of December 31, 2009. When the fair value of the collateral is based on an observable market price or a<br />
current appraised value, the Company records the loan impairment as nonrecurring Level 2. When an appraised value is<br />
not available or management determines the fair value of the collateral is further impaired below the appraised value and<br />
there is no observable market price, the Company records the loan impairment as nonrecurring Level 3.<br />
Foreclosed assets are adjusted to fair value upon transfer of the loans to foreclosed assets. Subsequently, foreclosed assets<br />
are carried at the lower of carrying value or fair value. Fair value is based upon independent market prices, appraised<br />
values of the collateral or management’s estimation of the value of the collateral. When the fair value of the collateral is<br />
based on an observable market price or a current appraised value, the Company records the foreclosed assets as<br />
nonrecurring Level 2. When an appraised value is not available or management determines the fair value of the collateral<br />
is further impaired below the appraised value and there is no observable market price, the Company records the foreclosed<br />
asset as nonrecurring Level 3.<br />
The table below presents the Company’s assets and liabilities for which a nonrecurring change in fair value has been<br />
recorded during the year ended December 31, 2009 and 2008, aggregated by the level in the fair value hierarchy within<br />
which those measurements fall.<br />
Quoted Prices in<br />
Active Markets<br />
for Identical<br />
Assets<br />
(Level 1)<br />
Carrying value at December 31, 2009<br />
Significant Other<br />
Observable<br />
Inputs<br />
(Level 2)<br />
Significant<br />
Unobservable<br />
Inputs<br />
(Level 3)<br />
Total<br />
Total gains (losses)<br />
for the Year Ended<br />
December 31, 2009<br />
Nonperforming loans $ - $ - $ 80,723,630 $ 80,723,630 $ -<br />
Foreclosed assets - 20,313,388 71,803,735 92,117,123 (5,118,104)<br />
Total fair value of assets on a<br />
nonrecurring basis<br />
$ - $ 20,313,388 $ 152,527,365 $172,840,753 $ (5,118,104)<br />
Carrying value at December 31, 2008<br />
Quoted Prices in<br />
Active Markets<br />
for Identical<br />
Assets<br />
(Level 1)<br />
Significant<br />
Other<br />
Observable<br />
Inputs<br />
(Level 2)<br />
Significant<br />
Unobservable<br />
Inputs<br />
(Level 3)<br />
Impaired loans $ - $ - $ 56,444,926<br />
Total<br />
Total gains (losses)<br />
for the Year Ended<br />
December 31, 2008<br />
$<br />
56,444,926 $ -<br />
Foreclosed assets - 6,251,652 19,017,249 25,268,901 (1,284,931)<br />
Total fair value of assets on a<br />
$<br />
$<br />
nonrecurring basis<br />
$ - 6,251,652 $ 75,462,175 81,713,827 $ (1,284,931)<br />
98
NOTES TO CONSOLIDATED FINANCIAL STATEMENTS<br />
NOTE 26. FAIR VALUE (Continued)<br />
Fair Value of <strong>Financial</strong> Instruments<br />
The fair value of a financial instrument is the current amount that would be exchanged between willing parties, other than<br />
in a forced liquidation. Fair value is best determined based upon quoted market prices. However, in many instances, there<br />
are no quoted market prices for the Company’s various financial instruments. In cases where quoted market prices are not<br />
available, fair value is based on discounted cash flows or other valuation techniques. These techniques are significantly<br />
affected by the assumptions used, <strong>inc</strong>luding the discount rate and estimates of future cash flows. Accordingly, the fair<br />
value estimates may not be realized in an immediate settlement of the instrument.<br />
The following methods and assumptions were used by the Company in estimating the fair value of its financial<br />
instruments:<br />
Cash and Balances Due From Banks, Interest-Bearing Deposits at Other <strong>Financial</strong> Institutions and Federal Funds<br />
Sold: The carrying amount of cash and balances due from banks, interest-bearing deposits at other financial institutions<br />
and federal funds sold approximates fair value.<br />
Investment Securities and Restricted Equity Securities: The fair value of debt and marketable equity securities is<br />
based on available quoted market prices. The carrying amount of equity securities with no readily determinable fair value<br />
approximates fair value.<br />
Loans: The carrying amount of variable-rate loans that reprice frequently and have no significant change in credit risk<br />
approximates fair value. The fair value of fixed-rate loans is estimated based on discounted contractual cash flows, using<br />
interest rates currently being offered for loans with similar terms to borrowers with similar credit quality. The fair value of<br />
impaired loans is estimated based on discounted contractual cash flows or underlying collateral values, where applicable.<br />
Derivatives: The carrying amount of derivatives approximates fair value. The fair value is defined as the amount the<br />
Company would receive or pay to terminate the contracts at the reporting date.<br />
Deposits: The carrying amount of demand deposits and savings deposits approximates fair value. The fair value of time<br />
deposits is estimated based on discounted contractual cash flows using interest rates currently being offered for time<br />
deposits of similar maturities.<br />
Federal Funds Purchased, Securities Sold Under Agreements to Repurchase and Other Borrowings: The carrying<br />
amount of variable rate borrowings, federal funds purchased and securities sold under agreements to repurchase<br />
approximate fair value. The fair value of fixed rate other borrowings are estimated based on discounted contractual cash<br />
flows using the current <strong>inc</strong>remental borrowing rates for similar type borrowing arrangements. The fair value of<br />
borrowings with convertible features is based on available quoted market values.<br />
Beneficial Interests in Debentures: The carrying amount of beneficial interests in debentures approximates fair value<br />
because these are variable rate instruments.<br />
Off-Balance-Sheet Instruments: The carrying amount of commitments to extend credit and standby letters of credit<br />
approximates fair value. The carrying amount of these off-balance-sheet financial instruments is based on fees charged to<br />
enter into such agreements. The carrying amount and fair value of cash flow hedge derivative instruments is based on<br />
available quoted market prices.<br />
99
NOTES TO CONSOLIDATED FINANCIAL STATEMENTS<br />
NOTE 26. FAIR VALUE (Continued)<br />
The carrying amounts and estimated fair value of the Company's financial instruments as of December 31, 2009 and 2008<br />
are summarized below. All dollar amounts have been rounded to the nearest thousand.<br />
Carrying<br />
Amount<br />
2009 2008<br />
Fair<br />
Value<br />
Carrying<br />
Amount<br />
Fair<br />
Value<br />
Cash and balances due from banks,<br />
interest-bearing deposits with other<br />
banks and federal funds sold $ 186,478,000 $ 186,478,000 $ 137,404,000 $ 137,404,000<br />
Investment securities 111,541,000 111,541,000 176,613,000 176,613,000<br />
Restricted equity securities 9,460,000 9,460,000 9,160,000 9,160,000<br />
Loans, net 776,000,000 777,400,000 937,314,000 940,533,000<br />
Cash flow hedge derivative instrument 14,000 14,000 3,993,000 3,993,000<br />
Deposits 1,045,215,000 1,057,778,000 1,123,703,000 1,134,568,000<br />
Federal funds purchased and<br />
securities sold under agreements<br />
to repurchase 10,011,000 10,011,000 8,954,000 8,954,000<br />
Advances from the FHLB 90,140,000 88,829,000 109,704,000 106,847,000<br />
Other borrowings 20,000,000 22,489,000 - -<br />
Beneficial interest in debentures 10,310,000 10,310,000 10,310,000 10,310,000<br />
100
NOTES TO CONSOLIDATED FINANCIAL STATEMENTS<br />
NOTE 27. CONDENSED FINANCIAL INFORMATION OF PAB BANKSHARES, INC.<br />
(PARENT COMPANY ONLY)<br />
The following information presents the condensed financial statements for PAB Bankshares, Inc.<br />
PAB BANKSHARES, INC.<br />
CONDENSED BALANCE SHEETS<br />
DECEMBER 31, 2009 AND 2008<br />
2009 2008<br />
ASSETS<br />
Cash on deposit with subsidiary bank $ 203,733 $ 1,101,389<br />
Investment in subsidiary 62,387,137 101,905,733<br />
Other assets 399,250 775,580<br />
Total assets $ 62,990,120 $ 103,782,702<br />
LIABILITIES AND STOCKHOLDERS' EQUITY<br />
Guaranteed preferred beneficial interests<br />
in debentures (trust preferred securities) $ 10,310,000 $ 10,310,000<br />
Other liabilities 2,093,472 1,871,960<br />
Total liabilities 12,403,472 12,181,960<br />
Stockholders' equity 50,586,648 91,600,742<br />
Total liabilities and stockholders'<br />
equity $ 62,990,120 $ 103,782,702<br />
101
NOTES TO CONSOLIDATED FINANCIAL STATEMENTS<br />
NOTE 27. CONDENSED FINANCIAL INFORMATION OF PAB BANKSHARES, INC.<br />
(PARENT COMPANY ONLY) (Continued)<br />
PAB BANKSHARES, INC.<br />
CONDENSED STATEMENTS OF INCOME (LOSS)<br />
YEARS ENDED DECEMBER 31, 2009, 2008 AND 2007<br />
2009 2008 2007<br />
Income<br />
Dividends from subsidiaries $ - $ 2,450,000 $ 12,445,000<br />
Interest and dividends on investment securities 7,907<br />
16,234 21,862<br />
Securities transactions, net<br />
- - 371,606<br />
Other <strong>inc</strong>ome 66 - 1,040<br />
Total <strong>inc</strong>ome 7,973 2,466,234 12,839,508<br />
Expenses<br />
1,437,796 1,135,975 1,605,380<br />
Income (loss) before <strong>inc</strong>ome tax benefit<br />
and distributions in excess of earnings<br />
of subsidiaries (1,429,823) 1,330,259 11,234,128<br />
Income tax expense (benefit) 438,776 (302,644) (388,311)<br />
Income (loss) before<br />
distributions in excess of<br />
earnings of subsidiaries (1,868,599)<br />
1,632,903 11,622,439<br />
Distributions in excess of earnings of subsidiaries (49,303,401) (7,544,168) (836,724)<br />
Net <strong>inc</strong>ome (loss) $ (51,172,000) $ (5,911,265) $ 10,785,715<br />
102
NOTES TO CONSOLIDATED FINANCIAL STATEMENTS<br />
NOTE 27. CONDENSED FINANCIAL INFORMATION OF PAB BANKSHARES, INC.<br />
(PARENT COMPANY ONLY) (Continued)<br />
PAB BANKSHARES, INC.<br />
CONDENSED STATEMENTS OF CASH FLOW<br />
YEARS ENDED DECEMBER 31, 2009, 2008 AND 2007<br />
2009 2008 2007<br />
CASH FLOWS FROM OPERATING ACTIVITIES<br />
Net Income (loss) $ (51,172,000) $ (5,911,265) $ 10,785,715<br />
Adjustments to reconcile net <strong>inc</strong>ome to<br />
net cash provided by (used in) operating activities:<br />
Goodwill impairment 36,697 - -<br />
Net realized gain on securities transactions - - (371,606)<br />
Distributions in excess of earnings of subsidiaries<br />
49,303,401 7,544,168 836,724<br />
Increase (decrease) in deferred compensation<br />
accrual 154,052 (235,904) (133,699)<br />
Stock-based compensation expense 350,630 310,043 410,851<br />
Net change in other assets and liabilities 407,093 (6,266) (19,869)<br />
Net cash provided by (used in)<br />
operating activities (920,127) 1,700,776 11,508,116<br />
CASH FLOWS FROM INVESTING ACTIVITIES<br />
Investments in subsidiaries (12,750,000) - -<br />
Redemption of equity securities - - 641,551<br />
Net cash provided by (used in)<br />
investing activities (12,750,000) - 641,551<br />
CASH FLOWS FROM FINANCING ACTIVITIES<br />
Dividends paid - (3,532,990) (5,432,369)<br />
Proceeds from private placement of capital 12,772,471 - -<br />
Proceeds from the exercise of stock options - 35,980<br />
691,341<br />
Acquisition of stock under stock repurchase<br />
plans - (1,162,521) (5,894,104)<br />
Net cash provided by (used in)<br />
financing activities 12,772,471 (4,659,531) (10,635,132)<br />
Net <strong>inc</strong>rease (decrease) in cash (897,656) (2,958,755) 1,514,535<br />
Cash at beginning of period 1,101,389 4,060,144 2,545,609<br />
Cash at end of period $ 203,733 $ 1,101,389 $ 4,060,144<br />
103
NOTES TO CONSOLIDATED FINANCIAL STATEMENTS<br />
NOTE 28. SEGMENT REPORTING<br />
The Company has four reportable segments, the South Georgia market, the North Georgia market, the Florida market and<br />
the Treasury segment. The South Georgia market <strong>inc</strong>ludes the Company’s locations in Lowndes County, Cook County,<br />
Decatur County, Appling County, Bulloch County, Jeff Davis County and Grady County. The North Georgia market<br />
<strong>inc</strong>ludes the Company’s current and former locations in Henry County, Hall County, Oconee County, Clarke County,<br />
Gwinnett County, Cobb County, and Forsyth County. The Florida market <strong>inc</strong>ludes the Company’s current and former<br />
locations in Marion County, Duval County, and St. Johns County. The Treasury segment <strong>inc</strong>ludes the administrative and<br />
operational support facilities of the Company, such as accounting, internal audit, credit administration, marketing,<br />
information technology, human resources and operations. All four segments derive revenues from the delivery of financial<br />
services, to <strong>inc</strong>lude commercial loans, mortgage loans, consumer loans and deposit accounts. The South Georgia, North<br />
Georgia and Florida markets are managed as separate business units because of their different geographic areas and the<br />
Treasury segment is managed separately because it provides support services to the other Markets.<br />
The Company evaluates performance and allocates resources based on profit or loss from operations. There are no<br />
material intersegment sales or transfers. Net interest revenue is used as the basis for performance evaluation rather than its<br />
components, total interest revenue and total interest expense. The Company uses a funds transfer pricing system to credit<br />
or charge the segments with the economic value or cost of the funds the segments create or use. The accounting policies<br />
used by each reportable segment are the same as those discussed in Note 1. All costs have been allocated to the reportable<br />
segments, therefore, combined segment amounts agree to the consolidated totals.<br />
2009<br />
Net interest <strong>inc</strong>ome (expense)<br />
South Georgia North Georgia Florida<br />
(In thousands)<br />
Treasury<br />
Provision for loan losses 14,432 26,273 3,097 7,386 51,188<br />
Noninterest <strong>inc</strong>ome 3,844 (3,936) (118) 4,745 4,535<br />
Total<br />
$ 15,470 $ 11,028 $ 1,881 $ (69) $ 28,310<br />
Noninterest expense 10,905 7,264 6,274 16,130 40,573<br />
Income tax expense (benefit) (2,048) (8,991) (2,587) 5,882 (7,744)<br />
Net <strong>inc</strong>ome (loss) (3,975) (17,454) (5,021) (24,722) (51,172)<br />
Total assets 366,362 416,988 87,256 361,339 1,231,945<br />
2008<br />
Net interest <strong>inc</strong>ome $ 18,398 $ 12,288 $ 3,633 $ 447 $ 34,766<br />
Provision for loan losses<br />
Noninterest <strong>inc</strong>ome<br />
985<br />
3,981<br />
12,369<br />
(1,191)<br />
1,855<br />
(24)<br />
2,841<br />
1,637<br />
18,050<br />
4,403<br />
Noninterest expense 9,469 6,337 2,270 12,508 30,584<br />
Income tax expense (benefit) 4,055 (2,587) (175) (4,846) (3,554)<br />
Net <strong>inc</strong>ome (loss) 7,871 (5,022) (341) (8,419) (5,911)<br />
Total assets 406,708 464,949 106,029 372,417 1,350,103<br />
2007<br />
Net interest <strong>inc</strong>ome $ 20,858 $ 16,035 $ 4,052 $ 1,521 $ 42,466<br />
Provision for loan losses 269 3,145 373 (1,387) 2,400<br />
Noninterest <strong>inc</strong>ome 3,842 413 162 1,574 5,991<br />
Noninterest expense 9,154 5,692 2,021 12,723 29,590<br />
Income tax expense (benefit) 5,347 2,664 637 (2,967) 5,681<br />
Net <strong>inc</strong>ome (loss) 9,930 4,947 1,183 (5,274) 10,786<br />
Total assets 388,016 446,516 103,037 261,102 1,198,671<br />
104
NOTES TO CONSOLIDATED FINANCIAL STATEMENTS<br />
NOTE 29. SUBSEQUENT EVENTS<br />
On January 26, 2010 the shareholders approved an amendment to the Company’s Amended and Restated Articles of<br />
Incorporation to <strong>inc</strong>rease the number of authorized shares of the Company’s common stock, no par value per share, from<br />
98,500,000 shares to 300,000,000 shares and of the Company’s preferred stock, no par value per share, from 1,500,000<br />
shares to 10,000,000 shares. This amendment to the Company’s Amended and Restated Articles of Incorporated was filed<br />
on March 8, 2010.<br />
On December 31, 2009, the Company notified its officers and employees assigned to its Forsyth County, Georgia loan<br />
production office of its intention to close the loan production office and that their jobs would be eliminated. The Forsyth<br />
closing was completed on January 31, 2010. The Company also notified the officer assigned to its St. Augustine, Florida<br />
loan production office of its intention to close the loan production office and transfer the officer to another location. The<br />
St. Augustine closing was effective January 31, 2010. The Company’s Board of Directors approved these closings as part<br />
of its plan to reduce assets and strengthen the balance sheet.<br />
On February 23, 2010, the Company entered into a Purchase and Assumption Agreement whereby the Company agreed to<br />
sell branches located in Adel, Statesboro, Baxley and Hazlehurst. The closing of the transaction is subject to regulatory<br />
approval and is expected to be completed in the second quarter of 2010.<br />
In February 2010, the Company sold $14.5 million of performing loans to another financial institution. During the first<br />
two months of 2010, the Company also sold $1.4 million of nonperforming assets and received $2.1 million in payments<br />
on nonperforming loans. These reductions are part of the Company’s plan to reduce assets and strengthen the balance<br />
sheet.<br />
ITEM 9. CHANGES IN AND DISAGREEMENTS WITH ACCOUNTANTS ON ACCOUNTING<br />
AND FINANCIAL DISCLOSURES<br />
There have been no changes in or disagreements with our accountants on accounting and financial disclosure matters in the<br />
past two fiscal years.<br />
ITEM 9A. CONTROLS AND PROCEDURES<br />
Evaluation of Disclosure Controls and Procedures<br />
The term "disclosure controls and procedures" (defined in SEC Rule 13a-15(e)) refers to the controls and other procedures<br />
of a company that are designed to ensure that information required to be disclosed by a company in reports filed under the<br />
Securities Exchange Act of 1934 is recorded, processed, summarized, and reported within required time periods. A<br />
review and evaluation was performed by the Company's management, <strong>inc</strong>luding the Chief Executive Officer (“CEO”) and<br />
Chief <strong>Financial</strong> Officer (“CFO”), of the effectiveness of the Company's disclosure controls and procedures as of the end of<br />
the period covered by this Annual Report. Based on that evaluation, the CEO and CFO have concluded that the<br />
Company's disclosure controls and procedures, as designed and implemented, were effective as of the end of the period<br />
covered by this Annual Report.<br />
Management's Report on Internal Control over <strong>Financial</strong> Reporting<br />
Management's Report on Internal Control Over <strong>Financial</strong> Reporting appears on page 55. The Report of Independent<br />
Registered Accounting Firm appears on page 58. These reports are <strong>inc</strong>orporated by reference into this Item 9A.<br />
105
Changes in Internal Control over <strong>Financial</strong> Reporting<br />
The term "internal control over financial reporting" (defined in SEC Rule 13a-15(f)) refers to the process of a company<br />
that is designed to provide reasonable assurance regarding the reliability of financial reporting and the preparation of<br />
financial statements for external purposes in accordance with generally accepted accounting pr<strong>inc</strong>iples. The Company's<br />
management, with the participation of the Chief Executive Officer and Chief <strong>Financial</strong> Officer, have evaluated any<br />
changes in the Company's internal control over financial reporting that occurred during the fourth quarter ended December<br />
31, 2009, and have concluded that there was no change to the Company's internal control over financial reporting that has<br />
materially affected, or is reasonably likely to materially affect the Company's internal control over financial reporting.<br />
ITEM 9B. OTHER INFORMATION<br />
There was no information required to be disclosed in a report on Form 8-K during the fourth quarter of 2009 that has not<br />
been reported.<br />
PART III<br />
ITEM 10. DIRECTORS AND EXECUTIVE OFFICERS AND CORPORATE GOVERNANCE<br />
The members of the Company’s Board of Directors are elected by the shareholders. The directorships of the<br />
Company are divided into three classes, with the members of each class generally serving three-year terms. The<br />
Company’s Board of Directors was reduced from 14 to 13 members when Joe P. Singletary retired at the 2009 Annual<br />
Meeting. Effective March 31, 2009, Thompson Kurrie, Jr. was appointed as a director of the Company and the Bank. On<br />
April 7, 2009, M. Burke Welsh, Jr. resigned from the Board of Directors in connection with his retirement as President and<br />
Chief Executive Officer of the Company and the Bank. David K. Williams resigned from the Board of Directors of the<br />
Company and the Bank on September 29, 2009 and Walter W. Carroll, II unexpectedly passed away on December 20,<br />
2009. As a result, there are currently two vacancies on the Board of Directors. Due to the mandatory retirement age<br />
provision in the Company’s Articles of Incorporation, F. Ferrell Scruggs, Sr. will retire at the 2010 Annual Shareholder’s<br />
Meeting (the “Annual Meeting”) and therefore will not stand for re-election, which will create a third vacancy in the<br />
Board. As a result of these resignations, retirement and death, all three classes of directors are expected to have<br />
vacancies. Under the Company’s Articles of Incorporation and Bylaws, a vacancy in the Board of Directors may be filled<br />
by the affirmative vote of a majority of the remaining directors then in office. A director so chosen will hold office until<br />
the term of the class of directors which he has been chosen expires.<br />
Directors with Term Expiring at the 2010 Annual Meeting:<br />
James W. Godbee, Jr.<br />
James B. Lanier, Jr.<br />
Douglas W. McNeill<br />
F. Ferrell Scruggs, Sr.<br />
Directors with Term Expiring at the 2011 Annual Meeting:<br />
R. Bradford Burnette<br />
Michael H. Godwin<br />
Kennith D. McLeod<br />
Paul E. Parker<br />
Directors with Term Expiring at the 2012 Annual Meeting:<br />
James L. Dewar, Jr.<br />
Thompson Kurrie, Jr<br />
John E. Mansfield, Jr.<br />
Set forth below is information about each director with a term of office expiring at the Annual Meeting of<br />
Shareholders in 2010, 2011, or 2012.<br />
106
JAMES W. GODBEE, JR<br />
Certified Public Accountant<br />
Director s<strong>inc</strong>e 2008<br />
Age 43<br />
DIRECTORS<br />
Term Expiring at the 2010 Annual Meeting of Shareholders<br />
Mr. Godbee is a partner with Henderson & Godbee, LLP, a certified public accounting firm in Valdosta, Georgia.<br />
Prior to becoming a partner in 2000, he worked as a Tax Manager for the firm from 1997 and worked as a Tax Manager<br />
for Bearden & Smith, PC, an accounting firm in Atlanta, Georgia from 1992 to 1997. Mr. Godbee has served as a director<br />
of the Company and the Bank s<strong>inc</strong>e 2008. He has served as an advisory director of the Bank’s Valdosta Market Advisory<br />
Board s<strong>inc</strong>e 2000, and served as the Chairman of that Advisory Board in 2008. He also currently serves as a member of<br />
the Valdosta Housing Authority Board and the South Georgia Medical Center Foundation Board. He has served on the<br />
Company’s Audit Committee s<strong>inc</strong>e September 2009 and as a member of the Company’s and the Bank’s Compliance<br />
Committee s<strong>inc</strong>e it was established in July 2009. Mr. Godbee’s financial expertise, business experience and familiarity<br />
with the community are valuable in directing the affairs of the Company.<br />
JAMES B. LANIER, JR.<br />
Consultant Forester<br />
Director s<strong>inc</strong>e 1998<br />
Age 63<br />
Mr. Lanier is an owner of Lanier-Brookins, Inc., a forestry-consulting firm. Mr. Lanier was a founding director of<br />
Eagle Bancorp, Inc., the holding company for Eagle Bank and Trust, of Statesboro, Georgia, from 1990 to 1998, when it<br />
was acquired by the Company. He has served as a director of the Bank s<strong>inc</strong>e 2001 and as a director of Eagle Bank and<br />
Trust from its founding in 1990 until its merger into the Bank in 2002. Mr. Lanier has served as a member of the<br />
Company’s Audit Committee s<strong>inc</strong>e 2002 and as a member of the Company’s Governance Committee from 2005 until it<br />
was dissolved in 2008. Mr. Lanier’s business experience and familiarity with the community are assets to the Board.<br />
DOUGLAS W. MCNEILL<br />
Real Estate Executive<br />
Director s<strong>inc</strong>e 2005<br />
Age 67<br />
Mr. McNeill is a director of Case Pomeroy and Company, Inc. and subsidiaries, a private company. In 2007, he<br />
retired as President of Case Pomeroy Properties, a real estate development and investment firm located in Jacksonville<br />
Beach, Florida. Mr. McNeill has been involved in the real estate industry for more than 30 years as a senior level<br />
executive directing multi-million dollar developments and investments. He also serves as a director of the Real Estate<br />
Advisory Committee of the Reinhold Corporation and a member of the Investment Committee of the Woodbridge<br />
Corporation. In addition, he is a director of the University of North Florida Foundation and a past director of Leadership<br />
Florida and the Florida Chamber of Commerce. S<strong>inc</strong>e 2005, Mr. McNeill has served on the Bank’s Loan Committee, as a<br />
member of the Company’s and the Bank’s Executive Committee s<strong>inc</strong>e its <strong>inc</strong>eption in 2008 and the Company’s<br />
Compensation Committee s<strong>inc</strong>e 2005. Mr. McNeill has served as Vice Chairman of the Company’s Board of Directors<br />
s<strong>inc</strong>e 2007. Mr. McNeill’s vast business experience and considerable knowledge of the real estate markets are critical to<br />
leading the Board through the current economic environment.<br />
107
F. FERRELL SCRUGGS, SR.<br />
Retired Construction Executive<br />
Director s<strong>inc</strong>e 1989<br />
Age 70<br />
In 2002, Mr. Scruggs retired as Chairman of the Board of Directors of The Scruggs Company, a road construction<br />
company headquartered in Valdosta, Georgia, where he had worked for 37 years. Mr. Scruggs also served as the Vice<br />
President and Secretary of Civiltec, Inc., another road construction company, from 2002 until 2003. Mr. Scruggs was a<br />
director of the Bank from 1989 until 1999 and was reelected as a director in 2001. He served as Chairman of the Bank’s<br />
Loan Committee from 2002 to 2008 and as a member from 2001 to 2008, as Chairman of the Company’s Nominating and<br />
Governance Committee from 2004 to 2005 when it was dissolved, as Chairman of the Company’s Nominating Committee<br />
from 2005 through September 2009, and the Bank’s and the Company’s Executive Committee from its <strong>inc</strong>eption in 2008<br />
through September 2009. Mr. Scruggs’ experience in construction and his extensive contacts within the communities in<br />
which we operate have been invaluable to the Company.<br />
R. BRADFORD BURNETTE<br />
Retired Bank Executive<br />
Director s<strong>inc</strong>e 1982<br />
Age 70<br />
Term Expiring at the 2011 Annual Meeting of Shareholders<br />
In 2001, Mr. Burnette retired from the Company and the Bank where he had served as President and Chief<br />
Executive Officer of the Company s<strong>inc</strong>e its founding in 1982, as the Chief Executive Officer of the Bank from 1990 to<br />
1997, as President of the Bank from 1983 to 1990, and as Executive Vice President of the Bank from 1968 to 1982. Mr.<br />
Burnette has served as a director of the Bank s<strong>inc</strong>e 1968. Mr. Burnette served as Chairman of the Board of Directors of<br />
the Company and the Bank from 2000 to 2003. Mr. Burnette has served as a member of the Bank’s Loan Committee s<strong>inc</strong>e<br />
2001, as Chairman of the Company’s Governance Committee from 2005 until it was dissolved in 2008, as a member of the<br />
Company and Bank’s Executive Committee s<strong>inc</strong>e its <strong>inc</strong>eption in 2008, as an ex-officio member of the Company’s<br />
Compensation Committee from 2005 to 2007, as a voting member of the Company’s Compensation Committee s<strong>inc</strong>e<br />
2008, a member of the Company’s and the Bank’s Compliance Committee s<strong>inc</strong>e it was established in July 2009 and as<br />
Chairman of the Company’s Nominating Committee s<strong>inc</strong>e September 2009. Mr. Burnette is also a director of Nexity<br />
Bank and its holding company, Nexity <strong>Financial</strong> Corporation, a publicly-traded company headquartered in Birmingham,<br />
Alabama. Mr. Burnette served as a director of the Federal Home Loan Bank Atlanta from 2002 to 2007. Mr. Burnette’s<br />
experience and contacts in the banking community are assets to the Board.<br />
MICHAEL H. GODWIN<br />
Real Estate Executive<br />
Director s<strong>inc</strong>e 2002<br />
Age 51<br />
Mr. Godwin is the President and Chief Executive Officer of Ambling Companies, Inc. and affiliated companies, a<br />
real estate development, construction and management company headquartered in Valdosta, Georgia. Mr. Godwin is a<br />
member of the Board of Directors of the National Multi-Housing Council. Mr. Godwin has served as a director of the<br />
Bank s<strong>inc</strong>e 2000. Mr. Godwin has served as a member of the Bank’s Loan Committee s<strong>inc</strong>e 2003, as Chairman of the<br />
Company’s Compensation Committee s<strong>inc</strong>e 2005, as a member of the Company’s Nominating and Governance<br />
Committee from 2004 to 2005 when it was dissolved, as a member of the Company’s and the Bank’s Executive<br />
Committee s<strong>inc</strong>e its <strong>inc</strong>eption in 2008, and as a member of the Company’s Nominating Committee s<strong>inc</strong>e 2005. Mr.<br />
Godwin’s extensive experience in real estate related projects provides unique knowledge of the markets in which we<br />
operate.<br />
108
KENNITH D. MCLEOD<br />
Certified Public Accountant<br />
Director s<strong>inc</strong>e 1999<br />
Age 63<br />
Mr. McLeod is a self-employed certified public accountant in Hazlehurst, Georgia. Mr. McLeod is also the<br />
pr<strong>inc</strong>ipal owner and Chief Executive Officer of Hazlehurst Main Street, Inc. and Medallion Investment Group, LLC, both<br />
of which are involved in commercial and industrial real estate ownership and management. He has served as a director of<br />
the Bank s<strong>inc</strong>e 2001, and he served as a director of Baxley Federal Savings Bank from 1985 until its merger into the Bank<br />
in 2002. Mr. McLeod has also served as a member of the Company’s Audit Committee s<strong>inc</strong>e 2000 and Chairman of the<br />
Company’s and the Bank’s Compliance Committee s<strong>inc</strong>e it was established in July 2009. Mr. McLeod’s experience<br />
brings essential financial acumen to the Board.<br />
PAUL E. PARKER<br />
Bakery Executive<br />
Director s<strong>inc</strong>e 1998<br />
Age 61<br />
Mr. Parker is a director and the Vice President of Claxton Bakery, Inc.; a family owned wholesale bakery located<br />
in Claxton, Georgia, and the Vice President of ADMP Enterprises, Inc., a commercial real estate management company.<br />
Mr. Parker was a founding director of Eagle Bancorp, Inc., the holding company for Eagle Bank and Trust, of Statesboro,<br />
Georgia, from 1990 to 1998, when it was acquired by the Company. He has served as a director of the Bank s<strong>inc</strong>e 2001<br />
and as a director and Vice Chairman of Eagle Bank and Trust from its founding in 1990 until its merger into the Bank in<br />
2002. Mr. Parker has served as a member of the Company’s Audit Committee s<strong>inc</strong>e 1998. Mr. Parker is also a director of<br />
The Claxton Bank and its holding company, Southern Bankshares, Inc., located in Claxton, Georgia. Mr. Parker’s<br />
business experience provides the Board with insight into the challenges facing small business owners in our markets.<br />
JAMES L. DEWAR, JR.<br />
Real Estate Developer<br />
Director s<strong>inc</strong>e 1982<br />
Age 67<br />
Term Expiring at the 2012 Annual Meeting of Shareholders<br />
Mr. Dewar is Chief Executive Officer of Dewar Properties, Inc. and President of Dewar Realty, Inc. in Valdosta,<br />
Georgia where he has been actively involved in various facets of real estate development, construction and management<br />
for the past 34 years. Mr. Dewar has served as Chairman of the Board of Directors of the Company and the Bank s<strong>inc</strong>e<br />
2003, a member of the Bank’s Loan Committee s<strong>inc</strong>e 2001, a member of the Company’s Compensation Committee s<strong>inc</strong>e<br />
2005, and a member of the Company’s and the Bank’s Executive Committee s<strong>inc</strong>e 2008. Mr. Dewar served as interim<br />
President and Chief Executive Officer of the Company from August 2004 to February 2005. Mr. Dewar has also served as<br />
a director of the Bank s<strong>inc</strong>e 1969. Mr. Dewar’s breadth of experience and institutional knowledge of the Company is<br />
critical in guiding the Board through the current challenging economic climate.<br />
109
THOMPSON KURRIE, JR<br />
Attorney<br />
Director s<strong>inc</strong>e 2009<br />
Age 61<br />
Mr. Kurrie has been a partner with Coleman Talley LLP s<strong>inc</strong>e 1986, practicing in the areas of corporate, banking,<br />
and commercial real estate law. Prior to joining Coleman Talley LLP, Mr. Kurrie was a tax partner with Price Waterhouse<br />
Coopers, an Assistant Professor of Accounting and Taxation at Valdosta State University, and the Chief <strong>Financial</strong> Officer<br />
and Treasurer of Griffin Corporation. Mr. Kurrie received his Bachelor of Business Administration and Juris Doctor<br />
degrees from Emory University and his Masters of Business Administration from Georgia State University. From January<br />
1989 until April 2009, Mr. Kurrie served as general counsel to the Company and the Bank. He previously served as a<br />
member of the Board of Directors of the Company and the Bank from 1989 to January 2003. In April 2009, Mr. Kurrie<br />
was appointed to serve as a Vice Chairman of the Company’s Board of Directors. Mr. Kurrie has served on the Bank’s<br />
Loan Committee s<strong>inc</strong>e May 2009 and the Company and Bank’s Executive Committee s<strong>inc</strong>e September 2009. Mr. Kurrie’s<br />
professional experience as a corporate, banking and commercial real estate lawyer provides the Board with legal insight<br />
and his strong analytical skills are helpful to the Board’s ability to direct the affairs of a highly regulated company.<br />
JOHN E. MANSFIELD, JR.<br />
Real Estate Investor<br />
Director s<strong>inc</strong>e 2005<br />
Age 54<br />
Mr. Mansfield is Chief Executive Officer of Indigo Energy Partners, LLC, a wholesale fuel company marketing<br />
to 25 states selling gasoline, diesel, ethanol and bio-diesel to public companies and state and local governments. Indigo<br />
Energy Partners, LLC is headquartered in Alpharetta, Georgia. Mr. Mansfield also serves as President of Indigo Land<br />
Company, a real estate investment firm located in Alpharetta, Georgia. Prior to serving in his current capacities, Mr.<br />
Mansfield was the managing partner of Onyx-Mansfield Energy from 1998 to 2001; the founder and President of Onyx<br />
Petroleum from 1986 to 1998; the Vice President of Mansfield Oil Company from 1978 to 1984, and the President of<br />
Kangaroo Convenience Stores from 1981 to 1985, all of which were located in Gainesville, Georgia. Mr. Mansfield has<br />
served on the Board of Directors of the Company and the Bank and as a member of the Bank’s Loan Committee and the<br />
Company’s Compensation Committee s<strong>inc</strong>e 2005. Mr. Mansfield’s professional experience as a successful entrepreneur<br />
provides the Board with business insight and analytical skills that are necessary to direct the Company’s affairs in this<br />
difficult environment.<br />
There are no family relationships between any of the directors or executive officers of the Company or its<br />
subsidiaries. However, the following family relationships exist between certain directors and an officer of the Bank and<br />
certain non-fiduciary advisory directors of the Bank.<br />
• R. Bradford Burnette, a director of the Company, is the father-in-law of Jeffery E. Hanson, the Valdosta/Lowndes<br />
County Market President of the Bank; and<br />
• Paul E. Parker, a director of the Company, is the brother of W. Dale Parker, a member and Vice Chairman of the<br />
Statesboro Advisory Board of the Bank.<br />
110
The Audit Committee is a separately-designated standing committee established in accordance with Section<br />
3(a)(58)(A) of the Securities Exchange Act of 1934, as amended (the “Exchange Act”), and operates pursuant to an Audit<br />
Committee Charter, which is available on the Company’s website at www.<strong>pab</strong><strong>bankshares</strong>.com. The Audit Committee<br />
consists of four members. The Audit Committee held 16 meetings during the 2009 fiscal year. The Audit Committee<br />
reviews the scope and timing of the audit services of the Company’s independent accountants and any other services such<br />
accountants are asked to perform and has the authority to engage the services of such independent accountants. In<br />
addition, the Audit Committee reviews the independent accountants’ report on the Company’s financial statements and the<br />
Company’s policies and procedures with respect to internal accounting and financial controls. The members of the Audit<br />
Committee are James W. Godbee, Jr., James B. Lanier, Jr., Kennith D. McLeod, and Paul E. Parker. David K. Williams<br />
served on the Audit Committee until his resignation from the Board on September 29, 2009. James W. Godbee, Jr. was<br />
appointed to replace Mr. Williams. All Directors who currently serve as members of the Audit Committee have been<br />
determined by the Board of Directors to be independent in accordance with applicable NASDAQ and Securities and<br />
Exchange Commission (“SEC”) requirements. The Company’s Board of Directors has affirmatively determined that<br />
Kennith D. McLeod and James W. Godbee, Jr. are “audit committee financial experts” as that term is defined under<br />
applicable federal securities regulations.<br />
EXECUTIVE OFFICERS<br />
On April 6, 2009, M. Burke Welsh, Jr. retired from his position as President and Chief Executive Officer of the<br />
Company and the Bank. During 2009, Mr. Donald J. Torbert, Jr., was appointed to serve as President and Chief Executive<br />
Officer of the Company and the Bank, Ms. Nicole S. Stokes was appointed to serve as Executive Vice President and Chief<br />
<strong>Financial</strong> Officer of the Company and the Bank, Mr. David H. Hammond was appointed to serve as Executive Vice<br />
President and Chief Credit Officer and Ms. Judith S. Kelly was appointed to serve as Executive Vice President and Chief<br />
Operations Officer.<br />
The following sets forth certain information with respect to the Company’s current executive officers.<br />
DONALD J. TORBERT, JR.<br />
President and Chief Executive Officer<br />
Age 37<br />
Mr. Torbert was appointed to serve as the President and Interim Chief Executive Officer of the Company and the<br />
Bank in April 2009 with his appointment as the Chief Executive Officer made official in July 2009. Mr. Torbert is a<br />
certified public accountant and prior to his current position served as Executive Vice President s<strong>inc</strong>e 2003 and as Chief<br />
<strong>Financial</strong> Officer and Treasurer of the Company and the Bank s<strong>inc</strong>e 2001. Mr. Torbert was Senior Vice President of the<br />
Company and the Bank from 2001 to 2003 and was Vice President and Controller of the Company from 2000 to 2001.<br />
During his tenure with the Bank, Mr. Torbert has served as a member on the Asset-Liability Committee, the Loan<br />
Committee, the Problem Asset Committee, the IT Steering Committee, and as a trustee on the Company’s 401k Plan and<br />
Employee Benefits Plan Committee. Prior to joining the Company, Mr. Torbert was employed with Mauldin & Jenkins<br />
from 1994 to 2000, where he last served as an audit manager for the firm.<br />
R. WESLEY FULLER<br />
Executive Vice President, Treasurer and Chief Administrative Officer<br />
Age 49<br />
Mr. Fuller has served as Executive Vice President of the Company and the Bank s<strong>inc</strong>e 2002. Mr. Fuller has<br />
served as Chief Administrative Officer and Treasurer for the Company and the Bank s<strong>inc</strong>e October 2009. Previously he<br />
served as Director of Operations for the Company and the Bank s<strong>inc</strong>e 2002. Mr. Fuller was Senior Vice President of the<br />
Company and the Bank from 2001 to 2002. Before joining the Company, Mr. Fuller was employed by Futurus <strong>Financial</strong><br />
Services, Inc. and Futurus Bank, N.A. as Executive Vice President and Chief <strong>Financial</strong> Officer from 2000 to 2001 and by<br />
Premier Bancshares, Inc. as Executive Vice President of Operations from 1997 until 2000. Mr. Fuller’s banking career<br />
began in 1983 with First South Bank in Fort Valley, Georgia.<br />
111
DAVID H. HAMMOND<br />
Executive Vice President and Chief Credit Officer<br />
Age 58<br />
Mr. Hammond was appointed to serve as the Executive Vice President and Chief Credit Officer of the Company and the<br />
Bank in October 2009. Previously, Mr. Hammond served as Senior Vice President of the Company and the Bank s<strong>inc</strong>e<br />
2007, and as Regional Credit Officer of the Company and the Bank s<strong>inc</strong>e 2005. Mr. Hammond has over 25 year’s credit<br />
experience in various financial institutions. Prior to joining the Company in 2005, Mr. Hammond served in various credit<br />
administration positions with SouthTrust Bank, in Atlanta, Georgia from 1996 through 2004, where he last served as Vice<br />
President of Credit Administration for Residential Construction Lending.<br />
GEORGE D. HENDERSON<br />
Executive Vice President and Chief Banking Officer<br />
Age 58<br />
Mr. Henderson was appointed to serve as Executive Vice President of the Company and the Bank in 2007. Mr.<br />
Henderson has served as Chief Banking Officer for the Company and the Bank s<strong>inc</strong>e October 2009. Previously, Mr.<br />
Henderson served as Chief Credit Officer for the Company and the Bank s<strong>inc</strong>e 2007. Mr. Henderson served as the Market<br />
President for the Bank’s Hall County, Georgia office from 2002 to 2007 during which time he also served as Senior Vice<br />
President over Commercial Lending in Hall County. Mr. Henderson has 33 years of experience in commercial banking<br />
with various financial institutions in Georgia. Prior to joining the Company in 2002, Mr. Henderson worked for Premier<br />
Bancshares, Inc. from 1993 until 2000 when it was acquired by BB&T Corporation. Mr. Henderson’s banking career<br />
began in 1974 with Trust Company Bank in Atlanta, Georgia.<br />
JUDITH S. KELLY<br />
Executive Vice President and Chief Operations Officer<br />
Age 58<br />
Ms. Kelly was appointed to serve as Executive Vice President and Chief Operations Officer of the Company and<br />
the Bank in October 2009. Prior to her recent appointment, Ms. Kelly served as Senior Vice President of the Company<br />
and the Bank s<strong>inc</strong>e 1996. Ms. Kelly has been with the Bank s<strong>inc</strong>e 1975. During her time with the Company and the Bank,<br />
she has served in various management positions overseeing deposit operations, data processing, branch operations, human<br />
resources, and financial management.<br />
NICOLE S. STOKES<br />
Executive Vice President and Chief <strong>Financial</strong> Officer<br />
Age 35<br />
Ms. Stokes is a certified public accountant and was appointed to serve as Executive Vice President of the<br />
Company and the Bank in October 2009. Ms. Stokes previously served as Senior Vice President and Chief <strong>Financial</strong><br />
Officer of the Company and the Bank s<strong>inc</strong>e April 2009. Ms. Stokes served as Vice President and Controller of the<br />
Company and the Bank from 2005 until April 2009. Prior to joining the Company in 2005, Ms. Stokes served as Senior<br />
Vice President and Controller for The Banc Corporation in Birmingham, Alabama s<strong>inc</strong>e 2004 and Assistant Controller for<br />
The Banc Corporation s<strong>inc</strong>e 2001.<br />
112
SECTION 16(a) BENEFICIAL OWNERSHIP<br />
REPORTING COMPLIANCE<br />
Section 16(a) of the Exchange Act (“Section 16(a)”) requires the Company’s officers and directors, and persons<br />
who own 10% or more of the registered class of the Company’s equity securities, to file with the SEC initial reports of<br />
ownership and reports of changes in ownership of common stock and other equity securities of the Company. Officers,<br />
directors and 10% or more shareholders are required by regulations of the SEC to furnish the Company with copies of all<br />
Section 16(a) forms they file.<br />
To the Company’s knowledge, based solely on a review of the copies of such reports furnished to the Company<br />
during fiscal year 2009, all directors, officers and 10% shareholders complied with all Section 16(a) filing requirements.<br />
CODE OF CONDUCT AND ETHICS<br />
In accordance with rules of the SEC and NASDAQ, the Board of Directors has approved a Director Code of<br />
Conduct Policy applicable to all directors, an Officer and Employee Code of Conduct Policy applicable to all officers and<br />
employees and a Code of Ethical Conduct for Senior <strong>Financial</strong> Officers applicable to all pr<strong>inc</strong>ipal financial officers,<br />
pr<strong>inc</strong>ipal and senior accounting officers, controllers, or persons serving similar functions. These Codes of Conduct are<br />
intended to provide guidance to directors and management to assure compliance with the law and promote ethical<br />
behavior. The Company’s Director Code of Conduct Policy, Officer and Employee Code of Conduct Policy and Code of<br />
Ethical Conduct for Senior <strong>Financial</strong> Officers are available on our website, www.parkavebank.com in the “Corporate<br />
Governance” subsection in the “Investor Relations” section. Shareholders may request a printed copy of any of the Codes<br />
of Conduct upon written request to Denise McKenzie, Secretary, PAB Bankshares, Inc., P.O. Box 3460, Valdosta, Georgia<br />
31604-3460.<br />
ITEM 11. EXECUTIVE COMPENSATION<br />
Compensation Committee Interlocks and Insider Participation<br />
None of the voting members of the Compensation Committee was an officer or employee, or former<br />
officer or employee of the Company or the Bank during the year ended December 31, 2009. In addition, none of these<br />
individuals had any relationship requiring disclosure under “Certain Relationships and Related Transactions,” with the<br />
exception of James L. Dewar, Jr. and Thompson Kurrie, Jr. as disclosed in Item 13. During the year ended December 31,<br />
2009, (i) no executive officer of the Company served as a member of the Compensation Committee (or other board<br />
committee performing equivalent functions or, in the absence of any such committee, the entire board of directors) of<br />
another entity, one of whose executive officers served on the Compensation Committee of the Company; (ii) no executive<br />
officer of the Company served as a director of another entity, one of whose executive officers served on the Compensation<br />
Committee of the Company; and (iii) no executive officer of the Company served as a member of the compensation<br />
committee (or other board committee performing equivalent functions or, in the absence of any such committee, the entire<br />
board of directors) of another entity, one of whose executive officers served as a director of the Company.<br />
THE FOLLOWING REPORT OF THE COMPENSATION COMMITTEE SHALL NOT BE DEEMED TO BE<br />
SOLICITING MATERIAL OR TO BE INCORPORATED BY REFERENCE IN ANY PREVIOUS OR FUTURE<br />
DOCUMENTS FILED BY THE COMPANY WITH THE SECURITIES AND EXCHANGE COMMISSION UNDER<br />
THE SECURITIES ACT OF 1933 OR THE EXCHANGE ACT, EXCEPT TO THE EXTENT THAT THE COMPANY<br />
EXPRESSLY INCORPORATES SAID REPORTS BY REFERENCE IN ANY SUCH DOCUMENT.<br />
113
EXECUTIVE COMPENSATION<br />
Report of the Compensation Committee on Executive Compensation<br />
In accordance with rules of the SEC, the Compensation Committee of the Company is providing the following<br />
report regarding compensation policies for the Company’s Chief Executive Officer and other named executive officers<br />
with respect to compensation paid to such persons during the last fiscal year. The Board of Directors has established a<br />
Compensation Committee to make recommendations to the Board to discharge its responsibilities relating to the<br />
compensation of the Company’s executive officers. Michael H. Godwin, R. Bradford Burnette, James L. Dewar, Jr., John<br />
E. Mansfield, Jr. and Douglas W. McNeill served as the members of the Compensation Committee during the year ended<br />
December 31, 2009.<br />
The Compensation Committee has reviewed and discussed the Compensation Discussion and Analysis (the<br />
“CD&A”) for the year ended December 31, 2009 with management. In reliance on the reviews and discussions referred to<br />
above, the Compensation Committee recommended to the Board, and the Board has approved, that the CD&A be <strong>inc</strong>luded<br />
in this Report.<br />
The foregoing report has been furnished by the Compensation Committee of the Board of Directors.<br />
Michael H. Godwin, Committee Chair<br />
R. Bradford Burnette<br />
James L. Dewar, Jr.<br />
John E. Mansfield, Jr.<br />
Douglas W. McNeill<br />
Role of the Compensation Committee<br />
COMPENSATION DISCUSSION AND ANALYSIS<br />
The Compensation Committee, appointed by the Board of Directors, sets and administers the policies that govern<br />
the Company’s executive compensation programs, director compensation and various <strong>inc</strong>entive and stock option<br />
programs. Voting members of the Compensation Committee must meet SEC and NASDAQ independence requirements,<br />
although the Board of Directors may appoint non-independent directors to serve on the committee as ex-officio, nonvoting<br />
members.<br />
The Compensation Committee reviews and recommends to the Board of Directors the compensation levels of<br />
members of senior management (<strong>inc</strong>luding the Company’s named executive officers), evaluates the performance of<br />
executive management and considers executive management succession and related matters. All recommendations<br />
relating to the compensation of the named executive officers must be approved by a majority of the independent directors<br />
of the full Board of Directors.<br />
The Compensation Committee has reviewed the SEC’s definition of a named executive officer and has made the<br />
determination that the Company’s named executive officers for the 2009 fiscal year were:<br />
Donald J. Torbert, Jr.<br />
Nicole S. Stokes<br />
President and Chief Executive Officer<br />
(the Company’s “Pr<strong>inc</strong>ipal Executive Officer”)<br />
Executive Vice President and Chief <strong>Financial</strong> Officer<br />
(the Company’s “Pr<strong>inc</strong>ipal <strong>Financial</strong> Officer”)<br />
R. Wesley Fuller Executive Vice President and Treasurer and Chief Administrative Officer<br />
David H. Hammond<br />
George D. Henderson<br />
Executive Vice President and Chief Credit Officer<br />
Executive Vice President and Chief Banking Officer<br />
M. Burke Welsh, Jr. 1 Former President and Chief Executive Officer<br />
1 Mr. Welsh retired from the Company on April 6, 2009.<br />
114
Compensation Benchmarks and Use of Consultants<br />
The Compensation Committee recognizes that competitive compensation is critical for attracting, motivating and<br />
rewarding qualified executives. In 2009, the Compensation Committee retained the services of Blanchard Chase, an<br />
Atlanta, Georgia based compensation consulting firm specializing in the financial services industry, to provide an<br />
objective, third party review of executive compensation at the Company and to recommend potential improvements<br />
regarding existing practices. Blanchard Chase also provided the Compensation Committee with industry salary surveys<br />
and other industry average data to assist it with respect to assessing compensation at other levels within the organization.<br />
In August 2009, Blanchard Chase provided the Compensation Committee with compensation data for a custom<br />
peer group to use solely as benchmark compensation levels for the Company’s named executive officers. The peer group<br />
was selected based upon asset size, geographic location and performance. The peer group consisted of 16 publicly traded,<br />
similarly structured financial institutions headquartered in the southeast region of the United States (Florida, Georgia,<br />
South Carolina and Tennessee) with total assets (at December 31, 2008) between $892 million and $1.76 billion.<br />
Specifically, the peer group consisted of Fidelity Southern Corp. (LION), TIB <strong>Financial</strong> Corp. (TIBB), Bank of Florida<br />
Corp. (BOFL), Southeastern Bank <strong>Financial</strong> Corp. (SBFC), Wilson Bank Holding Company (WBHC), Palmetto<br />
Bancshares, Inc. (PLMT), CenterState Banks, Inc. (CSFL), First Security Group, Inc. (FSGI), Colony Bankcorp, Inc.<br />
(CBAN), Appalachian Bancshares, Inc. (APAB), Crescent Banking Company (CSNT), Savannah Bancorp, Inc. (SAVB),<br />
Atlantic Southern <strong>Financial</strong> Group, Inc. (ASFN), Florida Community Banks, Inc. (FLRB), First Farmers and Merchants<br />
Corp. (FFMH), and WGNB Corp. (WGNB). S<strong>inc</strong>e the report contained data elements compiled from peer proxy<br />
statements filed with the SEC in 2009 for 2008 executive compensation, the consultants “aged” the peer data 3% based on<br />
their observations of general market movement in executive compensation levels to provide more current comparisons for<br />
the Compensation Committee. Blanchard Chase also used national information from published banking and financial<br />
industry surveys such as the American Banker’s Association, Delves-Group/Bank Administration Institute, Mercer Retail<br />
Banking Compensation Survey, and Watson Wyatt. The overall results of this engagement have provided the foundation<br />
for the Compensation Committee’s actions involving executive compensation in 2009 and 2010.<br />
General Philosophy<br />
The Company’s senior officers are compensated through a mix of base salary, cash bonus and equity<br />
compensation designed to be competitive with comparable employers and to align management’s <strong>inc</strong>entives with the longterm<br />
interests of our stockholders. The compensation setting process consists of establishing targeted base salaries for<br />
each senior officer and then providing performance-based cash and equity <strong>inc</strong>entives. The performance evaluations of<br />
management are often subjective and not always based on specific, or tangible, performance measures.<br />
For the named executive officers, <strong>inc</strong>entive compensation is designed to reward company-wide performance<br />
relative to annual and long-term strategic goals. For other senior management positions, <strong>inc</strong>entive compensation is<br />
designed to reward for the achievement of market- or department-level objectives and, to a lesser degree, company-wide<br />
performance relative to annual and long-term strategic goals. For other officer positions, <strong>inc</strong>entive compensation is<br />
designed to reward individual performance and the achievement of specific operational goals within areas under the<br />
control of those employees, although company-wide performance is also a factor. Due to the poor financial performance<br />
of the Bank, <strong>inc</strong>entive compensation was suspended during 2008 and 2009.<br />
The policies and underlying philosophy governing the Company’s executive compensation program, as endorsed by<br />
the Compensation Committee and the Board of Directors, are designed to accomplish the following:<br />
• Maintain a compensation program that is equitable in a competitive marketplace.<br />
• Provide opportunities that integrate pay with the Company’s annual and long-term performance goals.<br />
• Encourage achievement of strategic objectives and creation of shareholder value.<br />
• Recognize and reward individual initiative and achievements.<br />
• Maintain an appropriate balance between base salary and short- and long-term <strong>inc</strong>entive opportunity.<br />
• Allow the Company to compete for, retain and motivate talented executives critical to its success consistent with<br />
its quality of life philosophy.<br />
We believe our compensation structure is designed to avoid excessive risk-taking. The goals for our performancebased<br />
cash and equity <strong>inc</strong>entives reflect a balanced mix of performance measures based on our strategic objectives, avoid<br />
excessive weight on a single performance measure and limit overall potential payments for any of our executives.<br />
115
Elements of Executive Compensation<br />
In general, for executive management, the Compensation Committee utilizes benchmark compensation levels of other<br />
banks of comparable asset size, growth strategy, and complexity and with similar products and markets as a guide to<br />
setting compensation for its executive officers. A significant portion of the executive officers’ compensation is weighted<br />
toward elements contingent upon the Company’s annual and long-term performance. The goals of the Compensation<br />
Committee in establishing the specific executive compensation components <strong>inc</strong>lude:<br />
•<br />
•<br />
Base salaries at the 50 th percentile of the benchmark peer group.<br />
Annual cash bonuses at the 50 th percentile of the benchmark peer group when subjective annual performance<br />
goals are achieved and between the 60 th and 75 th percentile if annual goals are exceeded. Annual cash bonuses for<br />
the CEO can range from 0% to 80% of the CEO’s base salary and from 0% to 60% of the other named executive<br />
officers’ base salaries.<br />
• Performance-based, long-term equity <strong>inc</strong>entives at the 50 th percentile of the benchmark peer group are<br />
periodically granted as <strong>inc</strong>entives to accomplish long-term strategic goals. Equity <strong>inc</strong>entives can range from 0%<br />
to 25% of the named executive officer’s base salary.<br />
Allocation of Compensation Components<br />
Under the Company’s compensation structure, the targeted allocation of base salary, cash bonus and equity<br />
compensation varies depending on the officer’s level within the organization. Below is a summary of the range of<br />
potential compensation components as a percentage of total cash and equity compensation, excluding perquisites and other<br />
employee benefits.<br />
Position Level<br />
Base Salary<br />
Cash Incentive/<br />
Bonus<br />
Equity<br />
Compensation<br />
CEO 45% - 100% up to 40% up to 15%<br />
Executive Vice President 50% - 100% up to 35% up to 15%<br />
Senior Vice President* 60% - 100% up to 30% up to 10%<br />
Vice President* 70% - 100% up to 25% up to 5%<br />
* Certain senior commercial lenders <strong>inc</strong>luded in these categories could have the potential to earn up to 100% of<br />
their base salaries in annual <strong>inc</strong>entives if certain individual performance objectives and the Company’s annual and long-term<br />
strategic performance goals are exceeded.<br />
In allocating compensation among these elements, the Compensation Committee believes that the compensation<br />
of the Company’s senior-most levels of management (<strong>inc</strong>luding the Company’s named executive officers) have the<br />
greatest ability to influence the Company’s performance. Accordingly, performance-based <strong>inc</strong>entives make up a greater<br />
portion of overall compensation for the most senior officers within the Company compared to lower levels of management<br />
who receive a greater portion of their compensation in base salary.<br />
Certain perquisites and other employee benefits are also provided to the Company’s named executive officers.<br />
Additional information regarding each element of executive compensation is provided below.<br />
116
The following table summarizes in tabular form the compensation awarded to, earned by, or paid to the<br />
Company’s named executive officers for services rendered for the fiscal years ended December 31, 2009, 2008 and 2007.<br />
Executive Officer Summary Compensation Table<br />
For the Fiscal Years Ended December 31, 2009, 2008 and 2007<br />
Option All Other<br />
Name and Pr<strong>inc</strong>ipal Position Salary Bonus Awards 1 Compensation 2 Total<br />
Year ($) ($) ($) ($)<br />
($)<br />
Donald J. Torbert, Jr. 3 2009 172,780 - 86,815 19,116 278,711<br />
Pr<strong>inc</strong>ipal Executive Officer 2008 172,780 - - 20,981 193,761<br />
2007 172,780 58,950 23,883 23,541 279,154<br />
Nicole S. Stokes 4 2009 105,362 - 33,112 11,515 149,989<br />
Pr<strong>inc</strong>ipal <strong>Financial</strong> Officer<br />
R. Wesley Fuller 2009 172,780 -<br />
54,003<br />
-<br />
17,056 243,839<br />
2007 172,780 58,950 23,883 24,087 279,700<br />
George D. Henderson 2009 158,744 - 48,436 4,902 212,082<br />
Executive Vice President 2008 155,000 - - 6,148 161,148<br />
2007 148,560 53,450 19,107 11,744 232,861<br />
David Hammond 5 2009 113,094 - 35,347 12,726 161,167<br />
Executive Vice President<br />
M. Burke Welsh, Jr . 6 2009 82,216 -<br />
- 734,715 816,931<br />
Former Pr<strong>inc</strong>ipal Executive<br />
Officer 2008 309,800 - - 15,189 324,989<br />
2007 309,800 120,750 30,252 21,413 482,215<br />
(1) The values disclosed in the table represent the aggregate grant date fair value of awards in accordance with FASB Accounting Standards<br />
Codification 718 of options granted in 2009, 2008 and 2007 under the Company’s 1999 Stock Option Plan. For further discussion and details<br />
regarding the accounting treatment and underlying assumptions relative to stock-based compensation, see Note 18, “Stock Plans and Stock-based<br />
Employee Compensation,” of the notes to Consolidated <strong>Financial</strong> Statements <strong>inc</strong>luded in Part II, Item 8, “<strong>Financial</strong> Statements and Supplementary<br />
Data,” of this Report. During 2009, Mr. Welsh forfeited 15,912 unvested options due to his retirement from the Company and elected not to<br />
exercise 54,004 vested options available at his retirement. There were no forfeitures by named executive officers during 2008 or 2007.<br />
117
(2) The reported amounts <strong>inc</strong>lude the Company’s contributions to a Profit Sharing Plan, a Section 401(k) Plan and an Employee and Director Stock<br />
Purchase Program (the “SPP”), life insurance premiums paid by the Company for the named executive officers and perquisites and other personal<br />
benefits (such as auto allowance, cell phone allowance and an $8,524 temporary living allowance for Mr. Hammond in 2009) that may confer a<br />
direct or indirect benefit with a personal aspect, without regard to whether it may be provided for some business reason or for the convenience of<br />
the Company. All Other Compensation does not <strong>inc</strong>lude any perquisites and other personal benefits which are integrally and directly related to the<br />
performance of the executive’s duties. Detail of these amounts follow:<br />
Officer Name<br />
Year<br />
Contribution<br />
to a Profit<br />
Sharing Plan<br />
Contribution<br />
to a 401(k)<br />
Plan<br />
Contribution<br />
to a SPP<br />
Life<br />
Insurance<br />
Premiums<br />
Employment<br />
Contract<br />
Termination<br />
Payments<br />
Perquisites<br />
and other<br />
personal<br />
benefits<br />
($) ($) ($) ($) ($) ($) ($)<br />
Total<br />
Donald J. Torbert, Jr. 3 2009 - 7,777 1,000 900 - 9,439 19,116<br />
2008 - 10,350 1,000 900 - 8,731 20,981<br />
2007 6,750 10,125 1,000 900 - 4,766 23,541<br />
Nicole S. Stokes 4 2009 - 4,741 1,000 571 - 5,204 11,516<br />
R. Wesley Fuller<br />
2009 - 7,775 1,000 900 - 7,381 17,056<br />
2008 - 10,350 1,000 900 - 8,695 20,945<br />
2007 6,750 10,125 1,000 900 - 5,312 24,087<br />
David H. Hammond 5 2009 - 2,545 565 612<br />
- 9,004 12,726<br />
George D. Henderson<br />
2009 - - 1,000 857 - 3,045 4,902<br />
2008 - - 1,000 837 - 4,311 6,148<br />
2007 5,554 - 1,000 695 - 4,495 11,744<br />
M. Burke Welsh, Jr. 6 2009 - 3,700 - 225 730,000 790 734,715<br />
2008 - 10,350 1,000 900 - 2,939 15,189<br />
2007 6,750 10,125 1,000 900 - 2,638 21,413<br />
(3) Mr. Torbert was appointed to serve as the President and Interim Chief Executive Officer of the Company and the Bank in April 2009 with his<br />
appointment as the Chief Executive Officer made permanent in July 2009.<br />
(4) Ms. Stokes was appointed as Chief <strong>Financial</strong> Officer on April 6, 2009. The amounts reported for 2009 reflect compensation for the entire year of<br />
2009.<br />
(5) Mr. Hammond was appointed as Chief Credit Officer on October 1, 2009. The amounts reported for 2009 reflect compensation for the entire year<br />
of 2009.<br />
(6) Mr. Welsh retired from the Company on April 6, 2009. Under the terms of the Employment Termination Agreement, the Company agreed to pay<br />
Mr. Burke $730,000 as a severance payment related to his termination of employment with the Company; however, prior to making any such<br />
payment we must receive permission from our regulators, which has not been granted at this time.<br />
118
Base Salaries<br />
The Company’s philosophy provides each member of executive management with a level of assured cash<br />
compensation in the form of base salary that is competitive in nature and reflects the officer’s professional status and<br />
accomplishments. Below is a summary of the peer analysis conducted by Blanchard Chase and presented the<br />
Compensation Committee during 2009. Note that the information gathered for the analysis was derived from 2008<br />
information, but it is being compared to the Company’s executive officers’ 2009 base salaries. As discussed below, the<br />
Company’s executive officers’ 2009 base salaries were the same as their 2008 base salaries.<br />
2008<br />
and<br />
2009<br />
Base<br />
Salary<br />
2008<br />
Benchmark<br />
Peer Average<br />
Name<br />
Title<br />
Variance<br />
(Dollars In Thousands)<br />
Torbert Chief Executive Officer $172.8 $331.4 -47.8%<br />
Stokes EVP – Chief <strong>Financial</strong> Officer $105.0 $184.0 -42.9%<br />
Fuller EVP - Chief Administrative Officer $172.8 $258.5 -33.1%<br />
Hammond EVP - Chief Credit Officer $113.0 $173.0 -34.6%<br />
Henderson EVP - Chief Banking Officer $148.6 $200.7 -25.9%<br />
Welsh Former Chief Executive Officer $309.8 $331.4 -6.5%<br />
In December 2007, upon the recommendation of the Compensation Committee, the Board of Directors decided<br />
not to <strong>inc</strong>rease the base salaries of the named executive officers for 2008. The Compensation Committee made this<br />
recommendation due to lower Company performance in 2007 and continued earnings pressure expected in 2008.<br />
In December 2008, upon the recommendation of the Compensation Committee, the Board of Directors decided<br />
not to <strong>inc</strong>rease the base salaries of the named executive officers for 2009. The Compensation Committee made this<br />
recommendation due to the continued deteriorating economy, the level of nonperforming assets at the Bank and the<br />
Company’s earnings outlook for 2009.<br />
Bonuses<br />
The Company’s practice has been to award cash bonuses to management based upon various performance<br />
evaluations. In recent years for executive management, the practice has been to subjectively assess the performance of the<br />
officer and the performance of the Company relative to annual budgeted expectations, long-term strategic objectives and<br />
peer benchmarks.<br />
In December 2007, the Compensation Committee reviewed the performance of each executive officer to<br />
determine their recommendation for cash bonuses. Although the Company’s net <strong>inc</strong>ome for 2007 would not compare to<br />
the record earnings from 2006 or 2005, the Compensation Committee determined that executive management continued to<br />
make progress towards certain strategic (non-financial) objectives. In addition, the Compensation Committee determined<br />
that executive management had performed extremely well to date in managing the Company’s risk in a difficult operating<br />
environment. On the recommendation of the Compensation Committee, the Board of Directors approved a bonus equal to<br />
39% of the base salary for Mr. Welsh and bonuses equal to 31-35% of the base salary for each of the other named<br />
executive officers in 2007. These cash bonuses were less than the prior year’s cash bonuses and were in proportion to the<br />
decrease in earnings in 2007 as compared to 2006.<br />
In December 2008, on the recommendation of the Compensation Committee, the Board of Directors decided not<br />
to pay bonuses to executive management due to the deteriorating economy and net loss recorded for the Company in 2008.<br />
In December 2009, on the recommendation of the Compensation Committee, the Board of Directors decided not<br />
to pay bonuses to executive management due to the deteriorating economy and net loss recorded for the Company in 2009.<br />
119
Equity Incentives<br />
The Company has historically used <strong>inc</strong>entive stock options as a form of equity compensation to award<br />
management. This form of compensation was selected because it aligns management’s objectives with that of the<br />
Company’s stockholders. Incentive stock options also have traditionally received favorable accounting treatment for the<br />
Company and favorable tax treatment to the recipient. However, with the implementation of Statement of <strong>Financial</strong><br />
Accounting Standards No. 123(R) in 2006, the accounting treatment for stock options became less attractive. As a result,<br />
the Compensation Committee is evaluating other potential methods of equity compensation for senior management.<br />
In establishing equity awards, the equity ownership levels of the recipients and prior awards that are fully vested<br />
called “overhang” are generally not considered. It is the Compensation Committee’s position that competitors who might<br />
try to hire away the Company’s officers would not give credit for equity ownership in the Company and, accordingly, to<br />
remain competitive the Compensation Committee cannot afford to give credit for that factor either. However, the<br />
Compensation Committee has reviewed the level of equity overhang on the named executive officers and concluded that<br />
the overhang is low compared to data provided by its compensation consultants for the peer benchmarks and the industry<br />
as a whole.<br />
Although there is no official policy, the Compensation Committee is sensitive to the timing of option grants and<br />
has chosen to not make equity grants at times when they have knowledge of material information about the Company that<br />
has not been made public.<br />
There were no grants or awards made to the Company’s named executive officers under any equity compensation<br />
plan for the 2008 fiscal year.<br />
In September 2009, Mr. Torbert provided a list of recommended <strong>inc</strong>entive stock option and non-qualified stock<br />
option grants for senior management (<strong>inc</strong>luding the named executive officers other than himself) to the Compensation<br />
Committee. The non-qualified options were granted to officers in lieu of a raise for 2008 and 2009 and for long-term<br />
<strong>inc</strong>entive and retention purposes. The <strong>inc</strong>entive options were granted to officers for long-term <strong>inc</strong>entive and retention<br />
purposes. With the further recommendation of the Compensation Committee, the Board of Directors granted a total of<br />
67,828 <strong>inc</strong>entive stock options and 23,572 non-qualified options to the named executive officers other than Mr. Torbert,<br />
and an additional 17,928 <strong>inc</strong>entive stock options and 28,272 non-qualified stock options for Mr. Torbert. The <strong>inc</strong>entive<br />
stock options have an exercise price equal to the closing price of the stock on the date of a grant with a 2-year cliff vesting<br />
period and a 5-year option period. The non-qualified stock options have an exercise price of $2.00 per share with a 2-year<br />
cliff vesting period and a 5-year option period.<br />
120
The following table summarizes in tabular form each grant of an award made to the Company’s named executive<br />
officers under any equity compensation plan for the last completed fiscal year.<br />
Grants of Plan-Based Awards<br />
For the Fiscal Year Ended December 31, 2009<br />
All Other<br />
Option<br />
Awards:<br />
Name Grant Date 1 Number of<br />
Securities<br />
Underlying<br />
Options<br />
Exercise or<br />
Base Price of<br />
Option<br />
Awards<br />
Grant Date<br />
Fair Value<br />
of Stock<br />
and Option<br />
Awards<br />
(#) ($/sh) ($)<br />
Donald J. Torbert, Jr.<br />
Nicole S. Stokes<br />
R. Wesley Fuller<br />
9/29/2009 11,600<br />
2.00 23,906<br />
9/29/2009 16,762 3.00 30,240<br />
9/29/2009 17,928 3.00 32,668<br />
9/29/2009 14,100 3.00 25.693<br />
9/29/2009 3,600 2.00 7,419<br />
9/29/2009 5,172 3.00 9,381<br />
9/29/2009 17,928 3.00 32,668<br />
9/29/2009<br />
5,800 2.00 11,953<br />
David H. Hammond 9/29/2009<br />
15,100 3.00 27,515<br />
9/29/2009<br />
3,800 2.00 7,831<br />
George D. Henderson 9/29/2009 5,200 2.00 10,717<br />
9/29/2009 20,700 3.00 37,720<br />
(1) On September 29, 2009, the Board of Directors granted stock options under the Company’s 1999 Stock Option Plan to each of the named<br />
executive officers listed in the table with an exercise price of $3.00 per share for Incentive Stock Options, which was the closing price of<br />
the Company’s stock listed on NASDAQ on the grant date and $2.00 per share for Non-Qualified Options, which was based on a discount<br />
to the market price with that discount representing the value given to the officer in lieu of a raise. The options were granted subject to a<br />
two year cliff vesting and a five year option period. The fair value of the $2.00 options granted was estimated at $2.06 per share and the<br />
fair value of the $3.00 options granted was estimated at $1.82 per share based on the Black-Scholes option pricing model using the<br />
following assumptions:<br />
Risk-free interest rate: 2.98%<br />
Expected life of the option: 7 years<br />
Expected dividend yield: 0.00% Expected volatility: 58.28%<br />
121
The following table summarizes in tabular form the unexercised stock option awards for the Company’s named<br />
executive officers outstanding as of the end of the last completed fiscal year.<br />
Outstanding Equity Awards at Fiscal Year End<br />
December 31, 2009<br />
Option Awards<br />
Name<br />
Donald J. Torbert, Jr.<br />
1<br />
1<br />
1<br />
1<br />
1<br />
1<br />
1<br />
1<br />
2<br />
Option<br />
Grant Date<br />
Number of<br />
Securities<br />
Underlying<br />
Unexercised<br />
Options<br />
Exercisable (#)<br />
Number of<br />
Securities<br />
Underlying<br />
Unexercised<br />
Options<br />
Unexercisable<br />
(#)<br />
Option<br />
Exercise<br />
Price ($)<br />
Option<br />
Expiration<br />
Date<br />
01/01/01 1,530 0 $9.1912 01/01/11<br />
09/26/01 10,548 0 $10.3922 09/26/11<br />
08/02/02 5,304 0 $7.5490 08/02/12<br />
03/29/05 5,712 1,428 $13.8529 03/29/15<br />
12/19/06 3,672 2,448 $20.9314<br />
12/19/16<br />
12/18/07 3,060 4,590 $13.4608 12/18/17<br />
09/29/09 0 17,928<br />
$3.0000 09/29/16<br />
09/29/09 0 16,672 $3.0000 09/29/16<br />
09/29/09 0 11,600 $2.0000 09/29/16<br />
R. Wesley Fuller<br />
1<br />
1<br />
1<br />
1<br />
1<br />
1<br />
1<br />
2<br />
10/08/01 3,060<br />
0 $10.5882 10/08/11<br />
08/02/02 8,568<br />
0 $7.5490 08/02/12<br />
03/29/05 5,712 1,428 $13.8529 03/29/15<br />
12/19/06 3,672 2,448 $20.9314 12/19/16<br />
12/18/07 3,060 4,590 $13.4608 12/18/17<br />
09/29/09<br />
0 17,928 $3.0000 09/29/16<br />
09/29/09 0 5,172 $3.0000 09/29/16<br />
09/29/09 0 5,800 $2.0000 09/29/16<br />
1<br />
David H. Hammond 01/18/05 1,632<br />
408 $14.0392 01/18/15<br />
1<br />
1<br />
2<br />
12/19/06 612 408 $20.9314 12/19/16<br />
09/29/09 0 15,100 $3.0000 09/29/16<br />
09/29/09 0 3,800 $2.0000 09/29/16<br />
George D. Henderson<br />
1<br />
1<br />
1<br />
1<br />
1<br />
2<br />
01/01/02 3,570<br />
0 $9.8137 01/01/12<br />
08/02/02 9,792 0 $7.5490 08/02/12<br />
12/19/06 1,224 816 $20.9314 12/19/16<br />
12/18/07 2,448 3,672 $13.4608 12/18/17<br />
09/29/09 0 20,700 $3.0000 09/29/16<br />
09/29/09 0 5,200 $2.0000 09/29/16<br />
Nicole S. Stokes<br />
1<br />
1<br />
1<br />
1<br />
2<br />
12/05/05 1,223 306 $17.5098 12/05/15<br />
12/19/06 1,224 816 $20.9314 12/19/16<br />
12/18/07 1,020 1,530 $13.4608 12/18/17<br />
09/29/09 0 14,100 $3.0000 09/29/16<br />
09/29/09 0 3,600 $2.0000 09/29/16<br />
122
(1) The listed stock option grants were approved by the Board of Directors under the Company’s 1999 Stock Option Plan to each of the named<br />
executive officers listed. The option exercise prices are based on the closing price of the Company’s stock listed on NASDAQ on the grant<br />
date. These options were granted subject to a five-year ratable vesting schedule.<br />
(2) The listed stock option grants were approved by the Board of Directors under the Company’s 1999 Stock Option Plan to each of the named<br />
executive officers listed. The option exercise prices were based on a discount to the market price with that discount representing the value<br />
given to the officer in lieu of a raise. The options were granted subject to a two year cliff vesting and a five year option period.<br />
There were no exercises of stock options made by the Company’s named executive officers during the last completed<br />
fiscal year.<br />
Perquisites and Other Benefits<br />
The Compensation Committee periodically reviews the perquisites and other benefits available to executive<br />
management. As reflected in the Summary Compensation Table, the aggregate cost of these perquisites and other benefits<br />
was $800,030 in 2009, $63,253 in 2008 and $80,785 in 2007 for the named executive officers. Included in 2009 is<br />
$730,000 to Mr. Welsh for severance payments related to his termination of employment with the Company and $8,524 as<br />
a temporary living allowance to Mr. Hammond to offset his costs of relocating to Valdosta, Georgia. We have not made<br />
the $730,000 severance payment to Mr. Burke s<strong>inc</strong>e prior to making such payment we must receive permission from our<br />
regulators, which has not been granted at this time. Other elements more fully described below <strong>inc</strong>lude 401(k) plan<br />
matching and profit-sharing contributions, stock purchase program matching contributions and other employee and<br />
medical benefits. Finally, s<strong>inc</strong>e routine business travel and mobile telecommunications access are often necessary, the<br />
Company provides senior management (<strong>inc</strong>luding the named executive officers) with monthly auto and cell phone<br />
allowances to compensate them for their use of personal assets for business purposes.<br />
As mentioned above, the Company offers a 401(k) plan to eligible employees (<strong>inc</strong>luding the named executive<br />
officers). The 401(k) plan allows participants to defer a portion of their compensation and provides that the Company<br />
may match a portion of the participants’ deferred compensation. In 2009, the Company matched 75 cents for every dollar<br />
contributed by a participant up to an annual threshold equal to the lesser of 6% of each participant’s eligible compensation<br />
or the limit established by the Internal Revenue Service for 401(k) plans. The plan also provides for non-elective and<br />
discretionary profit sharing contributions to be made by the Company at the sole discretion of the Board of Directors. In<br />
the first quarter of 2008, approximately 3.0% of each participant’s eligible compensation was contributed as the<br />
discretionary profit sharing contributions for fiscal year 2007. The Company did not contribute a discretionary profit<br />
sharing contribution for fiscal year 2008 or 2009.<br />
The Company also offers an Employee and Director Stock Purchase Program to eligible employees (<strong>inc</strong>luding the<br />
named executive officers) and directors as a convenient means of purchasing for long term investment, and not for short<br />
term speculative gain, the common stock of the Company and thereby promote interest in the Company’s continuing<br />
success, growth and development. The program allows for a participant to purchase up to a maximum of $2,000 per year<br />
of the Company’s common stock with the Company matching 50% of the participant’s purchase.<br />
Executive management is also eligible to participate in the Company’s other benefit plans on the same terms as<br />
other employees. These plans <strong>inc</strong>lude paid vacation leave, medical and dental insurance, annual physical examinations,<br />
employee assistance programs, employee and dependant group term life insurance, and employee and spousal disability<br />
insurance.<br />
123
Potential Payments Upon Termination or Change in Control<br />
The Company has employment agreements with Mr. Torbert, Mr. Fuller, Mr. Henderson and Ms. Stokes. The<br />
terms of these agreements regarding potential payments upon termination or a change in control of the Company are<br />
essentially the same. The Compensation Committee believes that it is important to protect these officers in the event of a<br />
change in control. Further, it is the Compensation Committee’s belief that the interests of stockholders will be best served<br />
if the interests of executive management are aligned with them, and providing change in control benefits should eliminate,<br />
or at least reduce, the reluctance of executive management to pursue potential change in control transactions that may be in<br />
the best interests of shareholders. In May of 2008, the Compensation Committee negotiated new employment agreements<br />
for the certain executive officers to address “best practice” suggestions made by compensation consultants and to adopt<br />
recent tax law changes. Although these contracts are still outstanding, under the terms of the Written Agreement, any<br />
severance payments under these contracts would require prior approval from the Company’s banking regulators.<br />
For purposes of the benefits provided in the existing agreements, a change in control is deemed to occur, in<br />
general, if (i) a shareholder or group of shareholders (with certain exceptions provided) acquires 25% or more of the<br />
Company’s or the Bank’s common stock, (ii) during any period of up to two years, individuals who, at the beginning of<br />
such period, are directors of the Company or the Bank cease to constitute at least a majority of the board of directors<br />
thereof (with certain exceptions provided), or (iii) the stockholders of the Company or the Bank approve a merger or<br />
consolidation of the Company or the Bank with any other corporation other than a merger or consolidation (with certain<br />
exceptions provided) where at least 51% of the combined voting power of the surviving entity is controlled by the<br />
Company or the Company’s stockholders.<br />
In the event of a change in control of the Company followed by a (i) reduction in the officers’ compensation, (ii)<br />
material change in the officers’ status, office, title or reporting requirements, (iii) failure by the Company to <strong>inc</strong>rease the<br />
officers’ salary in accordance with established procedures, or (iv) required relocation by the officers of more than 50 miles<br />
from the officers’ current office, Mr. Torbert and Mr. Fuller will be entitled to receive severance benefits in a lump sum<br />
cash amount equal to two times each officer’s total annual compensation for the fiscal year under the employment<br />
agreement in which his compensation was the highest, plus a gross up for potential excise taxes imposed by the Internal<br />
Revenue Code Section 280G if applicable. Mr. Henderson will be entitled to receive severance benefits in a lump sum<br />
cash amount equal to two times his average annual compensation for the five calendar years preceding the date of the<br />
change in control, plus a gross up for potential excise taxes imposed by the Internal Revenue Code Section 280G if<br />
applicable. Ms. Stokes will be entitled to receive severance benefits in a lump sum cash amount equal to her average<br />
annual compensation for the five calendar years preceding the date of the change in control, plus a gross up for potential<br />
excise taxes imposed by the Internal Revenue Code Section 280G if applicable. Further, on the occurrence of a change in<br />
control of the Company, any unvested stock options previously granted to Mr. Torbert, Mr. Fuller, Mr. Henderson and Ms.<br />
Stokes will be accelerated and fully vested.<br />
In the event that any of these executive officers’ employment is terminated (i) by the Company other than for<br />
“cause” (such as a material breach of the employment agreement, gross negligence or willful misconduct by the officer), or<br />
(ii) due to the Company’s breach of the employment agreement, Mr. Torbert and Mr. Fuller will be entitled to receive<br />
severance benefits in a lump sum cash amount equal to two times their base salary. Mr. Henderson will be entitled to<br />
receive severance benefits in a lump sum cash amount equal to his average annual compensation for the five calendar<br />
years preceding the date of termination. Ms. Stokes will be will be entitled to receive severance benefits in a lump sum<br />
cash amount equal to one-half her average annual compensation for the five calendar years preceding the date of<br />
termination.<br />
The employment agreements restrict the officers from, among other things, (i) disclosing confidential<br />
information, (ii) competing with the Company or the Bank within a defined territory for 12 months following termination,<br />
and (iii) employing any former employee of the Company or the Bank for 12 months following the employee’s<br />
termination.<br />
The following table summarizes in tabular form the potential post-employment payments due to the executive<br />
officers with employment agreements upon termination or a change in control of the Company assuming those events<br />
occurred on the last business day of the last fiscal year.<br />
124
Potential Payments Upon Termination or Change in Control<br />
As of December 31, 2009<br />
Name<br />
Benefit<br />
Before Change<br />
in Control<br />
Termination<br />
w/o Cause or<br />
for Good<br />
Reason 1<br />
After Change in<br />
Control<br />
Termination w/o<br />
Cause or for<br />
Good Reason 2<br />
Voluntary<br />
Termination<br />
Death or<br />
Disability<br />
Change in<br />
Control<br />
($) ($) ($) ($) ($)<br />
Donald J. Torbert, Jr.<br />
Contract termination<br />
payment<br />
345,560 605,616 - - -<br />
Stock option vesting<br />
3 27,104 27,104 - 27,104 27,104<br />
acceleration<br />
IRC Sec. 280G excise tax<br />
gross-up<br />
Double gross-up to officer<br />
for excise tax and <strong>inc</strong>ome<br />
tax on the gross-up 4<br />
-<br />
126,544 - - -<br />
- 154,665 - - -<br />
Total 372,664 913,929 - 27,104 27,104<br />
R. Wesley Fuller<br />
Contract termination<br />
payment<br />
345,560 608,060 - - -<br />
Stock option vesting<br />
acceleration 3 16,792 16,792 - 16,792 16,792<br />
IRC Sec. 280G excise tax<br />
gross-up<br />
- 124,970 - - -<br />
Double gross-up to officer<br />
for excise tax and <strong>inc</strong>ome<br />
- 152,742 - - -<br />
tax on the gross-up 4<br />
Total 362,352 902,564 - 16,792 16,792<br />
George D. Henderson<br />
Contract termination<br />
payment<br />
176,448 352,897 - - -<br />
Stock option vesting<br />
acceleration 3 14,882 14,882 - 14,882 14,882<br />
IRC Sec. 280G excise tax<br />
gross-up<br />
- - -<br />
- -<br />
Double gross-up to officer<br />
for excise tax and <strong>inc</strong>ome<br />
- - - -<br />
-<br />
tax on the gross-up 4<br />
Total<br />
191,330 367,779 - 14,882 14,882<br />
Nicole S. Stokes<br />
Contract termination<br />
payment<br />
50,269<br />
100,538 - - -<br />
Stock option vesting<br />
10,080 - 10,080<br />
acceleration 3 10,080 10,080<br />
IRC Sec. 280G excise tax<br />
gross-up<br />
Double gross-up to officer<br />
for excise tax and <strong>inc</strong>ome<br />
4<br />
tax on the gross-up<br />
-<br />
- - - -<br />
- - - -<br />
-<br />
Total 60,349 110,618 - 10,080 10,080<br />
125
(1) The Company’s contractual obligation for terminating an officer’s employment agreement before a change in control event without cause is payable<br />
as a lump sum payment within 30 days of termination.<br />
(2) The Company’s contractual obligation for terminating an officer's employment agreement after a change in control event without cause is payable<br />
as a lump sum payment within 30 days of termination.<br />
(3) Value is calculated using the safe harbor valuation method outlined in Internal Revenue Bulletin 2003-34 and a $2.20 stock price as of December<br />
31, 2009.<br />
(4) Assuming a 35% individual <strong>inc</strong>ome tax rate.<br />
Director Compensation<br />
For the 2008 fiscal year and through February 2009, the directors of the Company were paid director’s fees of<br />
$1,000 per meeting of the full Board of Directors, $750 per meeting of the Audit Committee and $400 per meeting of the<br />
Compensation Committee, Governance Committee and Nominating Committee. In addition, non-employee directors were<br />
paid a $10,000 annual retainer and were granted 2,000 stock options as a non-cash retainer fee on the first business day of<br />
the 2009 fiscal year. The Company also paid annual Chairman and Committee Chairman retainers as follows: Chairman<br />
of the Board of Directors $5,000; Audit Committee Chairman $8,000; Compensation Committee Chairman $1,200;<br />
Governance Committee Chairman $400 and Nominating Committee Chairman $400. In addition, non-employee directors<br />
were granted 2,000 stock options as a non-cash retainer fee on the first business day of the 2008 fiscal year.<br />
In March 2009, the Board of Directors voted to decrease its board and committee fees by 25% due to the<br />
operating losses of the Company. S<strong>inc</strong>e March 2009, the directors of the Company have been paid director’s fees of $750<br />
per meeting of the full Board of Directors, $562.50 per meeting of the Audit Committee and $300 per meeting of the<br />
Compensation Committee, Nominating Committee and Compliance Committee. The Executive Committee waived<br />
payment of fees for all of its 2009 meetings. In addition, non-employee directors were paid a $7,500 annual retainer and<br />
were granted 2,000 stock options as a non-cash retainer fee on the first business day of the 2009 fiscal year. The Company<br />
also paid annual Chairman and Committee Chairman retainers as follows: Chairman of the Board of Directors $3,750;<br />
Audit Committee Chairman $6,000; Compensation Committee Chairman $900; Executive Committee Chairman $300 and<br />
Nominating Committee Chairman $300. The Company has agreed to pay its Vice Chairman, Mr. Kurrie, cash fees of<br />
$10,000 per month until the management activities of Mr. Kurrie are terminated by the Executive Committee of the Board<br />
of Directors, at which time the regular director fees shall become payable. Mr. Kurrie was elected to the Board of<br />
Directors on April 1, 2009 for the purpose of reorganizing and developing the management structure of the Company,<br />
changing the banking culture and establishing and supervising the strategic planning process of the Company, supervising<br />
the activities of executive management, and regularly informing the Board of Directors of the progress of the Company in<br />
these matters. In his capacity as Vice Chairman, Mr. Kurrie does not have any individual authority to initiate or approve<br />
banking or other transactions.<br />
126
The following table summarizes in tabular form the compensation awarded to, earned by, or paid to the<br />
Company’s directors other than Mr. Welsh, whose compensation for services rendered as a director are reported in the<br />
Executive Officer Summary Compensation Table, for the last completed fiscal year.<br />
Director Compensation Table<br />
For the Fiscal Year Ended December 31, 2009<br />
Name<br />
Fees<br />
Earned<br />
or Paid<br />
in Cash<br />
Option<br />
Awards 1<br />
All Other<br />
Compensation<br />
Total<br />
($) ($) ($)<br />
($)<br />
R. Bradford Burnette 32,556 4,649<br />
Walter W. Carroll, II<br />
(3)<br />
165,087 (2) 202,292<br />
29,850 4,649 - 34,499<br />
James L. Dewar, Jr. 35,450 4,649 25,000 (4) 65,099<br />
James W. Godbee, Jr. 24,788 4,649 - 29,437<br />
Michael H. Godwin 30,556 4,649 - 35,205<br />
Thompson Kurrie, Jr. 101,000 110,705 (5) - 211,705<br />
James B. Lanier, Jr. 31,113 4,649 - 35,762<br />
John E. Mansfield, Jr. 29,950 4,649 - 34,599<br />
Kennith D. McLeod 40,699 4,649 - 45,348<br />
Douglas W. McNeill 31,655 4,649 - 36,304<br />
Paul E. Parker 32,050 4,649 - 36,699<br />
F. Ferrell Scruggs, Sr. (3) 20,025 4,649 - 24,674<br />
Joe P. Singletary, Jr. (3) 15,317 4,649 - 19,966<br />
David K. Williams (3) 36,025 4,649 -<br />
40,674<br />
(1) As an annual retainer, the nonemployee members of the Board of Directors of the Company are granted 2,000 stock options<br />
on the first business day of each year that they serve on the Board of Directors. The values disclosed in the table represent<br />
the aggregate grant date fair value of awards computed in accordance with FASB Accounting Standards Codification Topic<br />
718 for options granted in 2009 under the Company’s 1999 Stock Option Plan. For further discussion and details regarding<br />
the accounting treatment and underlying assumptions relative to stock-based compensation, see Note 18, “Stock Plans and<br />
Stock-based Employee Compensation,” of the notes to Consolidated <strong>Financial</strong> Statements <strong>inc</strong>luded in Part II, Item 8,<br />
“<strong>Financial</strong> Statements and Supplementary Data.”<br />
The aggregate number of stock options outstanding for each director listed in the table as of December 31, 2009 follows: Mr.<br />
Burnette 24,400; Mr. Carroll 18,320; Mr. Dewar 22,360; Mr. Godbee 5,361; Mr. Godwin 16,240; Mr. Kurrie 60,160, Mr.<br />
Lanier 22,360; Mr. Mansfield 12,160; Mr. McLeod 12,976; Mr. McNeill 11,344; Mr. Parker 22,360; Mr. Scruggs 22,360;<br />
Mr. Singletary 20,360; and Mr. Williams 0.<br />
(2) The Company entered into a salary continuation agreement with Mr. Burnette while he was employed as an executive of the<br />
Company that would provide Mr. Burnette with $165,087 per year for 15 years commencing when Mr. Burnette turned age<br />
65. At December 31, 2009, the net present value of the remaining payments due to Mr. Burnette was $1,220,539 using a<br />
discount rate of 6.36%.<br />
(3) David K. Williams resigned from the Board of Directors of the Company and the Bank on September 29, 2009 and Walter<br />
W. Carroll, II unexpectedly passed away on December 20, 2009. F. Ferrell Scruggs, Sr. will retire at the Annual Meeting.<br />
(4) Includes $25,000 contributed by the Bank to Valdosta State University in 2009. In 2005, the Board of Directors of the Bank<br />
authorized the Bank to pledge $500,000 to Valdosta State University in honor of Mr. Dewar’s parents, Mr. James L. Dewar,<br />
Sr., the founder of the Bank and the Company, and Mrs. Dorothy H. Dewar. Mr. Dewar was not present during the<br />
deliberation and vote authorizing the pledge. At December 31, 2009, a balance of $125,000 remained payable on the pledge.<br />
(5) Mr. Kurrie was also granted stock options to purchase 50,000 shares of the Company’s common stock with an exercise price<br />
of $3.00 per share. The options were granted pursuant to the Registrant’s 1999 Stock Option Plan and will expire ten years<br />
after the grant date. The options will vest based on the market performance of the Company’s common stock as follows:<br />
5,000 shares when the Company’s common stock trading price on the NASDAQ Stock Market reaches $4.50 per share;<br />
5,000 shares when the Company’s common stock trading price on the NASDAQ Stock Market reaches $6.00 per share;<br />
10,000 shares when the Company’s common stock trading price on the NASDAQ Stock Market reaches $9.00 per share; and<br />
30,000 shares when the Company’s common stock trading price on the NASDAQ Stock Market reaches $12.00 per share.<br />
127
ITEM 12. SECURITY OWNERSHIP OF CERTAIN BENEFICIAL OWNERS<br />
AND MANAGEMENT AND RELATED STOCKHOLDER MATTERS<br />
PRINCIPAL SHAREHOLDERS<br />
The following table sets forth certain information regarding the shares of the Company’s common stock owned as<br />
of February 28, 2010, (a) by each person who beneficially owned more than 5% of the shares of the Company’s common<br />
stock, (b) by each of the Company’s directors and named executive officers, and (c) by all of the Company’s directors and<br />
executive officers as a group.<br />
Name of Beneficial Owner (1)<br />
Number of<br />
Shares<br />
Percentage<br />
Ownership (2)<br />
R. Bradford Burnette 221,353 (3) 1.45<br />
Dewar Family, L.P. 1,659,310 (4) 10.88<br />
James L. Dewar, Jr. 2,932,616 (5) 19.22<br />
R. Wesley Fuller 87,667 (6) *<br />
James W. Godbee, Jr. 38,354<br />
Michael H. Godwin<br />
Kennith D. McLeod 217,216 (16) 1.42<br />
(17)<br />
Douglas W. McNeill<br />
241,313<br />
1.58<br />
Paul E. Parker 82,626 (18) *<br />
(7)<br />
*<br />
95,997 (8) *<br />
GreenSky Trade Credit, LLC 1,240,000 (9) 8.13<br />
David H. Hammond 3,747 (10) *<br />
George D. Henderson 67,198 (11) *<br />
Judith S. Kelly 26,178 (12) *<br />
Thompson Kurrie, Jr. 63,472 (13) *<br />
James B. Lanier, Jr. 53,833 (14) *<br />
John E. Mansfield, Jr. 155,495 (15) 1.02<br />
F. Ferrell Scruggs, Sr. 134,604 (19)<br />
Nicole S. Stokes 5,065 (20)<br />
Donald J. Torbert, Jr. 43,724 (21) *<br />
All directors and executive officers<br />
as a group (17 persons) 4,470,458 29.31<br />
* Less than 1 percent.<br />
_______________<br />
(1) Under the rules of the SEC, a person is deemed to be a beneficial owner of a security if he or she has or shares<br />
the power to vote or to direct the voting of such security, or the power to dispose or to direct the disposition of<br />
such security. A person is also deemed to be a beneficial owner of any securities owned by such person’s<br />
spouse, children or relatives living in the same household. Accordingly, more than one person may be deemed<br />
to be a beneficial owner of the same securities. A person is also deemed to be a beneficial owner of any<br />
securities that such person has the right to acquire beneficial ownership of within 60 days. Unless otherwise<br />
indicated, the persons named in the above table have sole voting and investment power with respect to all<br />
shares shown as beneficially owned by them. The information as to beneficial ownership has been provided by<br />
the respective persons listed in the above table.<br />
(2) Based on 13,795,040 shares outstanding as of February 28, 2010 plus shares underlying outstanding stock<br />
options or warrants which are exercisable within 60 days of such date are deemed to be outstanding for<br />
purposes of calculating the percentage owned by such holder.<br />
(3) Includes 5,878 shares held by Mr. Burnette’s wife and 6,642 shares held for Mr. Burnette’s minor<br />
grandchildren by Mr. Burnette’s wife as custodian. Mr. Burnette disclaims beneficial ownership of those shares<br />
held by his wife. Also <strong>inc</strong>ludes 20,000 common stock warrants and 12,232 options exercisable within 60 days.<br />
(4) The Dewar Family, L.P. is a limited partnership and Mr. Dewar, Jr., is its general partner. The mailing address<br />
is P.O. Box 2285, Valdosta, Georgia 31604.<br />
*<br />
*<br />
128
(5) Includes 1,659,310 shares owned by the Dewar Family, L.P. Mr. Dewar, Jr. is a general partner of the Dewar<br />
Family, L.P. and possesses the sole power to vote all shares owned by the limited partnership. Also <strong>inc</strong>ludes<br />
240,000 common stock warrants, 14,272 options exercisable within 60 days and 6,486 shares held by Mr.<br />
Dewar, Jr.’s wife. Includes 1,020 shares held by Mr. Dewar, Jr.’s wife and stepchildren. Mr. Dewar, Jr.<br />
disclaims beneficial ownership of the shares held by his wife and those held by his wife and stepchildren. Mr.<br />
Dewar, Jr.’s mailing address is P. O. Box 2285, Valdosta, Georgia 31604.<br />
(6) Includes 8,000 common stock warrants and 25,500 options exercisable within 60 days. Also <strong>inc</strong>ludes 236<br />
shares held by Mr. Fuller’s minor children, over which shares Mr. Fuller has custodial power.<br />
(7) Includes 8,000 common stock warrants and 673 options exercisable within 60 days.<br />
(8) Includes 16,000 common stock warrants and 8,968 options exercisable within 60 days.<br />
(9) Includes 240,000 common stock warrants. The mailing address for GreenSky Trade Credit, LLC is 1797<br />
Northeast Expressway NE, Suite 100 Atlanta, Georgia 30329.<br />
(10) Includes 2,652 options exercisable within 60 days.<br />
(11) Includes 479 shares held by Mr. Henderson’s son, of which Mr. Henderson disclaims beneficial ownership.<br />
Also <strong>inc</strong>ludes 8,000 common stock warrants and 17,034 options exercisable within 60 days.<br />
(12) Includes 12,472 options exercisable within 60 days.<br />
(13) Includes 10,400 common stock warrants and 6,120 options exercisable within 60 days.<br />
(14) Includes 4,000 common stock warrants and 14,272 options exercisable within 60 days.<br />
(15) Includes 98,461 shares held in a family partnership, of which shares Mr. Mansfield has sole voting<br />
power. Also, <strong>inc</strong>ludes 8,000 common stock warrants, 6,112 options exercisable within 60 days and 1,582<br />
shares held by Mr. Mansfield’s minor children, over which shares Mr. Mansfield has custodial power.<br />
(16) Includes 33,782 shares held by Mr. McLeod’s wife, of which shares Mr. McLeod disclaims beneficial<br />
ownership. Also <strong>inc</strong>ludes 20,000 common stock warrants and 6,928 options exercisable within 60 days.<br />
(17) Includes 40,000 common stock warrants and 5,296 options exercisable within 60 days.<br />
(18) Includes 5,920 common stock warrants and 14,272 options exercisable within 60 days.<br />
(19) Includes 16,440 shares held by Mr. Scruggs’ wife, of which shares Mr. Scruggs disclaims beneficial ownership<br />
and 14,619 shares held by a family limited partnership. Also <strong>inc</strong>ludes 8,000 common stock warrants and<br />
14,272 options exercisable within 60 days.<br />
(20) Includes 3,467 options exercisable within 60 days.<br />
(21) Includes 800 common stock warrants and 31,254 options exercisable within 60 days.<br />
Equity Compensation Plan Information<br />
The following table summarizes the Company’s equity compensation plans as of December 31, 2009:<br />
Plan Category<br />
Equity Compensation Plans<br />
Number of Securities to be Issued<br />
Upon Exercise of Outstanding<br />
Options, Warrants and Rights<br />
Weighted-Average Exercise Price<br />
of Outstanding Options, Warrants<br />
and Rights<br />
Number of Securities Remaining<br />
Available for Future Issuance under<br />
Equity Compensation Plans*<br />
Approved by Security Holders 912,563 $8.52 403,283<br />
Equity Compensation Plans Not<br />
Approved by Security Holders<br />
n/a<br />
n/a<br />
n/a<br />
*excluding securities reflected in the first column<br />
In addition to the equity compensation plans approved by our stockholders, we have the Employee and Director Stock<br />
Purchase Program (the “SPP”). The Bank, serving as the SPP custodian, uses funds contributed from employees and<br />
directors up to an amount specified in the SPP, matched by the Company at a rate of 50%, to purchase shares of our<br />
common stock. A participant may request a distribution of his or her entire account at any time. A participant’s<br />
participation in the SPP terminates immediately upon termination of employment or director status. The SPP is<br />
administered by a committee appointed by the Board of Directors. We may amend or terminate the SPP or suspend the<br />
employer matching contributions at any time. For more information about the SPP, see Note 17 in the accompanying<br />
Notes to the Consolidated <strong>Financial</strong> Statements in Item 8 of this Report.<br />
129
ITEM 13. CERTAIN RELATIONSHIPS AND RELATED TRANSACTIONS, AND DIRECTOR<br />
INDEPENDENCE<br />
Certain of the officers, directors and shareholders of PAB and the Bank, and affiliates of such persons, have from time to<br />
time engaged in banking transactions with the Bank. We expect those persons to continue those transactions in the future.<br />
Any loans or other extensions of credit the Bank made to those individuals were made in the ordinary course of business<br />
on substantially the same terms, <strong>inc</strong>luding interest rates and collateral, as those prevailing at the time for comparable<br />
transactions with unaffiliated third parties and did not involve more than the normal risk of collectability or present other<br />
unfavorable features. At December 31, 2008 and December 31, 2009, loans outstanding to our officers and directors<br />
named in this report and their affiliates amounted to an aggregate of $37,948,775 and $20,836,001, respectively.<br />
In 2005, the Board of Directors of the Bank authorized the Bank to pledge $500,000 to Valdosta State University in honor<br />
of Mr. James L. Dewar, Sr., the founder of the Bank and PAB, and Mrs. Dorothy H. Dewar. Mr. and Mrs. Dewar are the<br />
parents of James L. Dewar, Jr. Mr. Dewar was not present during the deliberation and vote authorizing the pledge. During<br />
2008 and 2009, the Bank contributed $25,000 each year towards satisfying the pledge. At December 31, 2009, a balance<br />
of $125,000 remained on the pledge.<br />
Thompson Kurrie, Jr., a director, is a partner in the law firm of Coleman Talley LLP., which provides various legal<br />
services to us. During 2009, we paid Coleman Talley LLP approximately $271,000 in fees and expenses for legal<br />
services.<br />
Walter W. Carroll, II, a director until he passed away on December 20, 2009, was the owner of Carroll Investment Group,<br />
LLC. In August 2009, we engaged Carroll Investment Group, LLC to serve as our outside real estate advisors for the<br />
management, marketing and disposition of our other real estate owned. Under the terms of our engagement, we will pay<br />
Carroll Investment Group an annual fee of $100,000 and a bonus for certain properties sold during the engagement. The<br />
bonus will be equal to the greater of 1% of the sales price or any commissions that Carroll Investment Group is entitled to<br />
receive via its brokerage services, of which PAB will receive a refund of one-half of Carroll Investment Group’s portion in<br />
excess of 1% of the sales price of that property. Our agreement with Carroll Investment Group has an initial term of one<br />
year and will automatically renew for 3-month successive periods until either we or Carroll Investment Group terminates<br />
the agreement.<br />
On March 5, 2009, the Bank entered into a Receivables Origination Agreement and a Servicing Agreement with GreenSky<br />
Trade Credit, LLC. Under terms of the agreement, the Bank agreed to fund up to $30,000,000 in eligible business credit<br />
card and other credit account receivables that conform with the Bank’s credit criteria. GreenSky Trade Credit, LLC<br />
processes payments and advances and authorizes transactions under the Servicing Agreement and is paid a fee for those<br />
services.<br />
We issued warrants for the purchase of 1,072,060 shares of our common stock at an exercise price of $3.75 per share for a<br />
term of seven years in our two private placements completed in September 2009. Following the completion of our<br />
anticipated public offering, we intend to modify the warrants issued in the private placements to provide the warrant<br />
holders with an enhanced economic benefit for their earlier investment. We propose to offer to each warrant holder the<br />
opportunity to exchange the holder’s existing warrant for a new warrant with: a reduced exercise price equal to 125% of<br />
the offering price of the shares of common stock sold in the public offering; an <strong>inc</strong>reased number of shares that may be<br />
purchased under the warrant; and a shortened term of five years. In evaluating this transaction, our Board of Directors<br />
engaged an outside firm to perform a valuation analysis. Certain of our related parties may participate in the warrant<br />
exchange for an economic benefit that may exceed $120,000, though the exact amount of such benefit cannot be<br />
determined at this time. The warrants held by members of our Board of Directors and executive officers will not be<br />
modified and will remain under the terms of their initial issuance; however, relatives of certain of our members of our<br />
Board of Directors and executive officers may participate in the warrant exchange. Members of our Board of Directors<br />
who have relatives that may participate in the warrant exchange did not participate in the vote of the Board of Directors<br />
approving the warrant modification.<br />
130
All related party transactions set forth above were subject to review by management and required approval by the Audit<br />
Committee or our disinterested directors. We believe that the terms for all of these related party transactions are at least as<br />
favorable as those that could be obtained from a third party. All future related party transactions will require approval by<br />
the Audit Committee for potential conflict of interest situations, as permitted under NASDAQ Listing Standards Rule<br />
5630(a). The term “related party transaction” is generally defined as any transaction, s<strong>inc</strong>e January 1, 2008, or any<br />
currently proposed transaction, in which we were or are to be a participant and the amount involved exceeds $120,000, and<br />
in which any related person had or will have a direct or indirect material interest. A “related person” is any director,<br />
director nominee, or executive officer of PAB, any holder of more than 5% of the outstanding voting securities of PAB, or<br />
any immediate family member of the foregoing persons will have a direct or indirect interest. The term <strong>inc</strong>ludes most<br />
financial transactions and arrangements, such as loans, guarantees and sales of property, and remuneration for services<br />
rendered (as an employee, consultant or otherwise) to PAB.<br />
ITEM 14. PRINCIPAL ACCOUNTANT FEES AND SERVICES<br />
THE FOLLOWING REPORT OF THE AUDIT COMMITTEE SHALL NOT BE DEEMED TO BE SOLICITING<br />
MATERIAL OR TO BE INCORPORATED BY REFERENCE IN ANY PREVIOUS OR FUTURE DOCUMENTS<br />
FILED BY THE COMPANY WITH THE SECURITIES AND EXCHANGE COMMISSION UNDER THE<br />
SECURITIES ACT OF 1933 OR THE EXCHANGE ACT, EXCEPT TO THE EXTENT THAT THE COMPANY<br />
EXPRESSLY INCORPORATES SAID REPORTS BY REFERENCE IN ANY SUCH DOCUMENT.<br />
INDEPENDENT AUDITORS<br />
Our Board of Directors, upon the recommendation of our Audit Committee, has appointed Mauldin & Jenkins as<br />
independent auditors for the fiscal year ending December 31, 2010. Mauldin & Jenkins audited the consolidated financial<br />
statements of the Company for the 2009 fiscal year. We have been advised that a representative of Mauldin & Jenkins will<br />
be present at the Annual Meeting, will be given an opportunity to speak, and will be available to answer appropriate<br />
questions.<br />
Audit Fees<br />
The aggregate fees billed and to be billed by Mauldin & Jenkins for professional services rendered for the audit of<br />
the Company’s annual financial statements for fiscal year 2009, the review and attestation of management’s assertions<br />
related to the Company’s internal control over financial reporting and the reviews of the financial statements <strong>inc</strong>luded in<br />
the Company’s Forms 10-Q for such fiscal year were $188,000. The aggregate fees billed by Mauldin & Jenkins for<br />
professional services rendered for the audit of the Company’s annual financial statements for fiscal year 2008, the review<br />
and attestation of management’s assertions related to the Company’s internal controls over financial reporting and the<br />
reviews of the financial statements <strong>inc</strong>luded in the Company’s Forms 10-Q for such fiscal year were $132,500.<br />
Audit-Related Fees<br />
The aggregate fees, other than those disclosed under the caption Audit Fees above, billed by Mauldin & Jenkins<br />
for assurance and related services reasonably related to the performance of the audit or review of the financial statements<br />
for fiscal year 2009 were $3,000. There were no aggregate fees, other than those disclosed under the caption Audit Fees<br />
above, billed and to be billed by Mauldin & Jenkins for consultations regarding accounting standards, reporting issues and<br />
due diligence assistance services for fiscal year 2008.<br />
Tax Fees<br />
The aggregate fees billed and to be billed by Mauldin & Jenkins for professional services rendered for tax<br />
compliance, tax advice and tax planning were $16,101 for fiscal year 2009 and $20,980 for fiscal year 2008. Such fees<br />
were pr<strong>inc</strong>ipally paid for tax compliance services performed by Mauldin & Jenkins.<br />
All Other Fees<br />
There were no fees billed by Mauldin & Jenkins for professional services rendered other than as stated under the<br />
captions Audit Fees, Audit-Related Fees and Tax Fees above for fiscal year 2009 and for fiscal year 2008.<br />
The Audit Committee pre-approves all auditing services and permitted non-audit services (<strong>inc</strong>luding the fees and<br />
terms) to be performed for the Company by its independent auditors, subject to the de minimus exceptions for non-audit<br />
services described in Section 10A(i)(1)(B) of the Exchange Act, which should be approved by the Audit Committee. The<br />
Audit Committee approved 100% of the services performed by Mauldin & Jenkins in 2009.<br />
131
PART IV<br />
ITEM 15. EXHIBITS AND FINANCIAL STATEMENT SCHEDULES<br />
1. <strong>Financial</strong> Statements.<br />
The consolidated financial statements, notes thereto and auditor's report thereon, filed as part hereof, are<br />
listed in the Index to Item 8 of this Report.<br />
2. <strong>Financial</strong> Statement Schedules.<br />
All schedules are omitted as the required information is inapplicable or the information is presented in the<br />
financial statements or related notes.<br />
3. Exhibits.<br />
Exhibit No.<br />
Description<br />
2.1 Purchase and Assumption Agreement between HeritageBank of the South and The Park Avenue Bank<br />
dated as of February 23, 2010 (<strong>inc</strong>orporated by reference to Exhibit 2.1 to the Registrant’s Current<br />
Report on Form 8-K filed February 25, 2010).<br />
3.1 Amended and Restated Articles of Incorporation (restated for SEC filing purposes only).<br />
3.2 Amended and Restated Bylaws (<strong>inc</strong>orporated by reference to Exhibit 3.2 to the Registrant’s Current<br />
Report on Form 8-K dated May 18, 2009).<br />
4.1 Amended and Restated Trust Agreement among PAB Bankshares, Inc., as Depositor, Wilmington Trust<br />
Company, as Property Trustee and Delaware Trustee, and the Administrative Trustees named therein<br />
dated as of October 5, 2006 (<strong>inc</strong>orporated by reference to Exhibit 4.1 to the Registrant’s Current Report<br />
on Form 8-K dated October 6, 2006).<br />
4.2 Junior Subordinated Indenture between PAB Bankshares, Inc. and Wilmington Trust Company, as<br />
Trustee dated as of October 5, 2006 (<strong>inc</strong>orporated by reference to Exhibit 4.2 to the Registrant’s Current<br />
Report on Form 8-K dated October 6, 2006).<br />
4.3 Guarantee Agreement between PAB Bankshares, Inc., as Guarantor, and Wilmington Trust Company, as<br />
Guarantee Trustee dated as of October 5, 2006 (<strong>inc</strong>orporated by reference to Exhibit 4.3 to the<br />
Registrant’s Current Report on Form 8-K dated October 6, 2006).<br />
4.4 Specimen Certificate for Shares of Common Stock (<strong>inc</strong>orporated by reference to Exhibit 4.4 to the<br />
Registrant’s Registration Statement on Form S-1 dated October 2, 2009).<br />
10.1 PAB Bankshares, Inc. Fourth Amended and Restated Dividend Reinvestment and Common Stock<br />
Purchase Plan (<strong>inc</strong>orporated by reference to Exhibit 10.1 to the Registrant’s Annual Report on Form 10-<br />
K for the fiscal year ended December 31, 2007).<br />
10.2 PAB Bankshares, Inc. 1994 Employee Stock Option Plan, as amended (<strong>inc</strong>orporated by reference to<br />
Exhibit 10.3 to the Registrant's Annual Report on Form 10-K for the fiscal year ended December 31,<br />
1998).<br />
10.3 Form of Executive Salary Continuation Agreement, with attached Schedule of Terms (<strong>inc</strong>orporated by<br />
reference to Exhibit 10.5 to the Registrant's Annual Report on Form 10-K for the fiscal year ended<br />
December 31, 1998).<br />
10.4 PAB Bankshares, Inc. 1999 Stock Option Plan, as amended and restated (<strong>inc</strong>orporated by reference to<br />
Exhibit 10.1 to the Registrant's Registration Statement on Form S-8 (No. 333-137316) filed with the<br />
Commission on September 14, 2006).<br />
132
10.5 Rescission Agreement, dated December 31, 2001, by and between R. Bradford Burnette and the<br />
Registrant (<strong>inc</strong>orporated by reference to Exhibit 10.10 to the Registrant’s Annual Report on Form 10-K<br />
for the fiscal year ended December 31, 2001).<br />
10.6 PAB Bankshares, Inc. Employee and Director Stock Purchase Program, dated July 1, 2002 and amended<br />
March 25, 2003 (<strong>inc</strong>orporated by reference to Exhibit 10.9 to the Registrant’s Annual Report on Form<br />
10-K for the fiscal year ended December 31, 2002).<br />
10.7 Employment Agreement, dated May 1, 2008, by and between M. Burke Welsh, Jr., the Bank and the<br />
Registrant (<strong>inc</strong>orporated by reference to Exhibit 10.9 to the Registrant’s Current Report on Form 8-K<br />
dated May 1, 2008).<br />
10.8 Employment Agreement, dated January 1, 2003, by and between R. Wesley Fuller and the Bank<br />
(<strong>inc</strong>orporated by reference to Exhibit 10.12 to the Registrant’s Annual Report on Form 10-K for the<br />
fiscal year ended December 31, 2002).<br />
10.8.1 First Amendment to Employment Agreement, dated May 1, 2008, by and between R. Wesley Fuller and<br />
the Bank (<strong>inc</strong>orporated by reference to Exhibit 10.10.1 to the Registrant’s Current Report on Form 8-K<br />
dated May 1, 2008).<br />
10.9 Employment Agreement, dated January 1, 2003, by and between Donald J. Torbert, Jr. and the Bank<br />
(<strong>inc</strong>orporated by reference to Exhibit 10.13 to the Registrant’s Annual Report on Form 10-K for the<br />
fiscal year ended December 31, 2002).<br />
10.9.1 First Amendment to Employment Agreement, dated August 26, 2003, by and between Donald J. Torbert,<br />
Jr. and the Bank (<strong>inc</strong>orporated by reference to Exhibit 10.15 to the Registrant’s Quarterly Report on<br />
Form 10-Q for the fiscal quarter ended September 30, 2003).<br />
10.9.2 Second Amendment to Employment Agreement, dated May 1, 2008, by and between Donald J. Torbert,<br />
Jr. and the Bank (<strong>inc</strong>orporated by reference to Exhibit 10.11.2 to the Registrant’s Current Report on<br />
Form 8-K dated May 1, 2008).<br />
10.10 Employment Agreement, dated May 1, 2008, by and between George D. Henderson, the Bank and the<br />
Registrant (<strong>inc</strong>orporated by reference to Exhibit 10.14 to the Registrant’s Current Report on Form 8-K<br />
dated May 1, 2008).<br />
10.11 Employment Agreement, dated October 28, 2008, by and between Nicole S. Stokes, the Bank and the<br />
Registrant (<strong>inc</strong>orporated by reference to Exhibit 10.1 to the Registrant’s Current Report on Form 8-K<br />
dated October 1, 2009).<br />
10.12 Written Agreement with the Federal Reserve Bank of Atlanta and the Georgia Department of Banking<br />
and Finance, dated July 14, 2009 (<strong>inc</strong>orporated by reference to Exhibit 10.1 to the Registrant’s Current<br />
Report on Form 8-K dated July 20, 2009).<br />
10.13 Compensatory Arrangement with Thompson Kurrie, Jr. dated April 28, 2009, the terms of which are<br />
described on the Registrant’s Current Report on Form 8-K dated April 28, 2009 (<strong>inc</strong>orporated by<br />
reference to Exhibit 10.3 to the Registrant’s Quarterly Report on Form 10-Q for the fiscal quarter ended<br />
June 30, 2009).<br />
10.14 Employment Termination Agreement among PAB Bankshares, Inc., The Park Avenue Bank and M.<br />
Burke Welsh, Jr., dated April 6, 2009 (<strong>inc</strong>orporated by reference to Exhibit 10.1 to the Registrant’s<br />
Current Report on Form 8-K dated April 6, 2009).<br />
10.15 Consulting Agreement among PAB Bankshares, Inc., The Park Avenue Bank and M. Burke Welsh, Jr.,<br />
dated April 6, 2009 (<strong>inc</strong>orporated by reference to Exhibit 10.2 to the Registrant’s Current Report on<br />
Form 8-K dated April 6, 2009).<br />
10.16 Form of Investment Agreement for Series B Preferred Stock (<strong>inc</strong>orporated by reference to Exhibit 10.1<br />
to the Registrant’s Current Report on Form 8-K dated September 15, 2009).<br />
133
10.17 Form of Investment Agreement for Series A Preferred Stock (<strong>inc</strong>orporated by reference to Exhibit 10.2<br />
to the Registrant’s Quarterly Report on Form 10-Q for the fiscal quarter ended March 31, 2009).<br />
10.17.1 Form of Amendment to Investment Agreement for Series A Preferred Stock (<strong>inc</strong>orporated by reference<br />
to Exhibit 10.2 to the Registrant’s Quarterly Report on Form 10-Q for the fiscal quarter ended June 30,<br />
2009).<br />
21.1 Subsidiaries of the Registrant.<br />
23.1 Consent of Mauldin & Jenkins, LLC.<br />
31.1 Rule 13a-14(a) Certification of Chief Executive Officer.<br />
31.2 Rule 13a-14(a) Certification of Chief <strong>Financial</strong> Officer.<br />
32.1 Section 1350 Certification of Chief Executive Officer.<br />
32.2 Section 1350 Certification of Chief <strong>Financial</strong> Officer.<br />
134
SIGNATURES<br />
Pursuant to the requirements of Section 13 or 15(d) of the Securities Exchange Act of 1934, the Registrant has duly caused<br />
this report to be signed on its behalf by the undersigned, thereunto duly authorized.<br />
Date: March 9, 2010<br />
PAB BANKSHARES, INC.<br />
By: /s/ Donald J. Torbert, Jr.<br />
Donald J. Torbert, Jr.<br />
President and Chief Executive Officer<br />
Pursuant to the requirements of the Securities Exchange Act of 1934, this report has been signed<br />
below by the following persons on behalf of the Registrant and in the capacities and on the dates<br />
indicated.<br />
Signature Title Date<br />
/s/ R. Bradford Burnette Director March 9, 2010<br />
R. Bradford Burnette<br />
______________________ Director, Chairman ____________<br />
James L. Dewar, Jr.<br />
/s/ James W. Godbee, Jr. Director March 9, 2010<br />
James W. Godbee, Jr., CPA<br />
/s/ Michael H. Godwin Director March 9, 2010<br />
Michael H. Godwin<br />
/s/ Thompson Kurrie, Jr. Director, Vice Chairman March 9, 2010<br />
Thompson Kurrie, Jr.<br />
/s/ James B. Lanier, Jr. Director March 9, 2010<br />
James B. Lanier, Jr.<br />
/s/ John E. Mansfield, Jr. Director March 9, 2010<br />
John E. Mansfield, Jr.<br />
/s/ Kennith D. McLeod Director March 9, 2010<br />
Kennith D. McLeod, CPA<br />
/s/ Douglas W. McNeill Director, Vice Chairman March 9, 2010<br />
Douglas W. McNeill<br />
/s/ Paul E. Parker Director March 9, 2010<br />
Paul E. Parker<br />
/s/ F. Ferrell Scruggs, Sr. Director March 9, 2010<br />
F. Ferrell Scruggs, Sr.<br />
/s/ Nicole S. Stokes Executive Vice President and March 9, 2010<br />
Nicole S. Stokes, CPA<br />
Chief <strong>Financial</strong> Officer (Pr<strong>inc</strong>ipal<br />
<strong>Financial</strong> and Accounting Officer)<br />
/s/ Donald J. Torbert, Jr. President and Chief Executive March 9, 2010<br />
Donald J. Torbert, Jr.<br />
Officer (Pr<strong>inc</strong>ipal Executive Officer)<br />
135
A Tradition of<br />
Community Banking<br />
www.parkavebank.com • S<strong>inc</strong>e 1956<br />
Board of Directors<br />
James L. Dewar, Jr.<br />
Chairman of the Board<br />
Real Estate Developer<br />
Valdosta, GA<br />
R. Bradford Burnette<br />
Retired Bank Executive<br />
Valdosta, GA<br />
James B. Lanier, Jr.<br />
Forester/Real Estate Appraiser<br />
Brooklet, GA<br />
Paul E. Parker<br />
Bakery Executive<br />
Claxton, GA<br />
Thompson Kurrie, Jr.<br />
Vice-Chairman of the Board<br />
Attorney<br />
Valdosta, GA<br />
James W. Godbee, Jr.<br />
Certified Public Accountant<br />
Valdosta, GA<br />
John E. Mansfield, Jr.<br />
Fuel/Energy Executive<br />
Atlanta, GA<br />
F. Ferrell Scruggs, Sr.<br />
Retired Construction Executive<br />
Valdosta, GA<br />
Douglas W. McNeill<br />
Vice-Chairman of the Board<br />
Retired Real Estate Executive<br />
Ponte Vedra Beach, FL<br />
Michael H. Godwin<br />
Real Estate Executive<br />
Valdosta, GA<br />
Kennith D. McLeod<br />
Certified Public Accountant<br />
Hazlehurst, GA<br />
Executive Officers<br />
Donald J. “Jay” Torbert, Jr.<br />
President<br />
Chief Executive Officer<br />
George D. Henderson<br />
Executive Vice President,<br />
Chief Banking Officer<br />
R. Wesley Fuller<br />
Executive Vice President,<br />
Treasurer and Chief<br />
Administrative Officer<br />
Judy S. Kelly<br />
Executive Vice President,<br />
Chief Operations Officer<br />
David H. Hammond<br />
Executive Vice President,<br />
Chief Credit Officer<br />
Nicole S. Stokes<br />
Executive Vice President,<br />
Chief <strong>Financial</strong> Officer<br />
Senior Management<br />
Market Presidents:<br />
Jeffery E. Hanson<br />
Valdosta, Lake Park and Adel<br />
Jared B. Reddick<br />
Ocala<br />
C. Sam Williams<br />
Baxley, Hazlehurst and Statesboro<br />
Al D. Hosford<br />
McDonough and Stockbridge<br />
Stephen B. Tippins<br />
Athens<br />
T. Frank Posey, Jr.<br />
Bainbridge and Cairo<br />
Gregory W. Wayne<br />
Oakwood<br />
Senior Officers:<br />
Teresa A. Baumann<br />
Loan Operations<br />
Larry W. Hale<br />
Security Officer/Purchasing<br />
W. Keith Morris<br />
Special Assets<br />
Brenda D. Vickery<br />
Human Resources<br />
Jane D. Carter<br />
Deposit Operations/Electronic Banking<br />
Suzy S. Hall<br />
Compliance<br />
David C. Rogers<br />
Controller<br />
Derek T. Watkins<br />
Mortgage Origination<br />
J. Randy Cox<br />
Marketing<br />
Tracey R. Moore<br />
BSA/OFAC Officer<br />
Donnee L. Upson<br />
Information Technology<br />
Karen A. Witt<br />
Credit Administration
Shareholder Information<br />
Corporate Office<br />
PAB Bankshares, Inc.<br />
3250 North Valdosta Road / P.O. Box 3460<br />
Valdosta, GA 31604-3460 • (229) 241-2775<br />
www.<strong>pab</strong><strong>bankshares</strong>.com<br />
Denise G. McKenzie, Corporate Secretary<br />
General Counsel<br />
Coleman Talley, LLP<br />
910 N. Patterson St., Valdosta, GA 31603-5437<br />
SEC Counsel<br />
Troutman Sanders, LLP<br />
600 Peachtree St, Suite 5200, Atlanta, GA 30308<br />
Independent Certified Public Accountants<br />
Mauldin & Jenkins, LLC<br />
2303 Dawson Road, Albany, GA 31708-1549<br />
Transfer Agent<br />
Registrar and Transfer Company<br />
10 Commerce Drive, Cranford, NJ 07016-3572<br />
(800) 368-5948 • www.rtco.com<br />
Investor Relations<br />
Denise G. McKenzie<br />
PAB Bankshares, Inc.<br />
P.O. Box 3460, Valdosta, GA 31604-3460<br />
Phone: (229) 241-2775 • Fax: (229) 241-2774<br />
Email: ir@<strong>pab</strong><strong>bankshares</strong>.com<br />
Stock Listing<br />
PAB Bankshares, Inc.’s Common Stock is traded and quoted<br />
on the NASDAQ Global Select Market under the symbol<br />
“PABK.”<br />
Web-Sites<br />
Please visit www.<strong>pab</strong><strong>bankshares</strong>.com for additional investor<br />
relations information. For information concerning The Park<br />
Avenue Bank’s products and services, locations and other<br />
materials relating to the Bank, visit www.parkavebank.com.<br />
Shareholder Information<br />
Shareholders requiring a change of name or address, information<br />
about lost certificates or consolidation of accounts should<br />
contact the Transfer Agent or Investor Relations.<br />
Dividend Reinvestment Plan<br />
PAB Bankshares offers a Dividend Reinvestment Plan for<br />
automatic reinvestment of dividends in the Common Stock of<br />
the Company. The plan allows shareholders to reinvest quarterly<br />
dividends and make cash investments in PAB stock for a<br />
minimum of $50 per month and up to $6,000 per year, with no<br />
brokerage commissions or administrative charges. For more<br />
information concerning this convenient and economical way to<br />
purchase additional Common Stock and to receive an authorization<br />
form, contact the Transfer Agent or Investor Relations.<br />
Direct Deposit<br />
With direct deposit, stockholders can have dividends deposited<br />
directly into a checking account or savings account. There<br />
is no cost for this service. For further information, contact the<br />
Transfer Agent or Investor Relations.<br />
Forward-Looking Statements<br />
Certain matters set forth in this annual report are "forwardlooking<br />
statements" within the meaning of the federal securities<br />
laws, <strong>inc</strong>luding, without limitation, statements regarding<br />
our outlook on earnings, stock performance, asset quality, and<br />
projected growth, and are based upon management's beliefs<br />
as well as assumptions made based on data currently available<br />
to management. When words like "anticipate", "believe",<br />
"intend", "plan", "expect", "estimate", "could", "should", "will"<br />
and similar expressions are used, you should consider them<br />
as identifying forward-looking statements. The Company's<br />
actual results may differ materially from the anticipated or<br />
expected results expressed in these forward-looking statements,<br />
and the Company undertakes no obligation to revise<br />
these statements. Risk factors are identified in the Company's<br />
Form 10-K for the period ending December 31, 2009 filed with<br />
the Securities and Exchange Commission<br />
Annual Report on Form 10-K and Proxy Statement<br />
Copies of the Company’s 2009 Annual Report on Form<br />
10-K, and 2010 Proxy Statement, as filed with the Securities<br />
and Exchange Commission, are available on our website<br />
at no charge or upon written request to Investor Relations.<br />
You are cordially invited to attend the 2010 Annual Shareholders’ Meeting<br />
Date & Time: May 25 at 10:00 a.m.<br />
Location: PAB Bankshares, Inc., Boardroom • 3250 North Valdosta Road, Valdosta, GA 31602
2009 Annual Report<br />
www.<strong>pab</strong><strong>bankshares</strong>.com