pab bankshares, inc. - SNL Financial
pab bankshares, inc. - SNL Financial
pab bankshares, inc. - SNL Financial

Create successful ePaper yourself
Turn your PDF publications into a flip-book with our unique Google optimized e-Paper software.
The quantitative risk factors used in determining these general reserves require a high degree of management judgment.<br />
At December 31, 2009, we had $5.58 million in general reserves on $467.1 million in loans compared to $7.79 million in<br />
general reserves on $696.4 million in loans one year ago. In addition, we had $2.2 million of unallocated reserves at<br />
December 31, 2009, compared to $785,000 of unallocated reserves at December 31, 2008. This <strong>inc</strong>rease in unallocated<br />
reserves is primarily due to the continued deterioration of overall economic conditions.<br />
This evaluation is inherently subjective as it requires estimates that are susceptible to significant revision as more<br />
information becomes available. While we use the best information available to make the evaluation, future adjustments to<br />
the allowance may be necessary if there are significant changes in economic conditions or other environmental factors. In<br />
addition, regulatory agencies, as an integral part of their examination process, periodically review the Bank’s allowance<br />
for loan losses, and may require the Bank to make additions to the allowance based on their judgment about information<br />
available to them at the time of their examinations.<br />
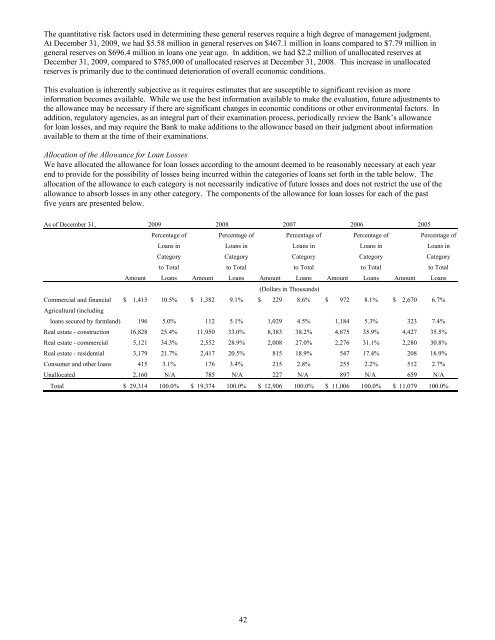
Allocation of the Allowance for Loan Losses<br />
We have allocated the allowance for loan losses according to the amount deemed to be reasonably necessary at each year<br />
end to provide for the possibility of losses being <strong>inc</strong>urred within the categories of loans set forth in the table below. The<br />
allocation of the allowance to each category is not necessarily indicative of future losses and does not restrict the use of the<br />
allowance to absorb losses in any other category. The components of the allowance for loan losses for each of the past<br />
five years are presented below.<br />
As of December 31, 2009 2008 2007 2006 2005<br />
Percentage of Percentage of Percentage of Percentage of Percentage of<br />
Loans in Loans in Loans in Loans in Loans in<br />
Category Category Category Category Category<br />
to Total to Total to Total to Total to Total<br />
Amount Loans Amount Loans Amount Loans Amount Loans Amount Loans<br />
(Dollars in Thousands)<br />
Commercial and financial $ 1,415 10.5% $ 1,382 9.1% $ 229 8.6% $ 972 8.1% $ 2,670 6.7%<br />
Agricultural (<strong>inc</strong>luding<br />
loans secured by farmland) 196 5.0% 112 5.1% 1,029 4.5% 1,184 5.3% 323 7.4%<br />
Real estate - construction 16,828 25.4% 11,950 33.0% 8,383 38.2% 4,875 35.9% 4,427 35.5%<br />
Real estate - commercial 5,121 34.3% 2,552 28.9% 2,008 27.0% 2,276 31.1% 2,280 30.8%<br />
Real estate - residential 3,179 21.7% 2,417 20.5% 815 18.9% 547 17.4% 208 16.9%<br />
Consumer and other loans 415 3.1% 176 3.4% 215 2.8% 255 2.2% 512 2.7%<br />
Unallocated 2,160 N/A 785 N/A 227 N/A 897 N/A 659 N/A<br />
Total $ 29,314 100.0% $ 19,374 100.0% $ 12,906 100.0% $ 11,006 100.0% $ 11,079 100.0%<br />
42