pab bankshares, inc. - SNL Financial
pab bankshares, inc. - SNL Financial
pab bankshares, inc. - SNL Financial
You also want an ePaper? Increase the reach of your titles
YUMPU automatically turns print PDFs into web optimized ePapers that Google loves.
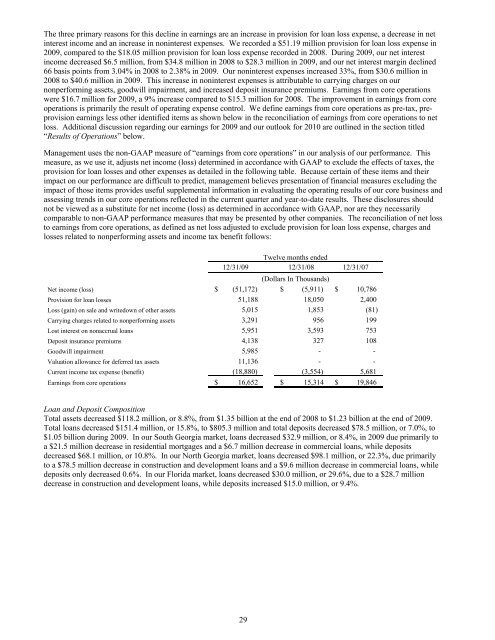
The three primary reasons for this decline in earnings are an <strong>inc</strong>rease in provision for loan loss expense, a decrease in net<br />
interest <strong>inc</strong>ome and an <strong>inc</strong>rease in noninterest expenses. We recorded a $51.19 million provision for loan loss expense in<br />
2009, compared to the $18.05 million provision for loan loss expense recorded in 2008. During 2009, our net interest<br />
<strong>inc</strong>ome decreased $6.5 million, from $34.8 million in 2008 to $28.3 million in 2009, and our net interest margin declined<br />
66 basis points from 3.04% in 2008 to 2.38% in 2009. Our noninterest expenses <strong>inc</strong>reased 33%, from $30.6 million in<br />
2008 to $40.6 million in 2009. This <strong>inc</strong>rease in noninterest expenses is attributable to carrying charges on our<br />
nonperforming assets, goodwill impairment, and <strong>inc</strong>reased deposit insurance premiums. Earnings from core operations<br />
were $16.7 million for 2009, a 9% <strong>inc</strong>rease compared to $15.3 million for 2008. The improvement in earnings from core<br />
operations is primarily the result of operating expense control. We define earnings from core operations as pre-tax, preprovision<br />
earnings less other identified items as shown below in the reconciliation of earnings from core operations to net<br />
loss. Additional discussion regarding our earnings for 2009 and our outlook for 2010 are outlined in the section titled<br />
“Results of Operations” below.<br />
Management uses the non-GAAP measure of “earnings from core operations” in our analysis of our performance. This<br />
measure, as we use it, adjusts net <strong>inc</strong>ome (loss) determined in accordance with GAAP to exclude the effects of taxes, the<br />
provision for loan losses and other expenses as detailed in the following table. Because certain of these items and their<br />
impact on our performance are difficult to predict, management believes presentation of financial measures excluding the<br />
impact of those items provides useful supplemental information in evaluating the operating results of our core business and<br />
assessing trends in our core operations reflected in the current quarter and year-to-date results. These disclosures should<br />
not be viewed as a substitute for net <strong>inc</strong>ome (loss) as determined in accordance with GAAP, nor are they necessarily<br />
comparable to non-GAAP performance measures that may be presented by other companies. The reconciliation of net loss<br />
to earnings from core operations, as defined as net loss adjusted to exclude provision for loan loss expense, charges and<br />
losses related to nonperforming assets and <strong>inc</strong>ome tax benefit follows:<br />
Twelve months ended<br />
12/31/09 12/31/08 12/31/07<br />
(Dollars In Thousands)<br />
Net <strong>inc</strong>ome (loss) $ (51,172) $ (5,911) $ 10,786<br />
Provision for loan losses 51,188 18,050 2,400<br />
Loss (gain) on sale and writedown of other assets 5,015 1,853 (81)<br />
Carrying charges related to nonperforming assets 3,291 956 199<br />
Lost interest on nonaccrual loans 5,951 3,593 753<br />
Deposit insurance premiums 4,138 327 108<br />
Goodwill impairment 5,985 - -<br />
Valuation allowance for deferred tax assets 11,136 - -<br />
Current <strong>inc</strong>ome tax expense (benefit) (18,880) (3,554) 5,681<br />
Earnings from core operations $ 16,652 $ 15,314 $ 19,846<br />
Loan and Deposit Composition<br />
Total assets decreased $118.2 million, or 8.8%, from $1.35 billion at the end of 2008 to $1.23 billion at the end of 2009.<br />
Total loans decreased $151.4 million, or 15.8%, to $805.3 million and total deposits decreased $78.5 million, or 7.0%, to<br />
$1.05 billion during 2009. In our South Georgia market, loans decreased $32.9 million, or 8.4%, in 2009 due primarily to<br />
a $21.5 million decrease in residential mortgages and a $6.7 million decrease in commercial loans, while deposits<br />
decreased $68.1 million, or 10.8%. In our North Georgia market, loans decreased $98.1 million, or 22.3%, due primarily<br />
to a $78.5 million decrease in construction and development loans and a $9.6 million decrease in commercial loans, while<br />
deposits only decreased 0.6%. In our Florida market, loans decreased $30.0 million, or 29.6%, due to a $28.7 million<br />
decrease in construction and development loans, while deposits <strong>inc</strong>reased $15.0 million, or 9.4%.<br />
29


