pab bankshares, inc. - SNL Financial
pab bankshares, inc. - SNL Financial
pab bankshares, inc. - SNL Financial
You also want an ePaper? Increase the reach of your titles
YUMPU automatically turns print PDFs into web optimized ePapers that Google loves.
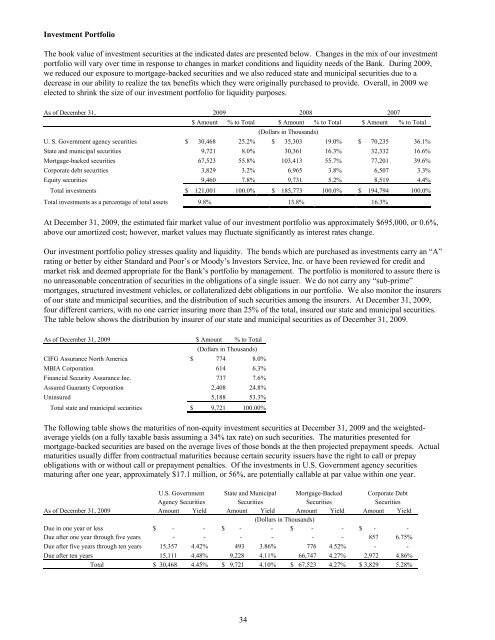
Investment Portfolio<br />
The book value of investment securities at the indicated dates are presented below. Changes in the mix of our investment<br />
portfolio will vary over time in response to changes in market conditions and liquidity needs of the Bank. During 2009,<br />
we reduced our exposure to mortgage-backed securities and we also reduced state and municipal securities due to a<br />
decrease in our ability to realize the tax benefits which they were originally purchased to provide. Overall, in 2009 we<br />
elected to shrink the size of our investment portfolio for liquidity purposes.<br />
As of December 31, 2009 2008 2007<br />
$ Amount % to Total $ Amount % to Total $ Amount % to Total<br />
(Dollars in Thousands)<br />
U. S. Government agency securities $ 30,468 25.2% $ 35,303 19.0% $ 70,235 36.1%<br />
State and municipal securities 9,721 8.0% 30,361 16.3% 32,332 16.6%<br />
Mortgage-backed securities 67,523 55.8% 103,413 55.7% 77,201 39.6%<br />
Corporate debt securities 3,829 3.2% 6,965 3.8% 6,507 3.3%<br />
Equity securities 9,460 7.8% 9,731 5.2% 8,519 4.4%<br />
Total investments $ 121,001 100.0% $ 185,773 100.0% $ 194,794 100.0%<br />
Total investments as a percentage of total assets 9.8% 13.8% 16.3%<br />
At December 31, 2009, the estimated fair market value of our investment portfolio was approximately $695,000, or 0.6%,<br />
above our amortized cost; however, market values may fluctuate significantly as interest rates change.<br />
Our investment portfolio policy stresses quality and liquidity. The bonds which are purchased as investments carry an “A”<br />
rating or better by either Standard and Poor’s or Moody’s Investors Service, Inc. or have been reviewed for credit and<br />
market risk and deemed appropriate for the Bank’s portfolio by management. The portfolio is monitored to assure there is<br />
no unreasonable concentration of securities in the obligations of a single issuer. We do not carry any “sub-prime”<br />
mortgages, structured investment vehicles, or collateralized debt obligations in our portfolio. We also monitor the insurers<br />
of our state and municipal securities, and the distribution of such securities among the insurers. At December 31, 2009,<br />
four different carriers, with no one carrier insuring more than 25% of the total, insured our state and municipal securities.<br />
The table below shows the distribution by insurer of our state and municipal securities as of December 31, 2009.<br />
As of December 31, 2009 $ Amount % to Total<br />
(Dollars in Thousands)<br />
CIFG Assurance North America $ 774 8.0%<br />
MBIA Corporation 614 6.3%<br />
<strong>Financial</strong> Security Assurance Inc. 737 7.6%<br />
Assured Guaranty Corporation 2,408 24.8%<br />
Uninsured 5,188 53.3%<br />
Total state and municipal securities $ 9,721 100.00%<br />
The following table shows the maturities of non-equity investment securities at December 31, 2009 and the weightedaverage<br />
yields (on a fully taxable basis assuming a 34% tax rate) on such securities. The maturities presented for<br />
mortgage-backed securities are based on the average lives of those bonds at the then projected prepayment speeds. Actual<br />
maturities usually differ from contractual maturities because certain security issuers have the right to call or prepay<br />
obligations with or without call or prepayment penalties. Of the investments in U.S. Government agency securities<br />
maturing after one year, approximately $17.1 million, or 56%, are potentially callable at par value within one year.<br />
U.S. Government State and Municipal Mortgage-Backed Corporate Debt<br />
Agency Securities Securities Securities Securities<br />
As of December 31, 2009 Amount Yield Amount Yield Amount Yield Amount Yield<br />
(Dollars in Thousands)<br />
Due in one year or less $ - - $ - - $ - - $ - -<br />
Due after one year through five years - - - - - - 857 6.75%<br />
Due after five years through ten years 15,357 4.42% 493 3.86% 776 4.52% - -<br />
Due after ten years 15,111 4.48% 9,228 4.11% 66,747 4.27% 2,972 4.86%<br />
Total $ 30,468 4.45% $ 9,721 4.10% $ 67,523 4.27% $ 3,829 5.28%<br />
34


