pab bankshares, inc. - SNL Financial
pab bankshares, inc. - SNL Financial
pab bankshares, inc. - SNL Financial

You also want an ePaper? Increase the reach of your titles
YUMPU automatically turns print PDFs into web optimized ePapers that Google loves.
At December 31, 2009, commercial real estate loans represented 34.3% of our total loans, and this segment of our<br />
portfolio was equivalent to 460.9% of our regulatory Tier 1 capital. An additional 25.4% of our loan portfolio was<br />
comprised of construction and development loans, which represents 341.9% of our regulatory Tier 1 capital.<br />
In an effort to diversify our loan portfolio from commercial real estate (which <strong>inc</strong>ludes construction and development<br />
lending and commercial mortgages), we began focusing on originating non-real estate secured commercial loans and<br />
residential mortgages in early 2008. As a percentage of total loans, the commercial loans segment of our portfolio<br />
<strong>inc</strong>reased from 9.2% at the end of 2008 to 10.5% at the end of 2009.<br />
Overall, our construction and development loans decreased $111.1 million, or 35.2%, while our residential mortgages<br />
decreased $21.4 million, or 10.9%, during 2009 as compared to 2008. Beginning in the fourth quarter of 2006 and<br />
continuing throughout 2009, we have observed a significant slowdown in residential construction and development<br />
activities in our markets. This slowdown has been more severe in certain sections of our North Georgia and Florida<br />
markets.<br />
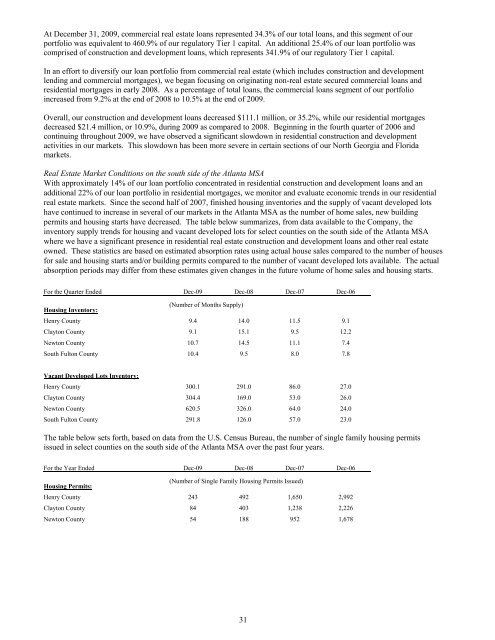
Real Estate Market Conditions on the south side of the Atlanta MSA<br />
With approximately 14% of our loan portfolio concentrated in residential construction and development loans and an<br />
additional 22% of our loan portfolio in residential mortgages, we monitor and evaluate economic trends in our residential<br />
real estate markets. S<strong>inc</strong>e the second half of 2007, finished housing inventories and the supply of vacant developed lots<br />
have continued to <strong>inc</strong>rease in several of our markets in the Atlanta MSA as the number of home sales, new building<br />
permits and housing starts have decreased. The table below summarizes, from data available to the Company, the<br />
inventory supply trends for housing and vacant developed lots for select counties on the south side of the Atlanta MSA<br />
where we have a significant presence in residential real estate construction and development loans and other real estate<br />
owned. These statistics are based on estimated absorption rates using actual house sales compared to the number of houses<br />
for sale and housing starts and/or building permits compared to the number of vacant developed lots available. The actual<br />
absorption periods may differ from these estimates given changes in the future volume of home sales and housing starts.<br />
For the Quarter Ended Dec-09 Dec-08 Dec-07 Dec-06<br />
Housing Inventory:<br />
(Number of Months Supply)<br />
Henry County 9.4 14.0 11.5 9.1<br />
Clayton County 9.1 15.1 9.5 12.2<br />
Newton County 10.7 14.5 11.1 7.4<br />
South Fulton County 10.4 9.5 8.0 7.8<br />
Vacant Developed Lots Inventory:<br />
Henry County 300.1 291.0 86.0 27.0<br />
Clayton County 304.4 169.0 53.0 26.0<br />
Newton County 620.5 326.0 64.0 24.0<br />
South Fulton County 291.8 126.0 57.0 23.0<br />
The table below sets forth, based on data from the U.S. Census Bureau, the number of single family housing permits<br />
issued in select counties on the south side of the Atlanta MSA over the past four years.<br />
For the Year Ended Dec-09 Dec-08 Dec-07 Dec-06<br />
Housing Permits:<br />
(Number of Single Family Housing Permits Issued)<br />
Henry County 243 492 1,650 2,992<br />
Clayton County 84 403 1,238 2,226<br />
Newton County 54 188 952 1,678<br />
31