pab bankshares, inc. - SNL Financial
pab bankshares, inc. - SNL Financial
pab bankshares, inc. - SNL Financial

You also want an ePaper? Increase the reach of your titles
YUMPU automatically turns print PDFs into web optimized ePapers that Google loves.
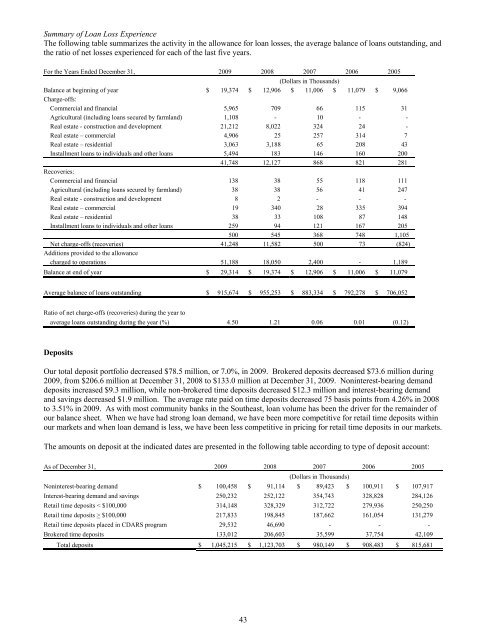
Summary of Loan Loss Experience<br />
The following table summarizes the activity in the allowance for loan losses, the average balance of loans outstanding, and<br />
the ratio of net losses experienced for each of the last five years.<br />
For the Years Ended December 31, 2009 2008 2007 2006<br />
(Dollars in Thousands)<br />
Balance at beginning of year $ 19,374 $ 12,906 $ 11,006 $ 11,079 $ 9,066<br />
Charge-offs:<br />
Commercial and financial 5,965 709<br />
66 115 31<br />
Agricultural (<strong>inc</strong>luding loans secured by farmland) 1,108 -<br />
10 - -<br />
Real estate - construction and development 21,212 8,022<br />
324 24 -<br />
Real estate – commercial 4,906 25<br />
257 314 7<br />
Real estate – residential 3,063 3,188<br />
65 208 43<br />
Installment loans to individuals and other loans 5,494 183<br />
146 160 200<br />
41,748 12,127<br />
868 821 281<br />
Recoveries:<br />
Commercial and financial 138 38<br />
55 118 111<br />
Agricultural (<strong>inc</strong>luding loans secured by farmland) 38 38<br />
56 41 247<br />
Real estate - construction and development 8 2<br />
- - -<br />
Real estate – commercial 19 340<br />
28 335 394<br />
Real estate – residential 38 33<br />
108 87 148<br />
Installment loans to individuals and other loans 259 94<br />
121 167 205<br />
500 545 368 748 1,105<br />
Net charge-offs (recoveries) 41,248 11,582 500 73 (824)<br />
Additions provided to the allowance<br />
charged to operations 51,188 18,050 2,400 - 1,189<br />
Balance at end of year $ 29,314 $ 19,374 $ 12,906 $ 11,006 $ 11,079<br />
2005<br />
Average balance of loans outstanding $ 915,674 $ 955,253 $ 883,334 $ 792,278 $ 706,052<br />
Ratio of net charge-offs (recoveries) during the year to<br />
average loans outstanding during the year (%) 4.50 1.21 0.06 0.01 (0.12)<br />
Deposits<br />
Our total deposit portfolio decreased $78.5 million, or 7.0%, in 2009. Brokered deposits decreased $73.6 million during<br />
2009, from $206.6 million at December 31, 2008 to $133.0 million at December 31, 2009. Noninterest-bearing demand<br />
deposits <strong>inc</strong>reased $9.3 million, while non-brokered time deposits decreased $12.3 million and interest-bearing demand<br />
and savings decreased $1.9 million. The average rate paid on time deposits decreased 75 basis points from 4.26% in 2008<br />
to 3.51% in 2009. As with most community banks in the Southeast, loan volume has been the driver for the remainder of<br />
our balance sheet. When we have had strong loan demand, we have been more competitive for retail time deposits within<br />
our markets and when loan demand is less, we have been less competitive in pricing for retail time deposits in our markets.<br />
The amounts on deposit at the indicated dates are presented in the following table according to type of deposit account:<br />
As of December 31, 2009 2008 2007 2006 2005<br />
(Dollars in Thousands)<br />
Noninterest-bearing demand $ 100,458 $ 91,114 $ 89,423 $ 100,911 $ 107,917<br />
Interest-bearing demand and savings 250,232 252,122 354,743 328,828 284,126<br />
Retail time deposits < $100,000 314,148 328,329 312,722 279,936 250,250<br />
Retail time deposits > $100,000 217,833 198,845 187,662 161,054 131,279<br />
Retail time deposits placed in CDARS program 29,532 46,690 - - -<br />
Brokered time deposits 133,012 206,603 35,599 37,754 42,109<br />
Total deposits $ 1,045,215 $ 1,123,703 $ 980,149 $ 908,483 $ 815,681<br />
43