pab bankshares, inc. - SNL Financial
pab bankshares, inc. - SNL Financial
pab bankshares, inc. - SNL Financial

Create successful ePaper yourself
Turn your PDF publications into a flip-book with our unique Google optimized e-Paper software.
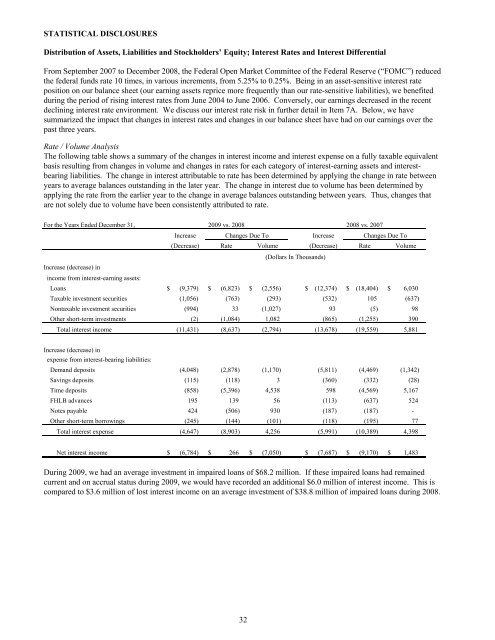
STATISTICAL DISCLOSURES<br />
Distribution of Assets, Liabilities and Stockholders’ Equity; Interest Rates and Interest Differential<br />
From September 2007 to December 2008, the Federal Open Market Committee of the Federal Reserve (“FOMC”) reduced<br />
the federal funds rate 10 times, in various <strong>inc</strong>rements, from 5.25% to 0.25%. Being in an asset-sensitive interest rate<br />
position on our balance sheet (our earning assets reprice more frequently than our rate-sensitive liabilities), we benefited<br />
during the period of rising interest rates from June 2004 to June 2006. Conversely, our earnings decreased in the recent<br />
declining interest rate environment. We discuss our interest rate risk in further detail in Item 7A. Below, we have<br />
summarized the impact that changes in interest rates and changes in our balance sheet have had on our earnings over the<br />
past three years.<br />
Rate / Volume Analysis<br />
The following table shows a summary of the changes in interest <strong>inc</strong>ome and interest expense on a fully taxable equivalent<br />
basis resulting from changes in volume and changes in rates for each category of interest-earning assets and interestbearing<br />
liabilities. The change in interest attributable to rate has been determined by applying the change in rate between<br />
years to average balances outstanding in the later year. The change in interest due to volume has been determined by<br />
applying the rate from the earlier year to the change in average balances outstanding between years. Thus, changes that<br />
are not solely due to volume have been consistently attributed to rate.<br />
For the Years Ended December 31, 2009 vs. 2008 2008 vs. 2007<br />
Increase Changes Due To Increase Changes Due To<br />
(Decrease) Rate Volume (Decrease) Rate Volume<br />
(Dollars In Thousands)<br />
Increase (decrease) in<br />
<strong>inc</strong>ome from interest-earning assets:<br />
Loans $ (9,379) $ (6,823) $ (2,556) $ (12,374) $ (18,404) $ 6,030<br />
Taxable investment securities (1,056) (763) (293) (532) 105 (637)<br />
Nontaxable investment securities (994) 33 (1,027) 93 (5) 98<br />
Other short-term investments (2) (1,084) 1,082 (865) (1,255) 390<br />
Total interest <strong>inc</strong>ome (11,431) (8,637) (2,794) (13,678) (19,559) 5,881<br />
Increase (decrease) in<br />
expense from interest-bearing liabilities:<br />
Demand deposits (4,048) (2,878) (1,170) (5,811) (4,469) (1,342)<br />
Savings deposits (115) (118) 3 (360) (332) (28)<br />
Time deposits (858) (5,396) 4,538 598 (4,569) 5,167<br />
FHLB advances 195 139 56 (113) (637) 524<br />
Notes payable 424 (506) 930 (187) (187) -<br />
Other short-term borrowings (245) (144) (101) (118) (195) 77<br />
Total interest expense (4,647) (8,903) 4,256 (5,991) (10,389) 4,398<br />
Net interest <strong>inc</strong>ome $ (6,784) $ 266 $ (7,050) $ (7,687) $ (9,170) $ 1,483<br />
During 2009, we had an average investment in impaired loans of $68.2 million. If these impaired loans had remained<br />
current and on accrual status during 2009, we would have recorded an additional $6.0 million of interest <strong>inc</strong>ome. This is<br />
compared to $3.6 million of lost interest <strong>inc</strong>ome on an average investment of $38.8 million of impaired loans during 2008.<br />
32