pab bankshares, inc. - SNL Financial
pab bankshares, inc. - SNL Financial
pab bankshares, inc. - SNL Financial

You also want an ePaper? Increase the reach of your titles
YUMPU automatically turns print PDFs into web optimized ePapers that Google loves.
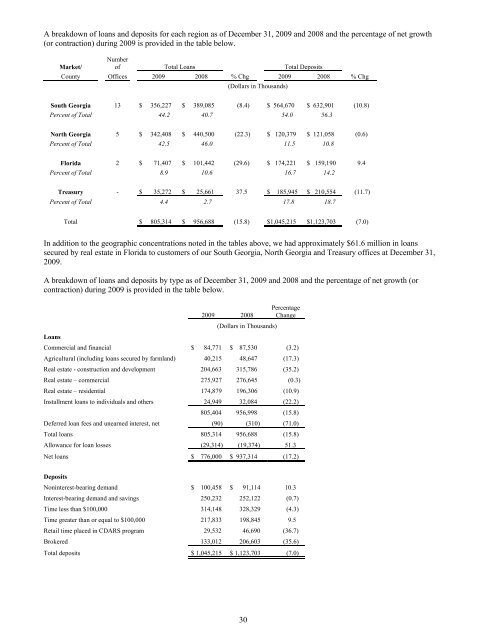
A breakdown of loans and deposits for each region as of December 31, 2009 and 2008 and the percentage of net growth<br />
(or contraction) during 2009 is provided in the table below.<br />
Market/<br />
Number<br />
of Total Loans Total Deposits<br />
County Offices 2009 2008 % Chg 2009 2008 % Chg<br />
(Dollars in Thousands)<br />
South Georgia 13 $ 356,227 $ 389,085 (8.4) $ 564,670 $ 632,901 (10.8)<br />
Percent of Total 44.2 40.7 54.0 56.3<br />
North Georgia 5 $ 342,408 $ 440,500 (22.3) $ 120,379 $ 121,058 (0.6)<br />
Percent of Total 42.5 46.0 11.5 10.8<br />
Florida 2 $ 71,407 $ 101,442 (29.6) $ 174,221 $ 159,190 9.4<br />
Percent of Total 8.9 10.6 16.7 14.2<br />
Treasury - $ 35,272 $ 25,661 37.5 $ 185,945 $ 210,554 (11.7)<br />
Percent of Total 4.4 2.7 17.8 18.7<br />
Total $ 805,314 $ 956,688 (15.8) $1,045,215 $1,123,703 (7.0)<br />
In addition to the geographic concentrations noted in the tables above, we had approximately $61.6 million in loans<br />
secured by real estate in Florida to customers of our South Georgia, North Georgia and Treasury offices at December 31,<br />
2009.<br />
A breakdown of loans and deposits by type as of December 31, 2009 and 2008 and the percentage of net growth (or<br />
contraction) during 2009 is provided in the table below.<br />
Loans<br />
2009 2008<br />
(Dollars in Thousands)<br />
Percentage<br />
Change<br />
Commercial and financial $ 84,771 $ 87,530 (3.2)<br />
Agricultural (<strong>inc</strong>luding loans secured by farmland) 40,215 48,647 (17.3)<br />
Real estate - construction and development 204,663 315,786 (35.2)<br />
Real estate – commercial 275,927 276,645 (0.3)<br />
Real estate – residential 174,879 196,306 (10.9)<br />
Installment loans to individuals and others 24,949 32,084 (22.2)<br />
805,404 956,998 (15.8)<br />
Deferred loan fees and unearned interest, net (90) (310) (71.0)<br />
Total loans 805,314 956,688 (15.8)<br />
Allowance for loan losses (29,314) (19,374) 51.3<br />
Net loans $ 776,000 $ 937,314 (17.2)<br />
Deposits<br />
Noninterest-bearing demand $ 100,458 $ 91,114 10.3<br />
Interest-bearing demand and savings 250,232 252,122 (0.7)<br />
Time less than $100,000 314,148 328,329 (4.3)<br />
Time greater than or equal to $100,000 217,833 198,845 9.5<br />
Retail time placed in CDARS program 29,532 46,690 (36.7)<br />
Brokered 133,012 206,603 (35.6)<br />
Total deposits $ 1,045,215 $ 1,123,703 (7.0)<br />
30