pab bankshares, inc. - SNL Financial
pab bankshares, inc. - SNL Financial
pab bankshares, inc. - SNL Financial

You also want an ePaper? Increase the reach of your titles
YUMPU automatically turns print PDFs into web optimized ePapers that Google loves.
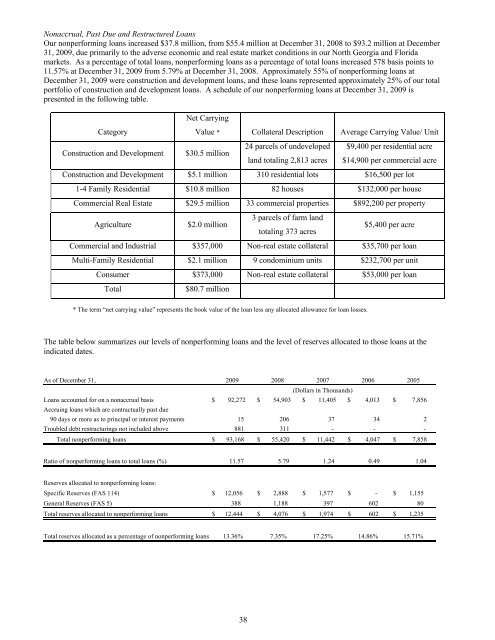
Nonaccrual, Past Due and Restructured Loans<br />
Our nonperforming loans <strong>inc</strong>reased $37.8 million, from $55.4 million at December 31, 2008 to $93.2 million at December<br />
31, 2009, due primarily to the adverse economic and real estate market conditions in our North Georgia and Florida<br />
markets. As a percentage of total loans, nonperforming loans as a percentage of total loans <strong>inc</strong>reased 578 basis points to<br />
11.57% at December 31, 2009 from 5.79% at December 31, 2008. Approximately 55% of nonperforming loans at<br />
December 31, 2009 were construction and development loans, and these loans represented approximately 25% of our total<br />
portfolio of construction and development loans. A schedule of our nonperforming loans at December 31, 2009 is<br />
presented in the following table.<br />
Net Carrying<br />
Category<br />
Value * Collateral Description Average Carrying Value/ Unit<br />
Construction and Development<br />
$30.5 million<br />
24 parcels of undeveloped<br />
land totaling 2,813 acres<br />
$9,400 per residential acre<br />
$14,900 per commercial acre<br />
Construction and Development $5.1 million 310 residential lots $16,500 per lot<br />
1-4 Family Residential $10.8 million 82 houses $132,000 per house<br />
Commercial Real Estate $29.5 million 33 commercial properties $892,200 per property<br />
Agriculture<br />
$2.0 million<br />
3 parcels of farm land<br />
totaling 373 acres<br />
$5,400 per acre<br />
Commercial and Industrial $357,000 Non-real estate collateral $35,700 per loan<br />
Multi-Family Residential $2.1 million 9 condominium units $232,700 per unit<br />
Consumer $373,000 Non-real estate collateral $53,000 per loan<br />
Total<br />
$80.7 million<br />
* The term “net carrying value” represents the book value of the loan less any allocated allowance for loan losses.<br />
The table below summarizes our levels of nonperforming loans and the level of reserves allocated to those loans at the<br />
indicated dates.<br />
As of December 31, 2009 2008 2007 2006 2005<br />
(Dollars in Thousands)<br />
Loans accounted for on a nonaccrual basis $ 92,272 $ 54,903 $ 11,405 $ 4,013 $ 7,856<br />
Accruing loans which are contractually past due<br />
90 days or more as to pr<strong>inc</strong>ipal or interest payments 15 206 37 34 2<br />
Troubled debt restructurings not <strong>inc</strong>luded above 881 311 - - -<br />
Total nonperforming loans $ 93,168 $ 55,420 $ 11,442 $ 4,047 $ 7,858<br />
Ratio of nonperforming loans to total loans (%) 11.57 5.79 1.24 0.49 1.04<br />
Reserves allocated to nonperforming loans:<br />
Specific Reserves (FAS 114) $ 12,056 $ 2,888 $ 1,577 $ - $ 1,155<br />
General Reserves (FAS 5) 388 1,188 397 602 80<br />
Total reserves allocated to nonperforming loans $ 12,444 $ 4,076 $ 1,974 $ 602 $ 1,235<br />
Total reserves allocated as a percentage of nonperforming loans 13.36% 7.35% 17.25% 14.86% 15.71%<br />
38