Managed Futures: Portfolio Diversification ... - Dorman Trading
Managed Futures: Portfolio Diversification ... - Dorman Trading
Managed Futures: Portfolio Diversification ... - Dorman Trading

Create successful ePaper yourself
Turn your PDF publications into a flip-book with our unique Google optimized e-Paper software.
cmegroup.com<br />
BENEFITS OF MANAGED FUTURES<br />
CME CME Group Group <strong>Managed</strong> <strong>Futures</strong> <strong>Portfolio</strong> <strong>Diversification</strong> Opportunities<br />
CME Group <strong>Managed</strong> <strong>Futures</strong> <strong>Portfolio</strong> <strong>Diversification</strong> Opportunities<br />
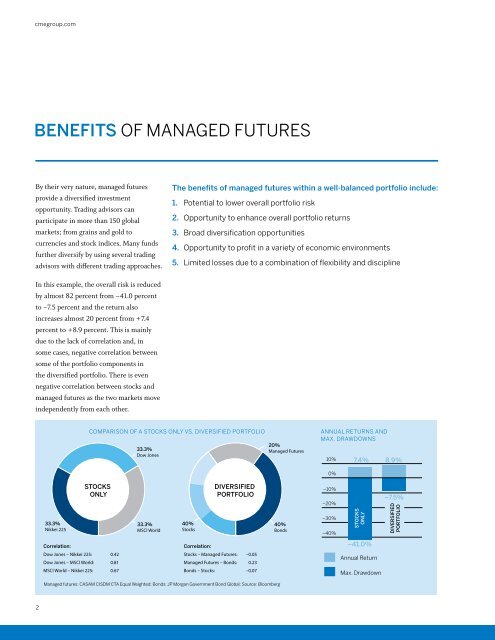
By their very nature, managed futures<br />
provide a diversified investment<br />
opportunity. <strong>Trading</strong> advisors can<br />
participate in more than 150 global<br />
markets; from grains and gold to<br />
currencies and stock indices. Many funds<br />
In this example, the overall risk is reduced<br />
The benefits of managed futures within a well-balanced portfolio include:<br />
1. Potential to lower overall portfolio risk<br />
2. Opportunity to enhance overall portfolio returns<br />
3. Broad diversification opportunities<br />
4. Opportunity to profit in a variety of economic environments<br />
further diversify by using several trading<br />
BENEFITS advisors with different trading OF approaches.<br />
MANAGED FUTURES<br />
BENEFITS OF MANAGED FUTURES<br />
5. Limited losses due to a combination of flexibility and discipline<br />
by almost 82 percent from –41.0 percent<br />
to –7.5 percent and the return also<br />
increases By By their their very almost very nature, 20 percent managed from futures<br />
+7.4 The The benefits of of managed futures within a well-balanced a portfolio include:<br />
By percent provide their very a to diversified a +8.9 nature, percent. managed investment<br />
This futures is mainly The 1. 1. Potential benefits to of to lower managed overall futures portfolio within ris;k ris;k a well-balanced portfolio include:<br />
provide due opportunity. to a the diversified lack <strong>Trading</strong> of correlation investment advisors and, can can in<br />
some participate cases, negative over over 150 correlation 150 global global markets;<br />
1.<br />
between<br />
2. Potential 2. Opportunity to lower to to enhance overall portfolio portfolio ris;k returns<br />
opportunity. <strong>Trading</strong> advisors can<br />
participate some from from grains of grains the and over portfolio and gold 150 gold global to components to currencies markets; in and and 2. 3. Opportunity 3. Broad diversification to enhance opportunities<br />
portfolio returns<br />
from the stock stock grains diversified indices. and Many gold portfolio. Many to funds currencies funds There further is and even diversify<br />
3. 4. Broad 4. Ability diversification to to profit in in a variety opportunities<br />
a of of economic environments<br />
stock negative by by using indices. using several correlation Many trading funds between advisors further stocks diversify with with and<br />
4. 5. Ability 5. Flexibility to profit and and in discipline a variety combine of economic to to limit environments<br />
limit losses<br />
by managed using several futures trading as the advisors two markets with move<br />
independently from each other. 5. Flexibility and discipline combine to limit losses<br />
CHART 4: OPTIMUM 4: PORTFOLIO MIX MIX (12/1985 – 02/2008) – CHART 4: OPTIMUM PORTFOLIO COMPARISON MIX OF (12/1985 A STOCKS – 02/2008) ONLY VS. DIVERSIFIED PORTFOLIO<br />
STOCKS<br />
ONLY ONLY<br />
STOCKS<br />
ONLY<br />
33.3% 33.3%<br />
Dow Dow Jones Jones<br />
33.3%<br />
Dow Jones<br />
DIVERSIFIED<br />
PORTFOLIO<br />
DIVERSIFIED<br />
PORTFOLIO<br />
20% 20%<br />
<strong>Managed</strong> <strong>Futures</strong> <strong>Futures</strong><br />
20%<br />
<strong>Managed</strong> <strong>Futures</strong><br />
33.3% 33.3%<br />
Nikkei Nikkei 225 225<br />
33.3% 33.3%<br />
MSCI MSCI World World<br />
40% 40%<br />
Stocks Stocks<br />
40% 40%<br />
Bonds Bonds<br />
33.3%<br />
33.3%<br />
40%<br />
40%<br />
Nikkei 225<br />
Correlation:<br />
MSCI World<br />
Stocks<br />
Correlation:<br />
Bonds<br />
Dow Dow Jones Jones – Nikkei – Nikkei 225: 225: 0.42 0.42<br />
Stocks Stocks – <strong>Managed</strong> – <strong>Futures</strong>: <strong>Futures</strong>: –0.05 –0.05<br />
Correlation:<br />
Dow Dow Jones Jones – MSCI – MSCI World: World: 0.81 0.81<br />
Correlation:<br />
<strong>Managed</strong> <strong>Futures</strong> <strong>Futures</strong> – Bonds: – Bonds: 0.23 0.23<br />
Dow<br />
MSCI<br />
Jones<br />
MSCI World<br />
–<br />
World<br />
Nikkei<br />
– Nikkei –<br />
225:<br />
Nikkei 225: 225:<br />
0.42<br />
0.67 0.67<br />
Stocks<br />
Bonds Bonds<br />
– <strong>Managed</strong><br />
– Stocks: – Stocks:<br />
<strong>Futures</strong>: –0.05<br />
–0.07 –0.07<br />
Dow Jones – MSCI World: 0.81<br />
<strong>Managed</strong> <strong>Futures</strong> – Bonds: 0.23<br />
MSCI World <strong>Managed</strong> – Nikkei futures: 225: CASAM CISDM 0.67 CTA Equal Weighted; Bonds: JP Morgan Bonds Government – Stocks: Bond Global; –0.07 Source: Bloomberg<br />
ANNUAL RETURNS AND<br />
MAX. DRAWDOWNS<br />
10% 10% 7.4% 7.4%<br />
10% 0% 0% 7.4%<br />
0% –10% –10%<br />
–10% –20% –20%<br />
–20% –30% –30%<br />
STOCKS<br />
ONLY<br />
STOCKS<br />
ONLY<br />
STOCKS<br />
ONLY<br />
–30% –40% –40%<br />
–40% –41.0%<br />
Annual –41.0% Annual Return Return<br />
Annual Max. Max. Drawdown<br />
Return<br />
Max. Drawdown<br />
8.9% 8.9%<br />
8.9%<br />
–7.5%<br />
DIVERSIFIED<br />
PORTFOLIO<br />
–7.5%<br />
DIVERSIFIED<br />
PORTFOLIO<br />
DIVERSIFIED<br />
PORTFOLIO<br />
2
![Definitions & Concepts... [PDF] - Cycles Research Institute](https://img.yumpu.com/26387731/1/190x245/definitions-concepts-pdf-cycles-research-institute.jpg?quality=85)