Managed Futures: Portfolio Diversification ... - Dorman Trading
Managed Futures: Portfolio Diversification ... - Dorman Trading
Managed Futures: Portfolio Diversification ... - Dorman Trading

Create successful ePaper yourself
Turn your PDF publications into a flip-book with our unique Google optimized e-Paper software.
cmegroup.com<br />
4. OPPORTUNITY to profit in a variety of economic environments<br />
<strong>Managed</strong> futures trading advisors can<br />
generate profit in both increasing or<br />
decreasing markets due to the their ability<br />
to go long (buy) futures positions in<br />
anticipation of rising markets or go short<br />
(sell) futures positions in anticipation<br />
of falling markets. Moreover, trading<br />
advisors are able to go long or short with<br />
equal ease. This ability, coupled with<br />
their virtual non-correlation with most<br />
traditional asset classes, have resulted in<br />
managed futures funds performing well<br />
relative to traditional asset classes during<br />
adverse conditions for stocks and bonds.<br />
For example, during periods of<br />
hyperinflation, hard commodities such<br />
as gold, silver, oil, grains and livestock<br />
tend to do well, as do the major world<br />
currencies. Conversely, during deflationary<br />
times, futures provide an opportunity to<br />
profit by selling into a declining market<br />
with the expectation of buying, or closing<br />
out the position, at a lower price. <strong>Trading</strong><br />
advisors can even use strategies employing<br />
options on futures contracts that allow for<br />
profit potential in flat or neutral markets.<br />
This ability to accommodate and<br />
protect against unpredictable events<br />
can be invaluable in today’s volatile<br />
global markets.<br />
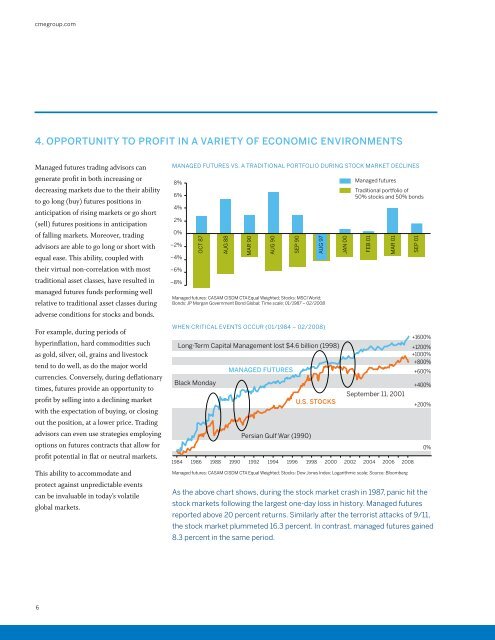
<strong>Managed</strong> futures vs. a traditional portfolio during stock market declines<br />
8%<br />
6%<br />
4%<br />
2%<br />
0%<br />
–2%<br />
–4%<br />
–6%<br />
–8%<br />
OCT 87<br />
AUG 88<br />
MAR 90<br />
<strong>Managed</strong> futures: CASAM CISDM CTA Equal Weighted; Stocks: MSCI World;<br />
Bonds: JP Morgan Government Bond Global; Time scale: 01/1987 – 02/2008<br />
When critical events occur (01/1984 – 02/2008)<br />
Long-Term Capital Management lost $4.6 billion (1998)<br />
Black Monday<br />
AUG 90<br />
MANAGED FUTURES<br />
SEP 90<br />
Persian Gulf War (1990)<br />
AUG 97<br />
U.S. STOCKS<br />
JAN 00<br />
<strong>Managed</strong> futures<br />
Traditional portfolio of<br />
50% stocks and 50% bonds<br />
1984 1986 1988 1990 1992 1994 1996 1998 2000 2002 2004 2006 2008<br />
FEB 01<br />
MAR 01<br />
September 11, 2001<br />
<strong>Managed</strong> futures: CASAM CISDM CTA Equal Weighted; Stocks: Dow Jones Index; Logarithmic scale; Source: Bloomberg<br />
SEP 01<br />
+1600%<br />
+1200%<br />
+1000%<br />
+800%<br />
+600%<br />
+400%<br />
+200%<br />
As the above chart shows, during the stock market crash in 1987, panic hit the<br />
stock markets following the largest one-day loss in history. <strong>Managed</strong> futures<br />
reported above 20 percent returns. Similarly after the terrorist attacks of 9/11,<br />
the stock market plummeted 16.3 percent. In contrast, managed futures gained<br />
8.3 percent in the same period.<br />
0%<br />
6
![Definitions & Concepts... [PDF] - Cycles Research Institute](https://img.yumpu.com/26387731/1/190x245/definitions-concepts-pdf-cycles-research-institute.jpg?quality=85)