MBTA Review - November 1, 2009
MBTA Review - November 1, 2009
MBTA Review - November 1, 2009

Create successful ePaper yourself
Turn your PDF publications into a flip-book with our unique Google optimized e-Paper software.
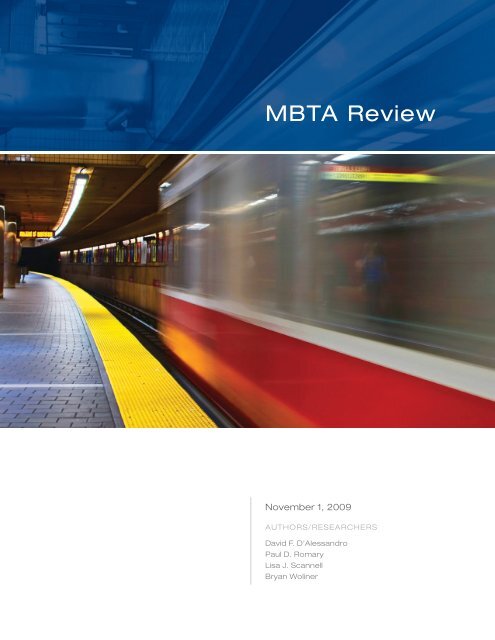
<strong>MBTA</strong> <strong>Review</strong><br />
<strong>November</strong> 1, <strong>2009</strong><br />
Authors/Researchers<br />
David F. D’Alessandro<br />
Paul D. Romary<br />
Lisa J. Scannell<br />
Bryan Woliner
Table of Contents<br />
Mission................................................................... 2<br />
The Outlook Is Bleak.................................................... 3<br />
The Starting Point — The Promise of Forward Funding............... 5<br />
Forward Funding — What Was Supposed to Happen................ 6<br />
What Really Happened — A Promise Unfulfilled........................7<br />
Expenses................................................................ 8<br />
Fuel & Utilities.......................................................... 8<br />
Payroll & Fringe Benefits............................................... 9<br />
The Ride.............................................................. 10<br />
Commuter Rail........................................................ 11<br />
Revenue — A Mixed Result............................................ 12<br />
Sales Tax Revenue.................................................... 12<br />
Transportation Revenue. ............................................. 13<br />
Non-Operating Revenue.............................................. 14<br />
The Real Picture........................................................ 15<br />
Debt Service to the Rescue — Temporarily...........................17<br />
Debt — The Faustian Bargain ......................................... 20<br />
At Risk — System Safety & Reliability................................. 22<br />
<strong>Review</strong> Summary & General Recommendations.................... 29<br />
Acknowledgments..................................................... 33<br />
Reference Materials.................................................... 35<br />
<strong>MBTA</strong> <strong>Review</strong> | <strong>November</strong> <strong>2009</strong><br />
p. 1
Mission<br />
This document is the result of an independent review of the<br />
Massachusetts Bay Transportation Authority (<strong>MBTA</strong>) requested by<br />
Governor Deval Patrick. Begun in late August <strong>2009</strong>, the review’s<br />
mission was to examine the <strong>MBTA</strong>’s financial condition, operations and<br />
organization. The Governor asked us to provide a “frank assessment<br />
of the <strong>MBTA</strong>’s condition.” He directed his administration and <strong>MBTA</strong><br />
officials to cooperate with this review and they did so fully. At no time<br />
did anyone in the administration interfere with or attempt to influence<br />
our process or findings. No government or <strong>MBTA</strong> official read or edited<br />
this report in advance of its delivery to the Governor.<br />
What works well,<br />
what doesn’t work<br />
well and the extent of<br />
its challenges.<br />
Our findings deadline was <strong>November</strong> 1, <strong>2009</strong>. Within this time frame it<br />
was possible to conduct a top-line review of the <strong>MBTA</strong>’s performance<br />
versus past plans and future expectations. We were able to determine<br />
“what works well, what doesn’t work well and the extent of its challenges.”<br />
While it was unfortunately impossible to meet with all of the <strong>MBTA</strong>’s many<br />
constituencies, we conducted hundreds of relevant interviews.<br />
Our work involved these basic aspects:<br />
• <strong>Review</strong>ing numerous internal and external documents,<br />
analyses and plans<br />
• Interviewing current and former <strong>MBTA</strong> and transportation<br />
officials at many different levels, meeting with external experts<br />
and related constituents<br />
• Interviewing a number of government officials<br />
• Analyzing all of the data gathered and forming a set of conclusions<br />
We were not asked for specific recommendations.<br />
In forming our conclusions, we verified and utilized data from a<br />
variety of reports, public documents, <strong>MBTA</strong> and Executive Office<br />
of Transportation documents as well as information generated from<br />
interviews and meetings. Most of the <strong>MBTA</strong> financial information is from<br />
<strong>MBTA</strong> audited statements and/or its Chief Financial Officer and his staff.<br />
As regards other urban transportation systems, we note that many<br />
also face deficits and great challenges. We focused on the <strong>MBTA</strong>’s<br />
issues, as every system is very different in terms of age, size, modes<br />
of transportation and funding mechanisms. Generally, we did examine<br />
major market comparisons in wages, fare prices and cost per mile and<br />
determined the <strong>MBTA</strong> was within reasonable ranges.<br />
But, in our time frame of 60 days, our primary assignment was to<br />
review one system—the <strong>MBTA</strong>. Here is what we found.<br />
p. 2 <strong>MBTA</strong> <strong>Review</strong> | <strong>November</strong> <strong>2009</strong>
The Outlook Is Bleak<br />
Our “frank<br />
assessment”<br />
concludes that a<br />
structural operating<br />
deficit has existed<br />
for many years.<br />
The legislation known as “Forward Funding” that was implemented in<br />
July 2000 to make the <strong>MBTA</strong> financially self-sufficient was a great idea.<br />
Unfortunately, the <strong>MBTA</strong> plan developed to implement Forward Funding<br />
was unrealistic and destined to fail. As a result, a structural operating<br />
deficit between expenses and revenue has existed for many years—<br />
predating this administration.<br />
Through depleting cash reserves, restructuring debt and delaying planned<br />
debt payments, the <strong>MBTA</strong> has managed to meet its requirement to balance<br />
its annual budget. Unfortunately, the repeated restructuring of hundreds of<br />
millions of dollars in debt payments achieved the exact opposite intent of<br />
the legislation that sought to transform the <strong>MBTA</strong>, and postponed the day<br />
of reckoning for repaying deferred interest and principal.<br />
As homeowners painfully learned in the sub-prime mortgage debacle, it<br />
is only a matter of time before those delayed payments are due.<br />
That time has arrived.<br />
The <strong>MBTA</strong> must now face larger and growing deficits over the next<br />
few years as a result of these restructurings, added debt and many<br />
unavoidable costs that are now built into the system.<br />
This year the <strong>MBTA</strong>’s FY10 budget faced a deficit of $186M. After <strong>MBTA</strong><br />
management exercised $26M in budget cuts, the remaining shortfall was<br />
resolved when the Legislature authorized the transfer of $160M in new<br />
sales tax revenues to the <strong>MBTA</strong>, on top of the <strong>MBTA</strong>’s existing sales tax<br />
revenue base. Assuming this $160M amount is dedicated each year for<br />
the next four, it represents only a partial solution to emerging deficits.<br />
Based on current revenue and expenditure trends, the <strong>MBTA</strong> will post<br />
cumulative deficits through FY14 as follows:<br />
Projected <strong>MBTA</strong><br />
Cumulative Deficits<br />
FY11-FY14<br />
0<br />
(300)<br />
FY 2011 FY 2012 FY 2013 FY 2014<br />
$70M<br />
$155M<br />
$230M<br />
$329M<br />
$ Millions<br />
(600)<br />
(900)<br />
With $160M in new<br />
sales tax revenue<br />
Without new sales<br />
tax revenue<br />
$475M<br />
$809M<br />
$550M<br />
$1.19B<br />
(1,200)<br />
<strong>MBTA</strong> <strong>Review</strong> | <strong>November</strong> <strong>2009</strong><br />
p. 3
These deficits will probably increase due to several risk factors on<br />
the horizon:<br />
• Upcoming collective bargaining agreements due by<br />
June 2010 with 28 unions<br />
• An increase in pension payments necessitated by<br />
pension fund investment results<br />
• Unpredictable increases in energy and material costs<br />
• An increase in debt service to pay for the necessary<br />
growth of capital spending just to keep the system in<br />
its current condition<br />
In addition to its structural deficit, the <strong>MBTA</strong> continues to have<br />
significant problems related to the maintenance of its aging<br />
infrastructure. There is abundant evidence that the service and safety<br />
issues that plague the <strong>MBTA</strong> are considerably worse than is commonly<br />
understood—and are becoming critically worse. The additional<br />
investment required even to begin to address this concern will likely<br />
exacerbate the <strong>MBTA</strong>’s growing structural deficit.<br />
Massachusetts<br />
Transportation<br />
Reform Act<br />
Just prior to the start of our analysis, a very progressive and important<br />
initiative—the Massachusetts Transportation Reform Act (TRA)—became<br />
law. The goal of this Act, which will take effect in <strong>November</strong> <strong>2009</strong>, is to<br />
maximize efficiencies among the State’s major transportation agencies:<br />
• Massachusetts Turnpike Authority<br />
• Massachusetts Highways Department<br />
• Massachusetts Bay Transportation Authority (<strong>MBTA</strong>)<br />
• Massachusetts Registry of Motor Vehicles<br />
• Massachusetts Aeronautics Commission<br />
Most experts agree with our observation that budget savings from this<br />
consolidation will most immediately benefit agencies other than the<br />
<strong>MBTA</strong>. Eventually, the <strong>MBTA</strong> will enjoy some of these savings as well,<br />
primarily from fringe benefit reforms and pension plan changes. With<br />
the exception of some health insurance economies yet to be calculated,<br />
these savings will not dramatically affect the financial challenges the<br />
<strong>MBTA</strong> faces in the next few years.<br />
p. 4 <strong>MBTA</strong> <strong>Review</strong> | <strong>November</strong> <strong>2009</strong>
The Starting Point —<br />
The Promise of Forward Funding<br />
A virtual mountain of studies, papers and data has been written about<br />
the <strong>MBTA</strong>’s finances. Some of it is thorough and relevant; some of it<br />
is not. Unfortunately, much of it relies on different comparison points,<br />
which contributes to confusion surrounding the <strong>MBTA</strong>’s woes.<br />
In order to best understand the <strong>MBTA</strong>’s current and future issues, it was<br />
important for this review to establish a common historical comparison point.<br />
What better place than the point in time ten years ago when the <strong>MBTA</strong>’s<br />
entire operation and direction was altered by the promise of “Forward<br />
Funding,” which sought to forever change the <strong>MBTA</strong> for the better.<br />
Prior to July 2000, the <strong>MBTA</strong> was essentially a “backward funding”<br />
operation. It was not expected to and indeed did not operate with a<br />
goal of generating a surplus. Backward funding created no expectations<br />
or incentives for the <strong>MBTA</strong> to control spending or grow its revenues<br />
because the State was required to cover its deficits. As the size of the<br />
deficits grew larger, the annual bill presented to the State was aptly<br />
deemed a “budget buster.”<br />
Forward Funding<br />
“Transform the <strong>MBTA</strong><br />
from an agency that<br />
bills the State for its<br />
operating deficits to a<br />
system that sustains<br />
itself from an identifiable<br />
revenue stream.”<br />
After years of debate, the Legislature and Governor resolved in 1999<br />
that the <strong>MBTA</strong> should become self-sufficient starting with FY01, which<br />
began July 1, 2000. The stated goal was to “transform the <strong>MBTA</strong> from<br />
an agency that bills the State for its operating deficits to a system<br />
that sustains itself from an identifiable revenue stream. In terms of<br />
the <strong>MBTA</strong>’s operations, this would require greater cost efficiency and<br />
revenue enhancement.”<br />
The State would assure the ability to achieve self-sufficiency by<br />
guaranteeing 20% of the State’s sales tax collections (exclusive of<br />
meals taxes) to the <strong>MBTA</strong>, commonly referred to as “a penny on every<br />
nickel.” Without the fallback of backward funding, the <strong>MBTA</strong> was<br />
now expected to balance each year’s budget by enhancing revenues<br />
and controlling costs. The phrase “Forward Funding” was born out of<br />
this transformation from funding deficits in arrears to achieving selfsufficiency<br />
on the foundation of balanced budgets using dedicated<br />
revenues from the Commonwealth.<br />
The <strong>MBTA</strong> thus began a new era based on the discipline and<br />
opportunities enabled by Forward Funding. It was immediately<br />
expected to begin achieving a small surplus that would grow over the<br />
years into a self-sustaining financial model capable of generating larger<br />
surpluses and weaning the <strong>MBTA</strong> from long-term debt.<br />
Our analysis began with examining how the <strong>MBTA</strong>’s actual finances<br />
compared with Forward Funding’s financial assumptions.<br />
<strong>MBTA</strong> <strong>Review</strong> | <strong>November</strong> <strong>2009</strong><br />
p. 5
Forward Funding —<br />
What Was Supposed to Happen<br />
To implement Forward Funding, the <strong>MBTA</strong> developed a Finance Plan<br />
that set revenue and expenditure benchmarks for FY01 through FY08.<br />
We have compared actual results with the Finance Plan’s benchmarks<br />
and projections to measure the Forward Funding’s success.<br />
The Finance Plan called for the <strong>MBTA</strong> to:<br />
• Decrease operating costs 2% per year from FY01 through FY06<br />
• Balance each year’s budget<br />
• Meet cash flow needs without short-term debt by building<br />
working capital reserves from $64M to $100M<br />
• Decrease long-term debt by generating cash surpluses worth<br />
5% to 10% of gross revenues that would fund capital investment<br />
While there was no expectation that all these goals would be achieved<br />
immediately, it was expected that the <strong>MBTA</strong> would soon be in a selfsufficient<br />
position.<br />
Our comparison of the benchmarks with actual results clearly<br />
demonstrates why the plan was unsuccessful, why since 2003 there<br />
have actually been large deficits that have not been apparent, and<br />
why deficits are now growing so quickly.<br />
p. 6 <strong>MBTA</strong> <strong>Review</strong> | <strong>November</strong> <strong>2009</strong>
What Really Happened —<br />
A Promise Unfulfilled<br />
The Forward Funding Finance Plan proved unrealistic in many of its<br />
assumptions and nine years later can be deemed a failure.<br />
Many promises from the Financial Plan were unfulfilled. Increased<br />
surpluses and $100M annual cash reserves never happened. Instead of<br />
paying for capital investment, cash reserves were used to cover deficits.<br />
The main driver, however, of why Forward Funding failed was<br />
unavoidable cost explosions.<br />
In order to begin building cash surpluses and balance the budget, the<br />
Finance Plan called for a “two percent annual decrease in operating<br />
costs” between FY01 and FY06. Not only was this not achieved,<br />
cumulative costs grew $558M above projections by FY08. Instead of the<br />
2% annual decrease, operating costs grew an average of 5% higher each<br />
year or by a cumulative 35%. These cost increases are at the heart of the<br />
real deficits of the past nine years and form the basis for the reasons the<br />
projected deficits in the coming years are so dramatic.<br />
<strong>MBTA</strong> Costs<br />
Actual vs. Finance Plan<br />
FY01-FY08<br />
600<br />
500<br />
5% annual operating cost increases<br />
that actually occurred<br />
$558M<br />
$414M<br />
$ Millions<br />
400<br />
300<br />
2% annual operating cost<br />
reductions projected by the Finance Plan<br />
$329M<br />
200<br />
100<br />
0<br />
FY 2001 FY 2006 FY 2008<br />
<strong>MBTA</strong> <strong>Review</strong> | <strong>November</strong> <strong>2009</strong><br />
p. 7
Expenses<br />
Fuel & Utilities<br />
Expenses<br />
Actual vs. Finance Plan<br />
FY01–FY08<br />
Cumulative negative<br />
$256 million<br />
$ Millions<br />
60<br />
40<br />
20<br />
0<br />
(20)<br />
The following charts and tables represent the four major expense<br />
categories that drove the deficits. This information, provided by the<br />
<strong>MBTA</strong> financial staff, demonstrates the variance between Finance Plan<br />
projections and actual results from the base year of FY01 through<br />
FY08, the last year of the Plan’s projections. The bars above the line<br />
represent favorable results; the bars below the line indicate negative or<br />
unfavorable <strong>MBTA</strong> Expenses financial Actual results. v. Forward Funding Plan<br />
2001-2008<br />
Horizontal axis at 0 represents original Forward Funding<br />
Plan projections. Bars above and below represent the actual<br />
favorable and negative deviations from those projections.<br />
(40)<br />
(60)<br />
(80)<br />
FY 2001 FY 2002 FY 2003 FY 2004 FY 2005 FY 2006 FY 2007 FY 2008<br />
Energy costs increased dramatically over the decade for the economy as<br />
a whole, a trend not foreseen by the Finance Plan. As the single largest<br />
electricity consumer in Massachusetts, as well as the purchaser of tens<br />
of millions of dollars in gasoline, diesel and compressed natural gas, the<br />
<strong>MBTA</strong>’s energy and utility consumption is immense.<br />
• Fuel and utility costs at the <strong>MBTA</strong> grew by a remarkable 122%<br />
from FY01 to FY08, far surpassing the 22% growth that the<br />
Finance Plan projected.<br />
• These costs cumulatively exceeded Finance Plan projections<br />
by $256M.<br />
• Fuel and utility costs account for an increasing share of the<br />
<strong>MBTA</strong>’s overall budget, ballooning from 6.6% of total operating<br />
expenses in FY01 to 10.4% in FY08.<br />
Since the implementation of Forward Funding, the <strong>MBTA</strong> has attempted<br />
to mitigate the impact of fluctuating energy costs by entering into hedge<br />
contracts for fuel and by competitively bidding its electricity purchases.<br />
p. 8 <strong>MBTA</strong> <strong>Review</strong> | <strong>November</strong> <strong>2009</strong>
Payroll & Fringe<br />
Benefit Expenses<br />
Actual vs. Finance Plan<br />
FY01–FY08<br />
Cumulative negative<br />
$113 million<br />
$ Millions<br />
40<br />
20<br />
0<br />
(20)<br />
<strong>MBTA</strong> Expenses Actual v. Forward Funding Plan<br />
2001-2008<br />
(40)<br />
(60)<br />
FY 2001 FY 2002 FY 2003 FY 2004 FY 2005 FY 2006 FY 2007 FY 2008<br />
The <strong>MBTA</strong> currently employs 6,346 workers, of which roughly 600 are<br />
in part-time jobs.<br />
All but 263 of these workers are represented by one of 28 unions.<br />
Total headcount at the <strong>MBTA</strong> is actually down by approximately<br />
200 since the Forward Funding Plan began, while total payroll and<br />
benefits costs have increased.<br />
<strong>MBTA</strong> Hourly Wages<br />
Comparison of Ten<br />
Largest Transit Agencies<br />
Transit System<br />
Operator<br />
Top Rate<br />
San Francisco $29.19<br />
New York City $26.92<br />
Chicago $26.87<br />
Boston $26.56<br />
Washington $25.93<br />
Seattle $25.34<br />
New Jersey $24.27<br />
Philadelphia $23.54<br />
Los Angeles $21.27<br />
Atlanta $19.25<br />
(As of 1/2008)<br />
• Total payroll and benefits costs increased from $412.8M to<br />
$548.9M between FY01 and FY08 due to increases in wage, health<br />
care and pension costs.<br />
• This cumulatively exceeded Finance Plan projections by $113M.<br />
• Between FY01 and FY08, the unionized workers received<br />
average annual wage increases of 3.0%, while <strong>MBTA</strong> executives<br />
received average annual increases of 1.9%.<br />
• Non-union <strong>MBTA</strong> employees have not received wage increases<br />
since 2005.<br />
• Wage increases for union workers are comparable to the 3.5%<br />
annual growth in the Consumer Price Index-Urban Boston and<br />
Massachusetts median household income for the same time period.<br />
• The <strong>MBTA</strong>’s wage rates and total wage costs are similar to those<br />
of other top U.S. transit systems, as is shown in the table at left.<br />
The Finance Plan inexplicably projected no increases in health care<br />
costs between FY01 and FY08.<br />
• In reality, employee and retiree health benefits costs increased<br />
73%, growing from $60.6M in FY01 to $104.9M in FY08.<br />
As mentioned previously, the Transportation Reform Legislation passed<br />
in July <strong>2009</strong> has the potential at some point to help the <strong>MBTA</strong> lower<br />
its health care and pension costs by switching <strong>MBTA</strong> employees and<br />
retirees to coverage under the Group Insurance Commission (GIC),<br />
although <strong>MBTA</strong> unions have filed a lawsuit that challenges the legality<br />
of forcing benefit changes outside of the collective bargaining process.<br />
<strong>MBTA</strong> <strong>Review</strong> | <strong>November</strong> <strong>2009</strong><br />
p. 9
The Ride<br />
Expenses<br />
Actual vs. Finance Plan<br />
FY01–FY08<br />
Cumulative negative<br />
$95 million<br />
$ Millions<br />
40<br />
20<br />
0<br />
(20)<br />
<strong>MBTA</strong> Expenses Actual v. Forward Funding Plan<br />
2001-2008<br />
(40)<br />
(60)<br />
FY 2001 FY 2002 FY 2003 FY 2004 FY 2005 FY 2006 FY 2007 FY 2008<br />
Among the <strong>MBTA</strong>’s fastest-growing expense categories is the<br />
“complementary paratransit” system known as The Ride, which offers<br />
door-to-door jitney and van service for individuals with physical and<br />
other disabilities. The <strong>MBTA</strong> is obligated to offer The Ride to any<br />
eligible individual, consistent with the Americans with Disabilities Act,<br />
in order to qualify for Federal capital funds.<br />
The <strong>MBTA</strong>’s flexibility to control costs is constrained by Federal<br />
regulations that<br />
• Govern maximum fares, minimum service areas, trip destinations<br />
and disability eligibility criteria.<br />
• Prohibit any restriction that sets a different access standard for<br />
the disabled than would apply to the non-disabled population.<br />
Average Cost of a<br />
Trip on The Ride<br />
2001 2008 <strong>2009</strong><br />
$20.32 $31.02 $34.86<br />
The service is contracted out to three vendors that carry an average of<br />
5,800 riders per day throughout a service area that is defined by the<br />
system’s fixed corridor routes, excluding commuter rail.<br />
• Expenses increased 116% between FY01 and FY08 due primarily<br />
to ridership growth, increased vendor fees and fuel costs.<br />
• To prevent fraud and promote efficiency, a variety of vendor<br />
payment methodologies have been tried since the program’s<br />
inception in the late 1970s. The current contract (<strong>2009</strong>-2014)<br />
pays vendors on a per-trip basis.<br />
• The total number of trips rose from 1.58M to 1.76M between<br />
FY07 and FY08. This growth is projected to continue as the<br />
population ages and funding is cut to other agencies that<br />
transport the disabled.<br />
p. 10 <strong>MBTA</strong> <strong>Review</strong> | <strong>November</strong> <strong>2009</strong>
The Commuter Rail<br />
Expenses<br />
Actual vs. Finance Plan<br />
FY01–FY08<br />
Cumulative negative<br />
$37 million<br />
$ Millions<br />
40<br />
20<br />
0<br />
(20)<br />
<strong>MBTA</strong> Expenses Actual v. Forward Funding Plan<br />
2001-2008<br />
(40)<br />
(60)<br />
FY 2001 FY 2002 FY 2003 FY 2004 FY 2005 FY 2006 FY 2007 FY 2008<br />
Commuter rail costs have more closely tracked the Finance Plan’s<br />
projections than other expense categories because annual vendor<br />
increases were contractually fixed between FY03 and FY08. Nonetheless,<br />
it is among the <strong>MBTA</strong>’s largest expense categories, growing by 43%<br />
between FY01 and FY08 - from $172.5M in FY01 to $247M by FY08.<br />
Costs have grown under the recent three-year contract extension,<br />
which uses a different inflation methodology that more realistically<br />
accounts for the vendor’s costs for maintaining the aging infrastructure<br />
and for the steel used for rail replacement. The growth in wages and<br />
health benefits for the vendor’s mostly unionized employees has been<br />
comparable to the experience of the <strong>MBTA</strong>.<br />
The 14 commuter rail lines typically carry 143,000 passengers on 491<br />
trips each weekday.<br />
• Annual ridership has doubled in 20 years—from 19.7M riders<br />
in 1990 to 39.7M in 2008—due in large part to system expansions<br />
required by the Central Artery/Tunnel Administrative Consent Order.<br />
• Net costs per passenger mile ranged from $.47 on the Needham<br />
line to $9.25 on the Fairmount line.<br />
• Operating costs ranked among the lowest of the 20 commuter rail<br />
peer systems, based on 2007 comparison data.<br />
<strong>MBTA</strong> <strong>Review</strong> | <strong>November</strong> <strong>2009</strong><br />
p. 11
Revenue — A Mixed Result<br />
Sales Tax Revenue<br />
Actual vs. Finance Plan<br />
FY01–FY08<br />
40<br />
20<br />
Recognizing the reality that a certain level of state subsidy is necessary to<br />
sustain a transit system, Forward Funding dedicated 20% of statewide sales<br />
tax collections to the <strong>MBTA</strong>. At the same time, the <strong>MBTA</strong> was expected to<br />
increase its system-generated revenues from sources such as fares, parking,<br />
real estate and advertising. The following three charts compare FY01<br />
through <strong>MBTA</strong> Expenses FY08 actual Actual results to v. the Forward Finance Funding Plan’s projections. Plan<br />
2001-2008<br />
Cumulative negative<br />
$150 million<br />
$ Millions<br />
0<br />
(20)<br />
(40)<br />
(60)<br />
FY 2001 FY 2002 FY 2003 FY 2004 FY 2005 FY 2006 FY 2007 FY 2008<br />
The Finance Plan projected that dedicated sales tax revenue would<br />
grow by 3% per year from FY01 through FY08.<br />
• In reality, sales tax revenue grew only an average of 1% per year.<br />
• This fell short of the Finance Plan target by a cumulative $460M.<br />
The shortfall in sales tax collections was not this dramatic, however,<br />
because the Forward Funding enabling legislation established a revenue<br />
floor for the <strong>MBTA</strong> in the event that sales tax revenue growth was<br />
diminished. As the chart shows, the difference between the 3% growth<br />
rate and the actual amount of sales tax revenue guaranteed by the<br />
enabling legislation was $150M short of the Finance Plan’s expectations.<br />
Despite widely held opinions, the shortfall in sales tax revenue has not<br />
by itself accounted for the <strong>MBTA</strong>’s growing deficits, as evidenced by<br />
this review.<br />
p. 12 <strong>MBTA</strong> <strong>Review</strong> | <strong>November</strong> <strong>2009</strong>
<strong>MBTA</strong> Expenses Actual v. Forward Funding Plan<br />
2001-2008<br />
Transportation<br />
Revenue<br />
Actual vs. Finance Plan<br />
FY01–FY08<br />
Cumulative POSItive<br />
$95 million<br />
$ Millions<br />
100<br />
80<br />
60<br />
40<br />
20<br />
0<br />
(20)<br />
(40)<br />
FY 2001 FY 2002 FY 2003 FY 2004 FY 2005 FY 2006 FY 2007 FY 2008<br />
One revenue source that performed better than Finance Plan<br />
expectations was transportation revenue.<br />
• As a result of the three fare increases implemented since Forward<br />
Funding, transportation revenue was cumulatively $95 million<br />
better than Finance Plan projections.<br />
Fare increases implemented in 2001, 2004 and 2007 raised revenues<br />
consistent with the Finance Plan’s timetable. The last fare hike actually<br />
exceeded the Plan’s target, in part because ridership grew despite the<br />
fare hike.<br />
<strong>MBTA</strong> <strong>Review</strong> | <strong>November</strong> <strong>2009</strong><br />
p. 13
Non-Operating<br />
Revenue<br />
Actual vs. Finance Plan<br />
FY01–FY08<br />
Cumulative negative<br />
$2 million<br />
$ Millions<br />
40<br />
20<br />
0<br />
(20)<br />
<strong>MBTA</strong> Expenses Actual v. Forward Funding Plan<br />
2001-2008<br />
(40)<br />
(60)<br />
FY 2001 FY 2002 FY 2003 FY 2004 FY 2005 FY 2006 FY 2007 FY 2008<br />
Non-operating revenues, generated by sources such as advertising and<br />
real estate sales and leasing proceeds, exceeded Plan projections in the<br />
early years. These advertising and real estate gains helped to pay for<br />
some of the higher costs from other areas, but were too diminutive to<br />
make a great difference. Since FY04, non-operating revenues, with the<br />
exception of parking revenues, have been below expectations.<br />
This negative trend accelerated in FY09 and will be negative for the<br />
next few years, as few prime properties are left to lease or sell. The<br />
sale of garages might generate one-time revenue but, after satisfying<br />
outstanding debt financing requirements, the loss of market-based<br />
parking revenues from these properties will not create a long-term<br />
gain and does not make a great incremental difference, considering<br />
the oncoming deficits.<br />
p. 14 <strong>MBTA</strong> <strong>Review</strong> | <strong>November</strong> <strong>2009</strong>
The Real Picture<br />
Cumulative Revenue<br />
& Expenses<br />
Actual vs. Finance Plan<br />
FY01–FY08<br />
100<br />
As the prior discussion demonstrates, <strong>MBTA</strong> operating costs have<br />
exceeded Finance Plan projections by $500M for the cost centers we<br />
highlighted, while revenues from all sources underperformed Finance<br />
Plan expectations by $58M. The combined effect has produced a<br />
cumulative variance of $558M against the Finance Plan for the first eight<br />
years under Forward Funding, as the following chart illustrates:<br />
Cumulative negative<br />
<strong>MBTA</strong> Revenues and Expenses Actual v. Finance Plan<br />
$558 million<br />
2001-2008<br />
50<br />
$ Millions<br />
0<br />
(50)<br />
(100)<br />
(150)<br />
Fuel & Utilities Expenses<br />
Payroll & Fringe Benefit Expenses<br />
The Ride Expenses<br />
Commuter Rail Expenses<br />
Sales Tax Revenue<br />
Transportation Revenue<br />
Non-Operating Revenue<br />
(200)<br />
(250)<br />
FY 2001 FY 2002 FY 2003 FY 2004 FY 2005 FY 2006 FY 2007 FY 2008 TOTAL<br />
Positive (negative) actual compared to Forward Funding Finance Plan ($ millions)<br />
Fuel & Utilities Expenses (16) (17) (24) (14) (26) (40) (51) (68) (256)<br />
Payroll & Benefit Expenses 11 9 7 0 (17) (39) (44) (40) (113)<br />
The Ride Expenses 3 (1) (4) (7) (13) (19) (24) (30) (95)<br />
Commuter Rail Expenses 11 3 2 (14) (10) (4) (4) (21) (37)<br />
Sales Tax Revenue 0 0 0 (21) (21) (35) (36) (37) (150)<br />
Transportation Revenue 20 1 (13) (16) (16) 1 35 83 95<br />
Non-Operating Revenue 26 10 7 (8) (9) (1) (5) (22) (2)<br />
(558)<br />
<strong>MBTA</strong> <strong>Review</strong> | <strong>November</strong> <strong>2009</strong><br />
p. 15
We acknowledge that the <strong>MBTA</strong>’s costs are not easy to contain due<br />
to the unavoidable staffing and capital investment demanded by its<br />
size and antiquity. But even the kinds of savings that could have been<br />
found on the margins are now inadequate to rebalance the growing<br />
structural deficit.<br />
The Bottom Line<br />
A private sector firm faced with this mountain of red ink would<br />
likely fold or seek bankruptcy.<br />
p. 16 <strong>MBTA</strong> <strong>Review</strong> | <strong>November</strong> <strong>2009</strong>
Debt Service to the Rescue —<br />
Temporarily<br />
While there is little question that total debt for the <strong>MBTA</strong> is a<br />
problem, conventional wisdom holds that a major driver behind<br />
the <strong>MBTA</strong>’s inability to be self-sufficient was the debt service<br />
payments. That is not true.<br />
In fact, debt service payments between FY01 and FY08 were $515M<br />
lower than the Finance Plan’s projections. This is demonstrated in the<br />
following chart, where the blue bars indicate the annual debt payments<br />
the <strong>MBTA</strong> committed to as part of the Finance Plan and red bars<br />
demonstrate the actual payments.<br />
Debt Service<br />
Payments<br />
500<br />
Total difference between<br />
projected and actual<br />
debt payments FY01-FY08 = $515M<br />
Actual vs. Finance Plan<br />
FY01–FY08<br />
400<br />
$26M $35M<br />
$71M<br />
$102M<br />
$117M<br />
$88M<br />
$83M<br />
$ Millions<br />
300<br />
200<br />
+$8M<br />
Finance Plan Debt Service<br />
Projected Payments<br />
100<br />
Actual Debt Service<br />
Payments<br />
0<br />
FY 2001 FY 2002 FY 2003 FY 2004 FY 2005 FY 2006 FY 2007 FY 2008<br />
Various factors account for the difference between projected and actual<br />
debt service payments; primary among them was debt refinancing<br />
and restructuring, which effectively lowered each year’s debt service<br />
payment obligations, particularly against Finance Plan projections.<br />
The chart and table on the following page display the variance between<br />
results and projections for debt service, operating costs and revenue<br />
sources. Without the benefit of the debt service “savings” shown as<br />
red bars on the chart, the Finance Plan would have been wholly<br />
unworkable as a road map to self-sufficiency.<br />
<strong>MBTA</strong> <strong>Review</strong> | <strong>November</strong> <strong>2009</strong><br />
p. 17
Cumulative Revenue<br />
& Expenses with<br />
Debt Service<br />
Actual vs. Finance Plan<br />
FY01–FY08<br />
Cumulative negative<br />
$43 million<br />
500<br />
450<br />
400<br />
350<br />
This bar shows that the <strong>MBTA</strong> paid<br />
substantially less ($515M) in debt<br />
service from FY01-FY08 than was<br />
forecast by the Finance Plan.<br />
By deferring this debt, the <strong>MBTA</strong><br />
balanced its annual budgets.<br />
Unfortunately, this contributed to<br />
overall increased debt.<br />
300<br />
250<br />
200<br />
150<br />
100<br />
50<br />
$ Millions<br />
0<br />
(50)<br />
(100)<br />
(150)<br />
Fuel & Utilities Expenses<br />
Payroll & Fringe Benefit Expenses<br />
The Ride Expenses<br />
Commuter Rail Expenses<br />
Sales Tax Revenue<br />
Transportation Revenue<br />
Non-Operating Revenue<br />
Debt Service<br />
(200)<br />
(250)<br />
FY 2001 FY 2002 FY 2003 FY 2004 FY 2005 FY 2006 FY 2007 FY 2008 TOTAL<br />
p. 18 <strong>MBTA</strong> <strong>Review</strong> | <strong>November</strong> <strong>2009</strong>
FY 2001 FY 2002 FY 2003 FY 2004 FY 2005 FY 2006 FY 2007 FY 2008<br />
Positive (negative) actual compared to Forward Funding Finance Plan ($ millions)<br />
TOTAL<br />
FY01-FY08<br />
Fuel & Utilities Expenses (16) (17) (24) (14) (26) (40) (51) (68) (256)<br />
Payroll Expenses 11 9 7 0 (17) (39) (44) (40) (113)<br />
The Ride Expenses 3 (1) (4) (7) (13) (19) (24) (30) (95)<br />
Commuter Rail Expenses 11 3 2 (14) (10) (4) (4) (21) (37)<br />
Sales Tax Revenue 0 0 0 (21) (21) (35) (36) (37) (150)<br />
Transportation Revenue 20 1 (13) (16) (16) 1 35 83 95<br />
Non-Operating Revenue 26 10 7 (8) (9) (1) (5) (22) (2)<br />
Cumulative Deficit 55 5 (25) (80) (112) (137) (129) (135) (558)<br />
Debt Service (8) 26 35 71 102 117 88 83 515<br />
TOTAL: (43)<br />
The bottom row of the preceding table displays the amounts saved each<br />
year against Finance Plan projections. The cumulative effect of these<br />
savings is compared with the cumulative growth of operating costs and<br />
underperforming revenues.<br />
<strong>MBTA</strong> <strong>Review</strong> | <strong>November</strong> <strong>2009</strong><br />
p. 19
Debt — The Faustian Bargain<br />
The Finance Plan explicitly cautioned the <strong>MBTA</strong> against accruing<br />
excessive debt: “…relying entirely on debt to fund the non-federal<br />
share of the Authority’s Capital Program is no longer sustainable<br />
under Forward Funding.”<br />
Both admonitions<br />
were prophetic.<br />
<strong>MBTA</strong> debt finances<br />
are exactly opposite<br />
the position advocated<br />
by the Finance Plan, as<br />
if these warnings had<br />
never been issued.<br />
Total Outstanding Debt<br />
10<br />
8<br />
FY01 & FY09<br />
$8.52<br />
$3.33<br />
The Finance Plan also warned against excessive debt restructuring:<br />
“The Authority can achieve some of its liquidity and capital<br />
financing objectives in the near term by restructuring a portion<br />
of its Prior Obligations debt service. However this technique<br />
defers debt service to future periods and burdens the Authority’s<br />
operations with substantial additional interest payments. This<br />
technique must be used judiciously as extensive use of debt<br />
restructuring will cause future debt service to consume larger<br />
percentages of each fare dollar.”<br />
Both admonitions were prophetic. <strong>MBTA</strong> debt finances are exactly<br />
opposite the position advocated by the Finance Plan, as if these<br />
warnings had never been issued.<br />
The Finance Plan assumed the <strong>MBTA</strong> would rapidly amortize the<br />
$5.62B in outstanding principal and interest that it had inherited from<br />
the State, known as “Prior Obligation” debt. As this amount was repaid,<br />
corresponding debt service payments would shrink, thus freeing up<br />
resources to invest in the Pay-as-You-Go capital program known as<br />
PAYGO. The chart at left compares outstanding debt at the beginning<br />
of Forward Funding with what is currently owed.<br />
$ Billions<br />
6<br />
4<br />
2<br />
$5.62<br />
$1.75<br />
$5.19<br />
$3.87<br />
Over the decade, the <strong>MBTA</strong> was able to amortize roughly 60% of the<br />
Prior Obligation principal to $1.6B, but this was offset by substantial<br />
new borrowing for the capital program, in direct contradiction to the<br />
Finance Plan’s first warning. This new borrowing proved necessary<br />
because the Finance Plan made two unrealistic assumptions: that the<br />
<strong>MBTA</strong> could afford the Finance Plan’s higher debt service payments,<br />
and that the Plan’s projected higher revenues and reduced operating<br />
costs would materialize to generate cash surpluses that would wean the<br />
<strong>MBTA</strong> from long-term borrowing.<br />
0<br />
FY 2001 FY <strong>2009</strong><br />
Interest<br />
Principal<br />
As noted in the last section, debt service payments between FY01 and<br />
FY08 were $515M lower than the Finance Plan had projected. Reduced<br />
payments were economical when $169.5M in debt was refinanced to<br />
take advantage of lower interest rates. Reduced payments were simply<br />
expedient when debt was restructured to paper over structural deficits<br />
by deferring principal and interest payments into the future. In FY07,<br />
FY08 and FY09, approximately $238M in debt service was restructured,<br />
leaving the problem of paying for that deferral to another year’s budget.<br />
p. 20 <strong>MBTA</strong> <strong>Review</strong> | <strong>November</strong> <strong>2009</strong>
The Finance Plan’s second warning was ignored as well, as extreme debt<br />
restructuring in recent years has contributed to a spike in debt service.<br />
The FY10 budget deficit was largely attributable to a $103M growth in<br />
debt service payments by growing from $341.8M in FY09 to $445.3M in<br />
FY10. By FY14, the full effect of deferring principal and interest payments<br />
will be felt when debt service is projected to reach $525M.<br />
Annual Debt<br />
Service Payments<br />
FY09–FY14<br />
600<br />
500<br />
Rapidly increasing<br />
annual debt service<br />
payments<br />
$525M<br />
400<br />
$342M<br />
$ Millions<br />
300<br />
200<br />
100<br />
0<br />
FY <strong>2009</strong> FY 2014<br />
Further impacting this growing debt service burden is the need to<br />
increase the <strong>MBTA</strong> capital spending target by $224M per year to address<br />
infrastructure issues.<br />
While the <strong>MBTA</strong>’s structural operating deficit and burgeoning debt are<br />
certainly of grave concern, equally important and directly related to the<br />
failed promise of Forward Funding is the issue of the physical condition<br />
of the <strong>MBTA</strong>’s many physical assets—from trains to tracks to tunnels.<br />
<strong>MBTA</strong> <strong>Review</strong> | <strong>November</strong> <strong>2009</strong><br />
p. 21
At Risk —<br />
System Safety & Reliability<br />
The <strong>MBTA</strong> has accomplished many impressive achievements in<br />
enhancing safety and service, yet the fact remains that it is dealing with<br />
an extensive, aging infrastructure that requires continuous maintenance,<br />
refurbishment and replacement. Unfortunately, the cost of the projects<br />
required to address these concerns far exceeds the <strong>MBTA</strong>’s capital<br />
improvement budget, which is constrained by the structural deficit<br />
discussed in the previous section. As a result, many projects that<br />
would address critical safety or system reliability issues are not<br />
funded each year.<br />
State of Good Repair<br />
The <strong>MBTA</strong> and transit systems across the country have adopted the<br />
“State of Good Repair” (SGR) standard to determine how much capital<br />
is required to maintain and/or replace existing infrastructure.<br />
State of Good Repair<br />
“...a standard wherein<br />
all capital assets are<br />
functioning at their ideal<br />
capacity within their<br />
design life”<br />
The definition used by the <strong>MBTA</strong> for a State of Good Repair is “a<br />
standard wherein all capital assets are functioning at their ideal capacity<br />
within their design life”—or said differently, “Maintain the assets so they<br />
perform as they should.”<br />
For FY10, over $3B worth of projects were identified by the <strong>MBTA</strong> as<br />
needed to address SGR issues. Only 15 of those 201 projects totaling<br />
$203M were funded. In other words, all but 6% of what was requested<br />
to address SGR issues went unfunded.<br />
SGR Project<br />
Funding Requests<br />
FY10<br />
FUNDING REQUESTED<br />
$3.2B<br />
FUNDING granted<br />
$203M<br />
186 Unfunded SGR Projects<br />
Totaling $3B<br />
94%<br />
6%<br />
15 Funded<br />
SGR Projects<br />
Totaling $203M<br />
Examples of SGR projects that went unfunded range from rehabbing<br />
bridges to replacing the stairways to the Newtonville station platform;<br />
from replacing the backup power generator turbines to repairing<br />
system-wide tunnel lighting; from overhauling the journal bearings on<br />
Orange Line cars to replacing 60-year-old cable.<br />
p. 22 <strong>MBTA</strong> <strong>Review</strong> | <strong>November</strong> <strong>2009</strong>
A Large and Growing Backlog<br />
Since the current capital planning process was implemented in<br />
2001, the <strong>MBTA</strong> has invested between $246M and $594M each<br />
year towards SGR projects.<br />
As of 2004, the backlog of SGR projects totaled $2.7B. To prevent the<br />
SGR backlog from growing larger, $470M in capital spending was needed<br />
annually. The approach has been “we may not be able to spend $2.7B<br />
and eliminate the SGR backlog, but at least it is not getting worse.”<br />
It is getting worse.<br />
The <strong>MBTA</strong> maintains an SGR database to capture information on all<br />
of its capital assets. The most recent update of the database indicates<br />
that the SGR backlog exceeds $3B and the annual allocation needed<br />
to prevent it from growing larger will be $694M, $224M more than the<br />
annual level of recent years.<br />
However, the backlog has grown to over $3B for<br />
FY10, meaning that the <strong>MBTA</strong> would now need to<br />
invest $694M each year in capital spending just<br />
to prevent the SGR backlog from growing further.<br />
SGR Backlog<br />
FY04 & FY10<br />
3.0<br />
2.9<br />
>$3B<br />
$ Billions<br />
2.8<br />
2.7<br />
$2.7B<br />
The <strong>MBTA</strong> would have had to invest an average of<br />
$470M each year in capital spending FY04-FY09<br />
in order to prevent the SGR backlog from growing.<br />
2.6<br />
FY 2004 FY 2005 FY 2006 FY 2007 FY 2008 FY <strong>2009</strong> FY 2010<br />
The <strong>MBTA</strong> can only fund a small portion of the immense backlog of<br />
projects annually, given its structural operating deficit. Each year, all<br />
capital project requests, including those addressing SGR, are prioritized<br />
and submitted by each <strong>MBTA</strong> department to the <strong>MBTA</strong> Budget<br />
Department for consideration as part of the annual Capital Investment<br />
Program (CIP).<br />
To determine which projects receive funding, each submission is scored<br />
by the Budget Department against predetermined criteria. The entire list<br />
of projects, with their scores and associated costs, is reviewed by the<br />
Authority’s management to determine which ones will receive funding.<br />
<strong>MBTA</strong> <strong>Review</strong> | <strong>November</strong> <strong>2009</strong><br />
p. 23
Each proposed capital improvement project is given a score by the<br />
Budget Department, with the maximum score being 100. The scoring<br />
criteria allots these maximum points for the following categories:<br />
Capital Investment<br />
Program (CIP)<br />
Scoring Criteria<br />
Low Priority <br />
Critical<br />
Safety<br />
Health<br />
Environment<br />
SGR<br />
Operations Impact<br />
Cost/Benefit<br />
Legal Commitments<br />
1 2 3 4 5 6 7 8 9 10 11 12 13 14 15 16 17 18 19 20<br />
Unfunded But Critical Safety Projects<br />
Safety Criterion<br />
“Project corrects<br />
an existing safetyoriented<br />
deficiency.<br />
A critical project must<br />
demonstrate imminent<br />
danger to life or limb<br />
of passengers and/or<br />
employees.”<br />
Given the <strong>MBTA</strong>’s budget for all capital improvement projects, there are<br />
many projects that are not funded even though they address urgent<br />
safety issues.<br />
For the FY10 budget cycle, there were 57 projects, totaling $590M, that<br />
scored a “10” on safety, the highest possible value for that criterion.<br />
However, only six of those projects, totaling $47.2M, were funded. In other<br />
words, $543M in safety-critical projects are NOT being funded.<br />
Safety “Level 10”<br />
Project Funding<br />
Requests<br />
FY10<br />
FUNDING REQUESTED<br />
$590M<br />
FUNDING granted<br />
$47.2M<br />
51 Unfunded Safety<br />
“Level 10” Projects<br />
Totaling $543M<br />
91%<br />
9%<br />
6 Funded Safety<br />
“Level 10” Projects<br />
Totaling $47.2M<br />
p. 24 <strong>MBTA</strong> <strong>Review</strong> | <strong>November</strong> <strong>2009</strong>
Alewife to Harvard<br />
The Alewife/Harvard<br />
Project has been<br />
proposed and unfunded<br />
for three straight years<br />
as conditions worsen.<br />
In addition to the<br />
potential of derailment, if<br />
the situation exacerbates,<br />
speed along that portion<br />
of the Red Line could slow<br />
to 10 mph. This will have<br />
a residual service impact<br />
with delays along the<br />
entire Red Line.<br />
One example of an unfunded project that received the maximum<br />
safety score of “10” is the floating slabs and tunnel leak repair project<br />
between Alewife and Harvard stations on the Red Line.<br />
This $80M project involves the complete removal and replacement of<br />
the existing system of floating concrete slabs beneath the Red Line<br />
tracks from Alewife to Harvard stations. “Floating” slabs rest atop a<br />
series of rubber disks that are designed to absorb the vibration of a<br />
train as it travels along the track.<br />
Water leaking through the tunnel walls is creating several problems:<br />
• The leaking water is deteriorating the slabs themselves,<br />
causing sinking and misalignment of some slabs.<br />
• The water is corroding the fasteners that attach the track to<br />
the concrete.<br />
• In some areas, the fasteners are no longer holding the track in<br />
place, causing track to move out of alignment and presenting<br />
the possibility of train derailment.<br />
• In addition, the water is corroding the signal system along the<br />
track and compromising the cable and wire conduits.<br />
The <strong>MBTA</strong> Fleet:<br />
Aging, Underfunded & Underperforming<br />
State of Good<br />
Repair Criterion<br />
“Project proposed must<br />
replace or renew an<br />
asset that is currently<br />
over-age or approaching<br />
its useful life. Project<br />
receives a score based<br />
on the degree to which<br />
the asset is overdue for<br />
replacement/renewal.”<br />
The <strong>MBTA</strong>’s trains, subway cars and buses provide 1.2 million rider trips<br />
each weekday. Maintaining the fleet is a Herculean and expensive task,<br />
particularly since it is aging and many vehicles are due for overhauls or<br />
replacement. Many vehicle-related projects score high in the SGR category,<br />
but due to their extraordinary cost, are not getting funded. There is a<br />
direct connection between this issue and breakdowns and service delays.<br />
• Industry standards define the “useful life” for each type of vehicle in<br />
the <strong>MBTA</strong> fleet. These guidelines recommend when vehicles should<br />
receive mid-life overhauls to assure safety and optimal performance,<br />
as well as when they should be retired and replaced. As the chart<br />
on the next page illustrates, a large concentration of <strong>MBTA</strong><br />
vehicles are either approaching or have already surpassed<br />
their useful life. Wholesale replacement of such a large number<br />
of vehicles is extraordinarily expensive and also results in less funds<br />
available for maintenance of vehicles still in service.<br />
• In many instances the MTBA cannot complete a major overhaul<br />
of certain vehicles due to limited funding. Instead they will do<br />
a partial overhaul of specific systems, such as suspension and<br />
braking, which doesn’t address all the maintenance necessary to<br />
ensure optimal performance.<br />
The following chart illustrates the age and useful life of each type of<br />
vehicle in the <strong>MBTA</strong> fleet.<br />
<strong>MBTA</strong> <strong>Review</strong> | <strong>November</strong> <strong>2009</strong><br />
p. 25
<strong>MBTA</strong> Fleet<br />
Age & Useful Life<br />
Line/Mode Fleet Qty. Service Date Age (yrs) Useful Life<br />
Heavy Rail<br />
Red No. 1 Fleet 74 1969 40 25<br />
No. 2 Fleet 58 1988 21 25<br />
No. 3 Fleet 86 1994 15 25<br />
Blue No. 4 Fleet 18 1979 30 25<br />
No. 5 Fleet 92 2008-09 1 25<br />
Orange No. 12 Fleet 120 1981 28 25<br />
Total Number of Heavy Rail Cars 448<br />
Light Rail<br />
Green No. 7 Fleet 48 1986-87 23-22 25<br />
No. 7 Fleet 46 1987-88 22-21 25<br />
No. 7 Fleet 20 1997 12 25<br />
No. 8 Fleet 95 2000-06 9-3 25<br />
PCC Cars 10 1945-46 64-63 25<br />
Total Number of Light Rail Cars 219<br />
Commuter Rail Coaches<br />
CR Pullman Coaches 57 1979 30 25<br />
MBB Coaches 67 1987-88 22-21 25<br />
Bombardier A Cars 40 1987 22 25<br />
Bombardier B Cars 106 1989-90 20-19 25<br />
Double-Decker Kawasaki Coaches 75 1990-91 19-18 25<br />
Double-Decker Kawasaki Coaches 17 1997-98 12-11 25<br />
Double-Decker Kawasaki Coaches 15 2001 8 25<br />
Double-Decker Kawasaki Coaches 33 2005-06 4-3 25<br />
Total Number of Coaches 410<br />
Commuter Rail Locomotives<br />
CR F40PH-2 Locomotives 18 1978-80 31-29 25<br />
F40PH-2C Locomotives 25 1987-88 22-21 25<br />
F40PH-2M Locomotives 12 1991, 93 18-16 25<br />
GP40-MC Locomotives (Remanufactured) 25 1997-98 12-11 25<br />
Total Number of Locomotives 80<br />
Compressed Natural Gas (CNG) Buses<br />
Bus New Flyer CNG 40-ft 17 2001-02 8-7 12<br />
NeoPlan CNG 60-ft (a) 44 2003 6 12<br />
NABI CNG 40-ft 299 2004 5 12<br />
Diesel Buses<br />
Bus “Zero-Series” 40-ft 110 1995 14 12<br />
NeoPlan ECD 40-ft 193 2004 5 12<br />
New Flyer ECD 40-ft 310 2006-08 3-1 12<br />
Alternative Power Buses<br />
Bus Flyer Trackless Trolleys 5 1976 33 15<br />
Prototype Alternative-Fuel 2 1999 10 12<br />
Electric Trolley Buses 28 2004 5 15<br />
Dual Mode Articulate 60-ft (b) 32 2005-06 4-3 12<br />
Total Number of Buses 1,040<br />
FTA Useful Life Parameters:<br />
Rail vehicles: at least 25 years<br />
Large, heavy-duty transit buses: at least 12 years of service or an accumulation of at least 500,000 miles.<br />
Fixed guideway electric trolley-bus with rubber tires obtaining power from overhead catenary: at least 15 years.<br />
p. 26 <strong>MBTA</strong> <strong>Review</strong> | <strong>November</strong> <strong>2009</strong>
FY10-FY14<br />
CIP<br />
Fleet<br />
Heavy Rail<br />
Red No. 1<br />
Red No. 2<br />
Red No. 3<br />
Blue No. 4<br />
Blue No. 5<br />
Orange No. 12<br />
1968<br />
1969<br />
1970<br />
1971<br />
1972<br />
1973<br />
1974<br />
1975<br />
1976<br />
1977<br />
1978<br />
1979<br />
1980<br />
1981<br />
1982<br />
1983<br />
1984<br />
1985<br />
1986<br />
1987<br />
1988<br />
1989<br />
1990<br />
1991<br />
1992<br />
1993<br />
1994<br />
1995<br />
1996<br />
1997<br />
1998<br />
1999<br />
2000<br />
2001<br />
2002<br />
2003<br />
2004<br />
2005<br />
2006<br />
2007<br />
2008<br />
<strong>2009</strong><br />
2010<br />
2011<br />
2012<br />
2013<br />
2014<br />
2015<br />
2016<br />
2017<br />
2018<br />
2019<br />
2020<br />
2021<br />
2022<br />
2023<br />
2024<br />
2025<br />
2026<br />
2027<br />
2028<br />
2029<br />
2030<br />
2031<br />
2032<br />
2033<br />
2034<br />
2035<br />
Pre-overhaul<br />
Light Rail<br />
Green No. 7<br />
Green No. 7<br />
Green No. 7<br />
Green No. 8<br />
Green PCC<br />
Pre-overhaul fleet goes back to 1945<br />
Commuter Rail Coaches<br />
Pullman<br />
MBB<br />
Bombardier A<br />
Bombardier B<br />
Kawasaki<br />
Kawasaki<br />
Kawasaki<br />
Kawasaki<br />
Commuter Rail Locomotives<br />
F40PH-2<br />
F40PH-2C<br />
F40PH-2M<br />
GP40-MC<br />
Pre-overhaul<br />
Compressed Natural Gas (CNG) Buses<br />
New Flyer<br />
NeoPlan<br />
NABI<br />
Diesel Buses<br />
“Zero-Series”<br />
NeoPlan ECD<br />
New Flyer ECD<br />
Alternative Power Buses<br />
Flyer Trackless<br />
Prototype<br />
Elec. Trolley Bus<br />
Dual Mode Artic.<br />
Pre-overhaul<br />
<strong>MBTA</strong> <strong>Review</strong> | <strong>November</strong> <strong>2009</strong><br />
p. 27
Surprises<br />
It stands to reason that an aging, complex and underfunded<br />
transportation system will have to confront unpleasant surprises<br />
that can result in safety hazards and service delays.<br />
Red Line Fire Surprise<br />
The <strong>MBTA</strong> will require<br />
approximately $140 million<br />
to replace the aging<br />
cable and that money<br />
will be diverted from<br />
other projects.<br />
A recent issue on the Red Line, when a fire erupted from old cable,<br />
illustrates such a situation. Buried under wet muck, the aging cable<br />
caught fire, resulting in a shutdown of Red Line service during rush<br />
hour. Buses and drivers were called into service—some pulled from<br />
spare inventory that was available to be deployed and some pulled<br />
off of existing routes in order to service passengers on the Red Line.<br />
This resulted in diminished service along some bus routes so that<br />
bus passengers, in addition to Red Line passengers, were unhappy<br />
and inconvenienced.<br />
A visible and well-publicized incident such as this one demands<br />
immediate attention and action. Fixing this problem becomes a priority<br />
that supersedes previously approved projects. The <strong>MBTA</strong> will require<br />
approximately $140M to replace the aging cable, and that money will<br />
be diverted from other projects such as overhauling vehicles.<br />
Looking to the future, in spite of the <strong>MBTA</strong>’s best efforts to tackle those<br />
capital repairs and improvements it deems most pressing, it is virtually<br />
guaranteed that issues will arise that will require diverting allocated<br />
funding to address problems that demand immediate attention,<br />
including the hundreds of capital projects that are awaiting funding.<br />
Ensuring Safety<br />
and Reliability<br />
In order to maintain a system that is safe and reliable for its riders,<br />
the <strong>MBTA</strong> will have no choice but to devote significant funds to<br />
capital maintenance and improvement in years to come.<br />
p. 28 <strong>MBTA</strong> <strong>Review</strong> | <strong>November</strong> <strong>2009</strong>
<strong>Review</strong> Summary<br />
Backward<br />
Funding – Déjà Vu<br />
The net result of<br />
the Forward Funding<br />
experiment is that the<br />
<strong>MBTA</strong> has come full<br />
circle, with staggering<br />
debt, burgeoning deficits<br />
and “hat in hand.”<br />
The <strong>MBTA</strong> is again in<br />
Backward Funding mode.<br />
The transfer of $160M this summer to close the <strong>MBTA</strong>’s FY10 budget<br />
deficit marked a return to “backward funding.”<br />
In 2000, Forward Funding was intended to end chronic deficit spending<br />
by providing the <strong>MBTA</strong> with the tools, including dedicated revenues,<br />
to achieve self-sufficiency. A decade later, our analysis indicates that<br />
the promise of Forward Funding could not succeed as costs grew<br />
inexorably, revenues proved inadequate and the need to sustain capital<br />
investment outgrew the <strong>MBTA</strong>’s ability to “live within its means.” The<br />
Finance Plan that was devised to implement the goal of self-sufficiency<br />
was well intentioned, but founded upon a combination of optimistic,<br />
unrealistic and untested assumptions.<br />
Critics may argue that the <strong>MBTA</strong> did not “try hard enough” to embrace<br />
Forward Funding because it failed to control the growth of operating<br />
costs. These costs indeed grew by a cumulative half-billion dollars more<br />
than the Finance Plan had anticipated between FY01 and FY08, and<br />
their continuing growth defines the deepening structural deficits of the<br />
next five years.<br />
The Finance Plan substantially underestimated the system’s cost drivers,<br />
both for costs within the <strong>MBTA</strong>’s control, such as wages, but especially<br />
for costs outside its control, such as energy, health insurance and<br />
contracted services like commuter rail and The Ride.<br />
Contrary to not trying, we found evidence that the <strong>MBTA</strong> did make<br />
some hard expense choices. Across-the-board cuts were routinely<br />
made to departmental budgets. Periodic layoffs and hiring freezes<br />
restrained the headcount. Individual managers took pride in eliminating<br />
inefficiencies and redundancies, while embracing a new organizational<br />
ethic of customer service. Yet in the end, they could not pare staff<br />
below the number needed to move hundreds of thousands of riders<br />
across hundreds of routes each workday. Add the complexity and cost<br />
of sustaining the system’s aging infrastructure, and it became evident<br />
that the cost inflation and savings assumptions in the Finance Plan were<br />
never tested against the daily grind.<br />
Several studies have proposed that the debt the <strong>MBTA</strong> inherited from<br />
the State, and resulting debt service, are the primary reasons for the<br />
<strong>MBTA</strong>’s failure to thrive under Forward Funding. Yet as we learned,<br />
debt service payments were much lower than projected over the decade<br />
because it was frequently refinanced and restructured. If any decision<br />
by the <strong>MBTA</strong> is worth second-guessing, it was the repeated deferral<br />
of principal and interest payments into a future that now looks even<br />
harder to fix, given the growing structural deficit.<br />
<strong>MBTA</strong> <strong>Review</strong> | <strong>November</strong> <strong>2009</strong><br />
p. 29
Assuming present trends continue, the deficit in FY14 could exceed<br />
$300M, or $160M less if this year’s lifeline remains available. This deficit<br />
will be exacerbated by the imperative to finance the multi-billion-dollar<br />
backlog of capital projects, most of which is categorized as State of Good<br />
Repair investments. To grow capital spending from $470M to $694M per<br />
year in order to whittle down a $3B SGR projects list, not to mention<br />
$2B in other capital needs, will require $130M more to cover annual<br />
debt service payments ten years from now. Yet, failing to invest in these<br />
expensive maintenance and replacement projects will jeopardize the<br />
system’s safety, reliability and service to the regional economy.<br />
We were asked to conduct a “frank assessment” of what’s gone right<br />
and what’s gone wrong with the <strong>MBTA</strong>. Our review has concluded that<br />
the choices ahead are difficult and stark. Stakeholders and decision<br />
makers will need to accept the reality that extremely difficult decisions<br />
must be made by the new governance structure created for the <strong>MBTA</strong><br />
and other agencies by the Transportation Reform Act.<br />
Why Is the <strong>MBTA</strong> So Important?<br />
In the over-used jargon<br />
of our times, the <strong>MBTA</strong> is<br />
“Too Big to Fail”<br />
While the financial picture is grim, it is important to note that the <strong>MBTA</strong><br />
is too valuable an economic asset to permit its further deterioration<br />
or even collapse. A robust public transportation system provides vital<br />
economic and quality-of-life benefits to residents from all walks of life<br />
and to businesses in the communities it serves. The <strong>MBTA</strong> has played<br />
an integral role in the development of Boston and surrounding cities<br />
and towns for more than a century, and on an average weekday over<br />
1.2 million trips are made on the subways, buses, commuter trains and<br />
other services that make up the system.<br />
• The <strong>MBTA</strong> provides access to job markets for Massachusetts<br />
residents and a larger employment pool for Massachusetts<br />
businesses, while at the same time removing cars from the<br />
highway system.<br />
• Transit-oriented commercial and residential development,<br />
supported by a steady stream of pedestrians and <strong>MBTA</strong> riders, is<br />
being used as a tool to encourage business growth, to revitalize<br />
declining urban neighborhoods and to enhance tax revenues for<br />
cities and towns.<br />
• Investments in the <strong>MBTA</strong> system lead to a chain reaction in<br />
business activity that far exceeds the initial investment. Whether a<br />
capital investment or transit operation project, thousands of jobs<br />
in a wide array of industries are created each year as a result of<br />
investments in the <strong>MBTA</strong>.<br />
• Allowing Eastern Massachusetts to gain a widespread reputation<br />
for having a remarkably inefficient and unsafe system would<br />
eventually be devastating for the economy and for Massachusetts.<br />
p. 30 <strong>MBTA</strong> <strong>Review</strong> | <strong>November</strong> <strong>2009</strong>
General Recommendations — No Quick Fixes<br />
There are no “quick fixes” to this myriad of issues. While we were not<br />
asked to provide specific recommendations, there are some general<br />
ones that we would suggest:<br />
Properly Prioritize<br />
Safety Issues<br />
• A high-level MassDOT examination of safety and capital projects<br />
is in order. With 51 projects classified as “a danger to life or limb<br />
of passengers and/or employees,” prioritizing these projects<br />
against public safety needs is imperative. It may require an<br />
extended period to address them properly, but what could be<br />
more important?<br />
Make Expenses<br />
Transparent<br />
• There is no question that the <strong>MBTA</strong> is an expensive and complex<br />
system. It requires large expenditures just to continue operating.<br />
Any thought that these problems can be addressed primarily<br />
through expense reductions is misguided. However, MassDOT<br />
should require more transparency in these expenses, so there is<br />
better control and more oversight in their uses.<br />
Reexamine Debt<br />
• The underlying debt issues should be reexamined in the context<br />
of this review’s findings. In addition, the <strong>MBTA</strong> should not be able<br />
to enter into new debt obligations without MassDOT oversight.<br />
Slow Expansion<br />
• It makes little sense to continue expanding the system when the<br />
<strong>MBTA</strong> cannot maintain the existing one. Slow expansion until the<br />
safety and maintenance priorities can be addressed.<br />
Develop Secure New<br />
Revenue Sources<br />
• If there is any chance for the <strong>MBTA</strong> to begin to close its deficit<br />
gap, there is little question that secure new revenue sources will<br />
have to be developed over time.<br />
Improve Safety<br />
and Service Before<br />
Increasing Fares<br />
• The only major long-term operational success of Forward Funding<br />
is the fact that the riding public paid three fare increases in the<br />
last eight years. That resulted in a cumulative $95M gain. Asking<br />
that same public in 2010 for yet another fare increase because<br />
Forward Funding did not work defies credibility. The riding public<br />
deserves to have tangible evidence that the <strong>MBTA</strong> is improving<br />
safety and service—not deteriorating further.<br />
<strong>MBTA</strong> <strong>Review</strong> | <strong>November</strong> <strong>2009</strong><br />
p. 31
Acknowledgments<br />
<strong>MBTA</strong> officials and employees were particularly helpful and worked<br />
diligently to answer our questions.<br />
It is important to point out there have been many excellent reports<br />
about the <strong>MBTA</strong> and other transportation systems in recent years,<br />
including but not limited to those conducted by:<br />
• <strong>MBTA</strong> Advisory Board<br />
• Massachusetts Taxpayers Foundation<br />
• 2007 Transportation Finance Commission<br />
• MASSPIRG Education Fund<br />
• Pioneer Institute<br />
• U.S. Department of Transportation<br />
• American Public Transportation Association<br />
• <strong>MBTA</strong> Blue Ribbon Commission<br />
Most of the data utilized in our analysis was data provided by<br />
the <strong>MBTA</strong>. A complete listing of source materials can be found in<br />
the following reference materials list.<br />
<strong>MBTA</strong> <strong>Review</strong> | <strong>November</strong> <strong>2009</strong><br />
p. 33
Reference Materials<br />
References<br />
Documents and<br />
reports reviewed for this<br />
report are listed below.<br />
Additional information too<br />
voluminous to reference<br />
was also consulted,<br />
including spreadsheets,<br />
personnel manuals,<br />
contracts, organizational<br />
charts and budget<br />
materials.<br />
American Public Transit Association. Stranded at the Station: The Impact of the Financial Crisis in<br />
Public Transportation. August <strong>2009</strong><br />
Barclays Capital. “<strong>MBTA</strong> Credit Analysis.” September <strong>2009</strong><br />
Cambridge Systematics, Inc. Building Massachusetts’ Economy through Transportation<br />
Investment: A <strong>Review</strong> of Potential New Funding Sources for Transportation. April 13, <strong>2009</strong><br />
(Prepared for “A Better City”)<br />
Energy Information Administration. “Average Retail Prices of Electricity, 1960-2008”<br />
http://www.eia.doe.gov/emeu/aer/txt/ptb0810.html<br />
Federal Transit Administration, United States Department of Transportation. Transit State of Good<br />
Repair: Beginning of the Dialogue. October 2008<br />
Federal Transit Administration. “National Transit Database”<br />
http://www.ntdprogram.gov/ntdprogram/pubs/dt/2007/DataTables07TOC.htm<br />
Goldman, Sachs & Co. (chart). “Forward-Looking State of Good Repairs Issuance: Level Debt<br />
Structuring Around FY2013.” September 23, <strong>2009</strong><br />
Kane, Brian, <strong>MBTA</strong> Advisory Board. Born Broke: How the <strong>MBTA</strong> found itself with too much debt,<br />
the corrosive defects of this debt and a comparison of the T’s deficit to its peers. April <strong>2009</strong><br />
KPMG. Massachusetts Bay Transportation Authority Independent Auditors’ Report.<br />
Financial Statements<br />
June 30, 2008<br />
June 30, 2007<br />
June 30, 2006<br />
June 30, 2005<br />
June 30, 2004<br />
June 30, 2003<br />
June 30, 2002<br />
June 30, 2001<br />
Larson, John and Eric Bourassa, MassPIRG Education Fund. Derailed by Debt: Unhealthy Choices<br />
the <strong>MBTA</strong> Will Be Forced to Make in FY<strong>2009</strong>-FY2013. Fall 2007<br />
www.masspirg.org<br />
Massachusetts Bay Commuter Railroad Company. “Boston’s Commuter Rail Service: Briefing to<br />
Mr. David D’Alessandro.” October 6, <strong>2009</strong><br />
Massachusetts Board of Conciliation and Arbitration. “Arbitration Award re: Massachusetts Bay<br />
Transportation Authority and Local 589, Amalgamated Transit Union, AFL-CIO, Case Number PS-<br />
101-2007.” July 7, 2008<br />
Massachusetts Taxpayers Foundation. (With contributions from the Pioneer Institute for Public<br />
Policy Research.) <strong>MBTA</strong> Capital Spending: Derailed by Expansion? February 2002<br />
Massachusetts Taxpayers Foundation. “Business Community’s Transportation Reform and<br />
Finance Plan.” March 3, <strong>2009</strong><br />
www.masstaxpayers.org/files/Business%2<br />
Massachusetts Taxpayers Foundation. “MTF Recommendations: Saving $1 Billion in Unaffordable<br />
Health Care Costs at the <strong>MBTA</strong>.” March 30, <strong>2009</strong><br />
http://www.masstaxpayers.org/files/<strong>MBTA</strong>%20report%20-%20NT.pdf<br />
Massachusetts Transportation Finance Committee. “Transportation Finance in Massachusetts: An<br />
Unsustainable System.” March 28, 2007<br />
http://www.eot.state.ma.us/downloads/tfc/TFC_Findings.pdf<br />
Massachusetts Transportation Finance Committee. “Transportation Finance in Massachusetts:<br />
Volume 2 Building a Sustainable Transportation Financing System.” March 28, 2007<br />
http://www.eot.state.ma.us/downloads/tfc/TFC_Findings.pdf<br />
<strong>MBTA</strong> <strong>Review</strong> | <strong>November</strong> <strong>2009</strong><br />
p. 35
<strong>MBTA</strong> Advisory Board Finance Committee. Final Report to the <strong>MBTA</strong> Advisory Board: Fiscal Year<br />
2010 Budget Request. May 28, <strong>2009</strong><br />
<strong>MBTA</strong> Advisory Board. “Advisory Board Approved FY2001 Budget.” June 18, 2000<br />
<strong>MBTA</strong> Blue Ribbon Committee. Taking the T to the Next Level of Progress: Report on Forward<br />
Funding. April 2000<br />
<strong>MBTA</strong> Budget Office. “Statement of Revenue and Expenses: FY 2001 to FY 2010.”<br />
<strong>MBTA</strong> Chief Financial Officer. “Ten Year Update: Forward Funding Summary of Progress; <strong>MBTA</strong><br />
Blue Ribbon Committee.” August 24, <strong>2009</strong><br />
<strong>MBTA</strong> Energy and Utilities Department. “<strong>MBTA</strong> Energy/Utility Costs: FY 2000-FY2010.”<br />
<strong>MBTA</strong> Financial Planning Office. (chart). “Summary of Refunding Savings/(Costs) from Fiscal 2000<br />
to Fiscal <strong>2009</strong>.”<br />
<strong>MBTA</strong> Financial Planning Office. (chart). “Legal Commitments under the Administrative Consent<br />
Order, Status Update.” September <strong>2009</strong><br />
<strong>MBTA</strong> Financial Planning Office. “FY2010 Approved Budget with Risk List, Pro Forma FY10-FY15.”<br />
<strong>MBTA</strong> Financial Planning Office. “<strong>MBTA</strong> (Forward Funding) Pro Forma Proposal by the <strong>MBTA</strong>:<br />
FY01-FY08.” April 2000<br />
<strong>MBTA</strong> Financial Planning Office. “<strong>MBTA</strong> Pro Forma, FY10-FY15.”<br />
<strong>MBTA</strong> Financial Planning Office. “<strong>MBTA</strong> Revenues and Expenses Detail Chart: Expenses<br />
Actual vs. Finance Plan: FY01-FY08.”<br />
<strong>MBTA</strong> General Manager’s Office. Capital Investment Program, FY2010-FY2014.<br />
<strong>MBTA</strong> General Manager’s Office. <strong>MBTA</strong> Forward Funding Finance Plan. May 2000<br />
<strong>MBTA</strong> General Manager’s Office. The <strong>MBTA</strong> FY<strong>2009</strong> Budget and The <strong>MBTA</strong> FY2010 Budget.<br />
<strong>MBTA</strong> Office of the Chief Financial Officer. “Massachusetts Bay Transportation Authority’s Efforts<br />
to Maximize Non-Transportation Revenue,” report to the General Court pursuant to C.161A §11.<br />
April 12, <strong>2009</strong><br />
<strong>MBTA</strong> Office of the Chief Financial Officer. Budget monitoring tool. “<strong>MBTA</strong> Weekly Report<br />
Package.” June 30, <strong>2009</strong> and July 31, <strong>2009</strong><br />
<strong>MBTA</strong> Official Statement. Massachusetts Bay Transportation Authority Senior Sales Tax Bonds,<br />
2008 Series B. April 24, 2008<br />
<strong>MBTA</strong> Operations Directorate. Bus Fleet Management Plan: FY2008-FY2018. March 2008<br />
<strong>MBTA</strong> Operations Directorate. Commuter Rail Fleet Management Plan: 2008-2022 Fleet Plan. 2008<br />
<strong>MBTA</strong> Operations Directorate. Subway Operations Fleet Management Plan. FY<strong>2009</strong>-2016.<br />
February 16, <strong>2009</strong><br />
<strong>MBTA</strong> Operations Directorate. <strong>MBTA</strong> State of Good Repair Report: Key Infrastructure and Capital<br />
Spending Issues. 2006 Edition<br />
<strong>MBTA</strong> Preliminary Official Statement. Massachusetts Bay Transportation Authority Senior Sales Tax<br />
Bonds, Series C and D. October <strong>2009</strong><br />
The National Business Coalition for Rapid Transit. “The Economic Importance of Public Transit.”<br />
<strong>November</strong> 2003<br />
http://www.apta.com/resources/reportsandpublications/Documents/economic_importance.pdf<br />
Transit Works. “Bicycle Transportation Survey.” Spring <strong>2009</strong><br />
Transit Works. “2008 Ridership Survey.” <strong>2009</strong><br />
United States Department of Transportation. 49CFR§37.121, et seq “Paratransit as a Complement<br />
to Fixed Route Service.” October 2007<br />
p. 36 <strong>MBTA</strong> <strong>Review</strong> | <strong>November</strong> <strong>2009</strong>
Report Design: Christina Van Vleck