here - Storm Prediction Center
here - Storm Prediction Center
here - Storm Prediction Center

Create successful ePaper yourself
Turn your PDF publications into a flip-book with our unique Google optimized e-Paper software.
A Brief Description of the Supercell Detection Index 1<br />
Louis Wicker and Jack Kain, National Severe <strong>Storm</strong>s Laboratory 2<br />
Steve Weiss and Dave Bright, <strong>Storm</strong> <strong>Prediction</strong> <strong>Center</strong><br />
The supercell detection index (<strong>here</strong>after, SDI) was devised to help forecasters in the 2005 NSSL-SPC spring forecast<br />
experiment with dealing with the large amount of information available from high resolution forecast models. Some<br />
participants in the program may not be familiar with the structures of modeled supercell from cloud-resolving simulations.<br />
SDI was developed to help identify storms within the model forecasts that have the dynamical character of supercells. SDI is<br />
based on the Doswell and Burgess (1993) that the primary dynamical property of a supercell updraft is a persistent, deep<br />
mesocyclone. We also use concepts from Droegemeier et al. (1993) that attempts to measure the “supercell-ness” of a storm<br />
by computing the correlation between the storm’s updraft and vertical vorticity. We use their computational methodology<br />
<strong>here</strong>, with some slight modifications, to detect supercells within the storm-scale forecast model output.<br />
We wish to measure two things. To measure the dynamical character, we compute a layer-averaged correlation between<br />
vertical velocity and vertical vorticity (which is the relative vorticity, excluding the earth’s rotation and <strong>here</strong>after ζ). Second,<br />
we are trying to categorize the “significance” of the storm rotation by scaling the correlation coefficient by the local value of<br />
ζ. T<strong>here</strong>fore small values of the SDI mean low correlation and/or low values of ζ, high values indicate large correlation<br />
values (r > 0.6) of correlation and/or large values of ζ. Importantly, values of ζ are resolution dependent. From cloud<br />
modeling studies on a 2 km horizontal mesh significant values of ζ are ~ | 0.01 s -1 |.<br />
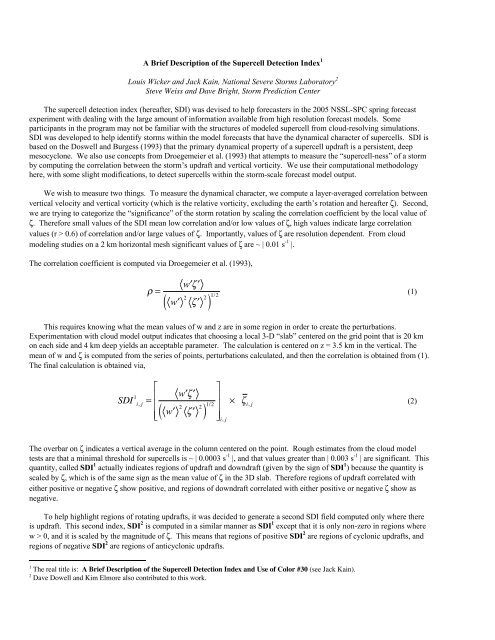
The correlation coefficient is computed via Droegemeier et al. (1993),<br />
w ′ ζ′<br />
ρ =<br />
( w ′<br />
2 ζ ′ ) 2 1/2 (1)<br />
This requires knowing what the mean values of w and z are in some region in order to create the perturbations.<br />
Experimentation with cloud model output indicates that choosing a local 3-D “slab” centered on the grid point that is 20 km<br />
on each side and 4 km deep yields an acceptable parameter. The calculation is centered on z = 3.5 km in the vertical. The<br />
mean of w and ζ is computed from the series of points, perturbations calculated, and then the correlation is obtained from (1).<br />
The final calculation is obtained via,<br />
⎡<br />
⎤<br />
w ′ ζ′<br />
SDI 1 i, j<br />
=<br />
⎢<br />
⎥<br />
× ζ<br />
⎢<br />
( w ′<br />
2 ζ ′ ) 2 1/2 ⎥ i, j<br />
(2)<br />
⎣⎢<br />
⎦⎥ i, j<br />
The overbar on ζ indicates a vertical average in the column centered on the point. Rough estimates from the cloud model<br />
tests are that a minimal threshold for supercells is ~ | 0.0003 s -1 |, and that values greater than | 0.003 s -1 | are significant. This<br />
quantity, called SDI 1 actually indicates regions of updraft and downdraft (given by the sign of SDI 1 ) because the quantity is<br />
scaled by ζ, which is of the same sign as the mean value of ζ in the 3D slab. T<strong>here</strong>fore regions of updraft correlated with<br />
either positive or negative ζ show positive, and regions of downdraft correlated with either positive or negative ζ show as<br />
negative.<br />
To help highlight regions of rotating updrafts, it was decided to generate a second SDI field computed only w<strong>here</strong> t<strong>here</strong><br />
is updraft. This second index, SDI 2 is computed in a similar manner as SDI 1 except that it is only non-zero in regions w<strong>here</strong><br />
w > 0, and it is scaled by the magnitude of ζ. This means that regions of positive SDI 2 are regions of cyclonic updrafts, and<br />
regions of negative SDI 2 are regions of anticyclonic updrafts.<br />
1 The real title is: A Brief Description of the Supercell Detection Index and Use of Color #30 (see Jack Kain).<br />
2 Dave Dowell and Kim Elmore also contributed to this work.
Examples<br />
We thought it might be helpful to show some examples from idealized cloud model simulations as to what these fields might<br />
look like. We will show the reflectivity, vertical velocity at z = ~ 1km, and then show both SDI indices. The simulations are<br />
run at 2 km horizontal resolution in order to be similar to the WRF 2 km runs.<br />
Case 1<br />
This is a case w<strong>here</strong> t<strong>here</strong> is large CAPE (> 3000 J kg -1 ) and large vertical shear, especially at low-levels, but it have low<br />
relative humidity in the boundary layer. Several cells were triggered along a north-south line. The simulation develops a<br />
NE-SW line of storms with some embedded rotating updrafts and at the southern end of the line a supercell storm develops.<br />
See Figures 1-4.<br />
Case 2<br />
This simulation is the “classic” 20 May 1977 simulation that has been used (too often) over the past 20 years or so. A single<br />
storm is triggered, and you can see the typical structure that has been documented in both the modeling and observational<br />
literature.<br />
See Figures 5-8.<br />
References<br />
Kelvin K. Droegemeier, Steven M. Lazarus and Robert Davies-Jones. 1993: The Influence of Helicity on Numerically<br />
Simulated Convective <strong>Storm</strong>s. Monthly Weather Review: Vol. 121, No. 7, pp. 2005–2029.<br />
Doswell, C.A. III and D.W. Burgess, 1993: Tornadoes and tornadic storms: A review of conceptual models. The Tornado:<br />
Its Structure, Dynamics, <strong>Prediction</strong>, and Hazards (Church et al., eds). Amer. Geophys. Union, Geophys. Monogr. 79, 161-<br />
172.

![NSWW_ROC_Overview.ppt [Read-Only] - Storm Prediction Center ...](https://img.yumpu.com/26478320/1/190x146/nsww-roc-overviewppt-read-only-storm-prediction-center-.jpg?quality=85)


![NEW_PRODUCTS_imy.ppt [Read-Only] - Storm Prediction Center ...](https://img.yumpu.com/26478296/1/190x146/new-products-imyppt-read-only-storm-prediction-center-.jpg?quality=85)