Moisture Flux Convergence - Storm Prediction Center - NOAA
Moisture Flux Convergence - Storm Prediction Center - NOAA
Moisture Flux Convergence - Storm Prediction Center - NOAA

You also want an ePaper? Increase the reach of your titles
YUMPU automatically turns print PDFs into web optimized ePapers that Google loves.
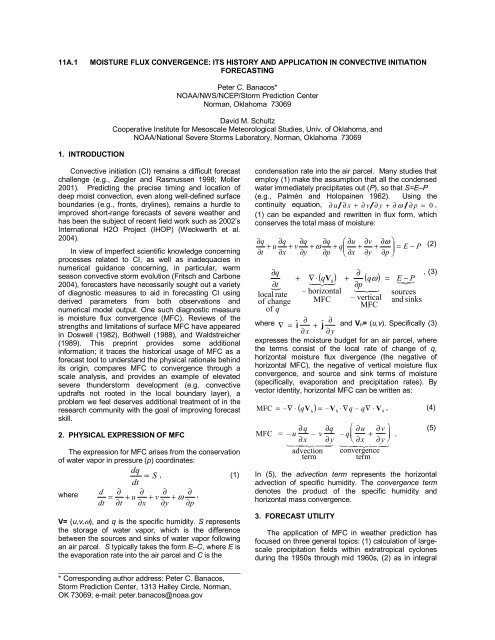
11A.1 MOISTURE FLUX CONVERGENCE: ITS HISTORY AND APPLICATION IN CONVECTIVE INITIATION<br />
FORECASTING<br />
1. INTRODUCTION<br />
Peter C. Banacos*<br />
<strong>NOAA</strong>/NWS/NCEP/<strong>Storm</strong> <strong>Prediction</strong> <strong>Center</strong><br />
Norman, Oklahoma 73069<br />
David M. Schultz<br />
Cooperative Institute for Mesoscale Meteorological Studies, Univ. of Oklahoma, and<br />
<strong>NOAA</strong>/National Severe <strong>Storm</strong>s Laboratory, Norman, Oklahoma 73069<br />
Convective initiation (CI) remains a difficult forecast<br />
challenge (e.g., Ziegler and Rasmussen 1998; Moller<br />
2001). Predicting the precise timing and location of<br />
deep moist convection, even along well-defined surface<br />
boundaries (e.g., fronts, drylines), remains a hurdle to<br />
improved short-range forecasts of severe weather and<br />
has been the subject of recent field work such as 2002’s<br />
International H2O Project (IHOP) (Weckwerth et al.<br />
2004).<br />
In view of imperfect scientific knowledge concerning<br />
processes related to CI, as well as inadequacies in<br />
numerical guidance concerning, in particular, warm<br />
season convective storm evolution (Fritsch and Carbone<br />
2004), forecasters have necessarily sought out a variety<br />
of diagnostic measures to aid in forecasting CI using<br />
derived parameters from both observations and<br />
numerical model output. One such diagnostic measure<br />
is moisture flux convergence (MFC). Reviews of the<br />
strengths and limitations of surface MFC have appeared<br />
in Doswell (1982), Bothwell (1988), and Waldstreicher<br />
(1989). This preprint provides some additional<br />
information; it traces the historical usage of MFC as a<br />
forecast tool to understand the physical rationale behind<br />
its origin, compares MFC to convergence through a<br />
scale analysis, and provides an example of elevated<br />
severe thunderstorm development (e.g. convective<br />
updrafts not rooted in the local boundary layer), a<br />
problem we feel deserves additional treatment of in the<br />
research community with the goal of improving forecast<br />
skill.<br />
2. PHYSICAL EXPRESSION OF MFC<br />
The expression for MFC arises from the conservation<br />
of water vapor in pressure (p) coordinates:<br />
dq = S , (1)<br />
where<br />
d<br />
dt<br />
dt<br />
∂ ∂ ∂ ∂<br />
= + u + v + ω ,<br />
∂t<br />
∂x<br />
∂y<br />
∂p<br />
V= (u,v,ω), and q is the specific humidity. S represents<br />
the storage of water vapor, which is the difference<br />
between the sources and sinks of water vapor following<br />
an air parcel. S typically takes the form E–C, where E is<br />
the evaporation rate into the air parcel and C is the<br />
_____________________________________________<br />
* Corresponding author address: Peter C. Banacos,<br />
<strong>Storm</strong> <strong>Prediction</strong> <strong>Center</strong>, 1313 Halley Circle, Norman,<br />
OK 73069; e-mail: peter.banacos@noaa.gov<br />
condensation rate into the air parcel. Many studies that<br />
employ (1) make the assumption that all the condensed<br />
water immediately precipitates out (P), so that S=E–P<br />
(e.g., Palmén and Holopainen 1962). Using the<br />
continuity equation, ∂ u ∂ x +∂v ∂ y +∂ω ∂ p = 0 ,<br />
(1) can be expanded and rewritten in flux form, which<br />
conserves the total mass of moisture:<br />
∂q<br />
∂q<br />
∂q<br />
∂q<br />
⎛ ∂u<br />
∂v<br />
∂ω<br />
⎞<br />
+ u + v + ω + q⎜<br />
+ + ⎟ = E − P (2)<br />
∂t<br />
∂x<br />
∂y<br />
∂p<br />
⎝ ∂x<br />
∂y<br />
∂p<br />
⎠<br />
∂q<br />
{ ∂t<br />
local<br />
of<br />
of<br />
change<br />
rate<br />
q<br />
∂<br />
∂p<br />
14243<br />
– vertical<br />
MFC<br />
( qVh) + ( qω) = 12 E −3<br />
P<br />
+ ∇<br />
14243<br />
⋅<br />
– horizontal<br />
MFC<br />
sources<br />
and sinks<br />
, (3)<br />
where ∇ = ˆ i ∂<br />
∂ x + ˆ j ∂ and V h= (u,v). Specifically (3)<br />
∂ y<br />
expresses the moisture budget for an air parcel, where<br />
the terms consist of the local rate of change of q,<br />
horizontal moisture flux divergence (the negative of<br />
horizontal MFC), the negative of vertical moisture flux<br />
convergence, and source and sink terms of moisture<br />
(specifically, evaporation and precipitation rates). By<br />
vector identity, horizontal MFC can be written as:<br />
( qV<br />
) = – Vh<br />
⋅ ∇q<br />
q∇<br />
⋅ Vh<br />
MFC = – ∇ ⋅<br />
– , (4)<br />
MFC<br />
= – u ∂q<br />
∂x – v ∂q<br />
∂y<br />
1 42<br />
443<br />
advection<br />
term<br />
h<br />
⎛<br />
– q ∂u<br />
∂x + ∂v ⎞<br />
⎜ ⎟ .<br />
⎝ ∂y ⎠<br />
1 4 24 43<br />
convergence<br />
term<br />
In (5), the advection term represents the horizontal<br />
advection of specific humidity. The convergence term<br />
denotes the product of the specific humidity and<br />
horizontal mass convergence.<br />
3. FORECAST UTILITY<br />
The application of MFC in weather prediction has<br />
focused on three general topics: (1) calculation of largescale<br />
precipitation fields within extratropical cyclones<br />
during the 1950s through mid 1960s, (2) as in integral<br />
(5)
component in the Kuo convective parameterization<br />
scheme developed in the 1960s, and, (3) severe local<br />
storm prediction beginning in 1970 as a direct result of<br />
(2). A more detailed treatment of the history of each of<br />
these areas is included in the following subsections.<br />
3.1 Calculations of precipitation in midlatitude<br />
cyclones<br />
Equation (3) can be solved for P–E, divided by the<br />
acceleration due to gravity g, and vertically integrated<br />
over the depth of the atmosphere from the surface p=p s<br />
to p=0 (Väisänen 1961; Palmén and Holopainen 1962),<br />
yielding<br />
1 ps<br />
∂q<br />
1 ps<br />
1 ps<br />
P − E = – ∫ dp – ∫ Vh<br />
⋅∇qdp<br />
– ∫ q∇<br />
⋅ V dp<br />
, (6)<br />
h<br />
g<br />
0<br />
∂t<br />
g<br />
0<br />
g<br />
0<br />
where the overbar represents a vertical integrated<br />
quantity. If one assumes that evaporation E is small in<br />
areas of intense precipitation and saturation, and that<br />
local changes in water vapor content are primarily those<br />
owing to advection in synoptic-scale systems (such that<br />
the first two terms on the right-hand side are in balance,<br />
see references above), then<br />
1 p s<br />
P ≈ – ∫ q ∇ ⋅ V h dp . (7)<br />
g 0<br />
Thus, the precipitation amount is proportional to the<br />
vertically integrated product of specific humidity and<br />
mass convergence through the depth of the<br />
atmosphere.<br />
The earliest synoptic application of (7) was from<br />
moisture budgets to estimate the large-scale<br />
precipitation in mid latitude cyclones using rawinsonde<br />
observations (Spar 1953; Bradbury 1957; Väisänen<br />
1961; Palmén and Holopainen 1962; Fankhauser 1965).<br />
However, advances in numerical weather prediction<br />
almost certainly resulted in the phasing out of these<br />
attempts beginning in the 1960s, although the concept<br />
was theoretically sound (but also quite laborious). The<br />
case studies referenced above over the United States<br />
and the United Kingdom showed that precipitation<br />
calculated from (7) reproduced well the observed spatial<br />
pattern of precipitation and the maximum precipitation<br />
amount associated with mid latitude cyclones.<br />
3.2 The Kuo Convective Parameterization Scheme<br />
Kuo (1965, 1974) wished to quantify the latent heat<br />
release during condensation in tropical cumulonimbus,<br />
the main source of energy in tropical cyclones. He<br />
surmised that quantification of the water vapor budget<br />
might reveal the magnitude of the vertical motion and<br />
latent heat release indirectly. He derived the vertically<br />
integrated condensation minus evaporation C – E as<br />
C − E = ( 1 − b ) gM t , (8)<br />
where b represents the storage of moisture and M t is<br />
termed the moisture accession:<br />
M<br />
t<br />
1<br />
⎤<br />
⎢⎣<br />
⎡ p s<br />
= – ∫ ∇ ⋅ ( q V +<br />
h ) dp F qs<br />
. (9)<br />
g 0<br />
⎥⎦<br />
<strong>Moisture</strong> accession is the sum of a vertically integrated<br />
MFC and F qs, the vertical molecular flux of water vapor<br />
from the surface. Kuo (1965) assumed that all the<br />
moisture accession goes into making clouds (i.e. b=0), a<br />
good assumption where tropical cumulus form in<br />
regions of deep conditional instability and large-scale<br />
surface convergence. Kuo (1974) found that b was<br />
much smaller than 1 in most situations and could be<br />
neglected in (9), leading to a direct relationship between<br />
the moisture accession and the condensation.<br />
Consequently, he argued that cumulus convection in the<br />
Tropics would be driven by the large-scale vertically<br />
integrated MFC.<br />
It is important to note that the Kuo scheme was<br />
developed initially for tropical cyclone simulations,<br />
where the important question is “how much” latent heat<br />
will be released, not “will” latent heat be released. In<br />
contrast, the latter is often of central concern to<br />
convective forecasters in mid-latitudes, particularly in<br />
thermodynamic environments possessing an elevated<br />
mixed-layer (Carlson et al. 1983) and some degree of<br />
convective inhibition (CIN) through most (if not all) of the<br />
diurnal cycle. More formally, the Kuo formulation<br />
assumes convection processes moisture at the rate<br />
supplied by the environment (i.e. statistical equilibrium<br />
exists, Type I convection (Emanuel 1994)). Conversely,<br />
the sudden release of a finite, and typically large,<br />
amount of CAPE that has been built over time is a<br />
binary episode (“triggered” or Type II convection<br />
(Emanuel 1994)) in which the timing, and even the<br />
occurrence of the convection itself, remains a difficult<br />
and important forecast problem. This dilemma holds<br />
true for both forecasters and numerical simulations, as<br />
was alluded to in the introduction. These imperfections<br />
in applicability of MFC endured by forecasters help to<br />
explain “false-alarm” events in which well-defined axes<br />
of MFC exist but capping inversions preclude deep<br />
convective development in otherwise favorable<br />
environments.<br />
3.3 Application of MFC to Mid Latitude Convection<br />
Hudson (1970, 1971) was the first to compute<br />
vertically integrated MFC and to compare it to the<br />
amount of moisture required for cloud development in<br />
the midlatitudes for nine severe-weather events,<br />
interpreting the ratio between these two quantities as<br />
the fraction of convective cloud cover. He computed<br />
vertically integrated MFC over a depth from the surface<br />
to 10 000 ft (3048 m) MSL because “most of the water<br />
vapor is in this layer and because loss of wind data<br />
becomes significant above this level” (Hudson 1971, p.<br />
759). Similarly, Kuo (1974) employed the top of his<br />
integration at 400 mb because of the perceived poor<br />
quality of the upper-air data above this level. Newman<br />
(1971), however, argued for using surface hourly<br />
observations to compute MFC because of their higher<br />
temporal and spatial resolution. As a result, he became<br />
the first to document the calculation of surface MFC.
The majority of studies since that time have<br />
computed surface, not vertically integrated, MFC, to<br />
take advantage of the better resolution. In Section 5 we<br />
conceptualize situations in which surface conditions<br />
may not be representative of data through a deeper<br />
layer, as well as non-surface based thunderstorm<br />
development, both of which limit the value of surface<br />
MFC in those specific scenarios.<br />
Hudson (1970, 1971) and Newman (1971) found the<br />
best association between maxima of MFC and<br />
convective storms occurred 3 h after the time of the<br />
MFC analysis. This lag time suggested that surface<br />
MFC could be used as a short-range predictive<br />
parameter, and this has been noted in other MFC case<br />
studies (e.g., Doswell 1977; Negri and Vonder Haar<br />
1980; Waldstreicher 1989). These investigations<br />
opened the door for usage of the parameter in real-time<br />
severe-weather forecast operations. In the early 1970s,<br />
implementation of surface MFC at the National Severe<br />
<strong>Storm</strong>s Forecast <strong>Center</strong> (NSSFC, now the SPC) started<br />
with a computer program providing hourly printouts of<br />
gridded surface MFC plots 30 minutes after the hour<br />
(i.e., “data time”), which were then hand analyzed by<br />
duty forecasters 1 (Ostby 1975). Today, real-time hourly<br />
analyses of MFC and other severe weather parameters<br />
can be found from a wide variety of Internet sources,<br />
including the SPC mesoscale analysis page<br />
(http://www.spc.noaa.gov/exper/mesoanalysis/).<br />
4. SCALE ANALYSIS<br />
Recall from (5) that MFC can be written as the sum<br />
of two terms: the moisture-advection and convergence<br />
terms. In this section we explore what can be said about<br />
the behavior of these terms under synoptic and<br />
mesoscale conditions typically found with initiating deep<br />
moist convection.<br />
4.1 Physical Considerations<br />
We note that in mid latitude convective situations,<br />
the range of q falls generally between 5 and 30 g kg -1 ;<br />
that is, q does not vary by more than one order of<br />
magnitude. On the other hand, horizontal divergence at<br />
the surface is highly scale dependent (Petterssen 1956),<br />
varying from 10 -6 s -1 for synoptic- and planetary-scale<br />
flows to 10 -3 s -1 near initiating surface-based<br />
thunderstorms (Ulanski and Garstang 1978). For<br />
synoptic-scale features with a time scale O(1 day) and a<br />
space scale O(1000 km), |V h|=O(10 m s -1 ), q=O(10 g kg -<br />
1 ), ∇q= O[1 g kg -1 (100 km) -1 ], and | ∇ ⋅ V h |=O(10 -6 s -<br />
1 ). Thus, the advection term | V h ⋅ ∇ q | is O(10 -4 g kg -1<br />
s -1 ) and the convergence term | q ∇ ⋅ V h | is an order of<br />
magnitude smaller at O(10 –5 g kg -1 s -1 ). That the<br />
advection term dominates the convergence term is<br />
consistent with Rasmusson (1967), who found that<br />
advection of moisture is the dominant term in controlling<br />
1<br />
H. Hudson’s move from NSSL in Norman, OK to the NSSFC<br />
in Kansas City, MO in 1971 likely aided in the implementation<br />
of MFC into the latter center’s operational analysis routine.<br />
the local change of moisture on the largest scales,<br />
including monthly and seasonal moisture budgets. The<br />
importance of Gulf of Mexico return flow northward<br />
across the Great Plains, in advance of spring upper<br />
troughs emerging from the southwestern U.S., is one<br />
well known example that emphasizes the importance of<br />
moisture advection on synoptic time scales prior to<br />
convective events.<br />
On the scale of fronts, however, |∇ ⋅V h | is an order<br />
of magnitude larger, O(10 -5<br />
s -1 ), such that both the<br />
advection and convergence terms are comparable at<br />
O(10 -4 g kg -1 s -1 ). For smaller mesoscale boundaries<br />
(e.g., lake/sea breezes, active or remnant convective<br />
outflow boundaries), or strong fronts, horizontal<br />
convergence |∇⋅Vh | would be at least an order of<br />
magnitude larger, O(10 -4 s -1 ), implying dominance of the<br />
convergence term O(10 -3 g kg -1 s -1 ).<br />
In a special observational network over south<br />
Florida (horizontal resolution of 2.5 km x 2.5 km and<br />
time resolution of 5 min), the magnitude of |∇⋅Vh | was<br />
measured as high as 2.7x10 -3 s -1 near developing<br />
convective updrafts (Ulanski and Garstang 1978).<br />
Observations of surface MFC of O(10 -3 g kg -1 s -1 ) are<br />
well documented in the vicinity of CI in severe-storm<br />
case studies (Ostby 1975; Negri and Vonder Harr 1980;<br />
Koch and McCarthy 1982). However, most standard<br />
wind observing networks are unable to resolve stormscale<br />
convergence, which is likely O(10 -2 g kg -1 s -1 ) near<br />
robust updrafts. The spatial distribution of surface<br />
observations in vicinity of mesoscale boundaries and<br />
choices in objective analysis procedures can strongly<br />
influence the character of the MFC field as has been<br />
reported previously (e.g. Doswell 1977). Nonmeteorological<br />
issues can negatively impact forecaster<br />
interpretation of the MFC field, and these problems have<br />
favored the complimentary use of remote sensing tools<br />
such as radar and visible satellite to better detect<br />
boundaries and low-level convergence in forecast<br />
practice.<br />
4.2 Case Example<br />
To compare directly the relative magnitude and<br />
spatial patterns of the convergence and advection<br />
terms, with both surface MFC and horizontal<br />
convergence, surface data for 1800 UTC 4 May 2003<br />
are objectively analyzed at 40-km horizontal grid<br />
spacing (Fig. 1). This analysis is the operational<br />
objective-analysis routine employed by the SPC<br />
(Bothwell et al. 2002), which uses hourly RUC forecasts<br />
(Benjamin et al. 2004a, b) as the first-guess field. See<br />
Bothwell et al. (2002) for additional details about the<br />
technique.<br />
At 1800 UTC 4 May 2003, a 990-mb low was<br />
centered near the northern Kansas and southern<br />
Nebraska border, with a warm front extending eastsoutheastward<br />
into western Missouri and a cold front<br />
extending west-southwestward along the surface wind<br />
shift in western Kansas and eastern Colorado (Fig. 1).<br />
Meanwhile, a dryline, extending southward from the low,<br />
was moving rapidly eastward across central Kansas,<br />
central Oklahoma, and north-central Texas, with a<br />
narrow surface moist axis (q ~ 16 g kg -1 ) between the
Fig. 1 Surface objective analysis valid at 1800 UTC on<br />
4 May 2003. Sea-level pressure (thick solid lines every<br />
2 mb), specific humidity (thin solid lines every 2 g kg -1 ).<br />
Shaded regions represent (a) the moisture advection<br />
term in MFC expression (10 -4 g kg -1 s -1 ), (b) the<br />
convergence term in MFC expression (10 -4 g kg -1 s -1 ),<br />
(c) the total moisture flux convergence (10 -4 g kg -1 s -1 ),<br />
and (d) the convergence of the total wind (10 -5 s -1 ). Lightto-dark<br />
(dark-to-light) shadings represent positive<br />
(negative) values. Pennant, barb, and half-barb<br />
represent wind speeds of 25, 5, and 2.5 m s −1 ,<br />
respectively.<br />
dryline and warm front. An attendant strong 500-hPa<br />
short-wave trough was moving eastward from Colorado<br />
and New Mexico into the central plains states at this<br />
time (not shown). The upper-level forcing combined<br />
with low-level moisture and instability resulted in the<br />
development of isolated supercells beginning around<br />
1815 UTC near the warm front in northeastern Kansas.<br />
Initiation of additional supercellular storms then<br />
occurred between 1900–2100 UTC, southward from the<br />
warm front along the convergence axis from<br />
southeastern Kansas into north-central Texas, just east<br />
of the dryline.<br />
Negative moisture advection (–2 to –6x10 -4 g kg -1 s -1 ) is<br />
observed west of the progressive dryline, but positive<br />
areas of moisture advection of the same magnitude<br />
occur in only very small areas near the warm front in<br />
eastern Kansas and along the cold front in west-central<br />
Kansas (Fig. 1a). The convergence term (Fig. 1b) is<br />
most coherent near the surface low, along the warm<br />
front, and along the cold front in western Kansas and<br />
eastern Colorado. The convergence term is also large<br />
along the dryline (Fig. 1b). The convergence term is<br />
relatively effective in highlighting the boundaries of<br />
interest, with small-scale features (or noise from the<br />
RUC first guess) dominating elsewhere across the<br />
analysis domain. The surface MFC largely reflects the<br />
convergence term, with the exception of the strong<br />
negative area west of the dryline (cf. Figs. 1c and 1b).<br />
The scaling arguments suggest that surface MFC<br />
can serve as an effective tool to detect mesoscale<br />
boundaries. However, surface convergence can serve<br />
the same purpose since it largely determines the<br />
surface MFC field. Forecasters may wish to compare<br />
MFC with convergence in convective situations to see<br />
these similarities.<br />
5. CONCEPTUALIZED VARIATIONS OF CI
Through the continuity equation, storm-scale mass<br />
convergence is a necessary, but insufficient, condition<br />
for the development of thunderstorm updrafts.<br />
Unfortunately, the horizontal mass convergence<br />
associated with developing thunderstorms may not be<br />
well resolved. This may occur in one of two general<br />
situations; either the mechanism responsible for surface<br />
convergence is highly localized and not well sampled by<br />
observations, or the convergence is not located at or<br />
near the surface at all, but within the free atmosphere<br />
where observations are relatively sparse in time and<br />
space.<br />
A conceptual diagram (see Fig. 2) illustrates<br />
commonly observed patterns of horizontal convergence<br />
as it relates to other ongoing processes in the<br />
atmosphere. In Fig. 2a, surface convergence is part of<br />
a deep tropospheric circulation as might be observed<br />
along a front with associated strong synoptic- or<br />
mesoscale forcing. These systems are efficient in<br />
eliminating convective inhibition through strong midlevel<br />
ascent, and the presence of moisture and instability<br />
often results in the surface horizontal mass<br />
convergence or MFC maxima being closely<br />
representative of the initiation location. Many published<br />
MFC case studies involve initiation of this type.<br />
In Fig. 2b, the surface convergence is part of a<br />
shallow vertical circulation confined to the PBL, above<br />
which there is usually some convective inhibition. In the<br />
absence of large-scale forcing for ascent, or in the<br />
presence of midlevel subsidence, thunderstorm<br />
development may be precluded. When a capping<br />
inversion is not present, other factors may inhibit deep<br />
convective storms. For example, the magnitude of<br />
upward vertical motion may be insufficient to force<br />
parcels to their level of free convection. Alternatively,<br />
incipient updrafts may weaken because of entrainment<br />
of midlevel air with low relative humidity into the updraft.<br />
These factors are difficult to quantify in an operational<br />
setting and contribute in large measure to the<br />
uncertainty in short-range convective forecasts.<br />
In Fig. 2c, the surface convergence is representative<br />
of a vertical circulation with considerable slope, such as<br />
along a warm front. In these situations, thunderstorm<br />
development may be horizontally displaced significantly<br />
from the convergence maxima and will be rooted above<br />
the local boundary layer (and above a relatively cool air<br />
mass). Such situations may help explain the observed<br />
displacement of storms downstream of the surface MFC<br />
maxima (e.g., Hirt 1982). Hail is the most common<br />
severe-weather threat from such elevated storms, with<br />
the potential for tornadoes and damaging winds reduced<br />
owing to the stable near-surface stratification. Other<br />
than the synoptic warm front as a candidate for such<br />
sloped ascent, operational experience suggests that<br />
subtle differences in boundary-layer characteristics<br />
arising from remnant outflow boundaries, differential<br />
cloud cover, or varying land surface characteristics can<br />
create localized regions of warm advection that can<br />
result in sufficient lift for thunderstorm development.<br />
The relative strength of convective inhibition (CIN) and<br />
Fig. 2 Schematic of subcloud convergence (conv) as it<br />
relates to cumulus convection (represented by cloud<br />
outline). Arrows represent streamlines. Thick dashed<br />
line indicates top of PBL. (a) <strong>Convergence</strong> maximum is<br />
associated with a deep tropospheric circulation and<br />
deep moist convection. (b) Surface convergence<br />
maximum is associated with shallow cumulus<br />
development owing to midlevel subsidence and/or a<br />
capping inversion. (c) Surface convergence maximum is<br />
located near change in boundary layer height. Thin<br />
dashed line indicates isentropic surfaces in (c), with<br />
cooler surface air to the right. (d) <strong>Convergence</strong><br />
maximum is rooted above the local boundary layer.<br />
storm updrafts will then modulate the ability of the<br />
individual storms to become surface-based at some<br />
point after initiation. Elevated thunderstorms have been<br />
discussed by Colman (1990a, b) and Moore et al.<br />
(2003). We believe the forecast community could benefit<br />
from additional research in this area since sparse<br />
observations aloft often make elevated thunderstorm<br />
events difficult to forecast.<br />
In Fig. 2d, subcloud convergence occurs above the<br />
PBL, such that an association between the surface<br />
horizontal mass convergence/MFC and CI does not<br />
exist. This situation is explored below.<br />
5.1 An Elevated Thunderstorm Case<br />
The surface objective analysis at 1500 UTC on 27<br />
May 2004 shows a weak surface cyclone over<br />
southeastern Kansas, with a surface boundary and<br />
associated region of maximum convergence extending<br />
from northeastern Kansas eastward across northern<br />
sections of Missouri (Fig. 3d). This boundary was<br />
developed in part through outflow from early morning<br />
thunderstorms across eastern Kansas and central<br />
Missouri. Surface winds were generally southerly<br />
equatorward of the boundary, but became weak and illdefined<br />
near and north of the surface convergence<br />
zone. Surface specific humidity values were about 12–<br />
13 g kg -1 over northern Missouri and southern Iowa.<br />
Consistent with the previous example in Fig. 1, the<br />
convergence term dominates the surface MFC (cf. Figs.
Fig. 3 As in Fig. 1, except for 1500 UTC on 27 May<br />
2004, and specific humidity contour interval is 1 g kg -1 .<br />
3b and 3c) because the advection term is relatively<br />
weak (Fig. 3a). Likewise, the similarity of surface MFC<br />
to surface horizontal mass convergence is quite striking<br />
(cf. Figs. 3c and 3d); surface MFC provides no tangible<br />
advantage to the forecaster over surface mass<br />
convergence in this case.<br />
Visible satellite imagery reveals that the initial<br />
convective development occurred in southwest Iowa<br />
around 1515 UTC, displaced about 130 km north of both<br />
the surface MFC maxima (Fig. 4) and collocated surface<br />
boundary (Fig. 3d). The near-surface stable layer in<br />
1200 UTC soundings at Topeka, Kansas, (Fig. 5a) and<br />
Omaha, Nebraska, (Fig. 5b) is likely inhibiting CI in the<br />
region of the surface boundary. An essential feature of<br />
the Topeka sounding pertinent to this case is the<br />
saturated layer at 820–780 mb (Fig. 5a). Parcels within<br />
this layer are potentially buoyant (CAPE ~ 1500 J kg -1 ),<br />
though capped above by the elevated-mixed layer air<br />
around 700 mb. Additionally, the 780–530-mb layer is<br />
much warmer at Topeka than Omaha (cf. Figs 5a,b),<br />
with the temperature difference maximized near 700 mb<br />
(10°C at Topeka vs 4°C at Omaha). This strong gradient<br />
in mid-level temperature was located along and south of<br />
the upper-level cloud band evident in visible imagery<br />
from south-central Nebraska into central Iowa, which<br />
was associated with a compact short-wave trough<br />
across central Nebraska (not shown), likely aiding in<br />
synoptic-scale forcing for ascent.<br />
A RUC initial proximity sounding at 1500 UTC in<br />
southern Iowa near the time of convective initiation is<br />
shown (Fig. 5c; location of sounding shown by “X” in<br />
Fig. 6). The sounding was modified slightly for 1500<br />
UTC surface conditions near the developing storms<br />
using a temperature of 70°F (21.1°C) and a dewpoint of<br />
62°F (16.7°C), yielding a surface-based convective<br />
inhibition of –80 J kg -1 (Fig. 5c). The RUC sounding<br />
does not resolve fully the moist layer between 800–750<br />
mb. However, animations of visible satellite imagery<br />
indicate a distinct northward surge of moisture and a<br />
band of thicker stratus clouds (moving northward at<br />
around 10 m s –1 ) into southwestern Iowa just prior to<br />
initiation, invigorating existing weaker convective<br />
updrafts in the region. Additionally, the 1455 UTC and<br />
1515 UTC surface observations at Clarinda, Iowa (ICL),<br />
in east-central Page County (see Fig. 6 for the location),<br />
indicated broken clouds at 4900 ft (1493 m) AGL.
northern half of Missouri with up to 4-in (10.2-cm)<br />
diameter hail and isolated tornadoes (not shown).<br />
6. FINAL THOUGHTS<br />
Fig. 4 GOES-12 1-km visible satellite imagery for 27<br />
May 2004: (a, top) 1515 UTC and (b, bottom) 1602<br />
UTC. Surface moisture flux convergence (dotted lines,<br />
10 -4 g kg -1 s -1 , negative values only) from SPC surface<br />
objective analysis (Bothwell et al. 2002) at (a) 1500 UTC<br />
and (b) 1600 UTC.<br />
These observations were within 25 km of, and nearly<br />
coincident in time and space with, the initial<br />
development of deep moist convection. This cloud<br />
height corresponds well with the base height of the<br />
moist layer observed at Topeka at 1200 UTC. If the<br />
RUC sounding from southwest Iowa (Fig. 5c) is modified<br />
by the moist layer from the observed Topeka sounding<br />
(Fig. 5a), the sounding that results (Fig. 5d) yields a<br />
CAPE of 2100 J kg -1 without CIN for a parcel lifted from<br />
820 mb. Combined with ascent provided by the<br />
approaching shortwave trough, this moist layer<br />
contributed to initiation of elevated supercells in<br />
prevailing strong westerly shear. The convection was<br />
quick to produce numerous reports of large hail and<br />
isolated damaging winds through 1900 UTC (Fig. 6). As<br />
the day progressed, diurnal heating reduced surfacebased<br />
CIN and ultimately allowed thunderstorm updrafts<br />
to become rooted in the boundary layer and continue<br />
severe as they tracked southeastward across the<br />
A forecaster’s primary intent in the subjective use of<br />
surface MFC is to infer developing vertical circulations<br />
that might aid in the release of potential instability,<br />
allowing for CI. Application of surface MFC frequently<br />
works because convergence of the magnitude found<br />
along mesoscale boundaries implies dominance of the<br />
convergence term in the MFC equation; the modulating<br />
influence of q and moisture advection is comparatively<br />
small (except when extreme moisture advection exists,<br />
such as along a retreating dryline). The presence of<br />
sustained convergence infers upward vertical motion<br />
through continuity considerations.<br />
We have highlighted a few caveats, which have<br />
been more or less described previously in a variety of<br />
contexts. First, a potentially unstable boundary layer air<br />
mass may be capped, and therefore the vertical<br />
circulation inferred from surface convergence is likely<br />
insufficient to carry air parcels to their LFC (e.g., Fig.<br />
2b). Second, midlevel entrainment may curtail<br />
thunderstorm growth despite otherwise favorable<br />
conditions. Third, resolution of surface data may be<br />
inadequate to resolve the scale of surface horizontal<br />
convergence associated with the upward vertical<br />
motion. Fourth, the ascending branch of motion may<br />
contain considerable slope, allowing for “downstream”<br />
development of deep moist convection. Finally, the<br />
lower branch of a vertical circulation associated with<br />
deep moist convection may not occur at the surface, but<br />
aloft.<br />
The version of the Eta model with the Kain–Fritsch<br />
cumulus parameterization (Kain et al. 2003b) provides<br />
as one of its outputs the pressure of the updraft source<br />
air (Kain et al. 2003a). Operational experience at the<br />
SPC with this field suggests that as much as 50% of<br />
thunderstorms have updraft source levels above the<br />
surface. Experience also suggests that the distinct<br />
nocturnal maximum in summertime convective rainfall<br />
over the Great Plains is often driven by elevated<br />
thunderstorm activity associated with the low-level jet<br />
(warm advection) or frontogenetic forcing.<br />
More work from the research community, aimed at<br />
new predictive strategies for elevated thunderstorm<br />
development, would be beneficial to forecasters.<br />
Elevated CI underscores the importance of determining<br />
the source of moist and unstable air for thunderstorm<br />
development. Such situations curtail the more general<br />
applicability of surface diagnostics such as MFC, since<br />
near-surface conditions are not representative of<br />
convectively processed air. However, the frequency of<br />
correct forecasts can be increased through synthesis of<br />
available data resources in three-dimensions, including<br />
determination of potential source parcels and lift<br />
mechanisms for thunderstorms. Continued research on<br />
the convective initiation process under varying largescale<br />
conditions and development of large sample<br />
compositing techniques promise to be fruitful<br />
approaches leading to the emergence of new
(a)<br />
(b)<br />
(c)<br />
Fig. 5 Skew T–log p plots of observed temperature<br />
(dark gray lines) and dewpoint temperature (light gray<br />
lines) for 1200 UTC 27 May 2004: (a) Topeka, KS, and<br />
(b) Omaha, NE. (c) RUC-2 0-h forecast sounding with<br />
modified surface conditions valid 1500 UTC 27 May<br />
2004 near the Missouri/Iowa border (see “X” in Fig. 6 for<br />
location). (d) As in (c), except sounding is modified<br />
using moist layer found on 1200 UTC Topeka sounding<br />
in (a). Horizontal bars represents vertical distribution of<br />
vertical motion (microbars s -1 ). Pennant, barb, and halfbarb<br />
represent wind speeds of 25, 5, and 2.5 m s −1 ,<br />
respectively.<br />
conceptual models, new forecast tools, and increased<br />
accuracy in CI forecasts in the years ahead.<br />
(d)<br />
Fig. 6 Preliminary National Weather Service storm<br />
report data for 1600–1900 UTC 27 May 2004 across<br />
northern Missouri and southern Iowa. Location of RUC-<br />
2 sounding in Fig. 5 is denoted by “X” in southwestern<br />
Ringgold County, Iowa. County borders are indicated<br />
by the gray lines with county names listed within.
7. ACKNOWLEDGMENTS<br />
We wish to thank the following individuals for their<br />
discussions pertaining to this research: Phillip Bothwell<br />
(SPC), Chuck Doswell (OU/CIMMS), Bob Johns<br />
(OU/CIMMS), Jack Kain (NSSL), Jim Moore (St. Louis<br />
Univ.), and Steve Weiss (SPC). Funding for Schultz was<br />
provided by <strong>NOAA</strong>/OAR/NSSL under <strong>NOAA</strong>–OU<br />
Cooperative Agreement NA17RJ1227.<br />
REFERENCES<br />
Benjamin, S. G., G. A. Grell, J. M. Brown, T. G.<br />
Smirnova, and R. Bleck, 2004a: Mesoscale weather<br />
prediction with the RUC hybrid isentropic-terrainfollowing<br />
coordinate model. Mon. Wea. Rev., 132,<br />
473–494.<br />
_____, S. G., D. Dévényi, S. S. Weygandt, K. J.<br />
Brundage, J. M. Brown, G. A. Grell, D. Kim, B. E.<br />
Schwartz, T. G. Smirnova, T. L. Smith, and G. S.<br />
Manikin, 2004b: An hourly assimilation-forecast cycle:<br />
The RUC. Mon. Wea. Rev., 132, 495–518.<br />
Bothwell, P. D., 1988: Forecasting convection with the<br />
AFOS Data Analysis Programs (ADAP-VERSION<br />
2.0), <strong>NOAA</strong> Technical Memorandum NWS SR-122,<br />
<strong>NOAA</strong>/NWS Southern Region, Fort Worth, TX, 92 pp.<br />
_____, J. A. Hart, and R. L. Thompson, 2002: An<br />
integrated three-dimensional objective analysis<br />
scheme in use at the <strong>Storm</strong> <strong>Prediction</strong> <strong>Center</strong>.<br />
Preprints, 21 st Conf. Severe Local <strong>Storm</strong>s, San<br />
Antonio, TX, Amer. Meteor. Soc., J117–J120.<br />
Bradbury, D. L., 1957: <strong>Moisture</strong> analysis and water<br />
budget in three different types of storms. J. Meteor.,<br />
14, 559–565.<br />
Carlson, T. N., S. G. Benjamin, G. S. Forbes, Y.-F. Li,<br />
1983: Elevated mixed layers in the regional severe<br />
storm environment: conceptual model and case<br />
studies. Mon. Wea. Rev., 111, 1453-1474.<br />
Colman, B. R., 1990a: Thunderstorms above frontal<br />
surfaces in environments without positive CAPE.<br />
Part I: A climatology. Mon. Wea. Rev., 118, 1103-<br />
1122.<br />
_____, B. R., 1990b: Thunderstorms above frontal<br />
surfaces in environments without positive CAPE.<br />
Part II: Organization and instability mechanisms.<br />
Mon. Wea. Rev., 118, 1123–1144.<br />
Doswell, C. A. III, 1977: Obtaining meteorologically<br />
significant surface divergence fields through the<br />
filtering property of objective analysis. Mon. Wea.<br />
Rev., 105, 885-892.<br />
_____, 1982: The operational meteorology of<br />
Convective weather, Volume 1; Operational<br />
mesoanalysis, <strong>NOAA</strong> Technical Memorandum NWS<br />
NSSFC-5, <strong>NOAA</strong>/NWS National Severe <strong>Storm</strong>s<br />
Forecast <strong>Center</strong>, Kansas City, MO.<br />
Emanuel, K. A., 1994: Atmospheric Convection. Oxford<br />
University Press, New York, 580 pp.<br />
Fankhauser, J. C., 1965: A comparison of kinematically<br />
computed precipitation with observed convective<br />
rainfall. National Severe <strong>Storm</strong>s Laboratory Report<br />
25, Norman, OK, 28 pp.<br />
Fritsch, J. M., and R. E. Carbone, 2004: Improving<br />
quantitative precipitation forecasts in the warm<br />
season: a USWRP research and development<br />
strategy. Bull. Amer. Meteor. Soc., 85, 955-965.<br />
Hirt, W. D., 1982: Short-term prediction of convective<br />
development using dew-point convergence.<br />
Preprints, Ninth Conf. on Weather Forecasting and<br />
Analysis, Seattle, WA, Amer. Meteor. Soc., 201–205.<br />
Hudson, H. R., 1970: On the relationship between<br />
horizontal moisture convergence and convective<br />
cloud formation. ESSA Tech. Memo. ERLTM-NSSL<br />
45, 29 pp.<br />
_____, 1971: On the relationship between horizontal<br />
moisture convergence and convective cloud<br />
formation. J. Appl. Meteor., 10, 755–762.<br />
Kain, J. S., M. E. Baldwin, and S. J. Weiss, 2003a:<br />
Parameterized updraft mass flux as a predictor of<br />
convective intensity. Wea. Forecasting, 18, 106–<br />
116.<br />
_____, M. E. Baldwin, P. R. Janish, S. J. Weiss, M. P.<br />
Kay, and G. W. Carbin, 2003b: Subjective verification<br />
Of numerical models as a component of a broader<br />
interaction between research and operations. Wea.<br />
Forecasting, 18, 847-860.<br />
Koch S. E., and J. McCarthy, 1982: The evolution of an<br />
Oklahoma dryline. Part II: Boundary-layer forcing of<br />
mesoconvective systems. J. Atmos. Sci., 39, 237–<br />
257.<br />
Kuo, H. L., 1965: On formation and intensification of<br />
tropical cyclones through latent heat released by<br />
cumulus convection. J. Atmos. Sci., 22, 40–63.<br />
_____, H. L., 1974: Further studies of the<br />
parameterization of the influence of cumulus<br />
convection on large-scale flow. J. Atmos. Sci., 31,<br />
1232–1240.<br />
Moller, A. R., 2001: Severe local storms forecasting.<br />
Severe Convective <strong>Storm</strong>s, Meteor. Monogr. No. 50,<br />
Amer. Meteor. Soc., 433–480.<br />
Moore, J. T., F. H. Glass, C. E. Graves, S. M. Rochette,<br />
and M. J. Singer, 2003: The environment of warmseason<br />
elevated thunderstorms associated with
heavy rainfall over the central United States. Wea.<br />
Forecasting, 18, 861–878.<br />
Negri, A. J., and T. H. Vonder Haar, 1980: <strong>Moisture</strong><br />
convergence using satellite-derived wind fields: A<br />
severe local storm case study. Mon. Wea. Rev., 108,<br />
1170–1182.<br />
Newman, W. R., 1971: The relationship between<br />
horizontal moisture convergence and severe storm<br />
occurrences. M.S. thesis, School of Meteorology,<br />
University of Oklahoma, 54 pp. [Available from<br />
School of Meteorology, University of Oklahoma, 100<br />
E. Boyd, Rm. 1310, Norman, OK 73019.]<br />
Ostby, F. P., 1975: An application of severe storm<br />
forecast techniques to the outbreak of June 8, 1974.<br />
Preprints, Ninth Conf. on Severe Local <strong>Storm</strong>s,<br />
Norman, OK, Amer.Meteor. Soc., 7–12.<br />
Palmén, E., and E. O. Holopainen, 1962: Divergence,<br />
vertical velocity and conversion between potential<br />
and kinetic energy in an extratropical disturbance.<br />
Geophysica, 8, 89–113.<br />
Petterssen, S., 1956: Weather Analysis and<br />
Forecasting. Vol. I. 2d ed. McGraw-Hill, 428 pp.<br />
Rasmusson, E. M., 1967: Atmospheric water vapor<br />
transport and the water balance of North America:<br />
Part I. Characteristics of the water vapor flux field.<br />
Mon. Wea. Rev., 95, 403–426.<br />
Spar, J., 1953: A suggested technique for quantitative<br />
precipitation forecasting. Mon. Wea. Rev., 81, 217–<br />
221.<br />
Ulanski, S. L., and M. Garstang, 1978: The role of<br />
surface divergence and vorticity in the life cycle of<br />
convective rainfall. Part I: Observations and analysis.<br />
J. Atmos. Sci., 35, 1047–1062.<br />
Väisänen, A., 1961: Investigation of the vertical air<br />
movement and related phenomena in selected<br />
synoptic situations. Commentationes Physico-<br />
Mathematicae, Societas Scientiarum Fennica, 26(7),<br />
1–73.<br />
Waldstreicher, J. S., 1989: A guide to utilizing moisture<br />
flux convergence as a predictor of convection. Nat.<br />
Wea. Dig., 14(4), 20–35.<br />
Weckwerth, T., and coauthors, 2004: An overview of the<br />
International H 20 Project (IHOP_2002) and some<br />
preliminary highlights. Bull. Amer. Meteor. Soc., 85,<br />
253-277.<br />
Ziegler, C. L., and E. N. Rasmussen, 1998: The<br />
initiation of moist convection at the dryline:<br />
Forecasting issues from a case study perspective.<br />
Wea. Forecasting, 13, 1106–1131.

![NSWW_ROC_Overview.ppt [Read-Only] - Storm Prediction Center ...](https://img.yumpu.com/26478320/1/190x146/nsww-roc-overviewppt-read-only-storm-prediction-center-.jpg?quality=85)


![NEW_PRODUCTS_imy.ppt [Read-Only] - Storm Prediction Center ...](https://img.yumpu.com/26478296/1/190x146/new-products-imyppt-read-only-storm-prediction-center-.jpg?quality=85)