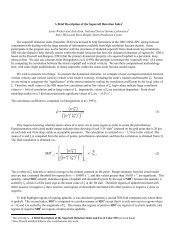
(a) (b) (c) Fig. 5 Skew T–log p plots of observed temperature (dark gray lines) and dewpoint temperature (light gray lines) for 1200 UTC 27 May 2004: (a) Topeka, KS, and (b) Omaha, NE. (c) RUC-2 0-h forecast sounding with modified surface conditions valid 1500 UTC 27 May 2004 near the Missouri/Iowa border (see “X” in Fig. 6 for location). (d) As in (c), except sounding is modified using moist layer found on 1200 UTC Topeka sounding in (a). Horizontal bars represents vertical distribution of vertical motion (microbars s -1 ). Pennant, barb, and halfbarb represent wind speeds of 25, 5, and 2.5 m s −1 , respectively. conceptual models, new forecast tools, and increased accuracy in CI forecasts in the years ahead. (d) Fig. 6 Preliminary National Weather Service storm report data for 1600–1900 UTC 27 May 2004 across northern Missouri and southern Iowa. Location of RUC- 2 sounding in Fig. 5 is denoted by “X” in southwestern Ringgold County, Iowa. County borders are indicated by the gray lines with county names listed within.
7. ACKNOWLEDGMENTS We wish to thank the following individuals for their discussions pertaining to this research: Phillip Bothwell (SPC), Chuck Doswell (OU/CIMMS), Bob Johns (OU/CIMMS), Jack Kain (NSSL), Jim Moore (St. Louis Univ.), and Steve Weiss (SPC). Funding for Schultz was provided by <strong>NOAA</strong>/OAR/NSSL under <strong>NOAA</strong>–OU Cooperative Agreement NA17RJ1227. REFERENCES Benjamin, S. G., G. A. Grell, J. M. Brown, T. G. Smirnova, and R. Bleck, 2004a: Mesoscale weather prediction with the RUC hybrid isentropic-terrainfollowing coordinate model. Mon. Wea. Rev., 132, 473–494. _____, S. G., D. Dévényi, S. S. Weygandt, K. J. Brundage, J. M. Brown, G. A. Grell, D. Kim, B. E. Schwartz, T. G. Smirnova, T. L. Smith, and G. S. Manikin, 2004b: An hourly assimilation-forecast cycle: The RUC. Mon. Wea. Rev., 132, 495–518. Bothwell, P. D., 1988: Forecasting convection with the AFOS Data Analysis Programs (ADAP-VERSION 2.0), <strong>NOAA</strong> Technical Memorandum NWS SR-122, <strong>NOAA</strong>/NWS Southern Region, Fort Worth, TX, 92 pp. _____, J. A. Hart, and R. L. Thompson, 2002: An integrated three-dimensional objective analysis scheme in use at the <strong>Storm</strong> <strong>Prediction</strong> <strong>Center</strong>. Preprints, 21 st Conf. Severe Local <strong>Storm</strong>s, San Antonio, TX, Amer. Meteor. Soc., J117–J120. Bradbury, D. L., 1957: <strong>Moisture</strong> analysis and water budget in three different types of storms. J. Meteor., 14, 559–565. Carlson, T. N., S. G. Benjamin, G. S. Forbes, Y.-F. Li, 1983: Elevated mixed layers in the regional severe storm environment: conceptual model and case studies. Mon. Wea. Rev., 111, 1453-1474. Colman, B. R., 1990a: Thunderstorms above frontal surfaces in environments without positive CAPE. Part I: A climatology. Mon. Wea. Rev., 118, 1103- 1122. _____, B. R., 1990b: Thunderstorms above frontal surfaces in environments without positive CAPE. Part II: Organization and instability mechanisms. Mon. Wea. Rev., 118, 1123–1144. Doswell, C. A. III, 1977: Obtaining meteorologically significant surface divergence fields through the filtering property of objective analysis. Mon. Wea. Rev., 105, 885-892. _____, 1982: The operational meteorology of Convective weather, Volume 1; Operational mesoanalysis, <strong>NOAA</strong> Technical Memorandum NWS NSSFC-5, <strong>NOAA</strong>/NWS National Severe <strong>Storm</strong>s Forecast <strong>Center</strong>, Kansas City, MO. Emanuel, K. A., 1994: Atmospheric Convection. Oxford University Press, New York, 580 pp. Fankhauser, J. C., 1965: A comparison of kinematically computed precipitation with observed convective rainfall. National Severe <strong>Storm</strong>s Laboratory Report 25, Norman, OK, 28 pp. Fritsch, J. M., and R. E. Carbone, 2004: Improving quantitative precipitation forecasts in the warm season: a USWRP research and development strategy. Bull. Amer. Meteor. Soc., 85, 955-965. Hirt, W. D., 1982: Short-term prediction of convective development using dew-point convergence. Preprints, Ninth Conf. on Weather Forecasting and Analysis, Seattle, WA, Amer. Meteor. Soc., 201–205. Hudson, H. R., 1970: On the relationship between horizontal moisture convergence and convective cloud formation. ESSA Tech. Memo. ERLTM-NSSL 45, 29 pp. _____, 1971: On the relationship between horizontal moisture convergence and convective cloud formation. J. Appl. Meteor., 10, 755–762. Kain, J. S., M. E. Baldwin, and S. J. Weiss, 2003a: Parameterized updraft mass flux as a predictor of convective intensity. Wea. Forecasting, 18, 106– 116. _____, M. E. Baldwin, P. R. Janish, S. J. Weiss, M. P. Kay, and G. W. Carbin, 2003b: Subjective verification Of numerical models as a component of a broader interaction between research and operations. Wea. Forecasting, 18, 847-860. Koch S. E., and J. McCarthy, 1982: The evolution of an Oklahoma dryline. Part II: Boundary-layer forcing of mesoconvective systems. J. Atmos. Sci., 39, 237– 257. Kuo, H. L., 1965: On formation and intensification of tropical cyclones through latent heat released by cumulus convection. J. Atmos. Sci., 22, 40–63. _____, H. L., 1974: Further studies of the parameterization of the influence of cumulus convection on large-scale flow. J. Atmos. Sci., 31, 1232–1240. Moller, A. R., 2001: Severe local storms forecasting. Severe Convective <strong>Storm</strong>s, Meteor. Monogr. No. 50, Amer. Meteor. Soc., 433–480. Moore, J. T., F. H. Glass, C. E. Graves, S. M. Rochette, and M. J. Singer, 2003: The environment of warmseason elevated thunderstorms associated with


![NSWW_ROC_Overview.ppt [Read-Only] - Storm Prediction Center ...](https://img.yumpu.com/26478320/1/190x146/nsww-roc-overviewppt-read-only-storm-prediction-center-.jpg?quality=85)


![NEW_PRODUCTS_imy.ppt [Read-Only] - Storm Prediction Center ...](https://img.yumpu.com/26478296/1/190x146/new-products-imyppt-read-only-storm-prediction-center-.jpg?quality=85)