Program Overview and Operations Plan - Storm Prediction Center ...
Program Overview and Operations Plan - Storm Prediction Center ...
Program Overview and Operations Plan - Storm Prediction Center ...

You also want an ePaper? Increase the reach of your titles
YUMPU automatically turns print PDFs into web optimized ePapers that Google loves.
SPC/NSSL SPRING PROGRAM 2003<br />
http://www.spc.noaa.gov/exper/Spring_2003<br />
SPC/NSSL Science Support Area<br />
14 April - 6 June 2003<br />
<strong>Program</strong> <strong>Overview</strong><br />
<strong>and</strong><br />
<strong>Operations</strong> <strong>Plan</strong><br />
5/1/03<br />
Steven Weiss, David Bright, Jason Levit, <strong>and</strong> Russell Schneider<br />
<strong>Storm</strong> <strong>Prediction</strong> <strong>Center</strong><br />
Norman, Oklahoma<br />
David Stensrud <strong>and</strong> John Kain<br />
National Severe <strong>Storm</strong>s Laboratory<br />
Norman, Oklahoma
I. Historical Perspective<br />
Co-location of the <strong>Storm</strong> <strong>Prediction</strong> <strong>Center</strong> (SPC) with the National Severe <strong>Storm</strong>s Laboratory<br />
(NSSL) <strong>and</strong> other agencies in the Norman, OK Weather <strong>Center</strong> has facilitated considerable<br />
interaction <strong>and</strong> collaboration on a variety of experimental forecast <strong>and</strong> other operationally relevant<br />
research programs. A wide cross section of local <strong>and</strong> visiting forecasters <strong>and</strong> researchers has<br />
participated in a number of programs over the past six years. These include forecasting support<br />
for field programs such as IHOP, establishing the SPC winter weather mesoscale discussion<br />
product, evaluating operational <strong>and</strong> experimental NWP models for application in convective<br />
forecasting, <strong>and</strong> integrating new observational data, objectives analyses <strong>and</strong> display tools into<br />
forecast operations. A key goal of these programs is to improve forecasts of meteorological<br />
phenomena by speeding up the transfer of new technology <strong>and</strong> research ideas into forecast<br />
operations at the SPC, <strong>and</strong> sharing new techniques, skills, <strong>and</strong> results of applied research more<br />
freely. Typical issues addressed in these activities include, but are not limited to: data overload<br />
concerns in operations, testing <strong>and</strong> evaluation of new analysis or predictive (NWP) models, better<br />
underst<strong>and</strong>ing of operational forecast problems, development <strong>and</strong> evaluation of diagnostic<br />
conceptual models, <strong>and</strong> new product development <strong>and</strong> display strategies.<br />
During the Spring of 2000 <strong>and</strong> 2001, these collaborative programs focused on critical SPC<br />
operational products including the short term predictability of severe <strong>and</strong> non-severe<br />
thunderstorms <strong>and</strong> potential impact on operational convective watch lead time. During the Spring<br />
of 2002, the program focused on providing forecasting support for the IHOP field project,<br />
primarily addressing afternoon convective initiation <strong>and</strong> nocturnal MCS development.<br />
Details about earlier Spring <strong>Program</strong>s are available at:<br />
www.spc.noaa.gov/exper/Spring_2000<br />
www.spc.noaa.gov/exper/Spring_2001<br />
www.spc.noaa.gov/exper/Spring_2002<br />
This document will provide an overview of logistical, personnel, planning <strong>and</strong> verification issues<br />
involved in the Spring <strong>Program</strong> for 2003.<br />
II.<br />
<strong>Program</strong> Motivation, Goals <strong>and</strong> Objectives<br />
The prediction of convective weather is important from both meteorological <strong>and</strong> public<br />
service/societal impact perspectives. Since a primary mission of the National Weather Service is<br />
the protection of life <strong>and</strong> property from hazardous weather phenomena, applied research aimed at<br />
improving the forecasting of severe thunderstorms <strong>and</strong> tornadoes is a critical responsibility at the<br />
<strong>Storm</strong> <strong>Prediction</strong> <strong>Center</strong> (SPC) <strong>and</strong> the National Severe <strong>Storm</strong>s Laboratory (NSSL).<br />
The SPC is responsible for the prediction of severe convective weather over the contiguous<br />
United States on time scales ranging from several hours to three days. To meet these<br />
responsibilities, the SPC issues Convective Outlooks for the Day 1, Day 2 <strong>and</strong> Day 3 periods to<br />
highlight regions with enhanced potential for severe thunderstorms (defined as thunderstorms<br />
producing hail > 3/4 inch in diameter, wind gusts > 50 kt or thunderstorm induced wind damage,<br />
or tornadoes). These outlooks are issued in both categorical (slight, moderate, or high risk) <strong>and</strong><br />
1
probabilistic formats, <strong>and</strong> are issued with increasing frequency as the severe weather time frame<br />
draws nearer. In addition to the scheduled Outlooks, Severe Thunderstorm <strong>and</strong> Tornado<br />
Watches are issued on an as-needed basis to provide a higher level of alert over smaller regions in<br />
time <strong>and</strong> space when atmospheric conditions are favorable for severe thunderstorms <strong>and</strong><br />
tornadoes to develop. The SPC also issues Mesoscale Discussion Products which emphasize<br />
hazardous weather on the mesoscale, <strong>and</strong> often serve to fill the gap between the larger scale<br />
Outlooks <strong>and</strong> near-term watches. These specialized forecast products depend on the ability of<br />
SPC forecasters to assess the current state <strong>and</strong> evolution of the environment over varied time<br />
frames, synthesizing a wide variety of observational <strong>and</strong> numerical model data sources. In<br />
general, observational data play a larger role in the shorter time frames for diagnostic purposes,<br />
however, the development of more accurate <strong>and</strong> higher resolution mesoscale models in recent<br />
years has allowed model information to play an increasing role in the short-term prediction of<br />
convection as well.<br />
In addition to the formulation of mesoscale models with ever increasing grid resolution <strong>and</strong> more<br />
sophisticated data assimilation systems <strong>and</strong> physics packages, there is increased recognition that<br />
factors such as initial condition uncertainty <strong>and</strong> model physics errors play a substantial role in<br />
setting limits of model predictability, both on synoptic time/space scales <strong>and</strong> subsynoptic scales.<br />
In fact, the impact of these sources of error may be greatest on the mesoscale <strong>and</strong> stormscale,<br />
where limits in our knowledge of physical processes <strong>and</strong> our ability to sample the atmosphere<br />
have considerable impact in the formulation of high resolution models capable of accurate<br />
prediction of small scale phenomena such as thunderstorm systems. Thus, development of<br />
ensemble forecasting systems, first used in medium-range prediction, are now being explored to<br />
assess their in short-range prediction. It is important for the SPC <strong>and</strong> NSSL to investigate the<br />
usefulness of both high resolution mesoscale models <strong>and</strong> Short-Range Ensemble Forecasting<br />
(SREF) systems for predicting severe thunderstorms, <strong>and</strong> these different approaches will be the<br />
primary focus of the 2003 Spring <strong>Program</strong>.<br />
The use of SREF systems in severe weather forecasting is very much in its infancy, with little if<br />
any previous work done to address their utility in severe convective forecasting. Thus, we will be<br />
exploring basic issues associated with the use of SREF systems, including development of<br />
appropriate meteorological fields <strong>and</strong> parameters, visualization <strong>and</strong> display techniques, <strong>and</strong><br />
interpretation of the post-processed SREF output as it relates to the formulation of outlook scale<br />
products. A major goal is to Amine@ key information that may be needed by SPC severe weather<br />
forecasters from the vast amounts of data generated by SREF systems, <strong>and</strong> determine what is<br />
most useful to operational forecasters. The statistical nature of SREF output may lend itself<br />
directly to the formulation of the probabilistic suite of operational outlook products currently<br />
issued by SPC, <strong>and</strong> this subject will be specifically addressed during the program.<br />
Finally, there continues to be a large requirement to improve the day-to-day short term prediction<br />
of convective initiation, evolution, <strong>and</strong> intensity, which relates directly to the quality of the SPC<br />
severe thunderstorm <strong>and</strong> tornado watch program. An effective NWS severe weather forecast <strong>and</strong><br />
warning program is dependent on providing the public with sufficient advance notice of<br />
impending hazardous weather. Human response studies have shown that when a warning is<br />
issued, people are more likely to seek shelter if they have been made aware of the severe weather<br />
threat prior to the issuance of the warning. However, if they have not been Apre-conditioned@ to<br />
the threat prior to hearing a warning, their first response is often to seek confirmation of the<br />
threat, rather than to seek shelter. This can result in the loss of precious time when life <strong>and</strong><br />
2
property are at immediate risk. Thus, there is a substantial need for SPC to issue severe weather<br />
watches prior to the issuance of warnings by local WFOs, but this is dependent on knowing<br />
ahead of time Awhere <strong>and</strong> when@ severe thunderstorms will develop.<br />
Beginning in the 1980s, SPC forecasters became more reliant on new sources of real-time<br />
observational data, particularly from satellite <strong>and</strong> radar, to monitor the life cycle of thunderstorms.<br />
Most notable was the discovery that forecasters could often wait until they saw signs of<br />
convective initiation before issuing a watch. This new operational methodology resulted in more<br />
accurate placement of watches in time <strong>and</strong> space, but it also changed the character of the<br />
convective watch from a pure forecast product to a hybrid nowcast/forecast product.<br />
Over the last two decades, SPC has been a recognized leader in the use of interactive computer<br />
workstations for operational forecasting of short-term hazardous weather. Given our primary<br />
mission of mesoscale forecast responsibility, it is not only prudent but necessary to place a strong<br />
emphasis on diagnostic analysis using real-time observational data for short-term thunderstorm<br />
prediction. However, owing to insufficient sampling of the mesoscale environment (especially<br />
when the distribution of water vapor is considered) coupled with limited scientific knowledge of<br />
important mesoscale <strong>and</strong> storm- scale processes, considerable uncertainty still exists in the shortterm<br />
prediction of convection. As a result, it is in our best interest to continue exploring the<br />
ability of new experimental mesoscale <strong>and</strong> near-stormscale models to predict convective<br />
development. This will allow us to see if there is information from these models that can help us<br />
more confidently predict when <strong>and</strong> where convection will develop a few hours in advance, which<br />
is directly related to potential improvements in watch lead time.<br />
These two modeling approaches allow us to examine important issues related to use of new<br />
model-based SREF systems, information transfer from models to forecasters, <strong>and</strong> high resolution<br />
model performance that can be directly related to forecaster decision making <strong>and</strong> potential<br />
improvements in severe thunderstorm forecasting.<br />
The overall goal of the Spring <strong>Program</strong> is to facilitate collaboration <strong>and</strong> interaction between SPC<br />
forecasters, NSSL scientists, <strong>and</strong> other researchers <strong>and</strong> forecasters to advance operationally<br />
relevant research <strong>and</strong> improve severe weather forecasts. During Spring <strong>Program</strong> 2003, the<br />
primary objectives are to: 1) explore the utility of SREF systems to provide unique <strong>and</strong><br />
meaningful guidance in operational severe weather forecasting, <strong>and</strong> 2) examine the ability of<br />
new high resolution models to predict convective initiation <strong>and</strong> evolution, as it relates to<br />
improving watch lead time.<br />
III.<br />
<strong>Program</strong> Focus Areas<br />
Spring <strong>Program</strong> 2003 will have seven (7) research thrust areas:<br />
1. Explore the utility of SREF systems to complement existing deterministic model output in the<br />
probabilistic convective outlook formulation process.<br />
2. Identify ways to extract meaningful information from SREF systems for use by operational<br />
severe weather forecasters.<br />
3
3. Incorporate operational forecaster insights to develop effective visualization of SREF output<br />
fields that facilitate forecast decision-making within operational time constraints.<br />
4. Test the concept of forecaster determined Afeature-based@ model sensitivity areas used in the<br />
generation of initial SREF perturbations.<br />
5. Compare forecasts from a multi-model SREF system utilizing traditional objective techniques<br />
to generate initial perturbations with an experimental SREF system utilizing an adjoint model that<br />
incorporates subjective forecaster input to generate initial perturbations.<br />
6. Examine the ability of new high resolution models to predict afternoon convective initiation<br />
<strong>and</strong> evolution.<br />
7. Compare output from a 12 km version of the WRF model with convective parameterization<br />
<strong>and</strong> a 3 km WRF with explicit precipitation physics as it relates to forecasts of convective<br />
initiation, evolution, <strong>and</strong> mode.<br />
IV.<br />
Spring <strong>Program</strong> Web Site<br />
A full description of all program objectives, types of model output, forecast products, evaluation <strong>and</strong><br />
verification forms, daily weather summary, <strong>and</strong> other related links are available at the Spring<br />
<strong>Program</strong> web site:<br />
http://www.spc.noaa.gov/exper/Spring_2003<br />
This web site will be fully operational by 1 May 2003. The site is intended to support real time<br />
activities as well as additional research <strong>and</strong> reference after the conclusion of the program.<br />
V. Dates <strong>and</strong> Participants<br />
Spring <strong>Program</strong> 2003 will run Mon-Fri from 14 April through 6 June 2003. Full time participants<br />
will work shifts of one week, with part-time visiting scientists participating on a 2-3 day basis<br />
(schedule permitting). <strong>Program</strong> operations will be conducted in the Science Support Area (SSA)<br />
located adjacent to the SPC <strong>Operations</strong> area. The full time forecast team will consist of four<br />
forecasters <strong>and</strong>/or scientists to complete daily forecasts <strong>and</strong> participate in evaluation/ verification<br />
activities. Staffing typically will include one SPC forecaster, one NSSL scientist <strong>and</strong> two visiting<br />
scientists <strong>and</strong> forecasters from NCEP/EMC, WFO/OUN <strong>and</strong> other NWS facilities, University of<br />
Oklahoma, Iowa State University, University of Arizona, MIT, <strong>and</strong> the University of Washington.<br />
Other visitors include staff from the Meteorological Services of Canada, the UK Met Office,<br />
USWRP, COMET, <strong>and</strong> NIFC.. Visiting participants are invited to present a seminar to the<br />
Norman Weather <strong>Center</strong>. Interested visitors should contact Steven Weiss (weiss@spc.noaa.gov).<br />
A brief training session will be provided to all participants on the morning of their first scheduled<br />
shift. A schedule of participants is provided in Attachment A.<br />
4
VI.<br />
Daily <strong>Operations</strong> Schedule<br />
SPC, NSSL, <strong>and</strong> visiting staff will create forecast products, conduct evaluation activities <strong>and</strong><br />
participate in a daily map discussion in the Science Support Area from 8 am - 4 pm on Mon-Thu.<br />
<strong>Operations</strong> on Friday will run from 8 am - 1:30 pm <strong>and</strong> will serve to evaluate the experimental severe<br />
weather outlook valid on the previous day, verify deterministic model forecasts valid the previous<br />
afternoon, conduct the daily SPC/NSSL map discussion, <strong>and</strong> document interesting findings by the<br />
forecast team during the week. On Friday afternoon visiting forecasters <strong>and</strong> scientists will have the<br />
opportunity to present a seminar. No experimental severe weather outlooks will be created on Friday<br />
(see daily schedule below).<br />
Participants are expected to perform evaluation activities in a collaborative manner, such that results<br />
reflect a consensus decision. Participants may eat lunch while conducting program activities or at their<br />
discretion any time during the day. Here is an outline of the daily schedule for activities during the<br />
Spring <strong>Program</strong>:<br />
Monday:<br />
8:00 am - 8:30 am: - Orientation<br />
8:30 am - 9:45 am: - Complete online forms for subjective verification of deterministic model forecasts<br />
valid for previous day<br />
9:45 am - noon: - Traditional analysis <strong>and</strong> assessment of 12z deterministic models<br />
- Submit online input for MM5 SREF perturbations by 11:20 am<br />
- Produce Initial Day 2 severe weather outlook (graphic/text due by noon)<br />
Noon - 1:30 pm: - Lunch <strong>and</strong> daily SPC/NSSL Map Discussion<br />
1:30 pm - 4:00 pm: - Assess EMC <strong>and</strong> MM5 SREF output<br />
- Produce Final Day 2 severe weather outlook <strong>and</strong> complete SREF evaluation forms<br />
- Summarize activities, archive data, <strong>and</strong> wrap-up<br />
Tuesday-Thursday:<br />
8:00 am -9:45 am: - Complete online forms for subjective verification of experimental outlooks <strong>and</strong><br />
deterministic model forecasts valid for previous day<br />
9:45 am - noon: - Traditional analysis <strong>and</strong> assessment of 12z deterministic models<br />
- Submit online input for MM5 SREF perturbations by 11:20 am<br />
- Produce Initial Day 2 severe weather outlook (graphic/text due by noon)<br />
Noon - 1:30 pm: - Lunch <strong>and</strong> daily SPC/NSSL Map Discussion<br />
1:30 pm - 4:00 pm: - Assess EMC <strong>and</strong> MM5 SREF output<br />
- Produce Final Day 2 severe weather outlook <strong>and</strong> complete SREF evaluation forms<br />
- Summarize activities, archive data, <strong>and</strong> wrap-up<br />
Friday:<br />
8:00 am - 9:45 am: - Complete online forms for subjective verification of experimental outlooks <strong>and</strong><br />
deterministic model forecasts valid for previous day<br />
9:45 am - 11:20 am - St<strong>and</strong>ard analysis <strong>and</strong> assessment of 12z deterministic models<br />
- Submit online input for MM5 SREF perturbations by 11:20 am<br />
11:20 am - noon: - Summarize weekly summary of events, issues, comments, etc.<br />
Noon - 1:30 pm: - Lunch <strong>and</strong> daily SPC/NSSL Map Discussion<br />
1:30 pm - 2:00 pm: - Complete any remaining archive of data, <strong>and</strong> wrap-up<br />
2:00 or 3:00 pm - Visitor seminar time (1 hour)<br />
VII. Forecast Products<br />
5
A forecast component will be included in the program that consists of formulating Day 2<br />
probabilistic severe weather outlooks valid for the 24 hour period beginning 12z the next day. The<br />
Day 2 time period was chosen because: 1) the forecaster decision-making process for the 24-48 hr<br />
time period depends almost entirely on model output, which simplifies the assessment of the role<br />
played by various data sources (as opposed to short-term forecasts, which are influenced by both<br />
observational data <strong>and</strong> model output), <strong>and</strong> 2) the coarser resolution SREF systems lend themselves<br />
more directly to forecasting in outlook time/space scales. A key component will be to determine the<br />
value-added impact of SREF output used by forecasters to adjust earlier forecasts based entirely on<br />
deterministic model guidance.<br />
Two severe weather outlooks will be issued. The first will be a preliminary outlook issued by Noon<br />
CDT based on deterministic model output, typically the 12z Eta model (perhaps supplemented by<br />
other models such as the EtaKF <strong>and</strong> GFS). The second outlook will be issued by 4 pm CDT, <strong>and</strong><br />
will incorporate EMC <strong>and</strong> MM5 SREF output to modify, if needed, the forecast probabilities issued<br />
in the preliminary outlook. In this way, we can compare the two outlooks <strong>and</strong> assess the impact of<br />
using new SREF output in the forecast process.<br />
Each severe weather outlook will consist of a graphical product <strong>and</strong> a short written discussion<br />
explaining the rationale of the forecast, emphasizing the role of the model guidance in the<br />
decision-making process <strong>and</strong> focusing on key uncertainties in the forecast. The severe weather<br />
outlooks will be identical to the SPC operational Day 2 probabilistic severe outlooks, which forecast<br />
the probability of all severe weather types combined (hail, wind, tornado). They cover the CONUS<br />
domain <strong>and</strong> include possible contours of 5,15, 25, 35, <strong>and</strong> 45%. When a 10% or greater probability<br />
of significant severe events (F2 or greater tornado, hail > 2 inches, or wind gusts > 65 kt), a Ahatched<br />
area@ will also be delineated. These probability values represent the expected areal coverage of<br />
severe weather across the region evaluated on an 80 km grid. This is equivalent to the probability of<br />
severe weather occurring within ~25 miles of any point. These forecasts will be verified by severe<br />
storm reports collected by the SPC from local storm report (LSR) products issued by NWS WFOs<br />
across the country.<br />
Experimental severe weather outlooks will be issued twice daily <strong>and</strong> are valid for the same time<br />
periods.<br />
Outlook Issue Time Valid Period<br />
Preliminary 17z (Noon CDT) Day 2 (12-12z)<br />
Final 21z (3 pm CDT) Day 2 (12-12z)<br />
During the preparation of the final outlook, the forecast team will be assessing various types of<br />
SREF output <strong>and</strong> utilizing this information to update the preliminary outlook. During this time, they<br />
will complete an evaluation form that will be used to document the usefulness of the two SREF<br />
systems in the forecast decision-making process. In order to complete evaluation forms in a timely<br />
manner, part of the forecast team should begin completing it while the forecast graphic <strong>and</strong> text<br />
discussion are being produced. Information about the Day 2 outlook product is provided in<br />
Attachment B; the SREF assessment forms are in Attachment C.<br />
VIII. Morning Verification Activities<br />
6
From ~8:00 am - 9:45 am daily, the forecast team will conduct subjective evaluations related to the<br />
SREF <strong>and</strong> deterministic model components of the program. Web-based forms are provided for<br />
these tasks, which are expected to be done in a collaborative manner with all team members<br />
contributing to the assessments.<br />
A. On Tuesday-Friday during this time period, subjective evaluation of the experimental Day 2<br />
severe weather outlooks valid for the previous day will also be performed. (On Tuesday morning,<br />
the Day 2 experimental outlooks valid for Friday will be evaluated). The evaluation of these<br />
outlooks will utilize plots of severe storm reports overlayed on the forecast probabilities to assess the<br />
accuracy <strong>and</strong> usefulness of the forecasts. It is important to make sure the team members assess the<br />
two outlooks (Preliminary <strong>and</strong> Final) using the following criteria: how well they delineated regions<br />
where severe reports occurred (spatial accuracy), how well they exhibited a sense of reliability (more<br />
reports occurred in regions with higher probabilities), <strong>and</strong> comparing the two outlooks in a relative<br />
sense, e.g., did the update provide better, worse, or the same level of accuracy. The verification will<br />
include numerical ratings from 0-10 <strong>and</strong> an opportunity for a brief written discussion explaining the<br />
decision. More information about the Day 2 Outlook verification forms is found in Attachment D.<br />
Objective verification of the Day 2 outlooks will also be conducted, <strong>and</strong> we view these two methods<br />
as being complementary.<br />
B. Every day, 12z deterministic model forecasts of precipitation areas valid the previous afternoon<br />
will be assessed. Subjective evaluation of the deterministic model precipitation forecasts will focus<br />
on the regional domain used by the 3 km WRF model. This domain is adjusted daily to focus on the<br />
area having the greatest severe potential based on the 13z SPC Day 1 severe outlook. Verification<br />
will be made by comparing 3-hourly accumulated precipitation produced by four high resolution<br />
models (Eta12, EtaKF20, NMM8, WRF12, <strong>and</strong> WRF3) with hourly mosaic images of radar base<br />
reflectivity. The intent is not to perform a QPF verification, because storm severity is not necessarily<br />
correlated with precipitation amounts. What we are most interested in is the ability of the model<br />
precipitation forecasts to provide useful guidance to severe weather forecasters interested in<br />
predicting the Awhere@, the Awhen@, <strong>and</strong> the spatial pattern of thunderstorm development. Our<br />
working concept is this: if we have a good idea how the timing, location, <strong>and</strong> evolution of afternoon<br />
convection will unfold, our ability to issue high quality severe weather watches will increase in some<br />
situations. In addition, we will examine more closely comparisons between the WRF12 that<br />
incorporates the K-F convective parameterization scheme <strong>and</strong> the WRF3 with explicit precipitation<br />
physics. Our goal here is twofold: 1) to assess the impact of substantially increased resolution <strong>and</strong><br />
explicit physics in the WRF, <strong>and</strong> 2) to determine if providing higher temporal resolution output<br />
(accumulated model precipitation at 1-hourly time frames compared to the st<strong>and</strong>ard 3-hourly time<br />
frames) assists forecasters in identifying detailed precipitation structures <strong>and</strong> aspects of convective<br />
mode in the model precipitation fields. It has been shown that subjective verification of mesoscale<br />
model precipitation fields provides important information about human perception of model<br />
performance, since traditional measures such as Equitable Threat Score can provide misleading<br />
information when small scale features are considered. See Attachment E for more information<br />
about the model precipitation forecast evaluation forms.<br />
IX. Daily Map Discussion<br />
A daily map discussion is held from 1:00-1:30 pm in the SSA to bring together SPC forecasters <strong>and</strong><br />
7
NSSL scientists for an informal discussion of interesting <strong>and</strong>/or unusual weather around the country,<br />
focusing primarily on severe storms during the spring season. During the Spring <strong>Program</strong> time<br />
period, it is appropriate to focus discussion on aspects of the program activities, including<br />
performance of yesterday=s high resolution models, <strong>and</strong> SREF findings that are new <strong>and</strong> thought<br />
provoking. We would like two members of the forecast team to lead each discussion; usually the<br />
SPC forecaster will manage the NAWIPS displays <strong>and</strong> lead the discussion about application of daily<br />
findings to operational forecasting, <strong>and</strong> one researcher will facilitate discussion about scientific issues<br />
related to SREF concepts <strong>and</strong>/or deterministic models. However, all participants are encouraged to<br />
contribute to the discussion. This is an excellent forum to generate discussion on a wide range of<br />
topics related to the Spring <strong>Program</strong>, <strong>and</strong> we should make sure that we are successful in raising<br />
issues of scientific <strong>and</strong> operational importance.<br />
The forecast team will have completed during the morning web based verification/evaluation forms<br />
intended to solicit specific information regarding the quality of the Day 2 Outlooks <strong>and</strong> deterministic<br />
model performance. Findings during the verification exercises will be presented in the first 5-15<br />
minutes of the daily map discussion at 1:00 pm CDT. The remaining time will be allocated to an<br />
open discussion related to short-range forecast issues, the preliminary Day 2 Outlook, <strong>and</strong> a look at<br />
SREF activties. The map discussion is scheduled to end promptly at 1:30 pm, so team members will<br />
have sufficient time to prepare for the final Day 2 Outlook later in the afternoon. The forecast team<br />
is asked to document important comments, ideas, <strong>and</strong> findings made in map discussion pertaining to<br />
convective forecast issues for later review.<br />
IX.<br />
Forecaster/Participant Duties <strong>and</strong> Responsibilities<br />
All new participants will participate in an orientation session on the morning of their first scheduled<br />
shift. However, to become familiar with program goals <strong>and</strong> objectives, all participants are asked to<br />
read the operations plan prior to their first day in the SSA.<br />
The forecast team will be made up of four members on most days, with shorter-term visitors<br />
present on some of the days (see schedule, Attachment A). There are two critical tasks that<br />
must be achieved.<br />
1). First, input for the generation of the MM5 SREF perturbations must be submitted by<br />
11:20 am. There is a fixed time to run the MM5 SREF system, with no flexibility for<br />
delays. (See attachment G for information about forecaster input to the MM5 SREF.)<br />
2). The Day 2 outlooks should be created <strong>and</strong> issued in a timely manner, because this helps<br />
simulate a real-world forecasting environment where time deadlines must be met.<br />
Completion of evaluation forms <strong>and</strong> documentation of key scientific findings are also important,<br />
but should not delay creation or issuance of the forecast products.<br />
Participants in the Spring <strong>Program</strong> are responsible for the following activities while on shift:<br />
U<br />
U<br />
Complete Verification <strong>and</strong> Evaluation forms for the high resolution model<br />
forecasts <strong>and</strong> experimental Day 2 severe weather outlooks valid the previous day.<br />
Submit all input for MM5 SREF perturbations by 11:20 am.<br />
8
U<br />
U<br />
Complete experimental Day 2 outlooks by Noon <strong>and</strong> 4 pm.<br />
Set up <strong>and</strong> facilitate daily Map Discussion (including review of previous day<br />
forecasts <strong>and</strong> other relevant verification issues)<br />
The order <strong>and</strong> responsibilities for completing scheduled activities should depend on individual skills<br />
<strong>and</strong> areas of interest. Since the SPC forecaster has the most familiarity with equipment <strong>and</strong> data flow,<br />
they will be assigned Alead@ of the forecast team.<br />
While it is recommended the entire forecast team work together <strong>and</strong> interact on forecast issuance<br />
<strong>and</strong> evaluation activities, it is most feasible to work in groups of two on specific tasks, with<br />
interaction as needed. A suggested breakout of specific duties is as follows:<br />
Team Member A - SPC Representative who should lead the forecast team during daily operations.<br />
They are responsible for facilitating the outlook process <strong>and</strong> discussion, creating<br />
forecast graphics, <strong>and</strong> writing the outlook discussions. This forecaster=s primary<br />
work area will be the Linux NAWIPS workstation in the northwest corner of the<br />
SSA. Forecaster A should lead map discussion on the first day of operations, but<br />
that responsibility should be shared among other participants as they become more<br />
familiar with systems/displays later in the week.<br />
Team Member B -<br />
NSSL Representative who is primarily responsible for providing insight into the<br />
performance of specific models, adding insight to the forecast process via use of<br />
model output, <strong>and</strong> providing assistance in completing the Final Outlook evaluation<br />
forms (with Member D) during the time the outlook discussion is being written.<br />
This member is also responsible for documenting important discussion topics during<br />
map discussion. Their primary work area will be the Linux NAWIPS workstation<br />
located in the southeast corner of the SSA.<br />
Team Member C - Visiting Scientists should provide insight into that part of the forecast process with<br />
which they are most familiar. Those with some background or interest in<br />
operational forecasting will work more closely with the SPC forecaster <strong>and</strong> assist in<br />
the outlook process. These participants should focus on their areas of expertise as it<br />
pertains to issuance of the outlook product, evaluation activities, or model/SREF<br />
system development <strong>and</strong> concepts. Their primary work area will be the<br />
Linux/Windows PC <strong>and</strong> HP NAWIPS workstation located on the north part of the<br />
SSA. This member will document the fields identified for input to generate<br />
perturbations for the MM5 SREF system. This person will work with Member B to<br />
complete SREF evaluation forms while the final outlook discussion is being written.<br />
Team Member D<br />
- This visiting scientist or forecaster will work most closely with the NSSL scientist to<br />
interpret model systems <strong>and</strong> output. They will provide perspective from the<br />
operational forecasting or research community to identify issues related to model<br />
strengths/weaknesses, <strong>and</strong>/or ways to make model output more useful to forecasters.<br />
Their primary work area will be the Linux/Windows PC <strong>and</strong> HP NAWIPS<br />
workstation on the south side of the SSA.<br />
Visitor(s) - These visiting scientists or forecasters are invited to participate in the forecast<br />
discussion <strong>and</strong> provide insight as applicable. They are encouraged to help in the<br />
analysis of model output <strong>and</strong> work with the forecast team as applicable. Although<br />
they do not have specific responsibilities, they can contribute to the activities as their<br />
time <strong>and</strong> interests permit.<br />
9
X. Experimental Displays <strong>and</strong> Model Data<br />
In order to incorporate new analysis displays <strong>and</strong> NWP model data into the forecast process,<br />
several non-operational data sets will be available for use during the Spring <strong>Program</strong>. It is hoped<br />
that through a proof-of-concept methodology data sets <strong>and</strong> analysis tools which provide useful<br />
information during the Spring <strong>Program</strong> will be more efficiently integrated into SPC operational<br />
data flow <strong>and</strong> workstations.<br />
Model data which will be available to forecasters participating in the Spring <strong>Program</strong> includes the<br />
following (model run resolution / model display grid):<br />
12km/80km Operational Eta Model (12, 18, 00, 06z)<br />
12km/40km Operational Eta Model (12, 18, 00, 06z)<br />
12km/12km Operational Eta Model (12, 18, 00, 06z)<br />
22km/40km Experimental EtaKF Model (00, 12z)<br />
22km/20km Experimental EtaKF Model (00, 12z)<br />
48km/40km EMC SREF (Eta/RSM/EtaKF) (09, 21z)<br />
30km/30 km NSSL/MM5 SREF (12z)<br />
8km/8km Experimental Nested Non-hydrostatic Mesoscale Model (NMM) (12z - central U.S)<br />
12km/12km NSSL WRF (12z)<br />
3km/3km NSSL WRF (12z)<br />
* Italicized fields are experimental data not typically available to SPC forecasters *<br />
* All model data will be available via NAWIPS workstations or Internet *<br />
In addition to st<strong>and</strong>ard NWP data, new displays for viewing SREF output are being developed<br />
within NAWIPS, including spaghetti, mean/spread, probability, median/max-min, probability<br />
matched mean, <strong>and</strong> operational Eta rank/departure from SREF mean charts of parameters used in<br />
severe weather forecasting. Also, the forecast teams will have ability to generate one time<br />
requests of numerous statistical quantities from the SREF grids.<br />
XI.<br />
<strong>Operations</strong> <strong>Center</strong> Hardware <strong>and</strong> Software<br />
Spring <strong>Program</strong> forecast <strong>and</strong> evaluation exercises will take place in the Science Support<br />
Area (SSA), immediately adjacent to SPC operational forecast area. Equipment available to<br />
spring program participants includes:<br />
XII. Data Archive<br />
1. Dual monitor HP <strong>and</strong> Linux Workstations running NAWIPS with Netscape available for<br />
Internet access<br />
2. Single monitor PCs with Windows XP applications (Internet, e-mail, etc.)<br />
3. Automated Report Logging System (ARLS) for real time visual <strong>and</strong> audible alerts of any<br />
convective watches or warnings (or issuance of SPC operational products).<br />
4. Four raised monitors to display U.S. loops <strong>and</strong>/or facilitate displays for map discussion.<br />
5. National Lightning Data Network display (for CG lightning info)<br />
6. Two laser printers for color <strong>and</strong> b/w hard copy output.<br />
10
The following Spring <strong>Program</strong> data are being archived on tape for post-analysis research:<br />
Gridded Model Data:<br />
All Point Forecast Data:<br />
Objective Analyses:<br />
Observational Data:<br />
Radar Data:<br />
Satellite Data:<br />
VGF Files:<br />
12km Eta (12z run) 3hrly accum. precipitation<br />
22km EtaKF (12z run) 3hrly accum precipitation<br />
12km NSSL WRF (12z) 3hrly <strong>and</strong> 1 hrly accum. precipitation<br />
3km NSSL WRF (12z) 3hrly <strong>and</strong> 1 hrly accum precipitation<br />
EMC SREF (09z run - 27-51 hrs/Day 2 output)<br />
NSSL MM5 SREF (12z)<br />
Eta, EtaKF<br />
SFCOA, sfcwxdataloop (metafiles)<br />
Surface Obs<br />
U.S. Mosaic Radar (Base Reflectivity)<br />
1-SPC / 1km Visible (GOES-E)<br />
Lightning, Severe Reports, Day 2 Experimental Outlooks<br />
11
XIII. Acknowledgments<br />
Special thanks <strong>and</strong> appreciation is extended to all participants <strong>and</strong> staff for assisting in<br />
Spring <strong>Program</strong> preparations/planning, programming <strong>and</strong> data flow issues. Without the combined<br />
efforts of many SPC <strong>and</strong> NSSL staff, the Spring <strong>Program</strong> could not be conducted. In particular,<br />
special thanks to Andy Just (SPC) for developing the web page <strong>and</strong> online data archive; Phillip<br />
Bothwell (SPC) <strong>and</strong> Mike Baldwin (CIMMS/OU) for providing access to radar <strong>and</strong> severe storm<br />
report verification data; Gregg Grosshans (SPC) for establishing model data flow <strong>and</strong> configuring<br />
the experimental outlooks for transmission <strong>and</strong> archival; Jeff Cupo for developing <strong>and</strong> organizing<br />
model display files, <strong>and</strong> Jay Liang (SPC) <strong>and</strong> Doug Rhue (SPC) for assistance in configuring<br />
hardware/software in the Science Support Area. We further wish to recognize the full support of<br />
SPC <strong>and</strong> NSSL management <strong>and</strong> enthusiasm by participants from the Environmental Modeling<br />
<strong>Center</strong> (NCEP/EMC), Hydrological <strong>Prediction</strong> <strong>Center</strong> (NCEP/HPC); National Weather Service<br />
Forecast Offices, Norman, OK <strong>and</strong> White Lake, MI; University of Oklahoma, Iowa State<br />
University, University of Arizona, MIT, University of Washington, Meteorological Services of<br />
Canada (Toronto, Montreal, <strong>and</strong> Winnipeg), the UK Met Office in Bracknell, Engl<strong>and</strong>, <strong>and</strong> the<br />
COMET program for funding assistance for visiting faculty, who provided assistance <strong>and</strong><br />
motivation for making such an undertaking a positive experience for everyone.<br />
12
Attachment A<br />
Spring <strong>Program</strong> 2003 Participant Schedule<br />
13
OPERATIONS SCHEDULE FOR SPC/NSSL SPRING PROGRAM 2003<br />
14 APRIL - 6 JUNE 2003<br />
ALL SHIFTS MON-FRI WILL BE FROM 8AM-4PM. FRI OPERATIONS WILL<br />
CONCLUDE AFTER MAP DISCUSSION AT 1:30 PM, ALTHOUGH VISITING<br />
SCIENTIST SEMINARS MAY BE PRESENTED AFTER FRIDAY MAP DISCUSSION.<br />
SCHEDULES MAY BE CHANGED OR TRADED THROUGH INDIVIDUAL AGREEMENT<br />
AND COORDINATION WITH STEVEN WEISS (x705) OR DAVID BRIGHT (x719).<br />
New Participants in the experiment are strongly encouraged to<br />
read the <strong>Operations</strong> <strong>Plan</strong> prior to working their first shift. A<br />
list of all participants by affiliation is provided at the end of<br />
this document.<br />
Updates to this document are available at:<br />
http://www.spc.noaa.gov/exper/Spring_2003/<br />
(#) - Visiting Scientist<br />
(*) - Initial spin-up week<br />
MON* TUE* WED* THU* FRI*<br />
4/14 4/15 4/16 4/17 4/18<br />
Weiss Weiss Weiss Edwards Edwards<br />
Bright Bright Bright Levit Weiss<br />
Levit Levit Levit<br />
Edwards Edwards<br />
MON TUE WED THU FRI<br />
4/21 4/22 4/23 4/24 4/25<br />
Weiss Weiss Kain Kain Weiss<br />
Kain Kain Dial Dial Dial<br />
Dial Dial Bright Bright Kain<br />
Bright Bright Bright<br />
MON TUE WED THU FRI<br />
4/28 4/29 4/30 5/1 5/2<br />
Gallus Gallus Gallus Gallus Gallus<br />
Janish Janish Janish Janish Janish<br />
Darrow Darrow Darrow Darrow Darrow<br />
Nutter Nutter Nutter Nutter Nutter<br />
Ferrier# Ferrier# Ferrier# Anderson#<br />
Anderson# Anderson#<br />
MON TUE WED THU FRI<br />
5/5 5/6 5/7 5/8 5/9<br />
Homar Homar Homar Homar Homar<br />
W<strong>and</strong>ishin W<strong>and</strong>ishin W<strong>and</strong>ishin W<strong>and</strong>ishin W<strong>and</strong>ishi<br />
Kain Kain Kain Kain Kain<br />
14
Carbin Carbin Carbin Carbin Carbin<br />
Billingsley# Billingsley# Uccellini#<br />
Ashton#<br />
MON TUE WED THU FRI<br />
5/12 5/13 5/14 5/15 5/16<br />
Manikin Manikin Manikin Manikin Manikin<br />
Stensrud Stensrud Stensrud Stensrud Stensrud<br />
Bukovsky Bukovsky Bukovsky Bukovsky Bukovsky<br />
Corfidi Carbin Carbin Carbin McQueen#<br />
Alarie#<br />
McQueen#<br />
MON TUE WED THU FRI<br />
5/19 5/20 5/21 5/22 5/23<br />
Hansen Hansen Hansen Hansen Hansen<br />
Brooks Brooks Brooks Brooks Brooks<br />
Weiss Weiss Weiss Weiss Weiss<br />
Mann Mann Mann Mann Mann<br />
Mylne# Mylne# Mylne# Mylne# Mylne#<br />
Sills# Sills# Sills# Sills# Sills#<br />
Gaynor# Gaynor# Gaynor#<br />
Du# Du# Du#<br />
Ball#<br />
MON TUE WED THU FRI<br />
5/26 5/27 5/28 5/29 5/30<br />
Bright Burgess Burgess Burgess Burgess<br />
Grimit Bright Bright Bright Bright<br />
Weiss Grimit Grimit Grimit Grimit<br />
Kain Kain Kain Kain<br />
Michaud# Michaud#<br />
MON TUE WED THU FRI<br />
6/2 6/3 6/4 6/5 6/6<br />
Brown Brown Brown Brown Brown<br />
Peters Peters Peters Peters Peters<br />
Baldwin Baldwin Baldwin Baldwin Baldwin<br />
Seaman# Seaman# Seaman# Bua# Bua#<br />
15
Full-Time Participating Scientists <strong>and</strong> Forecasters<br />
SPC: S. Weiss, D. Bright, R. Edwards, G. Dial, M. Darrow, G.<br />
Carbin, S. Corfidi, J. Peters<br />
NSSL: J. Kain, M. W<strong>and</strong>ishin, D. Stensrud, M. Baldwin, D. Burgess,<br />
H. Brooks, V. Homar<br />
NCEP/EMC: G. Manikin<br />
NWS/OUN: K. Brown<br />
NWS/DTX: G. Mann<br />
University of Oklahoma: P. Nutter, M. Bukovsky<br />
MIT: J. Hansen<br />
University of Washington: E. Grimit<br />
Iowa State University: B. Gallus<br />
Koch/Entergy Corp: P. Janish<br />
Part-Time Scientists <strong>and</strong> Forecasters<br />
NCEP/EMC: B. Ferrier, J. Du, J. McQueen<br />
NWS/NIFC: R. Billingsley<br />
NWS/USWRP: J. Gaynor<br />
UK Met Office: K. Mylne<br />
Met. Services of Canada: A. Ashton, M. Alarie, D. Ball, D. Sills,<br />
R. Michaud<br />
COMET: B. Bua<br />
NSSL: L. Wicker, D. Schultz<br />
NWS/OUN: M. Foster<br />
SPC: R. Schneider, J. Schaefer<br />
Iowa State University: C. Anderson<br />
Forecast Systems Lab.: S. Benjamin<br />
Pennsylvannia State University: N. Seaman<br />
16
Attachment B<br />
Day 2 Experimental Severe Weather Outlook Instructions<br />
17
Day 2 Experimental Severe Weather Outlook Instructions<br />
Spring <strong>Program</strong> 2003<br />
Experimental severe weather outlooks for the Day 2 period will be issued twice daily Monday-<br />
Thursday. These outlooks will be very similar to the operational day 2 outlooks, except only<br />
severe storm probability contours will be formulated (no categorical outlook, <strong>and</strong> no general<br />
thunderstorms will be forecast). The same probability contours used in the operational day 2<br />
outlooks will be used (5, 15, 25, 35, <strong>and</strong> 45 %), along with a probability of significant severe<br />
storms when appropriate. All probability lines should be CLOSED, including those along<br />
U.S. coastlines <strong>and</strong> borders. The Preliminary Outlook is issued by Noon CDT, <strong>and</strong> forecasters<br />
will utilize traditional forecasting methods based on 12z deterministic model output from the Eta,<br />
EtaKF, <strong>and</strong> GFS. During the afternoon, a Final Outlook will be issued by 4 pm CDT based on<br />
additional information received from the EMC SREF <strong>and</strong> MM5 SREF. The goal is to explore the<br />
utility of ensemble based guidance in severe weather forecasting, <strong>and</strong> to determine if it provides<br />
value-added information over <strong>and</strong> above that provided by traditional deterministic models. The<br />
statistical nature of ensemble prediction systems suggests particular application to probabilistic<br />
severe weather outlooks, where the assessment of uncertainty (or forecaster confidence) is<br />
especially important.<br />
For the Preliminary Day 2 Outlook, the forecaster will draw/save probability contours in NMAP2,<br />
<strong>and</strong> save the outlook in the same manner as for operational outlooks. After saving the outlook,<br />
enter the comm<strong>and</strong>: sp_day2 in an xterm window. This is necessary to archive the<br />
outlook, attach a date/time to the graphics file corresponding to the preliminary outlook<br />
date/time, <strong>and</strong> send the graphics to the web page. Next, a discussion will be written in a text box<br />
on the web page that is similar to operational discussions, except a prime emphasis will be on<br />
aspects of uncertainty that impacts the development of severe weather on Day 2. For example, if<br />
models diverge on the placement of primary synoptic features (e.g, upper trough, surface<br />
low/boundaries), or if there is concern about the moisture return, or the breaking of a cap (will<br />
convection develop?), then these factors will be explicitly discussed in the discussion box below<br />
the outlook graphic on the web page. The text box is preformatted to provide a section to discuss<br />
forecast uncertainties.<br />
For the Final Day 2 Outlook, the forecast team will assess the EMC SREF <strong>and</strong> MM5 SREF<br />
during the afternoon, <strong>and</strong> determine if any output provides improved underst<strong>and</strong>ing of the severe<br />
weather threat for tomorrow. After examining SREF output in NMAP2SP (see below), the team<br />
should decide if their assessment of Day 2 severe potential has changed. If forecaster confidence<br />
is increased (decreased) in certain parameters that might make severe weather more (less) likely in<br />
an area tomorrow, then the forecast team might consider having higher (lower) probability values<br />
compared to the preliminary outlook. The preliminary outlook should serve as the Afirst guess@<br />
for the final outlook, with adjustments (if any) based on information from the two SREF systems.<br />
After the final outlook probability contours are completed, the outlook is saved following the<br />
same procedures used for the preliminary outlook. (Remember to enter the sp_day2 comm<strong>and</strong><br />
after saving the outlook.) Once the outlook is available on the Final Outlook web page, a second<br />
discussion is written that documents the influence of both SREF systems in assessing the day 2<br />
severe weather threat.<br />
18
The SREF output can only be displayed in experimental NMAP2SP windows. To bring up<br />
a NMAP2SP display, go to an xterm <strong>and</strong> type: nmapsp <br />
In NMAP2SP, a number of restore files <strong>and</strong> sfp files have been created to view a variety of SREF<br />
output in spaghetti, mean/spread, probability, etc. formats. There also is capability to generate<br />
one time requests (OTR) using a special GUI that automatically builds a wide variety of SREF<br />
output restore files.<br />
19
Attachment C<br />
Final Day 2 Outlook<br />
SREF Output Assessment<br />
(Web Based Forms)<br />
20
TODAY=S DATE:<br />
FORECAST TEAM:<br />
VISITING SCIENTISTS:<br />
Final Day 2 Outlook Preparation Form<br />
Assessment of SREF Output<br />
Spring <strong>Program</strong> 2003<br />
I. General Assessment of SREF Output in Formulation of Final Day 2 Outlook<br />
Please refer to the scale below in completing your subjective evaluation:<br />
0 5 10<br />
Not Useful Moderately Useful Extremely Useful<br />
Not Useful: Provided no new information beyond what was available from<br />
deterministic models, or we did not know how to interpret <strong>and</strong>/or apply<br />
the information to severe weather.<br />
Moderately useful: Provided some new information not available from deterministic<br />
models, <strong>and</strong> appeared to provide some helpful guidance for severe<br />
weather forecasting.<br />
Extremely useful: Provided much useful information not available from deterministic<br />
models, <strong>and</strong> was directly applicable to assessing uncertainty in<br />
severe weather forecasting.<br />
1. Overall, how useful did you find the SREF output in assessing severe weather<br />
potential?<br />
(CHECKBOXES: NA 0 1 2 3 4 5 6 7 8 9 10 )<br />
2. How useful did you find the EMC SREF output?<br />
(CHECKBOXES: NA 0 1 2 3 4 5 6 7 8 9 10 )<br />
3. How useful did you find the MM5 SREF output?<br />
(CHECKBOXES: NA 0 1 2 3 4 5 6 7 8 9 10 )<br />
4. Text Box for general comments about SREF output<br />
(FREE TEXT BX: Add general comments)<br />
5. How useful were the following SREF display output techniques?<br />
a. Spaghetti Charts<br />
21
(CHECKBOXES: NA 0 1 2 3 4 5 6 7 8 9 10 )<br />
b. Mean/Spread Charts<br />
(CHECKBOXES: NA 0 1 2 3 4 5 6 7 8 9 10 )<br />
c. Probability Charts<br />
(CHECKBOXES: NA 0 1 2 3 4 5 6 7 8 9 10 )<br />
6. If you looked at spaghetti charts, which meteorological fields were best displayed<br />
in this chart format? (Check all that apply)<br />
(CHECKBOXES: 250 mb: height isotachs<br />
500 mb: height vorticity temperature isotachs<br />
700 mb: height temperature dew point isotachs vert vel<br />
850 mb: height temperature dew point isolatchs<br />
Surface: PMSL temperature dew point isotachs<br />
Pcpn: 3hr 6hr 12hr 24hr<br />
Instby: CAPE CIN<br />
Shear: SRH 0-6km Shear<br />
Comp: SCP STP<br />
Other<br />
(FREE TEXT BX: Add additional comments)<br />
7. If you looked at mean/spread charts, which meteorological fields were best<br />
displayed in this chart format? (Check all that apply)<br />
(CHECKBOXES: 250 mb: height isotachs<br />
500 mb: height vorticity temperature isotachs<br />
700 mb: height temperature dew point isotachs vert vel<br />
850 mb: height temperature dew point isolatchs<br />
Surface: PMSL temperature dew point isotachs<br />
Pcpn: 3hr 6hr 12hr 24hr<br />
Instby: CAPE CIN<br />
Shear: SRH 0-6km Shear<br />
Comp: SCP STP<br />
Other<br />
(FREE TEXT BX: Add additional comments)<br />
8. If you looked at probability charts, which meteorological fields were best<br />
displayed in this chart format? (Check all that apply)<br />
(CHECKBOXES: 250 mb: height isotachs<br />
500 mb: height vorticity temperature isotachs<br />
700 mb: height temperature dew point isotachs vert vel<br />
850 mb: height temperature dew point isolatchs<br />
Surface: PMSL temperature dew point isotachs<br />
Pcpn: 3hr 6hr 12hr 24hr<br />
Instby: CAPE CIN<br />
Shear: SRH 0-6km Shear<br />
Comp: SCP STP<br />
Other<br />
(FREE TEXT BX: Add additional comments)<br />
9. Did you use find other SREF data displays useful?<br />
22
(CHECKBOXES: YES NO )<br />
10. If Ayes@, please describe:<br />
(FREE TEXT BX: Add general comments)<br />
11. Please provide other comments <strong>and</strong> suggestions about SREF output:<br />
(FREE TEXT BX: Add general comments)<br />
23
Attachment D<br />
Spring <strong>Program</strong> 2003<br />
Day 2 Outlook Subjective Evaluation<br />
(Web Based Forms)<br />
24
Day 2 Outlook Subjective Verification Form<br />
Spring <strong>Program</strong> 2003<br />
TODAY=S DATE:<br />
FCST. VALID PERIOD:<br />
FORECAST TEAM:<br />
VISITING SCIENTISTS:<br />
I. Day 2 Preliminary Severe Weather Outlook Subjective Verification:<br />
Overall Rating of Preliminary Severe Thunderstorm Outlook<br />
In NMAP2 window 1 overlay the preliminary Day 2 outlook with the vgf file of severe reports for the 24 hour<br />
period. Rate the accuracy of the outlook on a scale from 0-10, with 0 being a very poor forecast, <strong>and</strong> 10 being a<br />
nearly perfect forecast. Since the outlook covers a national domain, some forecast regions may be more accurate<br />
than others - formulate an overall rating by averaging the accuracy of different forecast areas when necessary.<br />
Regions with greater severe storm occurrence or higher forecast probabilities should be given more weight in the<br />
rating process.<br />
If the outlook was not available, click on the checkbox labeled ANA@.<br />
Day 2 Severe Thunderstorm Outlook Rating<br />
(CHECKBOXES: NA 0 1 2 3 4 5 6 7 8 9 10 )<br />
(FREE TEXT BX: Add additional comments related to reasons for your rating - e.g, regions where the outlook<br />
was good, <strong>and</strong> where it was not. Include aspects of predicted <strong>and</strong> observed coverage,<br />
<strong>and</strong> any displacement errors that were factors in your rating, e.g., the primary axis of<br />
severe weather was east of the forecast location.)<br />
II.<br />
Day 2 Final Severe Weather Outlook Subjective Verification:<br />
Overall Rating of Final Severe Thunderstorm Outlook<br />
In NMAP2 window 2 overlay the final Day 2 outlook with the same vgf file of severe reports for the 24 hour<br />
valid. Rate the accuracy of the outlook on a scale from 0-10, with 0 being an extremely poor forecast, <strong>and</strong> 10<br />
being a nearly perfect forecast. Pay close attention to the accuracy of this outlook compared to the preliminary<br />
outlook. If the final outlook was different from the preliminary outlook, determine if the changes resulted in a<br />
better outlook, worse outlook, or no change in perceived accuracy/usefulness to the product user. Make sure your<br />
rating reflects this relative comparison - for example, if the final outlook improved the preliminary outlook, the<br />
final outlook rating should be higher than the preliminary outlook rating.<br />
If the outlook was not available, click on the checkbox labeled ANA@.<br />
Day 2 Severe Thunderstorm Outlook Rating<br />
(CHECKBOXES: NA 0 1 2 3 4 5 6 7 8 9 10 )<br />
(FREE TEXT BX: Add additional comments related to reasons for your rating - be sure to consider the rating of<br />
the final outlook relative to the preliminary outlook. If the final outlook showed<br />
changes from the preliminary outlook, discuss the relative impact of the changes on<br />
forecast accuracy (e.g, did the changes help or hurt the forecast.)<br />
25
Attachment E<br />
Spring <strong>Program</strong> 2003<br />
Deterministic Model Precipitation Subjective Evaluation Forms<br />
(Web Based Forms)<br />
26
Deterministic Model Day 1 Precipitation Verification Form<br />
Spring <strong>Program</strong> 2003<br />
GEOGRAPHIC REGION:<br />
(Defined by WRF3 domain)<br />
________________________<br />
I. Data <strong>and</strong> Evaluation Instructions<br />
For each of the following 12z models provide a subjective evaluations of the model forecast accuracy for total<br />
precipitation during the 18-21z <strong>and</strong> 21-0z periods.<br />
1. From the NSSL WRF3 web page, estimate the 3-letter station ID near the center point of the WRF3 domain.<br />
2. In window 1, load the sfp file SPRING_PGM_radar~BREF03 found in the local group<br />
a. set the time window from 18-03z;<br />
b. click on MAP, CUSTOM, <strong>and</strong> enter the 3-letter ID in GAREA , <strong>and</strong> accept.<br />
3. In window 2 load the Eta12 3-hrly precipitation fcst for the 18-03z time period<br />
a. Click on MAP, CUSTOM, <strong>and</strong> enter the same 3-letter ID in GAREA, accept.<br />
b. Click on apply settings, loops 3-8.<br />
c. Load the Eta12<br />
4. Load EtaKF, NMM, WRF12, <strong>and</strong> WRF3 3-hrly total precipitation fcsts for the 18-03z period in windows<br />
3, 4, 5, <strong>and</strong> 6.<br />
5. Load WRF12 <strong>and</strong> WRF3 1-hrly total precipitation fcsts for the 18-03z period in windows 7 <strong>and</strong> 8.<br />
6. In the other monitor in window 1, load the spf file SPRING_PGM~visible~radar3~radar1 found in the<br />
local group.<br />
a. Click on MAP, CUSTOM, enter the same 3-letter ID in GAREA, apply to all loops, <strong>and</strong> accept.<br />
b. For each loop in windows 1-3, set the time frame from 18-03z<br />
c. Click on load<br />
This will result in the following NAWIPS graphic displays:<br />
Left Monitor<br />
Right Monitor<br />
Window 1 visible satellite 3-hrly radar<br />
Window 2 3-hrly radar Eta12 3-hrly tot pcpn<br />
Window 3 1-hrly radar EtaKF 3-hrly tot pcpn<br />
Window 4<br />
NMM 3-hrly tot pcpn<br />
Window 5<br />
WRF12 3-hrly tot pcpn<br />
Window 6<br />
WRF3 3-hrly tot pcpn<br />
Window 7<br />
WRF12 1-hrly tot pcpn<br />
Window 8<br />
WRF3 1-hrly tot pcpn<br />
This display arrangement facilitates visual comparison by forecast period between different model forecasts,<br />
<strong>and</strong> between model forecasts <strong>and</strong> radar by toggling between different frames on the same monitor. In addition,<br />
Aside-by-side@ comparison can also be conducted. Now compare the model precipitation forecasts with onehourly<br />
radar reflectivity images valid during each model forecast period.<br />
27
Please refer to the scale below in completing your subjective evaluation:<br />
0 5 10<br />
Poor Forecast Good Forecast Excellent Forecast<br />
Poor Forecast:<br />
Good Forecast:<br />
Excellent Forecast:<br />
Model missed primary features <strong>and</strong> would have provided bad guidance to a severe<br />
weather forecaster.<br />
Model captured some primary features <strong>and</strong> would have provided some useful guidance to<br />
a severe weather forecaster.<br />
Model captured all important features, <strong>and</strong> would have provided excellent guidance to a<br />
severe weather forecaster.<br />
Note: we are not verifying QPF per se, but trying to determine the usefulness of the model precipitation<br />
forecast to a severe weather forecaster concerned with convective initiation <strong>and</strong> evolution. The timing,<br />
location, pattern (<strong>and</strong> possible information about convective mode), <strong>and</strong> movement of precipitation areas are<br />
factors to be equally considered, without strong emphasis on precipitation amounts. We use model QPF as a<br />
surrogate for model development of convective systems, because mesoscale NWP models do not explicitly<br />
predict severe thunderstorms.<br />
Make sure that subjective numerical ratings are consistent in a relative sense. For example, if you believe that<br />
model A provided more accurate <strong>and</strong> useful guidance than model B, make sure that model A has a higher rating<br />
than model B.<br />
II. Model 3 hrly Accumulated Precipitation Evaluation<br />
If a model was not available, click on the checkbox labeled ANA@.<br />
A. First Period Model Evaluations - 18-21z Period<br />
12z 12km Operational Eta - 18-21z period<br />
(CHECKBOXES: NA 0 1 2 3 4 5 6 7 8 9 10 )<br />
(FREE TEXT BX: Add additional comments related to reasons for your rating - identify strengths <strong>and</strong><br />
weaknesses of the forecast relative to timing, location, <strong>and</strong> pattern)<br />
12z 20km EtaKF - 18-21z period<br />
(CHECKBOXES: NA 0 1 2 3 4 5 6 7 8 9 10 )<br />
(FREE TEXT BX: Add additional comments related to reasons for your rating - identify strengths <strong>and</strong><br />
weaknesses of the forecast relative to timing, location, <strong>and</strong> pattern)<br />
12z 8km NMM - 18-21z period<br />
(CHECKBOXES: NA 0 1 2 3 4 5 6 7 8 9 10 )<br />
(FREE TEXT BX: Add additional comments related to reasons for your rating - identify strengths <strong>and</strong><br />
weaknesses of the forecast relative to timing, location, <strong>and</strong> pattern)<br />
12z 12km WRF - 18-21z period<br />
(CHECKBOXES: NA 0 1 2 3 4 5 6 7 8 9 10 )<br />
(FREE TEXT BX: Add additional comments related to reasons for your rating - identify strengths <strong>and</strong><br />
weaknesses of the forecast relative to timing, location, <strong>and</strong> pattern)<br />
28
12z 3km WRF - 18-21z period<br />
(CHECKBOXES: NA 0 1 2 3 4 5 6 7 8 9 10 )<br />
(FREE TEXT BX: Add additional comments related to reasons for your rating - identify strengths <strong>and</strong><br />
weaknesses of the forecast relative to timing, location, <strong>and</strong> pattern)<br />
B. Second Period Model Evaluations - 21-00z Period<br />
12z 12km Operational Eta - 21-00z period<br />
(CHECKBOXES: NA 0 1 2 3 4 5 6 7 8 9 10 )<br />
(FREE TEXT BX: Add additional comments related to reasons for your rating - identify strengths <strong>and</strong><br />
weaknesses of the forecast relative to timing, location, <strong>and</strong> pattern)<br />
12z 20km EtaKF - 18-21z period<br />
(CHECKBOXES: NA 0 1 2 3 4 5 6 7 8 9 10 )<br />
(FREE TEXT BX: Add additional comments related to reasons for your rating - identify strengths <strong>and</strong><br />
weaknesses of the forecast relative to timing, location, <strong>and</strong> pattern)<br />
12z 8km NMM - 21-00z period<br />
(CHECKBOXES: NA 0 1 2 3 4 5 6 7 8 9 10 )<br />
(FREE TEXT BX: Add additional comments related to reasons for your rating - identify strengths <strong>and</strong><br />
weaknesses of the forecast relative to timing, location, <strong>and</strong> pattern)<br />
12z 12km WRF - 21-00z period<br />
(CHECKBOXES: NA 0 1 2 3 4 5 6 7 8 9 10 )<br />
(FREE TEXT BX: Add additional comments related to reasons for your rating - identify strengths <strong>and</strong><br />
weaknesses of the forecast relative to timing, location, <strong>and</strong> pattern)<br />
12z 3km WRF - 21-00z period<br />
(CHECKBOXES: NA 0 1 2 3 4 5 6 7 8 9 10 )<br />
(FREE TEXT BX: Add additional comments related to reasons for your rating - identify strengths <strong>and</strong><br />
weaknesses of the forecast relative to timing, location, <strong>and</strong> pattern)<br />
III. WRF3 <strong>and</strong> WRF12 Comparison for 18-00z Period<br />
Compare the 3-hourly <strong>and</strong> 1-hourly accumulated precipitation from the WRF3 <strong>and</strong> WRF12 models, <strong>and</strong> assess<br />
the usefulness of their forecasts in terms of timing, location, pattern, <strong>and</strong> movement of precipitation areas when<br />
compared to the radar mosaic images. Focus on the entire 6 hour period from 18-00z, paying closest attention to areas<br />
where the greatest severe threat occurred. For the 1-hourly model precipitation output, we are particularly interested in<br />
whether the higher temporal resolution allows better determination of timing, location, <strong>and</strong> convective structure/mode<br />
29
(e.g., linear, isolated cells, multicell clusters).<br />
Refer to this scale in completing your subjective evaluation of the WRF3 compared to the WRF12:<br />
-5 0 +5<br />
WRF 3 Much Worse WRF3 The Same WRF3 Much Better<br />
How did the WRF3 predict timing of precipitation compared to the WRF12?<br />
(CHECKBOXES: -5 -4 -3 -2 -1 0 +1 +2 +3 +4 +5 )<br />
(FREE TEXT BX: Add additional comments related to timing fcst.)<br />
How did the WRF3 predict precipitation location compared to the WRF12?<br />
(CHECKBOXES: -5 -4 -3 -2 -1 0 +1 +2 +3 +4 +5 )<br />
(FREE TEXT BX: Add additional comments related to location fcst.)<br />
How did the WRF3 predict precipitation movement compared to the WRF12?<br />
(CHECKBOXES: -5 -4 -3 -2 -1 0 +1 +2 +3 +4 +5 )<br />
(FREE TEXT BX: Add additional comments related to movement fcst.)<br />
How did the WRF3 predict precipitation structure / convective mode compared to<br />
the WRF12?<br />
(CHECKBOXES: -5 -4 -3 -2 -1 0 +1 +2 +3 +4 +5 )<br />
(FREE TEXT BX: Add additional comments related to structure/mode fcst.)<br />
Refer to this scale in completing your subjective evaluation of the 1-Hrly compared to the 3-Hrly pcpn:<br />
-5 0 +5<br />
1-Hrly Much Worse 1-Hrly The Same 1-Hrly Much Better<br />
How did 1-Hrly precipitation compare to 3-Hrly precipitation in providing<br />
information about timing, location, movement, <strong>and</strong> mode?<br />
(CHECKBOXES: -5 -4 -3 -2 -1 0 +1 +2 +3 +4 +5 )<br />
(FREE TEXT BX: Add additional comments related to time resolution fcst.)<br />
IV.<br />
General Comments:<br />
Please provide any additional comments, especially in regard to the usefulness of the<br />
precipitation forecasts of the various models to provide useful short-term precipitation<br />
guidance for severe weather forecasters..<br />
(FREE TEXT BX: Add additional comments)<br />
30
Attachment G<br />
Spring <strong>Program</strong> 2003<br />
Generation of MM5 SREF Perturbations<br />
31
Generation of MM5 SREF Perturbations<br />
The MM5 SREF system generates perturbations using input by the forecast team that identifies<br />
environmental features <strong>and</strong> parameters considered to be important in the severe weather forecast.<br />
For example, the placement <strong>and</strong> depth of synoptic features such as 500 mb troughs, upper jet<br />
streaks, surface lows <strong>and</strong> boundaries such as fronts <strong>and</strong> dry lines, as well as thermodynamic<br />
variables such as low level moisture <strong>and</strong> instability, can all be an important part of the decision<br />
making process on given days. The MM5 SREF system uses the adjoint of the MM5 to<br />
incorporate forecaster identified Afeature-based@ regions of sensitivity (typically during the 24-48<br />
hour Day 2 outlook period) into the generation of initial condition perturbations in a dynamically<br />
consistent manner. A special web-based GUI allows the forecast team to identify basic fields of<br />
interest (see below) <strong>and</strong> outline key areas on the forecast map that will be used to generate scaled<br />
perturbations (plus <strong>and</strong> minus) in the initial conditions.<br />
To bring up the MM5 SREF GUI, you must be on netscape from a Linux NAWIPS. Click on the<br />
Anetscape@ box on the left side of the screen, <strong>and</strong> click on Aspring program@ when the entry<br />
window comes up. When netscape comes up, go to bookmarks <strong>and</strong> click on:<br />
http://webtest.protect.nssl:1024/~fwang/<br />
A total of 16 fields must be entered by the forecast team, resulting in 32 perturbations (or<br />
ensemble members) in the MM5 SREF system. Unlike ensemble systems that objectively generate<br />
initial condition perturbations, the MM5 perturbations reflect subjective forecaster input about<br />
what fields <strong>and</strong> locations are important on particular days.<br />
The input must be entered <strong>and</strong> completed by 11:20 am in order to meet fixed run times of<br />
the SREF system. Thus, it is important for the forecast team to begin the Aperturbation<br />
generation@ process no later than 11 am. This should be an extension of the morning<br />
deterministic model analysis process associated with the preparation of the Preliminary Day 2<br />
Outlook. During this process, the forecaster will be assessing his/her levels of confidence or<br />
uncertainty with regard to Aingredients@ needed to generate severe thunderstorms, <strong>and</strong> this<br />
assessment will be the basis for identifying parameters considered important to the severe weather<br />
threat. If feasible, these parameters can be identified as the morning outlook process unfolds,<br />
prior to actual entry of data using the web-based GUI.<br />
It works best if one team member (usually the forecaster preparing the Preliminary Day 2<br />
Outlook) draws the sensitivity areas on the screen, <strong>and</strong> another team member writes down the list<br />
of parameters chosen on a paper form kept in a black notebook in the SSA. Parameters chosen<br />
come from a drop-down window list of basic m<strong>and</strong>atory level fields at the surface, 850, 700, 500,<br />
<strong>and</strong> 250 mb. Parameters include: t, q, u, v, vorticity, omega, geopotential height (or sea-level<br />
pressure), <strong>and</strong> CAPE. Simply draw a four-sided parallelogram around the desired area on the<br />
parameter map - click the mouse at each corner, <strong>and</strong> the program will automatically close the area<br />
after the fourth point. Click Acontinue@ at the bottom of the page to enter this field. Once you<br />
have clicked Acontinue@ you cannot change that field. (Click Acancel@ if you do not like your area<br />
or parameter.) A counter at the top left of the display shows the number of entries you have to<br />
complete before you are finished, <strong>and</strong> it decreases by one as each field is entered.<br />
32
Attachment H<br />
Spring <strong>Program</strong> 2003<br />
Weekly Participant Evaluation Form<br />
33
Spring <strong>Program</strong> 2003<br />
Weekly Participant Evaluation Form<br />
NAME:<br />
AFFILIATION:<br />
LEVEL OF PARTICIPATION:<br />
PRIMARY JOB RESPONSIBILITY:<br />
“ Part-time Visitor<br />
“ Full-Week Participant<br />
“ Operational Forecaster<br />
“ Operational NWP Development<br />
“ Research Scientist<br />
“ Administrator<br />
“ Other: ______________<br />
DATES YOU WERE IN THE PROGRAM:<br />
The primary goal of SPC-NSSL Spring <strong>Program</strong> is to improve forecasts of meteorological<br />
phenomena by speeding up the transfer of new technology <strong>and</strong> research ideas into forecast<br />
operations at the SPC, <strong>and</strong> sharing new techniques, skills, <strong>and</strong> results of applied research more<br />
freely. Below are specific goals of the Spring <strong>Program</strong> related to the NWS Strategic <strong>Plan</strong> <strong>and</strong><br />
SPC 2003 goals. Your responses will allow us to evaluate the design <strong>and</strong> implementation of this<br />
year=s Spring <strong>Program</strong>, determine our level of success in achieving those goals, <strong>and</strong> help to better<br />
define <strong>and</strong> design future Spring <strong>Program</strong> activities.<br />
In the following questions, place an X above the appropriate rating.<br />
Goal 1: Facilitate collaboration between operations <strong>and</strong> research, in an effort to advance<br />
severe weather forecast techniques <strong>and</strong> provide improved customer service.<br />
G1.1. How well did the facilities <strong>and</strong> computer workstations support Spring <strong>Program</strong> activities?<br />
0..........1..........2..........3..........4..........5..........6..........7..........8..........9..........10<br />
Not Well Reasonably Well Very Well<br />
Comments:<br />
G1.2. Were activities conducted during daily operations (model evaluations, issuance of<br />
34
forecast products, seminars, etc.) effective in helping to facilitate this collaboration?<br />
0..........1..........2..........3..........4..........5..........6..........7..........8..........9..........10<br />
Not Effective Moderately Effective Very Effective<br />
Suggestions/Ideas:<br />
G1.3. Was the Spring <strong>Program</strong> WEB page effectively structured to record evaluation<br />
information during subjective assessments <strong>and</strong> forecast product formulation?<br />
0..........1..........2..........3..........4..........5..........6..........7..........8..........9..........10<br />
Not Effective Moderately Effective Very Effective<br />
Suggestions for improvement:<br />
G1.4. How useful was the Spring <strong>Program</strong> in contributing to unique/new perspectives <strong>and</strong>/or<br />
partnerships applicable to your current work <strong>and</strong> professional development?<br />
0..........1..........2..........3..........4..........5..........6..........7..........8..........9..........10<br />
Marginally Somewhat Very Extremely<br />
What knowledge or ideas did you as a researcher or forecaster acquire that you<br />
will use in operations or future research?<br />
G1.5. Assess the workload required during Spring <strong>Program</strong>. If you feel that the workload was<br />
too little or too much, please provide comments <strong>and</strong>/or recommendations regarding ways<br />
to improve daily operational tasks or justifying your assessment.<br />
-5........-4........-3........-2........-1........0........+1........+2........+3........+4........+5<br />
Too Little A Good Mix Too Much<br />
Suggestions/Ideas:<br />
G1.6. How would you rate your overall impression of the 2003 Spring <strong>Program</strong> relative to<br />
35
other operationally relevant, real-time exercises you=ve participated in? If you have not<br />
participated in exercises of this type in the past, please do not answer, but provide<br />
comments as applicable.<br />
0..........1..........2..........3..........4..........5..........6..........7..........8..........9..........10<br />
Much Worse Average Much Better<br />
Suggestions/Ideas:<br />
Goal 2: Explore the utility of SREF systems in complementing existing deterministic model<br />
output in the probabilistic convective outlook formulation process.<br />
G2.1. Were activities conducted during daily operations (model evaluations, issuance of forecast<br />
products, etc.) effective in exploring the utility of SREF systems?<br />
0..........1..........2..........3..........4..........5..........6..........7..........8..........9..........10<br />
Not Effective Moderately Effective Very Effective<br />
Suggestions/Ideas:<br />
G2.2. Evaluate how well the process of post-analysis subjective verification of the Preliminary<br />
<strong>and</strong> Final Day 2 Outlooks led to a fair <strong>and</strong> accurate assessment of the forecast skill of the<br />
Outlooks.<br />
0..........1..........2..........3..........4..........5..........6..........7..........8..........9..........10<br />
Poor Adequate Good Excellent<br />
Suggestions/Ideas:<br />
Goal 3: Identify ways to extract meaningful information from SREF systems for use by<br />
36
operational severe weather forecasters.<br />
G3.1. Were activities conducted during daily operations (model evaluations, issuance of forecast<br />
products, etc.) effective in determining products that may or may not be useful to SPC<br />
forecasters?<br />
0..........1..........2..........3..........4..........5..........6..........7..........8..........9..........10<br />
Not Effective Moderately Effective Very Effective<br />
What products are particularly useful to operations?<br />
What products are NOT particularly useful to operations?<br />
G3.2. Based on your experience in this Spring <strong>Program</strong>, rate on a scale of 1 to 10 the (potential)<br />
usefulness of short-range ensembles (NCEP, MM5, <strong>and</strong>/or others) to SPC operations.<br />
0..........1..........2..........3..........4..........5..........6..........7..........8..........9..........10<br />
Not Useful Some Utility Extremely Useful<br />
Comments:<br />
Goal 4: Incorporate operational forecaster insights to develop effective visualization of<br />
SREF output fields that facilitate forecast decision-making within operational time<br />
constraints.<br />
G4.1. Were NAWIPS display products effective in providing meaningful visualization of SREF<br />
output?<br />
0..........1..........2..........3..........4..........5..........6..........7..........8..........9..........10<br />
Not Effective Moderately Effective Very Effective<br />
What other products/ideas should we pursue?<br />
G4.2. Evaluate how well the process of utilizing SREF output <strong>and</strong> display products for the Final<br />
37
Day 2 Severe Weather Outlook contributed to a useful assessment of the utility of SREF<br />
concepts <strong>and</strong> prediction systems in operational severe weather forecasting.<br />
0..........1..........2..........3..........4..........5..........6..........7..........8..........9..........10<br />
Poor Adequate Good Excellent<br />
Suggestions/Ideas:<br />
Goal 5: Test the concept of forecaster determined Afeature-based@ model sensitivity areas<br />
used in the generation of initial SREF perturbations.<br />
G5.1. Did our daily operations test the usefulness of this approach to SREF systems?<br />
0..........1..........2..........3..........4..........5..........6..........7..........8..........9..........10<br />
Not Effective Moderately Effective Very Effective<br />
Suggestions/Ideas:<br />
Goal 6: Compare forecasts from the NCEP SREF system (utilizing traditional objective<br />
techniques to generate initial perturbations) with an experimental MM5 SREF system<br />
(utilizing an adjoint model that incorporates subjective forecaster input to generate initial<br />
perturbations).<br />
G6.1. Do you feel the Day 2 Outlook exercise provided an adequate opportunity to assess the<br />
operational utility of the two SREF systems? (Note: Quantitative evaluation between the<br />
two systems will occur after the program.)<br />
0..........1..........2..........3..........4..........5..........6..........7..........8..........9..........10<br />
Not Effective Moderately Effective Very Effective<br />
Comments about the operational utility of both SREF systems:<br />
G6.2. Do you feel you have a better underst<strong>and</strong>ing of SREF concepts <strong>and</strong>/or utility in forecasting<br />
38
severe convection as a result of your participation in Spring <strong>Program</strong> 2003?<br />
0..........1..........2..........3..........4..........5..........6..........7..........8..........9..........10<br />
No Impact Some Impact Considerable Impact<br />
Where should the SPC go from here concerning utilization of SREF systems?<br />
G6.3. Will your participation in Spring <strong>Program</strong> 2003 encourage you to use, examine, <strong>and</strong><br />
analyze SREF data in real time forecast operations? (Answer if applicable.)<br />
N/A 0..........1..........2..........3..........4..........5..........6..........7..........8..........9..........10<br />
Marginal Impact Some Impact Considerable Impact<br />
Briefly explain your rating:<br />
G6.4. Did your participation in Spring <strong>Program</strong> 2003 have an impact on your underst<strong>and</strong>ing of<br />
SREF concepts <strong>and</strong> their potential utility in your research activities? (Answer if<br />
applicable.)<br />
N/A 0..........1..........2..........3..........4..........5..........6..........7..........8..........9..........10<br />
Marginal Impact Some Impact Considerable Impact<br />
Any future research ideas you can attribute to your participation in the Spring <strong>Program</strong>?<br />
Goal 7a: Examine the ability of high resolution models (Eta12, EtaKF, NMM) to predict<br />
39
afternoon convective initiation <strong>and</strong> evolution.<br />
Goal 7b: Compare output from a 12 km version of the WRF model with convective<br />
parameterization <strong>and</strong> a 3 km WRF with explicit precipitation physics as it relates to<br />
forecasts of convective initiation, evolution, <strong>and</strong> mode.<br />
G7.1. Did the Spring <strong>Program</strong> evaluation help assess the ability of the Eta12, EtaKF, NMM,<br />
WRF12, <strong>and</strong> WRF3 to predict the initiation <strong>and</strong> evolution of convection?<br />
0..........1..........2..........3..........4..........5..........6..........7..........8..........9..........10<br />
Not Effective Moderately Effective Very Effective<br />
General comments, or comments about specific models:<br />
G7.2. Evaluate how well the process of subjective verification in post-analysis lead to a fair <strong>and</strong><br />
accurate assessment of model forecasts of precipitation fields relevant to convective<br />
initiation, evolution, <strong>and</strong> mode.<br />
0..........1..........2..........3..........4..........5..........6..........7..........8..........9..........10<br />
Poor Adequate Good Excellent<br />
Comments/Recommendations:<br />
G7.3. How effective was the comparison of the 12 km WRF (parameterized convection) <strong>and</strong> 3<br />
km WRF (explicit convection) in introducing you to the relative strengths <strong>and</strong> limitations<br />
of using high resolution model output for forecasts of convective initiation, mode, <strong>and</strong><br />
evolution?<br />
0..........1..........2..........3..........4..........5..........6..........7..........8..........9..........10<br />
Not Effective Moderately Effective Very Effective<br />
Comments related to your rating:<br />
G7.4. How useful were the displays of WRF 1-hourly model precipitation (compared to 3-hourly)<br />
40
in determining aspects of timing, movement, pattern, <strong>and</strong> mode of model generated<br />
convection?<br />
0..........1..........2..........3..........4..........5..........6..........7..........8..........9..........10<br />
Not Useful Moderately Useful Very Useful<br />
Describe ways in which this 1-hourly output was or was not helpful.<br />
G7.5. Do you feel you have a better underst<strong>and</strong>ing of deterministic model performance <strong>and</strong> utility<br />
in forecasting convective initiation, evolution, <strong>and</strong> mode as a result of your participation in<br />
Spring <strong>Program</strong> 2003?<br />
0..........1..........2..........3..........4..........5..........6..........7..........8..........9..........10<br />
No Impact Some Impact Considerable Impact<br />
What are your most important impressions concerning model performance noted during<br />
your week in the program?<br />
G7.6. Will your participation in Spring <strong>Program</strong> 2003 encourage you to use, examine, <strong>and</strong><br />
analyze deterministic model data differently in real time forecast operations than prior to<br />
your participation? (If applicable)<br />
N/A 0..........1..........2..........3..........4..........5..........6..........7..........8..........9..........10<br />
Marginal Impact Some Impact Considerable Impact<br />
Briefly explain your rating:<br />
Goal 9: Design the Spring <strong>Program</strong> to foster better collaboration between research <strong>and</strong><br />
41
operations, <strong>and</strong> to improve mission critical elements for both the SPC <strong>and</strong> our collaborative<br />
partners within the meteorological community.<br />
G9.1. How well did the Spring <strong>Program</strong> activities enhance interactions between operational <strong>and</strong><br />
research groups by focusing on topics important to both segments?<br />
0..........1..........2..........3..........4..........5..........6..........7..........8..........9..........10<br />
Poor Adequate Good Excellent<br />
Comments/Recommendations:<br />
G9.2. Would you be interested in participating in any follow-up collaborative activities resulting<br />
from this Spring <strong>Program</strong>?<br />
0..........1..........2..........3..........4..........5..........6..........7..........8..........9..........10<br />
Are you crazy? Let me think about this I=d love to!<br />
What specific areas of interest do you have?<br />
------------------------------------------------------------------------------------------------------------------<br />
----<br />
Please offer any additional comments concerning the Spring <strong>Program</strong> on the remainder of this<br />
page.<br />
42
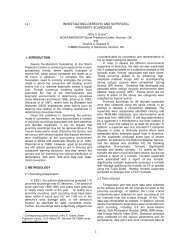

![NSWW_ROC_Overview.ppt [Read-Only] - Storm Prediction Center ...](https://img.yumpu.com/26478320/1/190x146/nsww-roc-overviewppt-read-only-storm-prediction-center-.jpg?quality=85)


![NEW_PRODUCTS_imy.ppt [Read-Only] - Storm Prediction Center ...](https://img.yumpu.com/26478296/1/190x146/new-products-imyppt-read-only-storm-prediction-center-.jpg?quality=85)