Design of a 142m RoRo-Vessel - TUHH
Design of a 142m RoRo-Vessel - TUHH
Design of a 142m RoRo-Vessel - TUHH
Create successful ePaper yourself
Turn your PDF publications into a flip-book with our unique Google optimized e-Paper software.
<strong>Design</strong> <strong>of</strong> a <strong>142m</strong> <strong>RoRo</strong>-<strong>Vessel</strong><br />
Tobias Haack 1 and Hendrik Vorhoelter 2<br />
ABSTRACT<br />
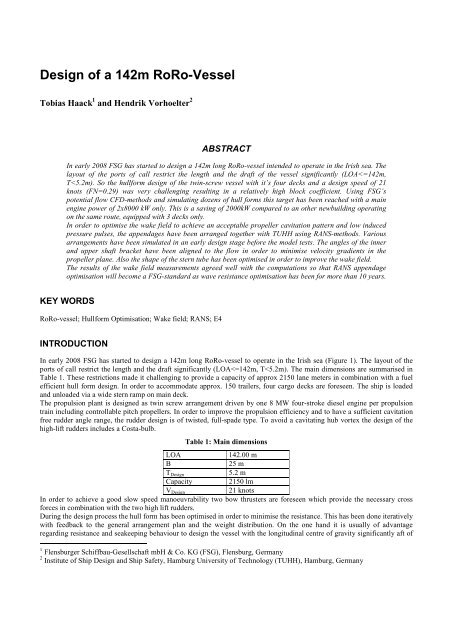
In early 2008 FSG has started to design a <strong>142m</strong> long <strong>RoRo</strong>-vessel intended to operate in the Irish sea. The<br />
layout <strong>of</strong> the ports <strong>of</strong> call restrict the length and the draft <strong>of</strong> the vessel significantly (LOA
the main frame. On the other hand an exaggeration leads to blunt aft bodies. Therefore the decks house has been placed at the<br />
bow.<br />
Because <strong>of</strong> the relatively high block coefficient it was essential to focus not only on the wave making resistance but also on<br />
the wake field. A bad wake field does not only influence the comfort level in means <strong>of</strong> noise and vibrations but indirectly the<br />
propeller efficiency leading to a higher fuel consumption. Therefore a number <strong>of</strong> appendage arrangements have been<br />
analysed using RANS-methods. The most promising variants have been tested in the towing tank including wake field<br />
measurements. For the integration <strong>of</strong> RANS-methods in the design process a new process chain has been implemented.<br />
Figure 1: Sideview<br />
HULLFORM DESIGN<br />
Based on FSG's specific numerical and experimental experience with <strong>RoRo</strong>-vessels, the hullform was optimised for a speed<br />
range from 19 to 22.5 knots for the design draught <strong>of</strong> 5.2 m. Furthermore lower speeds and lighter loading conditions were<br />
considered during the hullform design process. Several different hullform alternatives were evaluated, varying<br />
• length, volume and shape <strong>of</strong> the bulbous bow<br />
• position <strong>of</strong> forward and rearward shoulder<br />
• bilge radius<br />
• shape and arrangement <strong>of</strong> aftbody tunnels<br />
• transom shape, immersion and buttock slope <strong>of</strong> the aftbody<br />
• location <strong>of</strong> knuckle lines according to the streamlines <strong>of</strong> the flow.<br />
Care was taken for both a minimum <strong>of</strong> wave resistance (expressed by the generated wave pattern) as well as harmonic<br />
pressure gradients. Besides, the wetted surface was kept as small as possible. FSG uses the non-linear potential flow panel<br />
method KELVIN for predicting the wave resistance, taking into account dynamic sinkage and trim. The results are presented<br />
as plot <strong>of</strong> wave contour and pressure distribution. KELVIN is integrated in FSG’s ship design system E4 as part <strong>of</strong> the<br />
implemented process chain from hullform geometry definition over grid generation to CFD and post-processing.<br />
The results <strong>of</strong> the CFD computations show the very low wave making <strong>of</strong> FSG's design for both the transversal and the<br />
longitudinal wave systems. This leads to a very low wave making resistance and consequently also to a low wake wash.<br />
Minimizing transversal waves reduces the wave resistance significantly, although transversal waves are difficult to observe in<br />
the towing tank.<br />
Details <strong>of</strong> the hull form design and optimisation are briefly described in the following sections.<br />
Length, Volume and shape <strong>of</strong> the Bulbous Bow<br />
FSG's concept for bulbous bow design is that the bulb should generate an extreme low-pressure zone located on the bulbous<br />
bow top. This low pressure zone (which generates a significant wave through) reduces the height <strong>of</strong> the bow wave. Whether a<br />
specific bulbous bow design will generate a low pressure region depends mainly on the vessel's speed, length and volume <strong>of</strong><br />
the bulbous bow. To support the downward flow <strong>of</strong> the streamlines, the inflection points <strong>of</strong> the inner buttocks are located<br />
exactly in the stream lines. Figure 2 shows the pressure distribution <strong>of</strong> the present bulbous bow design. For ballast conditions,<br />
the bulb was designed such that it will act as a sharp elongated waterline.
Figure 2: Pressure distribution at bulbous bow<br />
Forebody: Interference <strong>of</strong> Wave Systems<br />
The position <strong>of</strong> the shoulder was selected from optimum interference between bow-generated and shoulder-generated wave<br />
patterns. As the bow-wave is influenced strongly by the stem shape and the bulbous bow design, the position <strong>of</strong> the shoulders<br />
has to be selected individually for each specific design.<br />
Figure 3 illustrates the good interference <strong>of</strong> bow- and forward shoulder generated waves: the longitudinal wave pattern<br />
generated by the forebody in the resulting wake is very small. Besides, the pressure gradient is harmonised, so viscous<br />
resistance will be a minimum due to a harmonic flow.<br />
Figure 3: Wave pattern at 21 knots<br />
Aftbody: Stern Tunnels, Transom Shape and Immersion<br />
Several alternatives <strong>of</strong> aftbodies were analysed. Important factors besides minimum wave resistance were: low propeller<br />
induced pressure fluctuations on the hull, a harmonic wake field for the propeller and intact- as well as damage- stability<br />
requirements.<br />
For typical <strong>RoRo</strong> and RoPax hull designs a large share <strong>of</strong> the wave resistance is generated by the transversal stern waves.<br />
While in model tests and ship operation stern waves are a lot more difficult to target than the visually more pronounced<br />
longitudinal wave systems, CFD analysis allows for a good insight and thus optimisation <strong>of</strong> this important part <strong>of</strong> wave<br />
making and resistance.<br />
The aftbody design features a twin tunnel arrangement, which allows for increased tip-clearance above the propeller and thus<br />
low propeller induced pressure fluctuations. The slope <strong>of</strong> the aftbody buttocks was optimised with focus on harmonic<br />
pressure gradients in order to avoid flow separation and allow for a harmonic wake field as well as minimum resulting stern<br />
waves.
Model Test Results<br />
To verify the power prognosis and to compare the various appendage design variants, model tests have been performed at<br />
HSVA.<br />
The results demonstrate, that the target to design a vessel with a low fuel consumption in combination with an acceptable<br />
wake field has been reached. Figure 4 shows the wave pattern under design conditions which is comparable to the<br />
computational results. In order to get an impression <strong>of</strong> the hydrodynamic quality <strong>of</strong> the hullform design, the power demand<br />
has been compared to similar vessels by HSVA (see Figure 5). Three designs in HSVA’s database have been identified to<br />
have nearly the same ship lengths and block coefficients. For the purpose <strong>of</strong> comparison the power demand has been adapted<br />
to the displacement <strong>of</strong> FSG’s design. The diagram clearly shows that FSG’s hull form design leads to a significantly lower<br />
power demand (approx. 20%) than all comparable vessels in the database especially in the speed range 20 to 23 knots.<br />
Considering actual fuel prices this results in a reduction <strong>of</strong> operational costs <strong>of</strong> 1.5-2 Million US-$ per year .<br />
The results <strong>of</strong> the wake field measurements are described below.<br />
Figure 4: Photo from model test at 21 knots<br />
Figure 5: Comparison <strong>of</strong> power demand<br />
RANS-CFD Analysis <strong>of</strong> Appendages<br />
The appendages, namely shaft line, shaft bossing and shaft bracket arms, are analysed with the help <strong>of</strong> RANS-CFD methods.<br />
In the following the motivation for RANS-CFD analysis is described, followed by the description <strong>of</strong> the numerical model<br />
used for the computations. The section concludes with a presentation <strong>of</strong> the achieved results and compares them with<br />
measurements from the towing tank.<br />
Motivation for the RANS-CFD Analysis<br />
The aspect <strong>of</strong> vibrations is a crucial point in most modern designs <strong>of</strong> <strong>RoRo</strong>-ferries. The main source for vibrations on board<br />
<strong>of</strong> ships is the propeller as it is working with an inhomogeneous inflow. Especially in the area <strong>of</strong> the twelve o’clock position<br />
the inflow speed is decreased which leads to higher angles <strong>of</strong> attack for the propeller blades. This ends in higher loads on the<br />
propeller and the ships hull. Concerning twin-screw-vessels the disturbances <strong>of</strong> the propeller inflow are mainly generated by<br />
the shaft line, shaft bossing and shaft bracket arms and not by the hull form itself. Therefore, the design <strong>of</strong> the shaft line<br />
needs not only to fulfil the requirements <strong>of</strong> mechanical strength and functionality but also the requirements <strong>of</strong><br />
hydrodynamics. The shaft bossing and the bracket arms have to be aligned properly to avoid unnecessary disturbances <strong>of</strong> the<br />
propeller inflow.<br />
The fluid flow around a bare hull is mainly driven by potential flow effects. Therefore, the overall hull design can be<br />
efficiently and accurately analysed and optimised with potential flow methods. For the analysis <strong>of</strong> the wake field viscous<br />
flow effects like the development <strong>of</strong> the viscous boundary layer and <strong>of</strong> vortices become more important. Thus, RANS-CFD-
methods have to be used for the analysis <strong>of</strong> a flow field around the appendages.<br />
For the optimisation process the quality <strong>of</strong> the wake field has to be quantified. A wake field <strong>of</strong> a good quality should lead to<br />
low pressure pulses. Thus, one method for the quality analysis is the measurement <strong>of</strong> pressure pulses in the cavitation tunnel.<br />
These investigations are performed for every project at FSG in later design stage. But, the cavitation tunnel tests require a<br />
model and are therefore not very useful in the early design stage. Another method is the numerical estimation <strong>of</strong> the pressure<br />
pulses. The inhomogeneous wake field is used as input for a propeller computation. This <strong>of</strong> course requires an available<br />
propeller design and the wake field has to be determined. A cruder but faster method, which can be used in the early design,<br />
is the use <strong>of</strong> a wake field quality criterion. There exist several criteria. The most <strong>of</strong> them are based on an averaging <strong>of</strong> the<br />
variation <strong>of</strong> the axial inflow velocity. The criterion used in the present work was developed by Farbach and Krüger (see<br />
Farbach 2004) and is based on the velocity gradient and the variation <strong>of</strong> the angle <strong>of</strong> attack on a single propeller blade during<br />
one turn. Thus, not only the axial but also the radial and tangential velocity component are used, which is an advantage<br />
compared to simpler models.<br />
Set-Up <strong>of</strong> RANS-CFD Model<br />
In order to use RANS-CFD methods efficiently in the ship design process, the process chain for the RANS-CFDcomputations<br />
itself has to be optimised. At <strong>TUHH</strong> several tools are combined in a process chain, which allows the<br />
computation <strong>of</strong> the ships model wake field in time frame <strong>of</strong> a few hours starting from the geometry in the CAD-system.<br />
This process is divided into three steps as it is done usually for CFD-computations: pre-processing, processing and postprocessing.<br />
These steps are further divided into sub steps then. The optimised process chain should be as automatic as<br />
possible. The necessary user input should be kept to a minimum, as this is always time consuming and potential source <strong>of</strong><br />
errors. In the past the processing step was seen as the most crucial one. With increasing computational power and the<br />
development <strong>of</strong> the RANS-CFD-codes in the last decade, especially the possibility to parallelise the computation on several<br />
CPUs, the processing has become faster and more stable. But in the same time the pre-processing has not developed with the<br />
same speed. For RANS-CFD methods the pre-processing step itself consists <strong>of</strong> two sub steps: the generation <strong>of</strong> the finite<br />
volume mesh and the set-up <strong>of</strong> the CFD-computation. Whereas the second sub step is usually performed in the frame work <strong>of</strong><br />
the RANS-CFD-solver itself is the first sub step for more complex geometries <strong>of</strong>ten done in separate mesh generation tools.<br />
Hence a data transfer <strong>of</strong> the geometry from the CAD-system used in the original design process to the mesh generator is<br />
required. A data transfer is usually a critical point in process chain. In addition this data transfer goes normally hand in hand<br />
with an adaptation <strong>of</strong> the geometry to the needs <strong>of</strong> CFD-computations. Thus, one could introduce a third sub step at the<br />
beginning <strong>of</strong> the CFD-process: preparation <strong>of</strong> the geometry.<br />
In order to speed up the RANS-CFD process the focus has to be on the first two sub steps: the preparation <strong>of</strong> the geometry<br />
and the mesh generation. These to steps are described in detail below followed by the set-up <strong>of</strong> the RANS-solver and the<br />
post-processing. Further details can also be found in Vorhoelter, Krueger 2007.<br />
Preparation <strong>of</strong> the geometry: As mentioned above there is <strong>of</strong>ten a need for adaptation if a geometry from a CAD-system<br />
shall be used for CFD-computations. In the present work E4 is used as ship design system. As E4 is mainly developed by<br />
FSG and <strong>TUHH</strong> it was possible to develop a new geometry export which is based on a triangulation <strong>of</strong> the geometry surfaces.<br />
The use <strong>of</strong> a triangulation instead <strong>of</strong> advanced geometry descriptions has the advantage that geometries from different<br />
sources can easily be combined. For instance it is possible to use the deformed free surface from the result <strong>of</strong> potential flow<br />
computation as boundary for the RANS-CFD domain together with the hull form from the CAD-system. Additional<br />
geometries like a cap on the stern tube, which is only needed for CFD without propeller and therefore not part <strong>of</strong> the normal<br />
geometry design, can easily be introduced into the model. In Figure 6 a snapshot is shown <strong>of</strong> the triangulated hull with cap on<br />
the stern tube and clipped free surface.<br />
Figure 6: Triangulation <strong>of</strong> the appended hull with stern tube cap and free surface
Finite volume mesh generation: For the mesh generation the automatic finite volume mesh generator Hexpress is used. The<br />
advantages <strong>of</strong> Hexpress compared to block structured mesh generators are that no blocking has to generated or adapted to the<br />
geometry and no cells with extreme aspect ratio are generated. The advantage compared to other automatic mesh generators<br />
is, that the grids are fully hexahedral which helps the numerical descritisation <strong>of</strong> the Navier-Stokes equations. The total time<br />
for the mesh generation is about 15minutes on a PC with an Intel CPU with 2.33GHz and 4GB RAM. In Figure 7 snapshots<br />
<strong>of</strong> the meshed domain and the surface mesh on the aft hull are shown, which show the typical characteristics <strong>of</strong> Hexpress<br />
meshes.<br />
Figure 7: Meshed half domain and mesh details at the aft part <strong>of</strong> the hull<br />
Set-up <strong>of</strong> RANS-CFD-solver: As RANS-CFD solver Comet in version 2.3 is used. Comet is a well validated tool for marine<br />
CFD purposes. The computations are performed steady and the equations are iterated until the residuals are reduced<br />
significantly. Turbulence is modelled with the k-ω-SST turbulence model. In order to decrease the number <strong>of</strong> cells in the<br />
mesh wall functions are used on the boundary <strong>of</strong> the hull to model the viscous boundary layer. In addition the computations<br />
are performed in model scale. Thus, computational results can directly by compared to the measurements from the towing<br />
tank. The free surface is not modelled in the RANS-CFD computations. This is done for two reasons: First the effect <strong>of</strong> the<br />
deformed free surface on the wake field is negligible. Second the modelling <strong>of</strong> the free surface would require an additional<br />
computational effort which is not balanced by the gain <strong>of</strong> knowledge. Instead the solution <strong>of</strong> a potential flow computation <strong>of</strong><br />
the free surface is used as boundary 1 .<br />
Post processing: In the post processing the velocity field is read out at the same read out points in the propeller plane which<br />
are used for the measurements in the model basin. Thus, a direct comparison <strong>of</strong> the measured and computed wake fields is<br />
possible. The wake fields can be analysed with the same tools and both be used as input for propeller computations.<br />
Results<br />
Several designs <strong>of</strong> shaft line and shaft line bossings were investigated. For three variants results are presented in the<br />
following. The first design (variant 1) is the first appendage design, which was tested in the towing tank for this project. The<br />
second one (variant 2) is one <strong>of</strong> the variations developed from the first one using the information gained from the CFDresults.<br />
All variants were tested with CFD, but only variant 1 and 2 were tested in the model basin. The design <strong>of</strong> the shaft<br />
line <strong>of</strong> variant 3 is similar to variant 2, but the shaft bracket arms are also modelled in the CFD-computation.<br />
Variant 1: Initial design: In the first step the results <strong>of</strong> the RANS-CFD computation are compared to the model test. As the<br />
CFD-computations are performed with a free surface from a potential flow code, a difference between the computed and<br />
measured resistance has to be expected. But it came out that the difference between the measured and computed resistance is<br />
less than 1%. The two wake fields are shown in Figure 8. All wake fields presented are for the port side <strong>of</strong> the vessel and seen<br />
from the aft. The contours indicate the axial velocity whereas the arrows indicate the velocity in the propeller plane. It can be<br />
seen that the qualitative and quantitative coincidence between the results is very good, although the shaft bracket arms, which<br />
are present in the model tests <strong>of</strong> course, are not modelled in this first computation. The major difference can be seen in the<br />
thickness <strong>of</strong> the boundary layer, which is thicker in the computation. This is an effect which can <strong>of</strong>ten be observed in CFDcomputations<br />
and is an object <strong>of</strong> further investigations. Another difference is the shadow <strong>of</strong> the shaft line at the one o’clock<br />
1 The floating condition (sinkage and trim) is also taken from the potential flow computation.
position, which is more pronounced in the CFD result than in the measurement. The coincidence is also shown by the<br />
analysis <strong>of</strong> the wake field which is presented in Table 2. The mean velocities are normalised with the model speed and the<br />
differences with the results from the model test. One can see that the wake field quality and the resistance are captured very<br />
well, as the differences are less than 1%. The relatively large difference in the wake number can be explained by the large<br />
zone <strong>of</strong> deceleration at the eleven o’clock position, which is not so pronounced in the CFD result. Furthermore the wake<br />
number is small which makes it more difficult to capture it correctly. This is also the case for the vertical velocity<br />
component. 2 Figure 8: Measured (left) and computed (right) wake field for bossing design variant 1<br />
Table 2: Analysis <strong>of</strong> measured (Exp) and computed (CFD) wake fields for variant 1 and variant 2<br />
Variant 1<br />
Difference<br />
[%] 2<br />
Difference<br />
[%]<br />
Difference<br />
[%]<br />
Source Exp CFD CFD1-Exp1 Exp CFD CFD2-Exp2 Exp2-Exp1<br />
Radial quality factor 0,9801 0,9831 0,31 0,9824 0,9799 -0,26 0,24<br />
Circumferential quality factor 0,7243 0,7200 -0,59 0,7464 0,7475 0,16 3,05<br />
Wake field quality factor 0,7098 0,7078 -0,28 0,7332 0,7325 -0,10 3,30<br />
Nominal wake number axial 0,0812 0,0979 20,65 0,0836 0,0896 7,19 2,97<br />
Nominal wake number total 0,0810 0,0978 20,76 0,0835 0,0895 7,26 3,00<br />
Mean velocity horizontal -0,0564 -0,0548 -2,87 -0,0566 -0,0525 -7,21 0,23<br />
Mean velocity vertical 0,0565 0,0690 22,06 0,0535 0,0708 32,19 -5,31<br />
For the optimisation <strong>of</strong> the appendages the pressure distribution on the surface <strong>of</strong> the shaft line and shaft bossing is used.<br />
Additionally the section plots <strong>of</strong> the velocity field are used. Figure 9 shows the pressure distribution on the appendages for<br />
the first design. The pressure is normalised with the stagnation pressure. The left side shows the inner and the right side the<br />
outer side <strong>of</strong> the shaft bossing. The relatively large areas <strong>of</strong> low-pressure (red colour) indicate that the bossing is not properly<br />
aligned in the fluid flow. This can also be seen in Figure 10 where a section short before the end <strong>of</strong> the shaft bossing is<br />
shown.<br />
Figure 9: Pressure distribution on the inside (left) and outside (right) <strong>of</strong> the shaft line, design variant 1<br />
2 The vertical velocity component is also affected by the trim which is not necessarily the same for the measurement and the<br />
computation.
Figure 10: Velocity field above the stern tube variant 1<br />
Variant 2: Improved shaft bossing design: With the information gained in the first computations the geometry <strong>of</strong> the shaft<br />
line bossing is modified and especially alignment in the direction <strong>of</strong> the fluid flow. The pressure distribution (see Figure 11)<br />
is smoother than for the first variant. The comparison <strong>of</strong> the wake fields shows the area <strong>of</strong> minimised velocity at the twelve<br />
o'clock position could be reduced. The peak value <strong>of</strong> the normalised axial velocity is increased from 0.40 to 0.42. The wake<br />
field quality factor is increased from 0.708 to 0.733 which is a increasing <strong>of</strong> 3.3%. Experiences from other project at FSG and<br />
<strong>TUHH</strong> show, that this increase <strong>of</strong> the wake field quality already reduces the risk <strong>of</strong> cavitation and the level <strong>of</strong> pressure pulses<br />
significantly.<br />
Figure 11: Pressure distribution on the inside (left) and outside (right) <strong>of</strong> the shaft line, design variant 2<br />
The optimised appendage design was tested in the towing tank. The measured wake field is shown in Figure 12 on the left<br />
side. The coincidence between the measured and the computed wake field is good again. Differences can be seen mainly at<br />
the development <strong>of</strong> the vortices above the shaft line. But this is on the inner radii which are <strong>of</strong> minor interest concerning the<br />
pressure pulses. The resistance was slightly reduced. But the propulsion test showed that the shaft power needed for the<br />
design speed remains the same. This has to seen a positive result, as the wake field quality is improved without negative<br />
effects on the propulsion efficiency.<br />
Figure 12: Measured (left) and computed (right) wake field for improved bossing design variant 2
Variant 3: Improved design with shaft bracket arms: In order to improve the alignment <strong>of</strong> the shaft bracket arms a<br />
numerical model with bracket arms is generated. Figure 13 shows the pressure distribution on the fully appended model.<br />
Figure 13: Pressure distribution on the inside (left) and outside (right) <strong>of</strong> the shaft line, design variant 2<br />
From the pressure distribution one can see that upper bracket arm is not properly aligned, whereas the inner arm fits to the<br />
fluid flow.<br />
Conclusions for RANS-CFD Computations<br />
A process chain was presented which allowed the improvement <strong>of</strong> the appendage <strong>of</strong> ferry during the design phase. Several<br />
appendage design have been tested in the numerical towing tank. The design process could be shorted with the help <strong>of</strong><br />
RANS-CFD and costs for additional model tests could be spared. The coincidence between the CFD-computations and the<br />
measurements from the towing tank is very well. The quality <strong>of</strong> the wake field could be increased without increasing the<br />
resistance or decreasing the propulsion efficiency.<br />
CONCLUSIONS<br />
In this paper a new FSG <strong>RoRo</strong>-ship design has been introduced with focus on power demand and wake field. As the ship<br />
dimensions are limited it was challenging to design a vessel with a low fuel consumption at relatively high Froude numbers<br />
combined with a high block coefficient. An additional challenging demand was to design the aftbody and the appendages in<br />
such a way that the wake field gives the opportunity to design a efficient propeller causing low noise and vibration levels.<br />
Therefore the hullform has been optimised using potential flow methods in order to minimise the resistance and consequently<br />
the propulsion power. Parallel to the resistance optimisation process, RANS-computations have been done to analyse the<br />
wake field. Various aftbody designs including different appendage configurations have been analysed using viscous flow<br />
simulations. The quality <strong>of</strong> the resulting wake fields has been analysed using wake field quality factors. The results <strong>of</strong> the<br />
computations have been compared to model test data.<br />
The results clearly show, that combining FSG’s standard optimisation process using potential flow methods with RANS-CFD<br />
for the optimisation <strong>of</strong> the wake field leads to good predictions <strong>of</strong> the wave pattern and the wake field. The advantages <strong>of</strong><br />
each <strong>of</strong> the both methods have been taken: the fast and robust potential flow method enables the designer to optimise the hull<br />
form efficiently while the more costly viscous flow computations give an better inside into the flow details where necessary.<br />
To integrate the RANS-computations in the practical design process a new process chain has been developed in order to<br />
minimise and standardise the modelling effort.<br />
For the ship design described in this paper a significant power saving has been achieved (approx. 20%) compared to similar<br />
vessels. This fact clearly indicates the potential <strong>of</strong> the optimisation process using boundary element methods.<br />
The appendages have been designed using RANS-Methods. The described method delivers computed wake fields with<br />
sufficient accuracy for practical ship- and basic propeller design. To achieve maximum benefit a new process chain has been<br />
implemented. The development <strong>of</strong> faster and more stable RANS- and pre-processing methods in the recent years and a new<br />
process chain make it possible to integrate appendage optimisation in FSG’s standard design process.
REFERENCES<br />
FARBACH, M., “Bewertung der Güte von Nachstromfeldern”, Hamburg University <strong>of</strong> Technology, Hamburg, Germany,<br />
2004 (in german)<br />
VORHOELER, H. and KRUEGER, S., “Opitimization <strong>of</strong> Appendages Using RANS-CFD-Methods” Symposium “Numerical<br />
Towing Tank Symposium 2007” Hamburg, Germany, September 2007


