ESSAYS ON TEXT MINING FOR IMPROVED DECISION MAKING ...
ESSAYS ON TEXT MINING FOR IMPROVED DECISION MAKING ...
ESSAYS ON TEXT MINING FOR IMPROVED DECISION MAKING ...

Create successful ePaper yourself
Turn your PDF publications into a flip-book with our unique Google optimized e-Paper software.
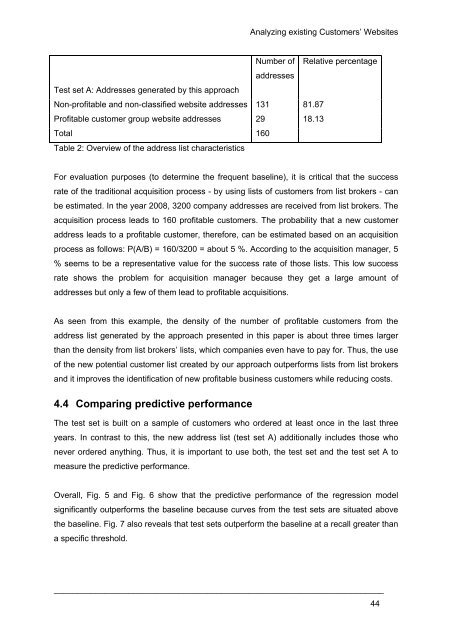
Test set A: Addresses generated by this approach<br />
Analyzing existing Customers’ Websites<br />
Number of<br />
addresses<br />
Non-profitable and non-classified website addresses 131 81.87<br />
Profitable customer group website addresses 29 18.13<br />
Total 160<br />
Table 2: Overview of the address list characteristics<br />
Relative percentage<br />
For evaluation purposes (to determine the frequent baseline), it is critical that the success<br />
rate of the traditional acquisition process - by using lists of customers from list brokers - can<br />
be estimated. In the year 2008, 3200 company addresses are received from list brokers. The<br />
acquisition process leads to 160 profitable customers. The probability that a new customer<br />
address leads to a profitable customer, therefore, can be estimated based on an acquisition<br />
process as follows: P(A/B) = 160/3200 = about 5 %. According to the acquisition manager, 5<br />
% seems to be a representative value for the success rate of those lists. This low success<br />
rate shows the problem for acquisition manager because they get a large amount of<br />
addresses but only a few of them lead to profitable acquisitions.<br />
As seen from this example, the density of the number of profitable customers from the<br />
address list generated by the approach presented in this paper is about three times larger<br />
than the density from list brokers’ lists, which companies even have to pay for. Thus, the use<br />
of the new potential customer list created by our approach outperforms lists from list brokers<br />
and it improves the identification of new profitable business customers while reducing costs.<br />
4.4 Comparing predictive performance<br />
The test set is built on a sample of customers who ordered at least once in the last three<br />
years. In contrast to this, the new address list (test set A) additionally includes those who<br />
never ordered anything. Thus, it is important to use both, the test set and the test set A to<br />
measure the predictive performance.<br />
Overall, Fig. 5 and Fig. 6 show that the predictive performance of the regression model<br />
significantly outperforms the baseline because curves from the test sets are situated above<br />
the baseline. Fig. 7 also reveals that test sets outperform the baseline at a recall greater than<br />
a specific threshold.<br />
_______________________________________________________________________<br />
44