March 12 - Standard Chartered Bank
March 12 - Standard Chartered Bank
March 12 - Standard Chartered Bank

You also want an ePaper? Increase the reach of your titles
YUMPU automatically turns print PDFs into web optimized ePapers that Google loves.
Risk review and disclosures under Basel II Framework for the year ended 31 <strong>March</strong> 20<strong>12</strong><br />
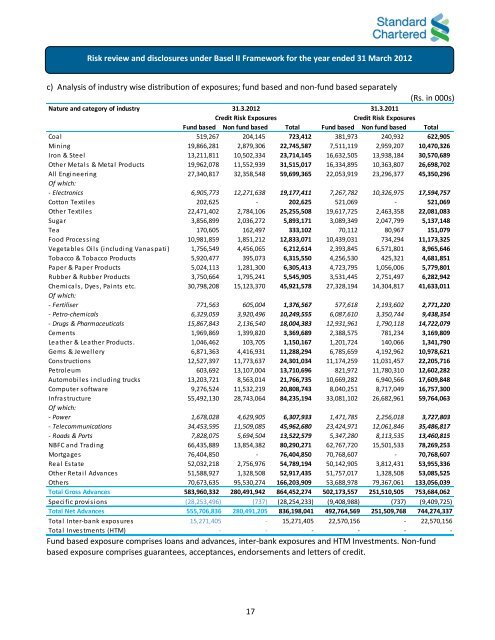
c) Analysis of industry wise distribution of exposures; fund based and non-fund based separately<br />
(Rs. in 000s)<br />
Nature and category of industry<br />
31.3.20<strong>12</strong> 31.3.2011<br />
Credit Risk Exposures<br />
Credit Risk Exposures<br />
Fund based Non fund based Total Fund based Non fund based Total<br />
Coal 519,267 204,145 723,4<strong>12</strong> 381,973 240,932 622,905<br />
Mining 19,866,281 2,879,306 22,745,587 7,511,119 2,959,207 10,470,326<br />
Iron & Steel 13,211,811 10,502,334 23,714,145 16,632,505 13,938,184 30,570,689<br />
Other Metals & Metal Products 19,962,078 11,552,939 31,515,017 16,334,895 10,363,807 26,698,702<br />
All Engineering 27,340,817 32,358,548 59,699,365 22,053,919 23,296,377 45,350,296<br />
Of which:<br />
- Electronics 6,905,773 <strong>12</strong>,271,638 19,177,411 7,267,782 10,326,975 17,594,757<br />
Cotton Textiles 202,625 - 202,625 521,069 - 521,069<br />
Other Textiles 22,471,402 2,784,106 25,255,508 19,617,725 2,463,358 22,081,083<br />
Sugar 3,856,899 2,036,272 5,893,171 3,089,349 2,047,799 5,137,148<br />
Tea 170,605 162,497 333,102 70,1<strong>12</strong> 80,967 151,079<br />
Food Processing 10,981,859 1,851,2<strong>12</strong> <strong>12</strong>,833,071 10,439,031 734,294 11,173,325<br />
Vegetables Oils (including Vanaspati) 1,756,549 4,456,065 6,2<strong>12</strong>,614 2,393,845 6,571,801 8,965,646<br />
Tobacco & Tobacco Products 5,920,477 395,073 6,315,550 4,256,530 425,321 4,681,851<br />
Paper & Paper Products 5,024,113 1,281,300 6,305,413 4,723,795 1,056,006 5,779,801<br />
Rubber & Rubber Products 3,750,664 1,795,241 5,545,905 3,531,445 2,751,497 6,282,942<br />
Chemicals, Dyes, Paints etc. 30,798,208 15,<strong>12</strong>3,370 45,921,578 27,328,194 14,304,817 41,633,011<br />
Of which:<br />
- Fertiliser 771,563 605,004 1,376,567 577,618 2,193,602 2,771,220<br />
- Petro-chemicals 6,329,059 3,920,496 10,249,555 6,087,610 3,350,744 9,438,354<br />
- Drugs & Pharmaceuticals 15,867,843 2,136,540 18,004,383 <strong>12</strong>,931,961 1,790,118 14,722,079<br />
Cements 1,969,869 1,399,820 3,369,689 2,388,575 781,234 3,169,809<br />
Leather & Leather Products. 1,046,462 103,705 1,150,167 1,201,724 140,066 1,341,790<br />
Gems & Jewellery 6,871,363 4,416,931 11,288,294 6,785,659 4,192,962 10,978,621<br />
Constructions <strong>12</strong>,527,397 11,773,637 24,301,034 11,174,259 11,031,457 22,205,716<br />
Petroleum 603,692 13,107,004 13,710,696 821,972 11,780,310 <strong>12</strong>,602,282<br />
Automobiles including trucks 13,203,721 8,563,014 21,766,735 10,669,282 6,940,566 17,609,848<br />
Computer software 9,276,524 11,532,219 20,808,743 8,040,251 8,717,049 16,757,300<br />
Infrastructure 55,492,130 28,743,064 84,235,194 33,081,102 26,682,961 59,764,063<br />
Of which:<br />
- Power 1,678,028 4,629,905 6,307,933 1,471,785 2,256,018 3,727,803<br />
- Telecommunications 34,453,595 11,509,085 45,962,680 23,424,971 <strong>12</strong>,061,846 35,486,817<br />
- Roads & Ports 7,828,075 5,694,504 13,522,579 5,347,280 8,113,535 13,460,815<br />
NBFC and Trading 66,435,889 13,854,382 80,290,271 62,767,720 15,501,533 78,269,253<br />
Mortgages 76,404,850 - 76,404,850 70,768,607 - 70,768,607<br />
Real Estate 52,032,218 2,756,976 54,789,194 50,142,905 3,8<strong>12</strong>,431 53,955,336<br />
Other Retail Advances 51,588,927 1,328,508 52,917,435 51,757,017 1,328,508 53,085,525<br />
Others 70,673,635 95,530,274 166,203,909 53,688,978 79,367,061 133,056,039<br />
Total Gross Advances 583,960,332 280,491,942 864,452,274 502,173,557 251,510,505 753,684,062<br />
Specific provisions (28,253,496) (737) (28,254,233) (9,408,988) (737) (9,409,725)<br />
Total Net Advances 555,706,836 280,491,205 836,198,041 492,764,569 251,509,768 744,274,337<br />
Total Inter-bank exposures 15,271,405 - 15,271,405 22,570,156 - 22,570,156<br />
Total Investments (HTM) - - - - - -<br />
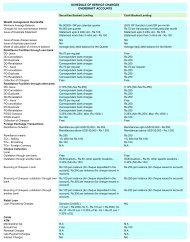
Fund based exposure comprises loans and advances, inter-bank exposures and HTM Investments. Non-fund<br />
based exposure comprises guarantees, acceptances, endorsements and letters of credit.<br />
17