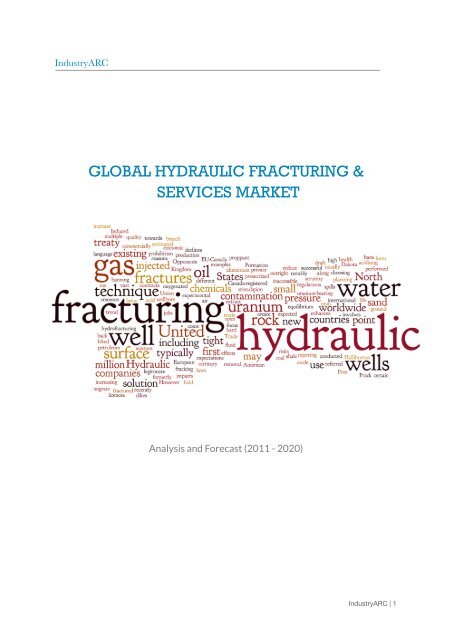
GLOBAL HYDRAULIC FRACTURING & SERVICES MARKET
The report deals with the market for hydraulic fracturing and their services globally, especially in the US and Canada where the demand is high. Another major market covered in the scope of the report is China which has been aggressively expanding its fracturing capacity over the last two years. The report also identifies several other countries in Europe and Asia-Pacific with rich shale oil & gas resources that can be economically extracted. Regulations for hydraulic fracturing in some European countries are not favorable. However, recent technological advancements have made the fracturing process safer and efficient, making many countries across the globe eager to extract their oil and gas resources. The report also covers the demand for water, sand and other additives used in hydraulic fracturing. Fracturing sand and water are limited resources, procured from different suppliers. Stringent regulations owing to the scarcity of water play a major role in the fracturing market
The report deals with the market for hydraulic fracturing and their services globally, especially in the US and Canada where the demand is high. Another major market covered in the scope of the report is China which has been aggressively expanding its fracturing capacity over the last two years. The report also identifies several other countries in Europe and Asia-Pacific with rich shale oil & gas resources that can be economically extracted. Regulations for hydraulic fracturing in some European countries are not favorable. However, recent technological advancements have made the fracturing process safer and efficient, making many countries across the globe eager to extract their oil and gas resources. The report also covers the demand for water, sand and other additives used in hydraulic fracturing. Fracturing sand and water are limited resources, procured from different suppliers. Stringent regulations owing to the scarcity of water play a major role in the fracturing market
- TAGS
- well-completion
- hydraulic-fracturing-chemicals
- fracturing-chemicals
- water-storage-fracturing
- water-storage-market
- proppant-market-research
- proppant-market
- frac-service-companies
- fracturing-companies
- fracturing-service-provides
- fracturing-service-market-size
- fracturing-market-size
- frac-services-market
- fracking-services
- hydraulic-fracturing-services
- hydraulic-services-research
- hydraulic-services
- frac-market
- fracturing-market
- hydraulic-fracking-market
You also want an ePaper? Increase the reach of your titles
YUMPU automatically turns print PDFs into web optimized ePapers that Google loves.
IndustryARC<br />
!<br />
!<br />
!<br />
!<br />
!<br />
!<br />
!<br />
!<br />
!<br />
!<br />
!<br />
!<br />
<strong>GLOBAL</strong> <strong>HYDRAULIC</strong> <strong>FRACTURING</strong> &<br />
<strong>SERVICES</strong> <strong>MARKET</strong><br />
!<br />
!<br />
Analysis and Forecast (2011 - 2020)<br />
IndustryARC | 1
TABLE OF CONTENTS<br />
!<br />
1. Global Hydraulic Fracturing and Services - Market Overview<br />
2. Executive Summary<br />
3. Global Hydraulic Fracturing and Services - Market Landscape<br />
3.1. Market Share Analysis<br />
3.2. Comparative Analysis<br />
3.2.1. Financial Analysis of the top 5 players<br />
4. Global Hydraulic Fracturing and Services - Market Forces<br />
4.1. Market Drivers<br />
4.2. Market Constraints<br />
4.3. Market Challenges<br />
4.4. Hydraulic Fracturing and Services<br />
4.4.1. Power of Suppliers<br />
4.4.2. Power of Customers<br />
4.4.3. Threat of New entrants<br />
4.4.4. Threat of Substitution<br />
4.4.5. Degree of Competition<br />
5. Global Hydraulic Fracturing and Services – Strategic Analysis<br />
5.1. Value Chain Analysis<br />
5.2. Pricing Analysis<br />
5.3. Hydraulic Fracturing Life Cycle Analysis<br />
5.4. Service Companies Competitive Landscape<br />
6. Global Hydraulic Fracturing - Analysis and Forecast (2011 – 2020)<br />
6.1. Global Hydraulic Fracturing Market - Overview by Region<br />
6.1.1. APAC<br />
6.1.1.1 Australia<br />
6.1.1.2 China<br />
6.1.1.3 Indonesia<br />
6.1.1.4 Pakistan<br />
6.1.1.5 Others<br />
IndustryARC | 2
6.1.2. North America<br />
6.1.2.1 Canada<br />
6.1.2.2 Mexico<br />
6.1.2.3 U.S<br />
6.1.3. South America<br />
6.1.3.1 Argentina<br />
6.1.3.2 Brazil<br />
6.1.3.3 Colombia<br />
6.1.3.4 Chile<br />
6.2.3.5 Paraguay<br />
6.2.3.6 Venezuela<br />
6.2.3.7 Others<br />
6.1.4. Europe<br />
6.1.4.1 France<br />
6.1.4.2 Netherlands<br />
6.1.4.3 Poland<br />
6.1.4.4 Russia<br />
6.1.4.5 Ukraine<br />
6.1.4.6 U.K<br />
6.1.4.7 Others<br />
6.1.5. Africa<br />
6.1.5.1 Algeria<br />
6.1.5.2 Egypt<br />
6.1.5.3 Libya<br />
6.1.5.4 Others<br />
6.2. Hydraulic Fracturing Market Split by Resources<br />
6.2.1. Water Demand & Regulations<br />
6.2.1. Hydraulic Fracturing Proppant Demand<br />
6.2.1.1 Fracturing Sand (Includes resin coated)<br />
6.2.1.1 Ceramics<br />
!<br />
6.2.1.2 Potential Niche and Future Proppants<br />
IndustryARC | 3
6.2.2. Chemical Additives and other Materials Demand<br />
6.2.2.1 Friction reducers<br />
6.2.2.2 Biocides<br />
6.2.2.3 Solvents<br />
6.2.2.4 Surfactants<br />
6.2.2.5 Scale inhibitors<br />
6.2.2.6 Acids<br />
6.2. Hydraulic Fracturing Market Cost Analysis<br />
6.2.1. Well Simulation<br />
6.2.2. Well Construction – By Number of Fracturing Stages<br />
6.2.3. Waste Disposal<br />
6.3. Global Hydraulic Fracturing Service Market by Region<br />
6.3.1. APAC<br />
6.1.5.3 China<br />
6.3.2. North America<br />
6.1.5.3 U.S<br />
6.1.5.3 Canada<br />
7. Market Entropy<br />
7.1. M&As, Collaborations, JVs and Partnerships<br />
8. Global Hydraulic Fracturing Service Market Share Analysis<br />
8.1. Halliburton Co. (HAL)<br />
8.2. Baker Hughes Inc.(BHI)<br />
8.3. FTS International Inc.<br />
8.4. Schlumberger Ltd.<br />
8.5. Superior Well Services<br />
8.6. Cudd Energy Services<br />
8.7. Canyon Services Group Inc<br />
8.8. Trican Well Service Ltd.<br />
8.9. Calfrac Well Services Ltd. (CFW)<br />
8.10. China National Petroleum Corporation (CNPC)<br />
IndustryARC | 4
8.11. Weatherford International Ltd<br />
8.12. United Oilfield Services<br />
8.13. Others<br />
9. Appendix<br />
13.1. Abbreviations<br />
13.2. Sources<br />
13.3. Research Methodology<br />
13.4. Bibliography<br />
13.5. Compilation of Expert Insights<br />
!<br />
13.6. Disclaimer<br />
IndustryARC | 5
DEFINITIONS & ASSUMPTIONS<br />
!<br />
1. Hydraulic fracturing market includes fracs completed by both Plug & Purf and Sliding<br />
Sleeve method.<br />
2. Hydraulic fracturing service cost varies from well to well depending on the number of<br />
frac stages and depth of wells, average depth and average number of frac stages for<br />
different zones have been considered for calculating the service cost per well in that<br />
specific zone.<br />
3. Region wise fracturing service cost for wells has been estimated based on the historical<br />
data provided by different service companies. Forecasts for the costs have been arrived<br />
by analyzing raw material trends, regulatory scenario in, demand for oil & gas and<br />
competitive landscape.<br />
4. Water demand for hydraulic fracturing is estimated by multiplying total number of<br />
!<br />
wells constructed using the standard vertical and horizontal methods with the water<br />
required for hydraulic fracturing per well. The amount of water required per well again<br />
varies depending on the depth and number of frac stages but for calculation purposes<br />
an average was assumed.<br />
<strong>HYDRAULIC</strong> <strong>FRACTURING</strong> & <strong>SERVICES</strong> - TRENDS<br />
!<br />
1. Hydraulic fracturing demand slowed down in the U.S due to excess supply of oil and gas<br />
domestically and limited number of exploration projects. As a result price of oil and gas<br />
decreased in 2012 as compared to 2011.<br />
2. Fracturing cost per well is expected to decrease on an annual basis in U.S but will continue to<br />
increase in Canada for the next two years.<br />
3. China has increased its frac capacity and will continue to increase substantially for the next<br />
five years.<br />
4. Majority of the European countries continue to support the ban on hydraulic fracturing.<br />
5. Globally fracturing service cost stood in the range of $2.5 – 3.5 million per well which have<br />
more than 15 and less than 30 frac stages.<br />
!<br />
IndustryARC | 6
1.5<br />
1.6<br />
1.6<br />
1.7<br />
1.8<br />
1.8<br />
1.9<br />
2.1<br />
2.13<br />
2.19<br />
2.25<br />
2.31<br />
2.39<br />
2.54<br />
!<br />
<strong>FRACTURING</strong> SERVICE COST PER WELL, BY COMPANY (2010 - 2013)<br />
2010 2013<br />
Halliburton Co. (HAL)<br />
1.8<br />
xx<br />
Baker Hughes Inc.(BHI)<br />
xx<br />
2.39<br />
Schlumberger Ltd.<br />
xx<br />
xx<br />
FTS International Inc.<br />
xx<br />
2.19<br />
Trican Well Service Ltd.<br />
xx<br />
xx<br />
Superior Well Services<br />
xx<br />
xx<br />
Cudd Pumping<br />
1.5<br />
xx<br />
0 0.65 1.3 1.95 2.6<br />
!<br />
!<br />
Note: Costs per well have been calculated based on secondary market sources and are applicable<br />
for average to large zones (15 to 40 frac stages).<br />
!<br />
IndustryARC | 7
SAMPLE DATA <br />
!<br />
<br />
!<br />
!<br />
!<br />
!<br />
!<br />
!<br />
!<br />
!<br />
!<br />
<strong>HYDRAULIC</strong> <strong>FRACTURING</strong> <strong>MARKET</strong> BY REGION<br />
($ MILLION) - 2011 - 2020<br />
Region 2011 2012 2013 2020 CAGR (%)!<br />
2013-2020<br />
North America xx 33.5 36.2 62.0 8<br />
APAC xx xx xx xx xx<br />
Europe (Includes<br />
Russia)<br />
xx xx xx xx xx<br />
Middle East xx xx xx xx xx<br />
Others xx xx xx xx xx<br />
Total xx xx xx xx xx<br />
<strong>HYDRAULIC</strong> <strong>FRACTURING</strong> WATER STORAGE <strong>MARKET</strong> BY REGION<br />
($ MILLION) - 2011 - 2020<br />
Region 2011 2012 2013 2020 CAGR (%)!<br />
2013-2020<br />
North America xx xx xx xx xx<br />
APAC xx xx xx xx xx<br />
Europe (Includes<br />
Russia)<br />
xx xx xx xx xx<br />
Middle East xx xx xx xx xx<br />
Others xx xx xx xx xx<br />
Total xx 550.0 644.6 1,957.9 17.2<br />
IndustryARC | 8
THE ARC ADVANTAGE<br />
!<br />
An analytical model lies at the core of our process, ensuring logical consistency<br />
throughout our research. We complement the model with secondary data and<br />
interviews with industry experts to reflect the latest trends. With our final expert<br />
validation, we make sure to provide you with only the most accurate and actionable<br />
intelligence.<br />
!<br />
!<br />
!<br />
!<br />
Analytical<br />
Method<br />
1. Granular<br />
breakdown of<br />
drivers into factors<br />
2. Validate all<br />
factors in terms of<br />
their present<br />
impact on the<br />
market<br />
3. Assign weights<br />
to these factors in<br />
terms of their<br />
relevance and<br />
impact on the<br />
THE ARC PROCESS<br />
Base Method<br />
1. Get a top-down<br />
estimate of the<br />
market<br />
!<br />
2. Follow it up with<br />
a bottom-up<br />
estimate of the<br />
market<br />
!<br />
3. Check for<br />
consistency and<br />
new growth factors<br />
that are relevant<br />
over the next 10<br />
Years<br />
Consolidation<br />
Method<br />
1. Granular<br />
breakdown of<br />
drivers into factors<br />
!<br />
2. Validate all<br />
factors in terms of<br />
their present<br />
impact on the<br />
market.<br />
!<br />
3. Assign weights<br />
to these factors in<br />
terms of their<br />
relevance and<br />
impact on the<br />
Delphi<br />
Verification<br />
1. Verify the<br />
findings of the<br />
model with experts<br />
from across the<br />
value chain<br />
!<br />
2. Verify the<br />
findings with<br />
players across small<br />
and large<br />
enterprises<br />
!<br />
3. Tweak the model<br />
and add new<br />
factors<br />
ANALYTICAL MODEL BASE MODEL CONSOLIDATED MODEL ARC MODEL<br />
IndustryARC | 9
<br />
ABOUT US<br />
!<br />
IndustryARC was started by a group of young, passionate professionals along with<br />
extensively experienced industry veterans across various business segments. Our focus and<br />
expertise is mainly in the field of analytics, market research and consulting. Our singular<br />
goal is to provide accurate and affordable research to our clients.<br />
!<br />
Our research team has expertise in diverse fields like Healthcare, Chemicals,<br />
Manufacturing, Logistics, Electronics and Automotive. However diverse the expertise<br />
maybe, everyone in our team shares one common trait - we love data and we love<br />
providing solutions to clients using that data even more! Seeing your business flourish<br />
based on our solutions and strategy is what we love the most!<br />
!<br />
Industry ARC publishes more than 120 reports on an annual basis in the mentioned five<br />
Industries. Our reports are in-depth and high quality reports that can help decision makers<br />
frame better strategies for their business requirements. These reports can be further<br />
customized as per your needs.<br />
!<br />
Disclaimer: IndustryARC Reports and its contents including all the analysis and research<br />
containing valuable market information provided to a select group of customers in<br />
response to orders. Our customers acknowledge when ordering that Industry ARC strategic<br />
analysis services are for our customers’ internal use and not for general publication or<br />
disclosure to third parties.<br />
Quantitative market information is based primarily on interviews and therefore, is subject to<br />
fluctuation. Industry ARC takes no responsibility for any incorrect information supplied to<br />
us by manufacturers or users.<br />
!<br />
No part of this strategic analysis service may be given, lent, resold or disclosed to noncustomers<br />
without written permission. Reproduction and/or transmission in any form and<br />
by any means including photocopying, mechanical, electronic, recording or otherwise,<br />
without the permission of the publisher is prohibited.<br />
!<br />
For information regarding permissions and sales, contact:<br />
sales@industryarc.com | sanjay.matthews@industryarc.com<br />
IndustryARC | 10
!<br />
!<br />
!<br />
!<br />
IndustryARC<br />
+1 585 - 331 - 8686<br />
sales@industryarc.com <br />
!<br />
!<br />
Copyright © 2013 IndustryARC<br />
All Rights Reserved. This document contains highly confidential information and is the sole<br />
property of IndustryARC. No part of it may be circulated, copied, quoted, or otherwise<br />
reproduced without the approval of IndustryARC.<br />
IndustryARC | 11


