city of st. petersburg proposed operating budget & capital ...
city of st. petersburg proposed operating budget & capital ...
city of st. petersburg proposed operating budget & capital ...

Create successful ePaper yourself
Turn your PDF publications into a flip-book with our unique Google optimized e-Paper software.
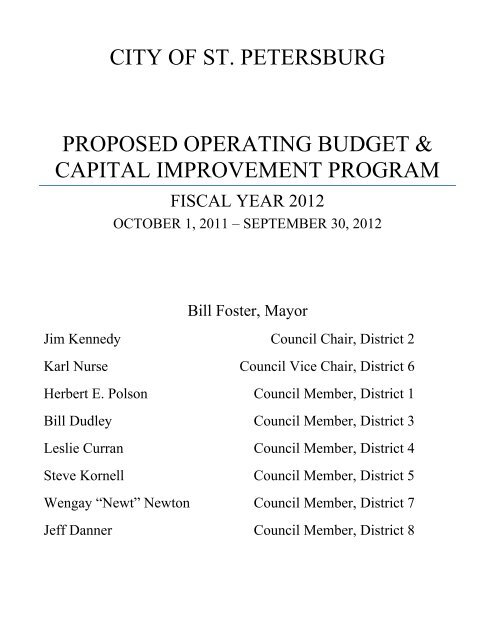
CITY OF ST. PETERSBURG<br />
PROPOSED OPERATING BUDGET &<br />
CAPITAL IMPROVEMENT PROGRAM<br />
FISCAL YEAR 2012<br />
OCTOBER 1, 2011 – SEPTEMBER 30, 2012<br />
Bill Fo<strong>st</strong>er, Mayor<br />
Jim Kennedy Council Chair, Di<strong>st</strong>rict 2<br />
Karl Nurse Council Vice Chair, Di<strong>st</strong>rict 6<br />
Herbert E. Polson Council Member, Di<strong>st</strong>rict 1<br />
Bill Dudley Council Member, Di<strong>st</strong>rict 3<br />
Leslie Curran Council Member, Di<strong>st</strong>rict 4<br />
Steve Kornell Council Member, Di<strong>st</strong>rict 5<br />
Wengay “Newt” Newton Council Member, Di<strong>st</strong>rict 7<br />
Jeff Danner Council Member, Di<strong>st</strong>rict 8
Fiscal Year 2012<br />
City <<strong>st</strong>rong>of</<strong>st</strong>rong> St. Petersburg, Florida - FY 2012 Proposed Fiscal Plan
City <<strong>st</strong>rong>of</<strong>st</strong>rong> St. Petersburg, Florida - FY 2012 Proposed Fiscal Plan<br />
Contents<br />
EXECUTIVE SUMMARY ................................................................................................................................................ 6<br />
FY12 BUDGET DEVELOPMENT PROCESS ................................................................................................................ 7<br />
INTRODUCTION & BUDGET STRATEGY ................................................................................................................... 9<br />
PERSONNEL OVERVIEW ........................................................................................................................................ 21<br />
RATES AND FEES ................................................................................................................................................... 24<br />
GENERAL FUND OVERVIEW .................................................................................................................................. 32<br />
ENTERPRISE FUNDS OVERVIEW ............................................................................................................................ 35<br />
SUBSIDIES OVERVIEW ........................................................................................................................................... 37<br />
CAPITAL IMPROVEMENT FUNDS AND CIP OVERVIEW ......................................................................................... 38<br />
DEPENDENT DISTRICTS ......................................................................................................................................... 41<br />
FUND STRUCTURE ................................................................................................................................................ 41<br />
BASIS OF ACCOUNTING ........................................................................................................................................ 42<br />
AT A GLANCE - CITY OF ST. PETERSBURG, FL ........................................................................................................ 43<br />
CIVIC, CULTURAL & RECREATIONAL ..................................................................................................................... 45<br />
FISCAL POLICIES ........................................................................................................................................................ 47<br />
POSITION SUMMARY ................................................................................................................................................ 62<br />
General Operating Fund ....................................................................................................................................... 62<br />
Non-General Operating Funds ............................................................................................................................. 63<br />
City Development ................................................................................................................................................. 64<br />
General Government Admini<strong>st</strong>ration ................................................................................................................... 64<br />
Leisure & Community Services Admini<strong>st</strong>ration .................................................................................................... 65<br />
Public Safety ......................................................................................................................................................... 66<br />
Public Works Admini<strong>st</strong>ration ................................................................................................................................ 66<br />
Revenue Highlights ................................................................................................................................................... 67<br />
Total Operating Revenues .................................................................................................................................... 67<br />
Utility Taxes .......................................................................................................................................................... 70<br />
Franchise Taxes .................................................................................................................................................... 70<br />
Excise Tax .............................................................................................................................................................. 71<br />
Local Option Gas Tax ............................................................................................................................................ 72<br />
Enterprise Funds ................................................................................................................................................... 72<br />
Water Resources Fund: ........................................................................................................................................ 72<br />
Fiscal Year 2012
City <<strong>st</strong>rong>of</<strong>st</strong>rong> St. Petersburg, Florida - FY 2012 Proposed Fiscal Plan<br />
Sanitation Fund..................................................................................................................................................... 73<br />
Stormwater Fund .................................................................................................................................................. 74<br />
FUND BUDGET SUMMARY........................................................................................................................................ 75<br />
General Fund (0001)............................................................................................................................................. 75<br />
Preservation Reserve (0002) ................................................................................................................................ 81<br />
Indu<strong>st</strong>rial Development (0005) ............................................................................................................................ 82<br />
Economic Stability (0008)..................................................................................................................................... 83<br />
Health Facilities Authority (0051)......................................................................................................................... 84<br />
Utility Tax Revenue (1001) ................................................................................................................................... 85<br />
Local Option Tax Revenue (1003)......................................................................................................................... 86<br />
Franchise Tax Revenue (1005).............................................................................................................................. 87<br />
Excise Tax Revenue (1007) ................................................................................................................................... 88<br />
Emergency Medical Services (1009)..................................................................................................................... 89<br />
American Recovery & Reinve<strong>st</strong>ment Act (1017) .................................................................................................. 90<br />
Local Housing Assi<strong>st</strong>ance (1019) .......................................................................................................................... 91<br />
Parking Revenue (1021) ....................................................................................................................................... 92<br />
Law Enforcement Tru<strong>st</strong> (1023) ............................................................................................................................. 94<br />
School Crossing Guard Tru<strong>st</strong> (1025) ..................................................................................................................... 95<br />
Weeki Wachee (1041) .......................................................................................................................................... 96<br />
Arts And Cultural Programs (1042)....................................................................................................................... 97<br />
Pro Sports Facility (1051)...................................................................................................................................... 98<br />
Economic Development (1101) ............................................................................................................................ 99<br />
Downtown Redevelopment Di<strong>st</strong>rict (1105)........................................................................................................ 100<br />
Bayboro Harbor Tax Increment Di<strong>st</strong>rict (1106) .................................................................................................. 101<br />
Intown We<strong>st</strong> Tax Increment Di<strong>st</strong>rict (1107) ....................................................................................................... 102<br />
Assessments Revenue (1108)............................................................................................................................. 103<br />
Community Development Block Grant (1111) ................................................................................................... 104<br />
Emergency Shelter Grant Fund (1112) ............................................................................................................... 105<br />
Home Program (1113) ........................................................................................................................................ 106<br />
Neighborhood Stabilization Program (1114)...................................................................................................... 107<br />
Miscellaneous Tru<strong>st</strong> Funds (1115)...................................................................................................................... 108<br />
Community Housing Tru<strong>st</strong> (1117) ...................................................................................................................... 109<br />
Building Permit Special Revenue (1151) ............................................................................................................ 110<br />
Fiscal Year 2012
City <<strong>st</strong>rong>of</<strong>st</strong>rong> St. Petersburg, Florida - FY 2012 Proposed Fiscal Plan<br />
Mahaffey Theater Operating (1201) .................................................................................................................. 111<br />
Pier Operating (1203) ......................................................................................................................................... 112<br />
Coliseum Operating (1205)................................................................................................................................. 113<br />
Sunken Gardens (1207) ...................................................................................................................................... 114<br />
Tropicana Field (1208)........................................................................................................................................ 115<br />
Community Redevelopment Di<strong>st</strong>rict (1301)....................................................................................................... 116<br />
Police Grant Tru<strong>st</strong> Funds (1702) ......................................................................................................................... 117<br />
FFGFC Loan (2011).............................................................................................................................................. 118<br />
Banc Of America Notes Debt Service Fund (2013) ............................................................................................. 119<br />
BB&T Notes (2014) ............................................................................................................................................. 120<br />
Capital Improvement Variable Rate Debt (2015) ............................................................................................... 121<br />
Utility Tax Debt Service (2021) ........................................................................................................................... 122<br />
Stadium Debt Service (2025) .............................................................................................................................. 123<br />
Sports Facility Sales Tax Debt (2027).................................................................................................................. 124<br />
Redevelopment Debt Service (2035).................................................................................................................. 125<br />
Water Resources (4001) ..................................................................................................................................... 126<br />
Water Resources Debt (4002) ............................................................................................................................ 127<br />
Water Co<strong>st</strong> Stabilization (4005).......................................................................................................................... 128<br />
Stormwater Utility Operating (4011) ................................................................................................................. 129<br />
Stormwater Debt Service (4012) ........................................................................................................................ 130<br />
Sanitation Operating (4021) ............................................................................................................................... 131<br />
Sanitation Equipment Replacement (4027) ....................................................................................................... 132<br />
Airport Operating (4031).................................................................................................................................... 133<br />
Marina Operating (4041).................................................................................................................................... 135<br />
Golf Course Operating (4061)............................................................................................................................. 137<br />
Jame<strong>st</strong>own Complex (4081) ............................................................................................................................... 139<br />
Port Operating (4091)......................................................................................................................................... 140<br />
Fleet Management (5001).................................................................................................................................. 141<br />
Equipment Replacement (5002)......................................................................................................................... 142<br />
Municipal Office Buildings (5005) ...................................................................................................................... 143<br />
Information & Communication Services (5011)................................................................................................. 144<br />
Pc Replacement (5015)....................................................................................................................................... 145<br />
Radio Replacement (5017) ................................................................................................................................. 146<br />
Fiscal Year 2012
City <<strong>st</strong>rong>of</<strong>st</strong>rong> St. Petersburg, Florida - FY 2012 Proposed Fiscal Plan<br />
Technology & Infra<strong>st</strong>ructure Fund (5019) .......................................................................................................... 147<br />
Supply Management (5031) ............................................................................................................................... 148<br />
Print Shop (5041)................................................................................................................................................ 149<br />
Health Insurance (5121) ..................................................................................................................................... 150<br />
Life Insurance (5123) .......................................................................................................................................... 151<br />
General Liabilities Claims (5125) ........................................................................................................................ 152<br />
Commercial Insurance (5127) ............................................................................................................................ 153<br />
Workers' Compensation (5129).......................................................................................................................... 154<br />
Billing & Collections (5201)................................................................................................................................. 155<br />
Deferred Compensation - ICMA (6911).............................................................................................................. 156<br />
Internal Service Funds Used ............................................................................................................................... 157<br />
COMBINED TOTAL DEBT REQUIREMENTS .............................................................................................................. 158<br />
(PRINCIPAL AND INTEREST) - BY FISCAL YEAR ........................................................................................................ 158<br />
DEBT SERVICE FORECAST ........................................................................................................................................ 159<br />
City Development ................................................................................................................................................... 160<br />
City Development Admini<strong>st</strong>ration Department ................................................................................................. 164<br />
Codes Compliance Department.......................................................................................................................... 165<br />
Downtown Enterprise Facilities Department ..................................................................................................... 168<br />
Marketing & Communications Department ....................................................................................................... 172<br />
Planning & Economic Development Department .............................................................................................. 175<br />
Real E<strong>st</strong>ate & Property Management Department ............................................................................................ 179<br />
Transportation & Parking Management Department ........................................................................................ 181<br />
General Government Admini<strong>st</strong>ration ..................................................................................................................... 183<br />
General Government Admini<strong>st</strong>ration ................................................................................................................. 184<br />
Audit Services Department................................................................................................................................. 189<br />
Billing & Collections Department ....................................................................................................................... 191<br />
Budget & Management Department ................................................................................................................. 193<br />
City Clerk ............................................................................................................................................................. 195<br />
City Council ......................................................................................................................................................... 197<br />
Finance Department ........................................................................................................................................... 199<br />
Human Resources Department .......................................................................................................................... 205<br />
Information & Communication Services Department ........................................................................................ 210<br />
Internal Services Admini<strong>st</strong>ration Department ................................................................................................... 213<br />
Fiscal Year 2012
City <<strong>st</strong>rong>of</<strong>st</strong>rong> St. Petersburg, Florida - FY 2012 Proposed Fiscal Plan<br />
Legal Department ............................................................................................................................................... 215<br />
Mayor's Office .................................................................................................................................................... 217<br />
Leisure & Community Services Admini<strong>st</strong>ration ...................................................................................................... 219<br />
Leisure & Community Services Admini<strong>st</strong>ration .................................................................................................. 220<br />
Golf Course Department .................................................................................................................................... 222<br />
Housing Department .......................................................................................................................................... 225<br />
Leisure & Community Services Admini<strong>st</strong>ration Department ............................................................................. 228<br />
Library Department ............................................................................................................................................ 230<br />
Neighborhood Partnership Department ............................................................................................................ 233<br />
Parks & Recreation Department ........................................................................................................................ 235<br />
Public Safety ........................................................................................................................................................... 241<br />
Public Safety ....................................................................................................................................................... 242<br />
Fire Department ................................................................................................................................................. 244<br />
Police Department .............................................................................................................................................. 248<br />
Public Works Admini<strong>st</strong>ration .................................................................................................................................. 253<br />
Public Works Admini<strong>st</strong>ration .............................................................................................................................. 254<br />
Engineering and Capital Improvements Department ........................................................................................ 257<br />
Fleet Management Department ......................................................................................................................... 261<br />
Procurement & Supply Management ................................................................................................................. 263<br />
Public Works Admini<strong>st</strong>ration Department ......................................................................................................... 265<br />
Sanitation Department ....................................................................................................................................... 267<br />
Stormwater, Pavement & Traffic Operations Department ................................................................................ 270<br />
Water Resources Department ............................................................................................................................ 274<br />
Fiscal Year 2012
City <<strong>st</strong>rong>of</<strong>st</strong>rong> St. Petersburg, Florida - FY 2012 Proposed Fiscal Plan<br />
EXECUTIVE SUMMARY<br />
The <strong>operating</strong> <strong>budget</strong> for the City <<strong>st</strong>rong>of</<strong>st</strong>rong> St. Petersburg for FY12 totals $460.843 million for all<br />
funds, excluding internal service funds and dependent di<strong>st</strong>ricts. This is an increase <<strong>st</strong>rong>of</<strong>st</strong>rong> $4.934<br />
million or 1% from the FY11 Adopted Budget. The e<strong>st</strong>imate included herein was used by City<br />
Council to set the millage rate as required by Florida Statutes. In addition, the FY12 <strong>capital</strong><br />
<strong>budget</strong> totals $111.96 million.<br />
The City’s <strong>budget</strong> is comprised <<strong>st</strong>rong>of</<strong>st</strong>rong> a number <<strong>st</strong>rong>of</<strong>st</strong>rong> different funds which are set up to accomplish<br />
different functions. This allows for segregation and tracking the full co<strong>st</strong>s <<strong>st</strong>rong>of</<strong>st</strong>rong> different City<br />
operations and programs. The following table shows the dollar amount, in millions, <strong>budget</strong>ed for<br />
each <strong>operating</strong> fund:<br />
General Fund & Reserves $199.658 Water Resources $102.841<br />
Non-Operating $54.464 Sanitation $38.536<br />
Other $54.858 Stormwater $10.486<br />
As indicated in the charts to follow, the<br />
General Fund, which is the fund that<br />
receives ad valorem and other tax revenues<br />
and includes traditional government services<br />
such as police, fire, and road maintenance,<br />
makes up 43% <<strong>st</strong>rong>of</<strong>st</strong>rong> the total <strong>budget</strong>. The three<br />
large<strong>st</strong> enterprise funds which are funded by<br />
fees paid by users <<strong>st</strong>rong>of</<strong>st</strong>rong> the services: Water<br />
Resources, Stormwater Utility, and<br />
Sanitation make up an additional 33%. The<br />
remainder is attributable to other <strong>operating</strong>,<br />
special revenue and debt service funds.<br />
Revenues used to fund the previously<br />
mentioned programs are shown in the<br />
following chart:<br />
As indicated, user fees comprise 35% <<strong>st</strong>rong>of</<strong>st</strong>rong> all<br />
City revenues. Taxes, including ad valorem,<br />
make up 24%. ―Transfers‖ include debt<br />
service requirements as well as other interfund<br />
transfers. Payment in Lieu <<strong>st</strong>rong>of</<strong>st</strong>rong> Taxes<br />
(PILOT) and General and Admini<strong>st</strong>rative<br />
Charges (G&A) make up an additional 4%<br />
and are used to assure that user fees include<br />
the full co<strong>st</strong> <<strong>st</strong>rong>of</<strong>st</strong>rong> the service.<br />
Fiscal Year 2012 6
City <<strong>st</strong>rong>of</<strong>st</strong>rong> St. Petersburg, Florida - FY 2012 Proposed Fiscal Plan<br />
FY12 BUDGET DEVELOPMENT PROCESS<br />
The City’s <strong>budget</strong> approval process is defined by <strong>st</strong>ate <strong>st</strong>atute, the City Charter, and the City Code<br />
(ordinances). The process also contains additional non-mandated <strong>st</strong>eps, which are designed to provide the<br />
City Council and the general public with opportunities for early input into <strong>budget</strong>ary decisions. Each year<br />
City Council approves an <strong>operating</strong> <strong>budget</strong> and a <strong>capital</strong> improvement <strong>budget</strong>. The adopted <strong>capital</strong><br />
improvement <strong>budget</strong> becomes the fir<strong>st</strong> year <<strong>st</strong>rong>of</<strong>st</strong>rong> a multi-year Capital Improvement Program.<br />
Adoption Process<br />
The City’s fiscal year begins October 1 and ends September 30, as specified by <strong>st</strong>ate law. Florida Statutes<br />
further require that <strong>budget</strong> appropriations occur each year and that each year’s <strong>budget</strong> mu<strong>st</strong> be balanced.<br />
Further, there are very specific and detailed rules known collectively as the ―Truth in Millage‖ or<br />
―TRIM.‖ These rules dictate the approval process for the <strong>budget</strong> in general and property taxes in<br />
particular. TRIM sets the timetable for the County Property Appraiser to deliver e<strong>st</strong>imated and certified<br />
tax rolls to the taxing authorities, including the City. It further requires that a tentative millage rate be<br />
approved by the City by a certain date, that the Appraiser mail notices <<strong>st</strong>rong>of</<strong>st</strong>rong> <strong>proposed</strong> taxes (TRIM notices)<br />
to all property owners by a certain date, that two public hearings be held within certain specific time<br />
periods, and that the City run newspaper advertisements which follow exact specifications for wording,<br />
size, and placement prior to the final public hearing. The hearings themselves mu<strong>st</strong> be conducted<br />
according to a prescribed format and sequence <<strong>st</strong>rong>of</<strong>st</strong>rong> Council actions. This process includes the calculation<br />
and announcement <<strong>st</strong>rong>of</<strong>st</strong>rong> a theoretical ―rolled back‖ millage rate (the rate which would generate the same<br />
property tax revenue in the current year given the updated property valuation). The percentage change in<br />
property tax from the prior year resulting from the <strong>proposed</strong> millage rate mu<strong>st</strong> also be announced. Finally,<br />
the City mu<strong>st</strong> document its compliance with the TRIM rules and submit this documentation to the State<br />
for review and approval.<br />
The City Charter and City Code require that the Mayor submit a recommended <strong>budget</strong> to City Council by<br />
July 1, containing specific information outlined in the Code. The Code also requires additional<br />
supplementary line item detail not contained in the recommended document, but provided to Council in a<br />
separate volume by July 1.<br />
Other major planning processes that may impact the <strong>budget</strong> include the Comprehensive Plan, which<br />
according to <strong>st</strong>ate <strong>st</strong>atute, defines infra<strong>st</strong>ructure requirements and levels <<strong>st</strong>rong>of</<strong>st</strong>rong> service. The Comprehensive<br />
Plan includes a Capital Improvements Element, which is updated in conjunction with the Capital<br />
Improvement Program and <strong>budget</strong>. The City is required to make an annual report on <strong>budget</strong> compliance<br />
with the Capital Improvement Element <<strong>st</strong>rong>of</<strong>st</strong>rong> the Comprehensive Plan. Beyond the requirements <<strong>st</strong>rong>of</<strong>st</strong>rong> <strong>st</strong>ate<br />
<strong>st</strong>atute and the City Charter, the City adopted a series <<strong>st</strong>rong>of</<strong>st</strong>rong> fiscal policies that provide guidance in<br />
developing the annual <strong>budget</strong>. A discussion <<strong>st</strong>rong>of</<strong>st</strong>rong> these policies, which cover such areas as revenue<br />
foreca<strong>st</strong>ing, fund balances, and the issuance <<strong>st</strong>rong>of</<strong>st</strong>rong> debt, are included in a later section <<strong>st</strong>rong>of</<strong>st</strong>rong> this document.<br />
The goals <<strong>st</strong>rong>of</<strong>st</strong>rong> the City are set forth in the Fo<strong>st</strong>er Formula and the Key Strategic Initiatives for Developing<br />
the Budget plans as shown below:<br />
The Fo<strong>st</strong>er Formula—the 7 S’s <<strong>st</strong>rong>of</<strong>st</strong>rong> Success<br />
Safety—all citizens and employees actively involved in achieving public safety<br />
Seamlessness—entire <<strong>st</strong>rong>city</<strong>st</strong>rong> well served with quality appearance, schools, amenities, housing, retail<br />
and commercial services, and transportation<br />
Su<strong>st</strong>ainability—ensuring the <<strong>st</strong>rong>city</<strong>st</strong>rong>’s long-term economic viability<br />
Small Business—supporting citizen needs for goods, services, and jobs<br />
Schools—preparing <strong>st</strong>udents for life<br />
Fiscal Year 2012 7
City <<strong>st</strong>rong>of</<strong>st</strong>rong> St. Petersburg, Florida - FY 2012 Proposed Fiscal Plan<br />
Sports, Arts & Culture—making the <<strong>st</strong>rong>city</<strong>st</strong>rong> a recognized de<strong>st</strong>ination<br />
Service—cu<strong>st</strong>omer friendly, co<strong>st</strong> effective, and pr<<strong>st</strong>rong>of</<strong>st</strong>rong>essional<br />
Key Strategic Initiatives for Developing the Budget<br />
Re<strong>st</strong>ructure the <strong>budget</strong>ary process and perform a service level <strong>budget</strong>ing review <<strong>st</strong>rong>of</<strong>st</strong>rong> five to seven<br />
departments each year, focusing on public benefit vs. co<strong>st</strong>s<br />
Concentrate on providing the basic services essential to our quality <<strong>st</strong>rong>of</<strong>st</strong>rong> life, discerning ―needs vs.<br />
wants‖<br />
Reduce co<strong>st</strong>s, via consolidation <<strong>st</strong>rong>of</<strong>st</strong>rong> services, optimization <<strong>st</strong>rong>of</<strong>st</strong>rong> technology usage, and consideration <<strong>st</strong>rong>of</<strong>st</strong>rong><br />
Operating Fund impacts <<strong>st</strong>rong>of</<strong>st</strong>rong> <strong>capital</strong> projects<br />
Keep public safety a top priority<br />
City resources and departmental support will be directed to areas <<strong>st</strong>rong>of</<strong>st</strong>rong> greate<strong>st</strong> need<br />
A series <<strong>st</strong>rong>of</<strong>st</strong>rong> workshops were held with City Council throughout the year to discuss the economic, financial,<br />
and programmatic issues pertinent to the <strong>budget</strong> development process. The Mayor also held a series <<strong>st</strong>rong>of</<strong>st</strong>rong><br />
<strong>budget</strong> summits in the community where the public was invited to give City <<strong>st</strong>rong>of</<strong>st</strong>rong>ficials input prior to the<br />
release <<strong>st</strong>rong>of</<strong>st</strong>rong> the Mayor’s Recommended Budget on July 1. A schedule <<strong>st</strong>rong>of</<strong>st</strong>rong> the <strong>budget</strong> process follows:<br />
SCHEDULE FOR THE FY12 BUDGET PROCESS<br />
Date Action By<br />
January 20 City Council Budget Priorities Workshop City Council<br />
Budget Staff<br />
January 27<br />
BFT – City Council Budget Priorities<br />
and Budget Calendar<br />
BFT Committee<br />
Budget Director<br />
February 1 CIP Budgets Due Departments<br />
February 16 Operating Budget Kick<<strong>st</strong>rong>of</<strong>st</strong>rong>f Budget Staff<br />
Departments<br />
February 28 – March 7 CIP Reviews with Departments Budget Staff & Departments<br />
March 14 Operating Budgets Due Departments<br />
March 28 – April 15 Line Item Reviews Budget Staff & Departments<br />
April 27 Community Budget Summit City Council<br />
Mayor<br />
Budget Staff<br />
May 10 & 24 City Council Workshop City Council, Mayor<br />
Budget Staff, Admini<strong>st</strong>rators<br />
Department Directors<br />
May 18 Community Budget Summit City Council<br />
Mayor<br />
Budget Staff<br />
May & June Recommended Document Preparation Budget Staff<br />
June 1 E<strong>st</strong>imate due from Property Appraiser County Property Appraiser<br />
June 22<br />
Community Budget Summit<br />
City Council<br />
Mayor<br />
Budget Staff<br />
Fiscal Year 2012 8
City <<strong>st</strong>rong>of</<strong>st</strong>rong> St. Petersburg, Florida - FY 2012 Proposed Fiscal Plan<br />
July 1 Receive Certified Taxable Values County Property Appraiser<br />
July 1<br />
July 21<br />
September 8<br />
(tentative)<br />
September 22<br />
(tentative)<br />
Mayor’s Recommended Budget due to<br />
City Council<br />
Set Proposed Millage Rate; Set Date, Time &<br />
Place <<strong>st</strong>rong>of</<strong>st</strong>rong> Public Hearings<br />
1 <strong>st</strong> Public Hearing (mu<strong>st</strong> be held after 5:00 p.m.)<br />
Adopt tentative <strong>budget</strong> & tax rate<br />
2 nd Public Hearing (mu<strong>st</strong> be held after 5:00 p.m.)<br />
Adopt final <strong>budget</strong> & tax rate; Approve the Capital<br />
Improvement Program<br />
Mayor, City Council<br />
Budget Staff<br />
City Council<br />
Mayor<br />
City Council, Mayor<br />
Budget Staff, Admini<strong>st</strong>rators,<br />
Department Directors<br />
City Council, Mayor<br />
Budget Staff, Admini<strong>st</strong>rators,<br />
Department Directors<br />
INTRODUCTION & BUDGET STRATEGY<br />
Tax Reform & the Economy Revisited for Fiscal Year 2012<br />
With the 2012 recommended <strong>budget</strong>, the City <<strong>st</strong>rong>of</<strong>st</strong>rong> St. Petersburg will experience the fifth year in a row <<strong>st</strong>rong>of</<strong>st</strong>rong><br />
declining property tax revenue. In fiscal years 2008 and 2009, the decline in ad valorem revenue was<br />
largely due to action at the <strong>st</strong>ate level directed at reducing local property taxes. For the FY 2010, FY 2011<br />
and FY2012 <strong>budget</strong>s, the decrease in property tax revenue is due to a conscious decision on the part <<strong>st</strong>rong>of</<strong>st</strong>rong> the<br />
City to maintain a <strong>st</strong>able millage rate.<br />
Real e<strong>st</strong>ate values in the Tampa Bay area remain sharply lower than they were five years ago. This<br />
devaluation combined with a record number <<strong>st</strong>rong>of</<strong>st</strong>rong> foreclosures and vacant properties has resulted in taxable<br />
property values decreasing by as much as 40% – 50% for some properties. While property sales are<br />
<strong>st</strong>arting to make a comeback, taxable property values in the <<strong>st</strong>rong>city</<strong>st</strong>rong> continue to decline for the 2012 <strong>budget</strong><br />
year. Recent information from the appraiser indicates that the City taxable property value will decline in<br />
value <<strong>st</strong>rong>of</<strong>st</strong>rong> approximately 6.14%, resulting in a property tax <<strong>st</strong>rong>of</<strong>st</strong>rong> $69.6 million, compared to $74.4 million in<br />
2011. The property tax sy<strong>st</strong>em is designed to respond to this type <<strong>st</strong>rong>of</<strong>st</strong>rong> situation by allowing governments to<br />
adju<strong>st</strong> the millage rate <<strong>st</strong>rong>of</<strong>st</strong>rong>fset either a decline or an increase in property values. This adju<strong>st</strong>ment is called<br />
the ―rollback‖ or ―rollforward‖ rate.<br />
For the FY11 <strong>budget</strong> the City could have increased the millage rate to the ―rollforward‖ rate in order to<br />
prevent a loss <<strong>st</strong>rong>of</<strong>st</strong>rong> property tax revenue. However, the decision was to keep the millage rate <strong>st</strong>able, thereby<br />
insuring a true tax cut for the citizens amounting to $8.7 million on a <<strong>st</strong>rong>city</<strong>st</strong>rong>wide basis. In FY12, the <strong>budget</strong><br />
once again calls for a <strong>st</strong>able millage rate resulting in an additional $4.8 million tax cut for City property<br />
owners, which is on top <<strong>st</strong>rong>of</<strong>st</strong>rong> the tax cuts in previous years.<br />
Including the tax cut incorporated in this recommended <strong>budget</strong>, the total decline in <<strong>st</strong>rong>city</<strong>st</strong>rong> property tax<br />
revenue from the 2007 level will be approximately $34 million per year. Our expectation is that this<br />
sharply reduced revenue level represents a new benchmark level <<strong>st</strong>rong>of</<strong>st</strong>rong> resources available to the <<strong>st</strong>rong>city</<strong>st</strong>rong>.<br />
The taxable property value for the City is expected to be flat or decline again for fiscal year 2013 with<br />
potential for recovery in 2014, 2015 and 2016. Recovery is not expected to be dramatic and new<br />
legislation at the <strong>st</strong>ate level may hinder the increase <<strong>st</strong>rong>of</<strong>st</strong>rong> taxable property values as the economy improves.<br />
The following chart shows the increase in taxable values and subsequent declines experienced in FY09,<br />
FY10, FY11 and FY12. The projected taxable value <<strong>st</strong>rong>of</<strong>st</strong>rong> $13.1 billion for 2012 is less than the<br />
2005 amount. During the mo<strong>st</strong> rapid period <<strong>st</strong>rong>of</<strong>st</strong>rong> taxable value growth, 2004 to 2008, the City was able to<br />
reduce the millage rate by approximately 1.2 mills.<br />
Fiscal Year 2012 9
City <<strong>st</strong>rong>of</<strong>st</strong>rong> St. Petersburg, Florida - FY 2012 Proposed Fiscal Plan<br />
20,000,000,000<br />
18,000,000,000<br />
16,000,000,000<br />
14,000,000,000<br />
12,000,000,000<br />
10,000,000,000<br />
8,000,000,000<br />
6,000,000,000<br />
4,000,000,000<br />
2,000,000,000<br />
0<br />
Gross Taxable Property Values<br />
2000 2001 2002 2003 2004 2005 2006 2007 2008 2009 2010 2011 2012<br />
Budget Strategy<br />
In order to meet the challenge <<strong>st</strong>rong>of</<strong>st</strong>rong> providing a high level <<strong>st</strong>rong>of</<strong>st</strong>rong> service while experiencing the fifth <strong>st</strong>raight<br />
year <<strong>st</strong>rong>of</<strong>st</strong>rong> declining property tax revenue, a combined approach <<strong>st</strong>rong>of</<strong>st</strong>rong> sub<strong>st</strong>antial <strong>budget</strong> cuts, appropriate<br />
revenue enhancements and judicious use <<strong>st</strong>rong>of</<strong>st</strong>rong> fund balance was required. Every department in the City<br />
submitted <strong>budget</strong> reduction packages <<strong>st</strong>rong>of</<strong>st</strong>rong> 1%, 3%, and 5%, which were then reviewed carefully to<br />
determine which reductions would have the lea<strong>st</strong> impact on service delivery to the residents. In addition, a<br />
number <<strong>st</strong>rong>of</<strong>st</strong>rong> departments participated in a service level <strong>budget</strong>ing exercise.<br />
Mo<strong>st</strong> <<strong>st</strong>rong>of</<strong>st</strong>rong> the departmental <strong>budget</strong> reduction packages included some position eliminations or re<strong>st</strong>ructuring<br />
<<strong>st</strong>rong>of</<strong>st</strong>rong> <strong>st</strong>affing. As a result <<strong>st</strong>rong>of</<strong>st</strong>rong> these measures, this <strong>budget</strong> includes the elimination <<strong>st</strong>rong>of</<strong>st</strong>rong> 41 full-time positions at<br />
an approximate, annual co<strong>st</strong> savings <<strong>st</strong>rong>of</<strong>st</strong>rong> $2.7 million; $254,000 <<strong>st</strong>rong>of</<strong>st</strong>rong> this amount as a result <<strong>st</strong>rong>of</<strong>st</strong>rong> positions<br />
eliminated midyear in FY11. It is expected that mo<strong>st</strong> <<strong>st</strong>rong>of</<strong>st</strong>rong> the affected employees will be <<strong>st</strong>rong>of</<strong>st</strong>rong>fered other<br />
positions within the City and that the number <<strong>st</strong>rong>of</<strong>st</strong>rong> actual lay<<strong>st</strong>rong>of</<strong>st</strong>rong>fs will be small. Since 2001, and including the<br />
mo<strong>st</strong> recent position reductions, the cumulative, total full-time positions reduced is 372 with a sub<strong>st</strong>antial<br />
portion <<strong>st</strong>rong>of</<strong>st</strong>rong> that total attributable to management, pr<<strong>st</strong>rong>of</<strong>st</strong>rong>essional or supervisory positions.<br />
A number <<strong>st</strong>rong>of</<strong>st</strong>rong> <strong>st</strong>rategic initiatives will be in<strong>st</strong>ituted or continued in FY12 including the continuation <<strong>st</strong>rong>of</<strong>st</strong>rong> a<br />
wage freeze that was enacted in 2009 for all management, pr<<strong>st</strong>rong>of</<strong>st</strong>rong>essional, and supervisory <strong>st</strong>aff earning<br />
more than $50,000 per year. For fiscal year 2012, a general wage freeze is in effect for all employees.<br />
However, the <strong>budget</strong> does include wage <strong>st</strong>eps for Police and Fire represented employees. In addition,<br />
there is a hiring freeze in effect such that all vacant positions are reviewed by the City Admini<strong>st</strong>rator to<br />
determine if the position can be left unfilled or even eliminated.<br />
There will be some service impacts to the public in the form <<strong>st</strong>rong>of</<strong>st</strong>rong> reduced hours and, in some cases,<br />
increased fees. However, considerable effort has gone into minimizing the effect on residents by focusing<br />
on internal savings, the elimination <<strong>st</strong>rong>of</<strong>st</strong>rong> top-level admini<strong>st</strong>rative positions, admini<strong>st</strong>rative reorganization and<br />
the utilization <<strong>st</strong>rong>of</<strong>st</strong>rong> a mode<strong>st</strong> amount <<strong>st</strong>rong>of</<strong>st</strong>rong> fund balance.<br />
Some position reductions and other co<strong>st</strong>-cutting measures have taken place in FY 2011 for an e<strong>st</strong>imated<br />
savings <<strong>st</strong>rong>of</<strong>st</strong>rong> approximately $1.2 million, which has been designated to be carried over and used to help<br />
balance the FY12 <strong>budget</strong>.<br />
Fiscal Year 2012 10
Long Term Budget Goals<br />
City <<strong>st</strong>rong>of</<strong>st</strong>rong> St. Petersburg, Florida - FY 2012 Proposed Fiscal Plan<br />
St. Petersburg’s success in meeting the current revenue shortfall is enhanced by a continuing focus on<br />
organizational efficiencies that preserve levels <<strong>st</strong>rong>of</<strong>st</strong>rong> service by implementing su<strong>st</strong>ainable expenditure<br />
reductions, reduction <<strong>st</strong>rong>of</<strong>st</strong>rong> debt, and <strong>st</strong>rengthening <<strong>st</strong>rong>of</<strong>st</strong>rong> reserves. The specific <strong>st</strong>rategies continue to be:<br />
Inve<strong>st</strong>ment <<strong>st</strong>rong>of</<strong>st</strong>rong> <strong>capital</strong> dollars in ways that reduce <strong>operating</strong> co<strong>st</strong>s:<br />
o Some <<strong>st</strong>rong>of</<strong>st</strong>rong> the initiatives undertaken include: inve<strong>st</strong>ing in more energy efficient <strong>st</strong>reet<br />
lighting, traffic signals, HVAC sy<strong>st</strong>ems, and energy conservation and auditing programs;<br />
sub<strong>st</strong>antial inve<strong>st</strong>ments have been made for efficiency enhancing technology improvements<br />
such as the CAD/RMS sy<strong>st</strong>em in Police, the Oracle Financial Management sy<strong>st</strong>em, the<br />
CMMS sy<strong>st</strong>em in Water Resources, and the TeleStaff scheduling sy<strong>st</strong>em.<br />
o In future years, more hybrid and alternative fuel vehicles will be considered as both a co<strong>st</strong>saving<br />
<strong>st</strong>rategy and a means to protect the environment.<br />
Implementing su<strong>st</strong>ainable expenditure reductions:<br />
o As a general policy, the <strong>budget</strong> has been prepared considering a multi-year approach so that<br />
use <<strong>st</strong>rong>of</<strong>st</strong>rong> one-time funds will not result in a sub<strong>st</strong>antial hardship for future <strong>budget</strong> years.<br />
o Fund balance has been used selectively for FY12 where appropriate and in some cases<br />
expense deferrals and other one-time amounts have been used to assi<strong>st</strong> in balancing the<br />
<strong>budget</strong>. These one-time sources total less than $4 million, are less than the amount used in<br />
FY11 and will not negatively impact the e<strong>st</strong>ablished reserve targets. The recommended use<br />
<<strong>st</strong>rong>of</<strong>st</strong>rong> General Fund designated fund balance is $400,000.<br />
Budget Summary<br />
The result <<strong>st</strong>rong>of</<strong>st</strong>rong> all <<strong>st</strong>rong>of</<strong>st</strong>rong> these efforts is tax relief for St. Petersburg citizens while maintaining a superior level<br />
<<strong>st</strong>rong>of</<strong>st</strong>rong> service:<br />
Since FY01, the millage rate has been reduced five times, from a rate <<strong>st</strong>rong>of</<strong>st</strong>rong> 7.2903 mills to its current<br />
level <<strong>st</strong>rong>of</<strong>st</strong>rong> 5.9125 mills.<br />
The FY12 millage rate will remain at 5.9125 mills despite the severe drop in property values and<br />
resulting loss <<strong>st</strong>rong>of</<strong>st</strong>rong> tax revenue in the General Fund.<br />
The following charts clearly show the results <<strong>st</strong>rong>of</<strong>st</strong>rong> our efforts in controlling personnel co<strong>st</strong>s<br />
compared to those <<strong>st</strong>rong>of</<strong>st</strong>rong> other Florida cities.<br />
Fiscal Year 2012 11
City <<strong>st</strong>rong>of</<strong>st</strong>rong> St. Petersburg, Florida - FY 2012 Proposed Fiscal Plan<br />
FLORIDA’S LARGE CITIES - PERSONNEL TRENDS FY 2001 – 2011<br />
The following charts depict the personnel trends <<strong>st</strong>rong>of</<strong>st</strong>rong> Florida’s five large<strong>st</strong> cities. St. Petersburg<br />
far exceeds its comparable cities, shown on the next page, in its efforts to reduce personnel<br />
over the pa<strong>st</strong> ten years and thereby reduce the recurring co<strong>st</strong>s associated with wages.<br />
3,100<br />
City <<strong>st</strong>rong>of</<strong>st</strong>rong> St. Petersburg<br />
3,050<br />
3,000<br />
2,950<br />
3,043<br />
3,063<br />
3,000<br />
3,006<br />
2,993<br />
2,974<br />
2,986<br />
# Full-Time Positions<br />
2,900<br />
2,850<br />
2,800<br />
2,911<br />
2,860<br />
2,750<br />
2,745<br />
2,733<br />
2692<br />
2,700<br />
2,650<br />
Fiscal Year 2012 12
City <<strong>st</strong>rong>of</<strong>st</strong>rong> St. Petersburg, Florida - FY 2012 Proposed Fiscal Plan<br />
St. Petersburg’s Comparable Florida Cities<br />
PERSONNEL TRENDS FY 2001 – 2011<br />
(City Names Have Been Intentionally Omitted)<br />
8,400<br />
5,100<br />
# Positions<br />
8,200<br />
8,000<br />
7,800<br />
7,600<br />
7,400<br />
7,200<br />
7,000<br />
7,581<br />
7,394<br />
7,129<br />
7,027<br />
8,259<br />
8,019 8,062<br />
8,008<br />
7,857 7,934 7,959<br />
# Positions<br />
5,000<br />
4,900<br />
4,800<br />
4,700<br />
4,600<br />
4,500<br />
4,583<br />
4,690<br />
4,794<br />
4,873<br />
4,958<br />
4,935<br />
5,042<br />
4,767<br />
4,660<br />
4,521<br />
6,800<br />
4,400<br />
4,416<br />
3,500<br />
2,750<br />
3,450<br />
3,400<br />
3,439<br />
3,412<br />
2,700<br />
2,696<br />
2,681<br />
# Positions<br />
3,350<br />
3,300<br />
3,250<br />
3,200<br />
3,282<br />
3,214<br />
3,350<br />
3,211<br />
# Positions<br />
2,650<br />
2,600<br />
2,631<br />
2,667<br />
2,653<br />
2,661<br />
2,647<br />
2,595<br />
3,150<br />
3,121 3,135<br />
3,153<br />
2,570<br />
2,565<br />
3,100<br />
3,050<br />
3,000<br />
3,095<br />
3,019<br />
2,550<br />
2,500<br />
2,509<br />
Fiscal Year 2012 13
City <<strong>st</strong>rong>of</<strong>st</strong>rong> St. Petersburg, Florida - FY 2012 Proposed Fiscal Plan<br />
Some <<strong>st</strong>rong>of</<strong>st</strong>rong> the highlights <<strong>st</strong>rong>of</<strong>st</strong>rong> the FY12 General Fund <strong>budget</strong> are:<br />
Property tax revenue declining by $4.8 million.<br />
No reduction in sworn police personnel for the FY12 <strong>budget</strong> and no reduction <<strong>st</strong>rong>of</<strong>st</strong>rong> uniformed<br />
positions in the Fire Department.<br />
Reduction <<strong>st</strong>rong>of</<strong>st</strong>rong> 41 full-time positions in other departments.<br />
Funding for the arts, culture, and human services has remained at the FY11 level with no<br />
reductions. New funding provided ($500,000 <<strong>st</strong>rong>city</<strong>st</strong>rong> match) for a youth services program in<br />
partnership with the Juvenile Welfare Board.<br />
All neighborhood pools, parks, recreation centers and libraries will remain open; revised fee<br />
schedules will be implemented to increase revenue where appropriate.<br />
City employee health insurance co<strong>st</strong> increases have been reduced due to the decision to go<br />
self-funded.<br />
All <<strong>st</strong>rong>city</<strong>st</strong>rong> departments contributed toward the effort <<strong>st</strong>rong>of</<strong>st</strong>rong> balancing the FY12 <strong>budget</strong>. Consolidation and<br />
<strong>st</strong>reamlining resulted in the elimination <<strong>st</strong>rong>of</<strong>st</strong>rong> a number <<strong>st</strong>rong>of</<strong>st</strong>rong> management positions, with the associated<br />
co<strong>st</strong> savings helping to eliminate the $13 million deficit. In summary, the deficit was cured by using<br />
the following <strong>st</strong>rategies:<br />
Position eliminations and the expectation <<strong>st</strong>rong>of</<strong>st</strong>rong> holding positions open or eliminating them as<br />
they become vacant. The focus was on elimination <<strong>st</strong>rong>of</<strong>st</strong>rong> management positions.<br />
Conversion <<strong>st</strong>rong>of</<strong>st</strong>rong> the health insurance plan to self-funded <strong>st</strong>atus.<br />
Pension co<strong>st</strong>s for Police and Fire decreased based on actuarial projections.<br />
Commodities purchases were kept under a 2% increase from the prior year.<br />
Capital outlay (equipment) was reduced from the prior year.<br />
Transfers out to other funds were decreased.<br />
Property tax revenue reduction was not as much as originally projected, based on a smaller<br />
decline in property values than was expected.<br />
Revenue increased from miscellaneous fee increases in a number <<strong>st</strong>rong>of</<strong>st</strong>rong> departments and from<br />
the traffic intersection safety program.<br />
Transfers in from other funds were increased to utilize remaining balances in the Excise Tax<br />
Special Revenue Fund and increased revenues in the Parking Fund.<br />
Savings from mid-year FY11 cuts ($1.2 million) will be carried over to FY12.<br />
Use <<strong>st</strong>rong>of</<strong>st</strong>rong> $400,000 from the FY10 designation earmarked to assi<strong>st</strong> with future <strong>budget</strong>s.<br />
The following ―General Fund Budget Summary‖ is provided to assi<strong>st</strong> the readers <<strong>st</strong>rong>of</<strong>st</strong>rong> this document<br />
with:<br />
(1) Explaining the changes in projected revenue and expense from the prior year that account for<br />
the preliminary deficit <<strong>st</strong>rong>of</<strong>st</strong>rong> $13 million, and<br />
(2) Detailing the adju<strong>st</strong>ments that are recommended in order to eliminate that deficit.<br />
(Please note that the information provided in the General Fund Budget Summary is to acquaint the reader<br />
with the reasons for the initial FY12 <strong>budget</strong> deficit and the adju<strong>st</strong>ments needed to erase that deficit).<br />
Fiscal Year 2012 14
City <<strong>st</strong>rong>of</<strong>st</strong>rong> St. Petersburg, Florida - FY 2012 Proposed Fiscal Plan<br />
FY12 GENERAL FUND - SUMMARY OF RECOMMENDED BUDGET ADJUSTMENTS<br />
Revenue<br />
Expenses<br />
Budget<br />
Surplus/<br />
(Deficit)<br />
FY11 Adopted Budget… 203,528,375 203,528,375 -<br />
Ad Valorem changes:<br />
A-1 Anticipated Change in Property Tax Revenue (Schedule A-1) (5,953,821)<br />
Preliminary Revenue and Expense Changes:<br />
B-1 Net, Non-Ad Valorem Revenue Adju<strong>st</strong>ments (Schedule B-1) (3,656,673)<br />
B-2 Net Expenditure Adju<strong>st</strong>ments Other Than Salary (Schedule B-2) 387,993<br />
B-3 Anticipated Salary & Benefit Related Increases (Schedule B-3) 2,936,828<br />
FY12 Preliminary Budget… 193,917,881 -4.7% 206,853,196 1.6% (12,935,315) -6.36%<br />
Recommended Adju<strong>st</strong>ments to Preliminary Budget<br />
(Refer to Schedule C)<br />
C-1 Salaries/Wages and Related Benefits - (5,487,300)<br />
C-2 Other Benefits (3,085,897)<br />
C-3 Contracted Services - 383,607<br />
C-4 Commodities Purchases - 238,690<br />
C-5 Capital Outlay Purchases - (153,018)<br />
C-6 Grants & Aid to Other Organizations - 396,687<br />
C-7 Transfers Out - (350,317)<br />
C-8 Contingency - 862,015<br />
C-9 Revenue Adju<strong>st</strong>ments 4,168,425 -<br />
C-10 Use <<strong>st</strong>rong>of</<strong>st</strong>rong> Fund Balance 1,571,357 -<br />
5,739,782 (7,195,533) 12,935,315 6.36%<br />
Recommended FY12 Budget After Adju<strong>st</strong>ments 199,657,663 -1.9% 199,657,663 -1.9% - 0.00%<br />
Footnotes<br />
A-1<br />
B-1<br />
B-2<br />
B-3<br />
C-1<br />
C-2<br />
C-3<br />
C-4<br />
C-5<br />
C-6<br />
C-7<br />
C-8<br />
C-9<br />
C-10<br />
Attached Schedule A-1: Property tax based on 5.9125 mills and a taxable property value reduction shown on Schedule A-1 (change is<br />
based on the prior year, certified taxable value at the time <<strong>st</strong>rong>of</<strong>st</strong>rong> the adopted <strong>budget</strong>).<br />
Attached Schedule B-1; non-ad valorem revenue, including fund balance hole.<br />
Attached Schedule B-2; expenditures other than salaries and wages, including increased fuel co<strong>st</strong>.<br />
Attached Schedule B-3; wage related expenditure adju<strong>st</strong>ments.<br />
Attached Schedule C; salary & wage adju<strong>st</strong>ments including position reductions and expected attrition.<br />
Attached Schedule C; employee benefits adju<strong>st</strong>ments including transition to health insurance self funding.<br />
Attached Schedule C; contractual services expenditures amount above e<strong>st</strong>imated 1% increase.<br />
Attached Schedule C; commodities expenditures amount above e<strong>st</strong>imated 1% increase.<br />
Attached Schedule C; <strong>capital</strong> outlay for equipment & library books decreased.<br />
Attached Schedule C; grants and aid to other governments - reduced Weed & Seed and increased JWB youth services.<br />
Attached Schedule C; transfers out reduced for Mahaffey, Tropicana Field, Port and TIF di<strong>st</strong>ricts.<br />
Attached Schedule C; contingency increased to include wage <strong>st</strong>eps for Police & Fire.<br />
Attached Schedule C; revenue adju<strong>st</strong>ments including ad valorem taxes and other revenues.<br />
Attached Schedule C; use <<strong>st</strong>rong>of</<strong>st</strong>rong> fund balance from FY11 savings and $400,000 general fund designation.<br />
Fiscal Year 2012 15
City <<strong>st</strong>rong>of</<strong>st</strong>rong> St. Petersburg, Florida - FY 2012 Proposed Fiscal Plan<br />
SCHEDULE A-1<br />
Comparison <<strong>st</strong>rong>of</<strong>st</strong>rong> FY12 to FY11 Property Taxes<br />
FY11<br />
Change In<br />
Taxable Value FY12 Difference<br />
- City E<strong>st</strong>imated FY12 Values -<br />
Compared to Prelim 2011 Taxable Value<br />
Taxable Value 13,111,832,779 -8.00000000% 12,062,886,157<br />
Tax Rate 5.9125 5.9125<br />
Gross Property Tax 77,523,711 71,321,814<br />
Multiplier 0.96 0.96<br />
Property Tax Levied 74,422,763 68,468,942 (5,953,821)<br />
- Appraiser FY12 Values -<br />
Compared to Prelim 2011 Taxable Value<br />
Taxable Value 13,111,832,779 -6.45838471% 12,265,020,175 (846,812,604)<br />
Tax Rate 5.9125 5.9125 -<br />
Gross Property Tax 77,523,711 72,516,932 (5,006,780)<br />
Multiplier 0.96 0.96 0.96<br />
Property Tax Levied 74,422,763 69,616,255 (4,806,508)<br />
Compared to Final 2011 Taxable Value<br />
Taxable Value 13,067,079,244 -6.13801335% 12,265,020,175 (802,059,069)<br />
Tax Rate 5.9125 5.9125 -<br />
Gross Property Tax 77,259,106 72,516,932 (4,742,174)<br />
Multiplier 0.96 0.96 -<br />
Property Tax Levied 74,168,742 69,616,255 (4,552,487)<br />
Value <<strong>st</strong>rong>of</<strong>st</strong>rong> 1 Mil 11,774,419<br />
Fiscal Year 2012 16
City <<strong>st</strong>rong>of</<strong>st</strong>rong> St. Petersburg, Florida - FY 2012 Proposed Fiscal Plan<br />
SCHEDULE B-1<br />
FY12 Net Non-Ad Valorem Revenue Adju<strong>st</strong>ments - Preliminary Budget<br />
(Before Budget Balancing Adju<strong>st</strong>ments)<br />
Taxes & Other Transfers In:<br />
Increase Decrease Net<br />
A Utility Services Tax (202,928)<br />
B Franchise Tax - Electric & Gas - (53,740)<br />
C Excise Tax/Touri<strong>st</strong> Development Tax - (231,130)<br />
D Local Option Tax - (53,144)<br />
E Other Transfers In (100,000)<br />
Subtotal - (640,942)<br />
Intergovernmental:<br />
F Grants & revenue Sharing 231,627<br />
Subtotal 231,627 -<br />
Other Revenue:<br />
G Charges, Fines, Forfeits, etc. 500,000 -<br />
H Inve<strong>st</strong>ment Earnings - (831,828)<br />
I G&A, Pilot, Prior use <<strong>st</strong>rong>of</<strong>st</strong>rong> fund bal,Misc. - (2,915,530)<br />
Subtotal 500,000 (3,747,358)<br />
Grand Total Non-Ad Valorem Revenue Changes 731,627 (4,388,300) (3,656,673)<br />
Notes:<br />
A<br />
B<br />
C<br />
D<br />
E<br />
F<br />
G<br />
H<br />
I<br />
For the recommended <strong>budget</strong> revenue was projected based on the available information at the time. Subsequent<br />
revisions to the e<strong>st</strong>imates will be included in the Mayor's recommended <strong>budget</strong> and appear in Schedule C.<br />
Same as Note A.<br />
Same as Note A.<br />
Same as Note A.<br />
Transfers in from the Information and Communications Services fund are reduced by $100,000 (to $200,000) in<br />
accordance with a plan e<strong>st</strong>ablished in the FY10 <strong>budget</strong> to use ICS fund balance for General Fund <strong>capital</strong> outlay<br />
purchases. The amount is to be reduced each year until the total transferred amount has reached $1 million.<br />
An increase in <strong>st</strong>ate sales tax is projected by the <strong>st</strong>ate; this is the portion shared with the <<strong>st</strong>rong>city</<strong>st</strong>rong>.<br />
FY11 shared revenue FY11 <strong>budget</strong> 4,900,095 x 4.727% 231,627<br />
Service and fee increases as shown below:<br />
Traffic intersection safety program revenue increase 500,000<br />
500,000<br />
Inve<strong>st</strong>ment income.<br />
Intere<strong>st</strong> Income FY11 <strong>budget</strong> 1,380,000 1,380,000<br />
FY12 <strong>budget</strong> -60.28% (831,828)<br />
Miscellaneous revenue:<br />
548,172<br />
Progress Energy audit finding(utility taxes) 300,000<br />
Use <<strong>st</strong>rong>of</<strong>st</strong>rong> fund balance from FY10 creates deficit for FY11 (3,215,530)<br />
(2,915,530)<br />
Fiscal Year 2012 17
City <<strong>st</strong>rong>of</<strong>st</strong>rong> St. Petersburg, Florida - FY 2012 Proposed Fiscal Plan<br />
SCHEDULE B-2<br />
FY12 Net Expenditure Adju<strong>st</strong>ments Other Than Personal Services - Preliminary Budget<br />
(Before Budget Balancing Adju<strong>st</strong>ments)<br />
Increase Decrease Net<br />
Services and Commodities:<br />
A Services & Commodities 387,993 -<br />
Sub-Total Services and Commodities 387,993 - 387,993<br />
Notes:<br />
A Base <strong>budget</strong> increases for Fuel (gasoline), uniforms, internal insurance charges; partially <<strong>st</strong>rong>of</<strong>st</strong>rong>fset by<br />
reductions in billing & collections charges, project burden, PC/radio replacement, internal insurance claims.<br />
FY11 services & Commodities 38,799,340<br />
Multiplied by inflation rate 1.000%<br />
387,993<br />
Fiscal Year 2012 18
City <<strong>st</strong>rong>of</<strong>st</strong>rong> St. Petersburg, Florida - FY 2012 Proposed Fiscal Plan<br />
SCHEDULE B-3<br />
FY12 Net Expenditure Adju<strong>st</strong>ments for Personal Services - Preliminary Budget<br />
(Before Budget Balancing Adju<strong>st</strong>ments)<br />
Increase Decrease Net<br />
Salary and Benefit Adju<strong>st</strong>ments:<br />
A Re<strong>st</strong>ore 2.5% cut to Management, Pr<<strong>st</strong>rong>of</<strong>st</strong>rong>essional 750,550 - 750,550<br />
A and Supervisory employees -<br />
A Fire Supervisor's Union - 4% <strong>st</strong>ep 20,499 20,499<br />
A Firefighter's Union - 4% <strong>st</strong>ep 112,732 112,732<br />
A Police Non-sworn/PBA (forensic/latent techs) - 3.5% <strong>st</strong>ep 8,897 8,897<br />
A Police Officers - 3.5% <strong>st</strong>ep 412,619 412,619<br />
A Police Sergeants & Lieutenants - 3.5% <strong>st</strong>ep 40,975 40,975<br />
A COPS grant buildup 180,000 180,000<br />
B Health Insurance 1,410,556 - 1,410,556<br />
2,936,828 - 2,936,828<br />
Notes:<br />
A<br />
Wage and salary increases <<strong>st</strong>rong>of</<strong>st</strong>rong> 2.5% for those employees reduced by 2.5% in 2009, merits and <strong>st</strong>eps for public safety<br />
(except management). Also included is an additional $180,000 to prepare the <<strong>st</strong>rong>city</<strong>st</strong>rong> for funding <<strong>st</strong>rong>of</<strong>st</strong>rong> police <<strong>st</strong>rong>of</<strong>st</strong>rong>ficer positions<br />
when the COPS grant expires in 2013.<br />
B<br />
Health insurance co<strong>st</strong> changes (employer portion)<br />
E<strong>st</strong>imated co<strong>st</strong> to renew with United Healthcare 15,232,556<br />
FY11 Budget (13,822,000)<br />
Difference 1,410,556<br />
Fiscal Year 2012 19
City <<strong>st</strong>rong>of</<strong>st</strong>rong> St. Petersburg, Florida - FY 2012 Proposed Fiscal Plan<br />
SCHEDULE C<br />
Recommended adju<strong>st</strong>ments to eliminate 2012 <strong>budget</strong> deficit<br />
(Amounts in brackets indicate reductions)<br />
Revenue Expense<br />
Net Deficit<br />
Reduction<br />
C-1 Wage and Salary Adju<strong>st</strong>ments - (5,487,300)<br />
C-2 Benefits Adju<strong>st</strong>ments (3,085,897)<br />
C-3 Contractual Services Adju<strong>st</strong>ments - 383,607<br />
C-4 Commodities' Adju<strong>st</strong>ments - 238,690<br />
C-5 Capital Outlay Adju<strong>st</strong>ments - (153,018)<br />
C-6 Grants & Aid to Other Organizations Adju<strong>st</strong>ments - 396,687<br />
C-7 Transfers Out Adju<strong>st</strong>ments - (350,317)<br />
C-8 Contingency Adju<strong>st</strong>ments - 862,015<br />
C-9 Revenue Adju<strong>st</strong>ments 4,168,425 -<br />
C-10 Use <<strong>st</strong>rong>of</<strong>st</strong>rong> Fund Balance Adju<strong>st</strong>ments 1,571,357 -<br />
5,739,782 (7,195,533) 12,935,315<br />
Notes:<br />
C-1 Wages<br />
Eliminate mgmt increases and move Police & Fire <strong>st</strong>eps and COPS buildup to contingency (1,526,272)<br />
Wage reductions from FY11 <strong>budget</strong>ed amount (<strong>budget</strong>ed position reductions & expected attrition) (3,961,028)<br />
(5,487,300)<br />
C-2 Benefits<br />
Reduce health insurance co<strong>st</strong> increase by becoming self-funded (1,410,556)<br />
Other benefit reductions from FY11 level (primarily pension) (1,675,341)<br />
(3,085,897)<br />
C-3 Contractual Services (inflationary increases) 383,607<br />
C-4 Commodities<br />
Expected increase over FY11 amount included in $13 million deficit (387,993)<br />
Actual increase from FY11 <strong>budget</strong>ed amount (inflationary increase) 626,683<br />
238,690<br />
C-5 Capital Outlay (library books and equipment) (153,018)<br />
C-6 Grants & Aid to Other Organizations<br />
JWB youth services partnership (<<strong>st</strong>rong>city</<strong>st</strong>rong> match) 500,000<br />
Weed & Seed reduced, workforce readiness eliminated, misc. (103,313)<br />
396,687<br />
C-7 Transfers Out<br />
Bayboro harbor Tax Increment Di<strong>st</strong>rict (31,816)<br />
Intown We<strong>st</strong> Tax Increment Di<strong>st</strong>rict (63,942)<br />
Community Redevelopment Di<strong>st</strong>rict (40,534)<br />
FFGFC Loan (per repayment schedule) 7,310<br />
Mahaffey (new management agreement calls for reduced subsidy) (104,000)<br />
Pier (required to <<strong>st</strong>rong>of</<strong>st</strong>rong>fset use <<strong>st</strong>rong>of</<strong>st</strong>rong> fund balance in FY11) 153,000<br />
Coliseum (required to <<strong>st</strong>rong>of</<strong>st</strong>rong>fset use <<strong>st</strong>rong>of</<strong>st</strong>rong> fund balance in FY11) 25,000<br />
Sunken Gardens (required to <<strong>st</strong>rong>of</<strong>st</strong>rong>fset use <<strong>st</strong>rong>of</<strong>st</strong>rong> fund balance in FY11) 36,000<br />
Tropicana Field (increased naming rights and ticket revenue) (115,335)<br />
Port (216,000)<br />
(350,317)<br />
C-8 Contingency - Includes <strong>budget</strong> for Police & Fire <strong>st</strong>eps & COPS grant buildup 862,015<br />
C-9 Revenue adju<strong>st</strong>ments:<br />
Reverse original revenue losses included in $13 million gap 441,143<br />
Property Tax Adju<strong>st</strong>ment Based on County Appraiser e<strong>st</strong>imate Jun 1 1,147,313<br />
Franchise & Utility Tax Payments 7,332<br />
Licenses & Permits (misc fee increases) 357,560<br />
Intergovernmental Revenue (362,493)<br />
Charges for Services (misc fee increases) 324,412<br />
Fines & Forfeitures (red light camera revenue) 1,849,149<br />
Misc Revenues (loss <<strong>st</strong>rong>of</<strong>st</strong>rong> intere<strong>st</strong> revenue) (539,296)<br />
Transfer In (from Excise Tax fund & Parking Fund) 943,305<br />
4,168,425<br />
C-10 Use <<strong>st</strong>rong>of</<strong>st</strong>rong> fund balance and other reserves:<br />
FY11 Savings Carried Over 1,171,357<br />
Use <<strong>st</strong>rong>of</<strong>st</strong>rong> designated fund balance 400,000<br />
1,571,357<br />
Fiscal Year 2012 20
City <<strong>st</strong>rong>of</<strong>st</strong>rong> St. Petersburg, Florida - FY 2012 Proposed Fiscal Plan<br />
PERSONNEL OVERVIEW<br />
Note: As a result <<strong>st</strong>rong>of</<strong>st</strong>rong> the new <strong>budget</strong>ing s<<strong>st</strong>rong>of</<strong>st</strong>rong>tware implemented for the FY 2012<br />
<strong>budget</strong> process, positions are being counted differently throughout the years shown<br />
in the Position Summary report and throughout the <strong>budget</strong> book. FY 2009 Actual<br />
numbers represent the actual numbers published in the FY 2011 Adopted Budget.<br />
FY 2010 Actual numbers are from the Human Resources (HR) sy<strong>st</strong>em as <<strong>st</strong>rong>of</<strong>st</strong>rong><br />
September 2010. FY 2011 Adopted numbers are from the HR sy<strong>st</strong>em as <<strong>st</strong>rong>of</<strong>st</strong>rong><br />
February 2011. FY 2011 Amended numbers were taken from the HR sy<strong>st</strong>em in<br />
March 2011.<br />
Further, in all years except 2009 in the Position Summary and other position<br />
reports in the <strong>budget</strong> book, FTE represent how labor is di<strong>st</strong>ributed among<br />
departments and/or funds should a position split their time/billing. For example,<br />
Budget & Management and Audit split a full-time position in FY11 Adopted thus<br />
showing a decimal in the full-time count.<br />
Additionally, grant positions are included in the position count from FY 2010<br />
Actual on. And, part-time FTE calculations reflect actual hours worked in FY 2012<br />
Proposed but not prior unless a position’s time has been di<strong>st</strong>ributed (discussed<br />
above) among more than one department and/or fund.<br />
For FY12, health insurance co<strong>st</strong> increased only 0.9% over the FY11 <strong>budget</strong>. This very small<br />
increase was mainly due to the decision to become self-funded. Of the $228.548 million <strong>budget</strong>ed<br />
for salaries and benefits, employee health insurance co<strong>st</strong>s are $22.201 million. Pension co<strong>st</strong>s are<br />
determined by independent actuarial <strong>st</strong>udies. A portion <<strong>st</strong>rong>of</<strong>st</strong>rong> the analysis includes projection <<strong>st</strong>rong>of</<strong>st</strong>rong><br />
earnings on the assets <<strong>st</strong>rong>of</<strong>st</strong>rong> the individual pension funds using a four-year averaging methodology. For<br />
FY12, general employee pension co<strong>st</strong>s increased over the FY11 adopted <strong>budget</strong> by 0.2% and public<br />
safety pension co<strong>st</strong>s decreased 7.6% from FY11; these changes were based on the actuarial <strong>st</strong>udies.<br />
Fiscal Year 2012 21
City <<strong>st</strong>rong>of</<strong>st</strong>rong> St. Petersburg, Florida - FY 2012 Proposed Fiscal Plan<br />
Salaries and benefits make up 41% <<strong>st</strong>rong>of</<strong>st</strong>rong> the total <strong>operating</strong> <strong>budget</strong> and 72% <<strong>st</strong>rong>of</<strong>st</strong>rong> the General Fund<br />
<strong>budget</strong>. Due to the large co<strong>st</strong> for wages and benefits, one <<strong>st</strong>rong>of</<strong>st</strong>rong> our <strong>st</strong>rategic goals is to manage the<br />
growth <<strong>st</strong>rong>of</<strong>st</strong>rong> positions through the use <<strong>st</strong>rong>of</<strong>st</strong>rong> technology improvements, departmental consolidation and<br />
reorganization and other efficiency measures. This year the City will amend its workforce by<br />
eliminating 41 full-time and 18 part-time positions. Details <<strong>st</strong>rong>of</<strong>st</strong>rong> the reductions can be found on the<br />
individual department pages.<br />
RE-ORGANIZATIONS<br />
Reorganizations in FY 2011 include:<br />
The Community Enrichment Admini<strong>st</strong>ration has been eliminated with functional activities to<br />
be assumed by other <<strong>st</strong>rong>city</<strong>st</strong>rong> departments:<br />
‣ The Housing and Community Development Department will report to the Leisure &<br />
Community Services Admini<strong>st</strong>ration.<br />
‣ The Jame<strong>st</strong>own Housing Enterprise will become part <<strong>st</strong>rong>of</<strong>st</strong>rong> the Downtown Enterprise<br />
Facilities Department.<br />
‣ The Codes Compliance Assi<strong>st</strong>ance Department will report to City Development<br />
Admini<strong>st</strong>ration.<br />
‣ The Business Assi<strong>st</strong>ance Center will become part <<strong>st</strong>rong>of</<strong>st</strong>rong> the Economic Development<br />
Department.<br />
Reorganizations for FY 2012 include:<br />
The Internal Services Admini<strong>st</strong>ration will be eliminated with functional activities to be<br />
assumed by other <<strong>st</strong>rong>city</<strong>st</strong>rong> departments:<br />
‣ Billing & Collections, Human Resources and Information and Communications<br />
Services Departments will report to the City Admini<strong>st</strong>rator<br />
‣ City Clerk will report to the Mayor<br />
‣ Procurement & Supply Management Department will report to Public Works<br />
Admini<strong>st</strong>ration<br />
‣ Government Services Department will be eliminated and duties will be transferred to<br />
the new Education and Government Services Department (formerly called School<br />
Resources & Internship Department)<br />
‣ The Internal Services Admini<strong>st</strong>ration Department will be eliminated, two full-time<br />
<strong>st</strong>aff members will be transferred to the Downtown Enterprise Facilities Department<br />
Fiscal Year 2012 22
City <<strong>st</strong>rong>of</<strong>st</strong>rong> St. Petersburg, Florida - FY 2012 Proposed Fiscal Plan<br />
PERSONNEL RELATED COSTS HISTORY<br />
The charts below show <strong>budget</strong>ed salary & benefit co<strong>st</strong>s from FY04 through FY12. From the graph<br />
it can be seen that personnel related co<strong>st</strong>s escalated during the period from FY04 to FY08 and then<br />
leveled <<strong>st</strong>rong>of</<strong>st</strong>rong>f for the next three years. The <strong>budget</strong> for FY12 calls for a reduction in personnel related<br />
co<strong>st</strong> as a result <<strong>st</strong>rong>of</<strong>st</strong>rong> position eliminations, departmental reorganizations and a hiring freeze.<br />
From 2004 to 2012 personnel related co<strong>st</strong>s have increased by $24.478 million or 11.99%. This<br />
equals an average <<strong>st</strong>rong>of</<strong>st</strong>rong> 1.5% per year (uncompounded) for the eight year period ending in FY12.<br />
Note: the scale <<strong>st</strong>rong>of</<strong>st</strong>rong> the graph has been adju<strong>st</strong>ed to reflect a minimum amount <<strong>st</strong>rong>of</<strong>st</strong>rong> $180 million, rather<br />
than using a minimum <<strong>st</strong>rong>of</<strong>st</strong>rong> zero. This has the effect <<strong>st</strong>rong>of</<strong>st</strong>rong> accentuating the impact <<strong>st</strong>rong>of</<strong>st</strong>rong> the changes in co<strong>st</strong>s<br />
from year to year.<br />
FY<br />
Salary &<br />
Benefits<br />
(000s<br />
omitted)<br />
04 204,070<br />
05 213,498<br />
06 222,245<br />
07 231,767<br />
08 236,301<br />
09 232,719<br />
10 235,554<br />
11 234,669<br />
12 228,548<br />
Fiscal Year 2012 23
City <<strong>st</strong>rong>of</<strong>st</strong>rong> St. Petersburg, Florida - FY 2012 Proposed Fiscal Plan<br />
RATES AND FEES<br />
The ad valorem millage rate is <strong>proposed</strong> at the current rate <<strong>st</strong>rong>of</<strong>st</strong>rong> 5.9125 mills. The following increases<br />
in rates and fees have been <strong>proposed</strong> for FY12:<br />
2012 RATE INCREASES<br />
2012 FEE INCREASES<br />
DEPARTMENT<br />
FIRE<br />
Jame<strong>st</strong>own Rent Increase 3.0%<br />
Water, Sewer, Reclaimed 0.0%} A rate <strong>st</strong>udy is underway to determine<br />
Sanitation<br />
0.0%} any potential rate increase.<br />
Stormwater 0.0%}<br />
FEE NAME<br />
ORIGINAL<br />
FEE AMOUNT<br />
PROPOSED<br />
FEE AMOUNT<br />
% CHANGE*<br />
Pyrotechnics Permit 50.00 100.00 100.00%<br />
Plans Revision 1 0.00 12.23<br />
Building Plans Review 55.00 75.00 36.36%<br />
Fire Codes Inspections 2 25.00 50.00 100.00%<br />
Fire Extinguisher Classes 0.00 130.00<br />
PARKS & REC<br />
CDL Te<strong>st</strong>ing 3 0.00 250.00<br />
Sunshine Center Fitness Center 4 0.00 1.00<br />
Sunshine Center Fitness Center 4 0.00 12.00<br />
Co-Sponsored Events Maintenance. Staff<br />
Time 5 0.00 5,652.00<br />
Adult Sports Resident & Non-resident Fees 6 0.00 10.00<br />
Facility Rental Rates See Below See Below<br />
Park Permit Staff Co<strong>st</strong>s 7 0.00 15.00 - 20.00<br />
Transportation Surcharge for Van Field<br />
Trips 8 0.00 1.00<br />
Parking Meters at Albert Whitted Park 9 0.00 20,000.00<br />
Resident Card Fee 10.00 15.00 50.00%<br />
POLICE<br />
Security Alarm Renewal 10 10.00 20.00 100.00%<br />
Public Vehicle Permit 100.00 200.00 100.00%<br />
Driver Background Check 44.00 90.00 104.55%<br />
Fiscal Year 2012 24
City <<strong>st</strong>rong>of</<strong>st</strong>rong> St. Petersburg, Florida - FY 2012 Proposed Fiscal Plan<br />
DEPARTMENT<br />
FEE NAME<br />
ORIGINAL<br />
FEE AMOUNT<br />
PROPOSED<br />
FEE AMOUNT<br />
% CHANGE*<br />
PLANNING &<br />
ECO DEV<br />
Development Review Services<br />
Adult Use<br />
New Application 750.00 1,000.00 33.33%<br />
Renewal 100.00 150.00 50.00%<br />
Appeal<br />
Variance 30.00 250.00 733.33%<br />
Billboard, Digital (Compliance Review) 0.00 5,000.00<br />
Dog Dining Permit 0.00 10.00<br />
Driveway Permit 11 0.00 20.00<br />
Property Card Interp. (PCI)<br />
Within 2-5 days Inc. Fir<strong>st</strong> Hour <<strong>st</strong>rong>of</<strong>st</strong>rong> Research 50.00 60.00 20.00%<br />
Within 5-10 days 20.00 n/a<br />
Additional Time Billed in 1-Hour Increments 0.00 0.50<br />
Redevelopment Plan 200.00 500.00 150.00%<br />
Rein<strong>st</strong>atement<br />
Public Hearing 200.00 500.00 150.00%<br />
Site Plan Review<br />
General Application 500.00 1,000.00 100.00%<br />
Modification 250.00 500.00 100.00%<br />
Special Exception<br />
General Application 900.00 1,000.00 11.11%<br />
Modification 250.00 500.00 100.00%<br />
Street Closure<br />
Permanent 795.00 1,000.00 25.79%<br />
Temporary 795.00 1,000.00 25.79%<br />
Subdivision/Replat<br />
Variances 750.00 1,000.00 33.33%<br />
Temporary Parking Lots, Stadium and Non-<br />
Stadium<br />
Annual Renewal Per Lot 0.00 10.00<br />
Temporary Use Letter (No Bldg. Permit<br />
Required) 0.00 30.00<br />
Fiscal Year 2012 25
City <<strong>st</strong>rong>of</<strong>st</strong>rong> St. Petersburg, Florida - FY 2012 Proposed Fiscal Plan<br />
DEPARTMENT<br />
FEE NAME<br />
Vacation<br />
ORIGINAL<br />
FEE AMOUNT<br />
PROPOSED<br />
FEE AMOUNT<br />
% CHANGE*<br />
Air Rights 750.00 1,000.00 33.33%<br />
Easements 200.00 300.00 50.00%<br />
Pede<strong>st</strong>rian Walkway 300.00 400.00 33.33%<br />
Variance<br />
Docks 200.00 400.00 100.00%<br />
1 & 2-Unit (1<strong>st</strong> Variance) 125.00 300.00 140.00%<br />
1 & 2-Unit (Each Add. Variance) 10.00 100.00 900.00%<br />
3 or More Units & Non-Residential (1<strong>st</strong><br />
Variance) 200.00 300.00 50.00%<br />
3 or More Units & Non-Residential (Each<br />
Add. Variance) 30.00 100.00 233.33%<br />
Redevelopment Plan 50.00 100.00 100.00%<br />
Rein<strong>st</strong>atement 50.00 100.00 100.00%<br />
Signs 100.00 500.00 400.00%<br />
w / SE or SPR 75.00 200.00 166.67%<br />
Zoning Review <<strong>st</strong>rong>of</<strong>st</strong>rong> Bldg. Permit Applications<br />
Zoning and Comm. and Council (CPC, DRC, PVC) inc.<br />
Inspection 0.00 15.00<br />
Landscaping and Parking Paving inc.<br />
Inspection 0.00 25.00<br />
Signs 0.00 40.00<br />
Zoning (Verification and Rebuild) Letters<br />
Within 2-5 days 50.00 50.00 0.00%<br />
Within 5-10 days 20.00 n/a<br />
Urban Planning and Hi<strong>st</strong>oric Pres.<br />
After-the-Fact Applications Normal Fee Fees Double<br />
Certificate <<strong>st</strong>rong>of</<strong>st</strong>rong> Appropriateness (COA)<br />
COA < = $25,000<br />
Additions 0.00 n/a<br />
Appeal 100.00 n/a<br />
Alterations and Repair 0.00 n/a<br />
Inspections 0.00 n/a<br />
New Con<strong>st</strong>ruction 0.00 n/a<br />
Fiscal Year 2012 26
City <<strong>st</strong>rong>of</<strong>st</strong>rong> St. Petersburg, Florida - FY 2012 Proposed Fiscal Plan<br />
DEPARTMENT<br />
FEE NAME<br />
COA > $25,000<br />
ORIGINAL<br />
FEE AMOUNT<br />
PROPOSED<br />
FEE AMOUNT<br />
Additions 150.00 n/a<br />
Appeal 100.00 n/a<br />
Alterations and Repair 150.00 n/a<br />
Inspections 0.00 n/a<br />
New Con<strong>st</strong>ruction 150.00 n/a<br />
COA > Commission Review<br />
% CHANGE*<br />
Additions 150.00 300.00 100.00%<br />
Appeal 100.00 250.00 150.00%<br />
Alterations and Repair 150.00 300.00 100.00%<br />
Demolition (Primary) 150.00 1,000.00 566.67%<br />
Demolition (Accessory) 150.00 500.00 233.33%<br />
New Con<strong>st</strong>ruction 150.00 300.00 100.00%<br />
Relocation 150.00 500.00 233.33%<br />
COA > Staff Review<br />
General Application 0.00 50.00<br />
Appeal 100.00 250.00 150.00%<br />
Revision 0.00 1/2 Orig. Fee<br />
Extensions<br />
Staff 0.00 50.00<br />
Commission 0.00 250.00<br />
FEMA - Hi<strong>st</strong>oric Flood Info and Letter 0.00 20.00<br />
Hi<strong>st</strong>oric Designation<br />
3rd Party 200.00 1,000.00 400.00%<br />
Hi<strong>st</strong>oric Di<strong>st</strong>rict Designation<br />
Base Fee 0.00 200.00<br />
Plus Co<strong>st</strong> per Parcel 0.00 $10, $1,000 Max<br />
Hi<strong>st</strong>oric Plaque/Marker Approval 0.00 50.00<br />
Map Amendment<br />
Future Land Use and Re-Zoning 2,000.00 2,400.00 20.00%<br />
Transfer Development Rights 12 900.00 500.00 -44.44%<br />
GOLF COURSES<br />
18 hole Greens Fees - Mangrove (Winter) 32.00 33.00 3.13%<br />
Fiscal Year 2012 27
City <<strong>st</strong>rong>of</<strong>st</strong>rong> St. Petersburg, Florida - FY 2012 Proposed Fiscal Plan<br />
DEPARTMENT<br />
ORIGINAL<br />
FEE AMOUNT<br />
PROPOSED<br />
FEE AMOUNT<br />
FEE NAME<br />
% CHANGE*<br />
18 hole Greens Fees - Twin Brooks<br />
(Summer) 10.00 11.00 10.00%<br />
9 hole Greens Fees - Cypress Links (Winter) 10.00 11.00 10.00%<br />
9 hole Greens Fees - Cypress Links<br />
(Summer) 7.00 8.00 14.29%<br />
Golf Cart Fees at Cypress Links 4.00 4.50 12.50%<br />
PARKING FUND<br />
Parking Meter Rates 0.75 1.00 33.33%<br />
Red Zone Parking Tickets 30.00 35.00 16.67%<br />
Add Additional Parking Meters in Downtown 0.75 1.00 33.33%<br />
NOTES:<br />
FIRE<br />
Co<strong>st</strong>s based only upon salaries and benefits and do not include vehicles, vehicle maintenance and fuel,<br />
laptop and desktop computers, printers, cell and <<strong>st</strong>rong>of</<strong>st</strong>rong>fice phones, uniforms, code books, printing and<br />
mailing co<strong>st</strong>s, and admini<strong>st</strong>rative and technical support.<br />
1 $35 for fir<strong>st</strong> page in plan; $10 each additional page; 84 plans + 856 additional pages = $11,500/940 total<br />
pages = $12.23 per page average.<br />
2 Base fee increase; additional charges based on square feet unchanged; average increased co<strong>st</strong> per<br />
inspection, which may include a reinspection, is $79.17.<br />
PARKS & REC<br />
3 This is an internal charge only; put in place to recoup the co<strong>st</strong> <<strong>st</strong>rong>of</<strong>st</strong>rong> CDL te<strong>st</strong>ing.<br />
4 The fitness center is currently in place with a fee being charged that is not <strong>proposed</strong> to increase.<br />
5 This is only a philosophy change in billable hours for <strong>st</strong>aff who work on co-sponsored event work<br />
orders during their normal work week.<br />
6 With the merger <<strong>st</strong>rong>of</<strong>st</strong>rong> the Parks Department with the Recreation Department, these fees align those<br />
resident and non-resident adults participating in athletics with the children who already pay, as well as,<br />
with all <<strong>st</strong>rong>of</<strong>st</strong>rong> those on the Recreation side who already pay.<br />
7 This fee brings the Parks side into alignment with the Recreation side.<br />
8 This is a $1 per trip fee to <<strong>st</strong>rong>of</<strong>st</strong>rong>fset gas/maintenance when using the vans for field trips.<br />
9 These meters are already in place and were in<strong>st</strong>alled to deter those associated with the Dali from<br />
parking there for free and filling up the park lot.<br />
POLICE<br />
10 The security alarm fee is being increased to <<strong>st</strong>rong>of</<strong>st</strong>rong>fset some <<strong>st</strong>rong>of</<strong>st</strong>rong> the co<strong>st</strong>s the Police Department incurs when<br />
responding to the false alarms. The co<strong>st</strong> <<strong>st</strong>rong>of</<strong>st</strong>rong> unit <<strong>st</strong>rong>of</<strong>st</strong>rong> service provided is ju<strong>st</strong> an e<strong>st</strong>imate <<strong>st</strong>rong>of</<strong>st</strong>rong> co<strong>st</strong>, a <strong>st</strong>udy <<strong>st</strong>rong>of</<strong>st</strong>rong><br />
co<strong>st</strong>s has not been performed.<br />
Fiscal Year 2012 28
City <<strong>st</strong>rong>of</<strong>st</strong>rong> St. Petersburg, Florida - FY 2012 Proposed Fiscal Plan<br />
PLANNING &<br />
ECO DEV<br />
11 DRS issues driveway permit applications: however, the Engineering Dept. receives 100% <<strong>st</strong>rong>of</<strong>st</strong>rong> the $65<br />
permit fee. This proposal will increase the total co<strong>st</strong> <<strong>st</strong>rong>of</<strong>st</strong>rong> a driveway permit fee from $65 to $85.<br />
12 Proposed fee subject to approval <<strong>st</strong>rong>of</<strong>st</strong>rong> Hi<strong>st</strong>oric TDR recommendations within the CPC Hi<strong>st</strong>oric<br />
Preservation Subcommittee Report<br />
*<br />
New fees will not show percentage changes.<br />
2010/2011 FISCAL YEAR<br />
CITY OF ST. PETERSBURG PARKS & RECREATION DEPARTMENT<br />
FEE SCHEDULE<br />
FACILITY RENTALS AND FEES WILL BE BASED ON THE FOLLOWING:<br />
(Refer to separate rate sheet for Azalea, Bay Vi<strong>st</strong>a and pools)<br />
CATEGORY I<br />
Fee Waiver Event<br />
City approved Volunteer groups (i.e. Neighborhood Associations, other City Departments, Girl Scouts, Boy Scouts, Youth<br />
Sports or Crime Watch Organizations) and Pinellas County School Board groups in the ―Joint Use‖ agreement are eligible<br />
to have facility and equipment rental charges waived for events directly related to their primary purpose IF approved by<br />
the Parks & Recreation Director. Direct co<strong>st</strong>s will <strong>st</strong>ill apply (i.e. <strong>st</strong>aff, utilities, special equipment).<br />
CATEGORY II<br />
Public Service Event<br />
Any individual, group, or non-pr<<strong>st</strong>rong>of</<strong>st</strong>rong>it civic or charitable organization renting the facility for a public service event with no<br />
charge or donations solicited.*<br />
CATEGORY III<br />
Social, Meeting or Athletic Event<br />
Any individual, group, or religious organization renting the facility for a social, meeting, or athletic event. Any non-pr<<strong>st</strong>rong>of</<strong>st</strong>rong>it<br />
civic or charitable group renting the facility to gain monetary benefits.* (i.e., church services, birthday parties, showers, etc.)<br />
CATEGORY IV<br />
Business Event<br />
Any individual, commercial, or business group renting the facility to gain publi<<strong>st</strong>rong>city</<strong>st</strong>rong>, advertising or monetary benefits. (The<br />
City retains the option to charge 20% <<strong>st</strong>rong>of</<strong>st</strong>rong> the gross revenue collected in<strong>st</strong>ead <<strong>st</strong>rong>of</<strong>st</strong>rong> said fees whichever is greater.)*<br />
*Non-Resident or Non-City Groups will be charged $125 Non-Resident charge or $12.50 one month Non-Resident fee.<br />
RENTAL RATES: (Per Hour)<br />
MEETING ROOMS<br />
CATEGORY I II III IV NON-RESIDENT<br />
1-25<br />
26-50<br />
DIRECT<br />
COST<br />
$11<br />
17<br />
$17<br />
22<br />
$22<br />
27<br />
51-100 27 34 39<br />
101-150 39 44 49<br />
151-200 49 56 61<br />
GYMNASIUM<br />
$125 Annual Fee<br />
Or<br />
$12.50 / Month Fee<br />
CATEGORY I II III IV NON-RESIDENT<br />
ATHLETIC PRACTICE DIRECT $34 $39 $44 $125 Annual Fee<br />
ATHLETIC EVENT COST 56 61 66<br />
Or<br />
SPECIAL EVENT 61 66 71<br />
$12.50 / Month Fee<br />
Fiscal Year 2012 29
City <<strong>st</strong>rong>of</<strong>st</strong>rong> St. Petersburg, Florida - FY 2012 Proposed Fiscal Plan<br />
Athletic Practice - Facility use where no score is kept, uniforms are not required and <<strong>st</strong>rong>of</<strong>st</strong>rong>ficials are not utilized.<br />
Other than parents <<strong>st</strong>rong>of</<strong>st</strong>rong> participants, spectators are not anticipated.<br />
Athletic Event - Facility use where score is kept, uniforms are required and <<strong>st</strong>rong>of</<strong>st</strong>rong>ficials are utilized. Spectators are<br />
anticipated to attend.<br />
Special Event - All other facility usage. Events may be athletic in nature, but have an intrinsic spectator<br />
entertainment quality.<br />
Application Fee Deposits are required as follows for all rentals.<br />
Application Fee Deposit: 1 - 50 people: $25 51 or greater: $50<br />
Non-refundable application fee deposits are required for all rentals at time <<strong>st</strong>rong>of</<strong>st</strong>rong> application and will be applied toward<br />
the co<strong>st</strong> <<strong>st</strong>rong>of</<strong>st</strong>rong> the rental. If event is cancelled by the user the fee is non-refundable. If co<strong>st</strong> <<strong>st</strong>rong>of</<strong>st</strong>rong> rental is less than<br />
application fee deposit, the full rental fee will be due at the time <<strong>st</strong>rong>of</<strong>st</strong>rong> application and will be non-refundable.<br />
Non-<strong>operating</strong> hour rentals / Holiday Rates: $20 per hour additional <strong>operating</strong> fees applicable to each rental;<br />
minimum 2 hour rental. $30/hour <strong>st</strong>aff fees on holidays.<br />
Additional <strong>st</strong>aff: If required (i.e. size <<strong>st</strong>rong>of</<strong>st</strong>rong> group 101 or more, special setup, event open to public) $20/hour per <strong>st</strong>aff<br />
person.<br />
2011/2012 FISCAL YEAR<br />
CITY OF ST. PETERSBURG PARKS & RECREATION DEPARTMENT<br />
FEE SCHEDULE<br />
FACILITY RENTALS AND FEES WILL BE BASED ON THE FOLLOWING:<br />
(Refer to separate rate sheet for Azalea, Bay Vi<strong>st</strong>a and pools)<br />
CATEGORY I<br />
Fee Waiver Event<br />
City approved Volunteer groups (i.e. Neighborhood Associations, other City Departments, Girl Scouts, Boy Scouts, Youth<br />
Sports or Crime Watch Organizations) and Pinellas County School Board groups in the ―Joint Use‖ agreement are eligible<br />
to have facility and equipment rental charges waived for events directly related to their primary purpose IF approved by<br />
the Parks & Recreation Director. Direct co<strong>st</strong>s will <strong>st</strong>ill apply (i.e. <strong>st</strong>aff, utilities, special equipment).<br />
CATEGORY II<br />
Public Service Event<br />
Any individual, group, or non-pr<<strong>st</strong>rong>of</<strong>st</strong>rong>it civic or charitable organization renting the facility for a public service event with no<br />
charge or donations solicited.*<br />
CATEGORY III<br />
Social, Meeting or Athletic Event<br />
Any individual, group, or religious organization renting the facility for a social, meeting, or athletic event. Any non-pr<<strong>st</strong>rong>of</<strong>st</strong>rong>it<br />
civic or charitable group renting the facility to gain monetary benefits.* (i.e., church services, birthday parties, showers, etc.)<br />
CATEGORY IV<br />
Business Event<br />
Any individual, commercial, or business group renting the facility to gain publi<<strong>st</strong>rong>city</<strong>st</strong>rong>, advertising or monetary benefits. (The<br />
City retains the option to charge 20% <<strong>st</strong>rong>of</<strong>st</strong>rong> the gross revenue collected in<strong>st</strong>ead <<strong>st</strong>rong>of</<strong>st</strong>rong> said fees whichever is greater.)*<br />
*Non-Resident or Non-City Groups will be charged $125 Non-Resident charge or $12.50 one month Non-Resident fee.<br />
RENTAL RATES: (Per Hour)<br />
MEETING ROOMS<br />
CATEGORY I II III IV NON-RESIDENT<br />
1-25<br />
26-50<br />
DIRECT<br />
COST<br />
$12<br />
19<br />
$18<br />
24<br />
$24<br />
30<br />
51-100 30 37 43<br />
101-150 43 48 54<br />
151-200 54 61 67<br />
$125 Annual Fee<br />
Or<br />
$12.50 / Month Fee<br />
Fiscal Year 2012 30
City <<strong>st</strong>rong>of</<strong>st</strong>rong> St. Petersburg, Florida - FY 2012 Proposed Fiscal Plan<br />
GYMNASIUM<br />
CATEGORY I II III IV NON-RESIDENT<br />
ATHLETIC PRACTICE DIRECT $37 $43 $48 $125 Annual Fee<br />
ATHLETIC EVENT COST 62 67 73<br />
Or<br />
SPECIAL EVENT 67 73 78<br />
$12.50 / Month Fee<br />
Athletic Practice - Facility use where no score is kept, uniforms are not required and <<strong>st</strong>rong>of</<strong>st</strong>rong>ficials are not utilized.<br />
Other than parents <<strong>st</strong>rong>of</<strong>st</strong>rong> participants, spectators are not anticipated.<br />
Athletic Event - Facility use where score is kept, uniforms are required and <<strong>st</strong>rong>of</<strong>st</strong>rong>ficials are utilized. Spectators are<br />
anticipated to attend.<br />
Special Event - All other facility usage. Events may be athletic in nature, but have an intrinsic spectator<br />
entertainment quality.<br />
Application Fee Deposits are required as follows for all rentals.<br />
Application Fee Deposit: 1 - 50 people: $25 51 or greater: $50<br />
Non-refundable application fee deposits are required for all rentals at time <<strong>st</strong>rong>of</<strong>st</strong>rong> application and will be applied toward<br />
the co<strong>st</strong> <<strong>st</strong>rong>of</<strong>st</strong>rong> the rental. If event is cancelled by the user the fee is non-refundable. If co<strong>st</strong> <<strong>st</strong>rong>of</<strong>st</strong>rong> rental is less than<br />
application fee deposit, the full rental fee will be due at the time <<strong>st</strong>rong>of</<strong>st</strong>rong> application and will be non-refundable.<br />
Non-<strong>operating</strong> hour rentals / Holiday Rates: $20 per hour additional <strong>operating</strong> fees applicable to each rental;<br />
minimum 2 hour rental. $30/hour <strong>st</strong>aff fees on holidays.<br />
Additional <strong>st</strong>aff: If required (i.e. size <<strong>st</strong>rong>of</<strong>st</strong>rong> group 101 or more, special setup, event open to public) $20/hour per <strong>st</strong>aff<br />
person.<br />
Fiscal Year 2012 31
City <<strong>st</strong>rong>of</<strong>st</strong>rong> St. Petersburg, Florida - FY 2012 Proposed Fiscal Plan<br />
GENERAL FUND OVERVIEW<br />
GENERAL FUND: The General Fund is the <strong>operating</strong> fund for general government operations including<br />
Police, Fire, Parks and Recreation, Codes, etc. It is the only fund supported by ad valorem tax revenue. Ad<br />
Valorem Tax ($69.616 million) revenue represents the large<strong>st</strong> single source <<strong>st</strong>rong>of</<strong>st</strong>rong> General Fund revenue. Other<br />
taxes, including Utility Taxes (Electri<<strong>st</strong>rong>city</<strong>st</strong>rong>, Water, Sewer, Communications, etc.), Gas Tax, Franchise Tax<br />
and others, represent slightly more revenue at $60.057 million. Other revenue - including admini<strong>st</strong>rative<br />
overhead, Payment in Lieu <<strong>st</strong>rong>of</<strong>st</strong>rong> Taxes, and transfers is the third large<strong>st</strong> source at $27.587 million or 14%.<br />
General Fund Revenue<br />
$198,086,306<br />
Intergovernmental<br />
11% Charges for Services<br />
5%<br />
Fines & Forfeitures<br />
2%<br />
Other Taxes<br />
30%<br />
Other<br />
14%<br />
Intere<strong>st</strong>/Misc<br />
3% G&A/PILOT<br />
12%<br />
Transfers<br />
2%<br />
Ad Valorem Taxes<br />
35%<br />
Fiscal Year 2012 32
City <<strong>st</strong>rong>of</<strong>st</strong>rong> St. Petersburg, Florida - FY 2012 Proposed Fiscal Plan<br />
REVENUE ASSUMPTIONS:<br />
Overall, General Fund revenues are foreca<strong>st</strong>ed conservatively as required by City policy and are<br />
expected to decrease 1.11% from FY11 due to the slowdown in the housing and consumer markets<br />
and the related decrease in sales and gas tax receipts. The large<strong>st</strong> decrease in revenue in the<br />
General Fund can be attributed to intere<strong>st</strong> earnings, as a result <<strong>st</strong>rong>of</<strong>st</strong>rong> maturing bond inve<strong>st</strong>ments that<br />
have been reinve<strong>st</strong>ed at lower rates.<br />
Ad valorem taxes are based on the certified tax assessment received from the Pinellas County<br />
Property Appraiser multiplied by the millage rate. The appraiser has determined that taxable<br />
property values in the <<strong>st</strong>rong>city</<strong>st</strong>rong> have declined 6.14% from the FY11 final certified value.<br />
Projected General Fund excise tax revenue is expected to decrease slightly compared to FY11.<br />
Statewide sales tax receipts were at record lows in FY09, due to the continued slowdown in the<br />
markets, and continued to decrease in both FY10 and FY11.<br />
Local option gas tax revenue is based on a county di<strong>st</strong>ribution formula which was revised in<br />
September 2007. FY12 gas tax revenues are projected to decrease 1.59% in FY12 when compared<br />
to the FY11 <strong>budget</strong>.<br />
State shared revenue, which comes from a variety <<strong>st</strong>rong>of</<strong>st</strong>rong> sources including sales tax, local fuel tax, and<br />
other <strong>st</strong>ate revenues, is projected to decrease less than one percent based on recent payments<br />
received from the <strong>st</strong>ate.<br />
A franchise fee <<strong>st</strong>rong>of</<strong>st</strong>rong> 6% is levied on a business’s (Progress Energy) gross receipts for the sale <<strong>st</strong>rong>of</<strong>st</strong>rong><br />
electri<<strong>st</strong>rong>city</<strong>st</strong>rong> within the City. This fee is to compensate the City for the use <<strong>st</strong>rong>of</<strong>st</strong>rong> its rights-<<strong>st</strong>rong>of</<strong>st</strong>rong>-way. The<br />
FY12 projected revenue is based on hi<strong>st</strong>orical receipts and information received from Progress<br />
Energy.<br />
NOTE: There is a line item on each <<strong>st</strong>rong>of</<strong>st</strong>rong> the department pages in the Revenue Sources section that<br />
shows the amount <<strong>st</strong>rong>of</<strong>st</strong>rong> the fund balance added to or used for each department. This will be identified<br />
in the revenue source section by the name <<strong>st</strong>rong>of</<strong>st</strong>rong> the fund. For example, in the Public Safety summary<br />
for FY12 it shows an amount <<strong>st</strong>rong>of</<strong>st</strong>rong> $79,801,449 for the General Fund. This is the amount <<strong>st</strong>rong>of</<strong>st</strong>rong> the General<br />
Fund balance that goes to support this function. In some funds the number will be a negative, which<br />
indicates the amount that is contributed to the fund balance as a result <<strong>st</strong>rong>of</<strong>st</strong>rong> <strong>budget</strong>ed revenues<br />
exceeding <strong>budget</strong>ed expenditures.<br />
Fiscal Year 2012 33
City <<strong>st</strong>rong>of</<strong>st</strong>rong> St. Petersburg, Florida - FY 2012 Proposed Fiscal Plan<br />
EXPENDITURES<br />
Public Safety makes up 58% <<strong>st</strong>rong>of</<strong>st</strong>rong> the expenses in the General Fund. Ad valorem taxes are earmarked to<br />
support the City <<strong>st</strong>rong>of</<strong>st</strong>rong> St. Petersburg Police and Fire departments. It is projected that in FY12, ad valorem<br />
taxes will cover approximately 59% <<strong>st</strong>rong>of</<strong>st</strong>rong> the co<strong>st</strong>s <<strong>st</strong>rong>of</<strong>st</strong>rong> these two departments. The re<strong>st</strong> <<strong>st</strong>rong>of</<strong>st</strong>rong> the co<strong>st</strong>s <<strong>st</strong>rong>of</<strong>st</strong>rong> the<br />
Police and Fire departments will be covered by other revenue in the General Fund.<br />
FY12 General Fund expenses total $199.658 million, which is a decrease <<strong>st</strong>rong>of</<strong>st</strong>rong> $3.87 million or 1.9%<br />
from the FY11 Adopted Budget.<br />
The following non-discretionary expenditure changes are those <<strong>st</strong>rong>city</<strong>st</strong>rong>wide expenses that individual<br />
departments could not control.<br />
Benefits changed in some cases because they are a percentage <<strong>st</strong>rong>of</<strong>st</strong>rong> salaries.<br />
Pensions are based on the late<strong>st</strong> actuarial <strong>st</strong>udies.<br />
Health insurance reflects an expected premium amount per covered employee.<br />
Utility co<strong>st</strong>s reflect projected savings from energy conservation.<br />
Transfers to other <strong>operating</strong> funds were reduced because <<strong>st</strong>rong>of</<strong>st</strong>rong> lower amounts needed<br />
for funds that are subsidized.<br />
Vehicle replacement charges are lower based on longer life <<strong>st</strong>rong>of</<strong>st</strong>rong> vehicles and fewer<br />
vehicles in the City’s fleet.<br />
Increased fuel co<strong>st</strong>s.<br />
Fiscal Year 2012 34
City <<strong>st</strong>rong>of</<strong>st</strong>rong> St. Petersburg, Florida - FY 2012 Proposed Fiscal Plan<br />
ENTERPRISE FUNDS OVERVIEW<br />
ENTERPRISE OPERATIONS: Enterprise funds operations provide services that are <<strong>st</strong>rong>of</<strong>st</strong>rong> benefit to<br />
specific individuals and therefore charge a fee to the individuals who receive the service. These<br />
operations may receive general government support, but are generally expected to cover all co<strong>st</strong>s <<strong>st</strong>rong>of</<strong>st</strong>rong><br />
operation, including <strong>capital</strong> co<strong>st</strong>s, through the fees that are charged for the service. The amounts<br />
shown in the chart below are for the enterprise <strong>operating</strong> funds only and do not include any associated<br />
reserve funds. In FY10, a number <<strong>st</strong>rong>of</<strong>st</strong>rong> Operating Special Revenue funds were reclassified as Enterprise<br />
Funds due to changes in accounting <strong>st</strong>andards. The funds reclassified were the Parking Special<br />
Revenue Fund, Mahaffey Theater, Pier, Coliseum, Sunken Gardens, and Tropicana Field Operating<br />
Funds.<br />
Actual<br />
Expense<br />
Enterprise Funds Hi<strong>st</strong>ory<br />
(000s Omitted)<br />
Actual<br />
Expense<br />
Actual<br />
Expense<br />
E<strong>st</strong>imate<br />
Expense<br />
Proposed<br />
Budget<br />
2008 2009 2010 2011 2012<br />
Water Resources $95,299 $96,186 $99,623 $100,178 $102,841<br />
Stormwater Utility 11,590 11,363 11,980 11,175 10,486<br />
Sanitation 39,823 39,434 38,912 38,235 38,537<br />
Others 8,626 10,791 24,014 23,686 23,660<br />
Enterprise Fund Expense Hi<strong>st</strong>ory<br />
(000s Omitted)<br />
$120,000<br />
$100,000<br />
2008<br />
$ Millions<br />
$80,000<br />
$60,000<br />
$40,000<br />
$20,000<br />
$0<br />
Water<br />
Resources<br />
Stormwater<br />
Utility<br />
Sanitation<br />
Others<br />
2009<br />
2010<br />
2011<br />
2012<br />
Fiscal Year 2012 35
City <<strong>st</strong>rong>of</<strong>st</strong>rong> St. Petersburg, Florida - FY 2012 Proposed Fiscal Plan<br />
WATER RESOURCES:<br />
A rate <strong>st</strong>udy is currently underway to determine any potential rate increases.<br />
In FY12, $1.5 million will be transferred to the Water Resources Operating Fund from the Water<br />
Rate Stabilization Fund (WRS Fund) to partially <<strong>st</strong>rong>of</<strong>st</strong>rong>fset the co<strong>st</strong> <<strong>st</strong>rong>of</<strong>st</strong>rong> operations. The WRS Fund was<br />
initially funded by the sale <<strong>st</strong>rong>of</<strong>st</strong>rong> well fields to Tampa Bay Water. Inve<strong>st</strong>ment earnings on proceeds<br />
from this sale are transferred annually for current operations.<br />
The Water Resources Fund will transfer $9.694 million to the General Fund for payment in lieu <<strong>st</strong>rong>of</<strong>st</strong>rong><br />
taxes.<br />
STORMWATER:<br />
Rate increases/decreases are usually equivalent to the previous fiscal year’s CPI 1.9%, but currently<br />
no rate adju<strong>st</strong>ment is included in the <strong>budget</strong>.<br />
The transfer to the CIP is $800,000.<br />
The Stormwater Utility Operating Fund will transfer $1.865 million to the General Fund for<br />
payment in lieu <<strong>st</strong>rong>of</<strong>st</strong>rong> taxes.<br />
SANITATION:<br />
A rate <strong>st</strong>udy is currently underway to determine any potential rate increase.<br />
A transfer <<strong>st</strong>rong>of</<strong>st</strong>rong> $2 million will be made to the Sanitation Equipment Replacement Fund.<br />
The Sanitation Fund will transfer $455,076 for return on equity and $2.567 million for payment in<br />
lieu <<strong>st</strong>rong>of</<strong>st</strong>rong> taxes to the General Fund.<br />
AIRPORT:<br />
In FY12, the Airport will not require a loan from the General Fund and it will pay back $50,000 to<br />
the General Fund.<br />
The Airport Fund will transfer $131,352 to the General Fund for payment in lieu <<strong>st</strong>rong>of</<strong>st</strong>rong> taxes.<br />
MARINA:<br />
No rate increase is included in the <strong>budget</strong>.<br />
The transfer to the Marina Capital Projects Fund is $105,000.<br />
The Marina Fund will transfer $310,000 for return on inve<strong>st</strong>ment and $112,608 for payment in lieu<br />
<<strong>st</strong>rong>of</<strong>st</strong>rong> taxes to the General Fund.<br />
GOLF COURSE:<br />
Rate increases include $1 increase in 18 hole green fees for Mangrove Bay and Twin Brooks and 9<br />
hole green fees at Cypress Links and $0.50 increase in electric golf cart fees at Cypress Links.<br />
This fund will transfer $54,828 to the General Fund for payment in lieu <<strong>st</strong>rong>of</<strong>st</strong>rong> taxes.<br />
JAMESTOWN:<br />
• There will be a 3% rent increase in FY12.<br />
• This fund will transfer $38,676 to the General Fund for payment in lieu <<strong>st</strong>rong>of</<strong>st</strong>rong> taxes.<br />
PORT:<br />
• Starting in FY12, the Port will no longer transfer funds to the General Fund for payment in lieu <<strong>st</strong>rong>of</<strong>st</strong>rong><br />
taxes since it is subsidized.<br />
PARKING:<br />
• This fund will transfer $404,580 for return on inve<strong>st</strong>ment and $90,420 for payment in lieu <<strong>st</strong>rong>of</<strong>st</strong>rong> taxes<br />
to the General Fund.<br />
• In FY12, parking meter rates will increase by $0.25 (from $0.75 to $1.00 per hour) and red zone<br />
parking tickets will increase by $5.00.<br />
Fiscal Year 2012 36
City <<strong>st</strong>rong>of</<strong>st</strong>rong> St. Petersburg, Florida - FY 2012 Proposed Fiscal Plan<br />
SUBSIDIES OVERVIEW<br />
In general, Enterprise Fund operations generate revenues which are expected to cover mo<strong>st</strong> <<strong>st</strong>rong>of</<strong>st</strong>rong> the co<strong>st</strong>s<br />
<<strong>st</strong>rong>of</<strong>st</strong>rong> the operation. Some Enterprise Funds are deemed to have public benefit in addition to the specific<br />
benefits to users and as such are provided with a subsidy from the General Fund to cover any shortfalls<br />
between the co<strong>st</strong> <<strong>st</strong>rong>of</<strong>st</strong>rong> operation and the revenue generated. Some <<strong>st</strong>rong>of</<strong>st</strong>rong> the enterprise funds, which are<br />
subsidized, were previously classified as special revenue funds prior to the implementation <<strong>st</strong>rong>of</<strong>st</strong>rong> GASB<br />
Statement #54. The charts that follow show the hi<strong>st</strong>orical and <strong>budget</strong>ed amounts <<strong>st</strong>rong>of</<strong>st</strong>rong> the subsidy for<br />
each <<strong>st</strong>rong>of</<strong>st</strong>rong> these operations.<br />
Subsidy Hi<strong>st</strong>ory<br />
2.0<br />
1.5<br />
$ Millions<br />
1.0<br />
0.5<br />
0.0<br />
2008 2009 2010 2011 2012<br />
Mahaffey Pier Tropicana Field Port Airport Others<br />
* ―Others‖ include Sunken Gardens, Jame<strong>st</strong>own, and the Coliseum.<br />
Subsidy Hi<strong>st</strong>ory<br />
(000s Omitted)<br />
Actual Actual Actual E<strong>st</strong>imated Proposed<br />
2008 2009 2010 2011 2012<br />
Mahaffey $1,030 $934 $966 $733 $670<br />
Pier 1,539 1,509 1,427 1,246 1,399<br />
Tropicana Field 1,662 1,566 1,102 1,365 1,250<br />
Port 405 469 508 425 271<br />
Airport (loans) 390 466 136 0 0<br />
Others 432 423 524 455 397<br />
*Sunken Gardens 241 230 222 227 202<br />
*Coliseum 191 193 232 228 201<br />
*Jame<strong>st</strong>own 0 0 70 0 0<br />
Total Subsidies 5,458 5,367 4,663 4,224 3,993<br />
Fiscal Year 2012 37
City <<strong>st</strong>rong>of</<strong>st</strong>rong> St. Petersburg, Florida - FY 2012 Proposed Fiscal Plan<br />
The General Fund has advanced the Airport funds, at times, for cash flow purposes. In FY09, the<br />
remaining airport debt was extinguished with funds from the Economic Stability Fund. In FY11, the<br />
Airport no longer required a loan from the General Fund and <strong>st</strong>arted to pay back the Economic Stability<br />
Fund and the General Fund. The Airport paid back $50,000 to the General Fund in FY11 and will pay<br />
back another $50,000 in FY12. The Port has also required an annual subsidy to su<strong>st</strong>ain operations.<br />
Future operations <<strong>st</strong>rong>of</<strong>st</strong>rong> the Port are currently being analyzed.<br />
CAPITAL IMPROVEMENT FUNDS AND CIP OVERVIEW<br />
The five year CIP totals $353.46 million. All funds are balanced in all years. Water Resources<br />
projects comprise more than 35% <<strong>st</strong>rong>of</<strong>st</strong>rong> the five year CIP. As indicated in the chart that follows, the FY12<br />
CIP is significantly higher than other years. This is primarily due to planned funding to address the<br />
future <<strong>st</strong>rong>of</<strong>st</strong>rong> the Pier ($45 million).<br />
$120,000<br />
CAPITAL IMPROVEMENTS PROGRAM<br />
5 YEAR PLAN<br />
(000s Omitted)<br />
$100,000<br />
$80,000<br />
$60,000<br />
$40,000<br />
$20,000<br />
$0<br />
FY 12 FY 13 FY 14 FY 15 FY 16<br />
Penny Funds Water Resources Other Funds<br />
The fir<strong>st</strong> year <<strong>st</strong>rong>of</<strong>st</strong>rong> the CIP is appropriated by Council as the FY12 Capital Projects Budget and is<br />
$111.96 million for all funds. The <strong>budget</strong> is shown by fund in the chart and table that follow. As<br />
indicated 51% <<strong>st</strong>rong>of</<strong>st</strong>rong> the <strong>budget</strong> is comprised <<strong>st</strong>rong>of</<strong>st</strong>rong> Water Resources projects and projects funded from the<br />
―Penny for Pinellas.‖ The remaining portion is comprised <<strong>st</strong>rong>of</<strong>st</strong>rong> a number <<strong>st</strong>rong>of</<strong>st</strong>rong> funds as shown in the<br />
smaller circle.<br />
Fiscal Year 2012 38
City <<strong>st</strong>rong>of</<strong>st</strong>rong> St. Petersburg, Florida - FY 2012 Proposed Fiscal Plan<br />
FY12 CIP ALL FUNDS<br />
Penny for Pinellas, Water Resources, and Other<br />
CIP Funds<br />
Break Down <<strong>st</strong>rong>of</<strong>st</strong>rong> Other CIP<br />
Funds<br />
Housing & General CIP<br />
41%<br />
Stormwater<br />
4%<br />
Other<br />
24%<br />
Penny Funds<br />
16%<br />
Airport, Marina, Golf Course, Port, Parking &<br />
Tropicana<br />
2%<br />
Water Resources<br />
35%<br />
Trans Impact Fees, Bicycle & Weeki Wachee<br />
2%<br />
CIP FUNDS FY12<br />
Local Option 0 Water Resources 38,748<br />
Public Safety 1,054 Stormwater 4,625<br />
Neighborhood & Citywide 10,881 Airport 1,129<br />
Recreation & Culture 5,834 Marina 400<br />
City Facilities 650 Golf 0<br />
Housing 50 Port 363<br />
General CIP 45,401 Bicycle/Pede<strong>st</strong>rian 0<br />
Tropicana 0 Weeki Wachee 0<br />
Downtown Parking 0 Transportation 2,825<br />
GRAND TOTAL 111,960<br />
Funding for Enterprise Fund (Water, Stormwater, Airport, Marina, Golf Courses, Port, Parking,<br />
and Tropicana Field) CIP projects comes from <strong>operating</strong> fund transfers on a pay-as-you-go basis as<br />
well as from debt or grant funding. Although Enterprise Funds are expected to fully fund all<br />
aspects <<strong>st</strong>rong>of</<strong>st</strong>rong> their operations, Penny Funds are programmed for some Stormwater projects as well as<br />
for grant matching funds for Port projects. Funding for other non-general government projects<br />
(Bicycle/Pede<strong>st</strong>rian, Weeki Wachee, Transportation, and Housing) comes from grants and various<br />
special revenue funds.<br />
A portion <<strong>st</strong>rong>of</<strong>st</strong>rong> the funding for the General CIP Fund is provided by an annual transfer from the<br />
General Fund as well as grant funding. For FY12, there will be no transfer from the General Fund.<br />
The primary revenue source for general government projects, such as <strong>st</strong>reets and roadways and<br />
parks, is the Local Option Sales Surtax, and is commonly known as the ―Penny for Pinellas.‖<br />
Fiscal Year 2012 39
City <<strong>st</strong>rong>of</<strong>st</strong>rong> St. Petersburg, Florida - FY 2012 Proposed Fiscal Plan<br />
On March 13, 2007, voters approved a ten year renewal <<strong>st</strong>rong>of</<strong>st</strong>rong> the ―Penny for Pinellas‖ sales tax<br />
beginning in January 2010 when the previous penny sales tax expired. In prior years, revenue<br />
provided by the ―Penny‖ has allowed the City to fund a majority <<strong>st</strong>rong>of</<strong>st</strong>rong> the general government <strong>capital</strong><br />
improvement program, and the extension <<strong>st</strong>rong>of</<strong>st</strong>rong> the tax is very important to the City’s ability to continue<br />
to fund needed <strong>capital</strong> improvements. Over the ten-year extension, proceeds <<strong>st</strong>rong>of</<strong>st</strong>rong> the tax are expected<br />
to be approximately $218 million. The following provides key provisions <<strong>st</strong>rong>of</<strong>st</strong>rong> the tax:<br />
The basis for the Penny for Pinellas is rooted in State law. With voter approval, the State<br />
Legislature authorized counties to levy a sales surtax for infra<strong>st</strong>ructure.<br />
The tax has been approved by voters three times beginning in 1989.<br />
Although Pinellas County has chosen to implement the tax on a ten year time frame, the law<br />
allows the tax to be levied for up to 15 years.<br />
It cannot exceed one cent. In Pinellas County, the Penny for Pinellas is the seventh cent <<strong>st</strong>rong>of</<strong>st</strong>rong><br />
the county sales tax. Six cents goes to the State, and the seventh goes to the State and gets<br />
remitted back to the County.<br />
Pinellas County shares that one cent with all municipalities in the county via an interlocal<br />
agreement that specifies a di<strong>st</strong>ribution on a population-based formula. St. Petersburg’s annual<br />
share <<strong>st</strong>rong>of</<strong>st</strong>rong> approximately 18% <<strong>st</strong>rong>of</<strong>st</strong>rong> the total has averaged approximately $21 million for the pa<strong>st</strong><br />
13 years.<br />
Penny projects in FY12 total $18.419 million and for the FY12 – FY16 period total $96.198 million.<br />
These numbers do not include an assignment for a new Police Facility/Emergency Operation Center<br />
<<strong>st</strong>rong>of</<strong>st</strong>rong> $15.0 million for the five-year CIP. The Penny plan approved by the voters provides for projects<br />
in four priority areas and e<strong>st</strong>ablished funding goals for each <<strong>st</strong>rong>of</<strong>st</strong>rong> these areas. The following charts<br />
show the appropriations for each <<strong>st</strong>rong>of</<strong>st</strong>rong> the four areas (not including the assignment mentioned above)<br />
for FY12 and for the five-year CIP. Sales tax revenues have declined <strong>st</strong>atewide and penny revenues<br />
and appropriations have been reduced in all years <<strong>st</strong>rong>of</<strong>st</strong>rong> the FY12-16 Penny plan.<br />
FY12 PENNY FUNDS APPROPRIATIONS<br />
$18.419 Million<br />
Public Safety<br />
6%<br />
City Facilities<br />
3%<br />
Neighborhood<br />
Infra<strong>st</strong>ructure<br />
59%<br />
Recreation and<br />
Culture<br />
32%<br />
Fiscal Year 2012 40
City <<strong>st</strong>rong>of</<strong>st</strong>rong> St. Petersburg, Florida - FY 2012 Proposed Fiscal Plan<br />
DEPENDENT DISTRICTS<br />
The City is required to <strong>budget</strong> for its dependent di<strong>st</strong>ricts including the Community Redevelopment<br />
Agency (CRA), Bayboro Harbor Tax Increment Di<strong>st</strong>rict, Intown We<strong>st</strong> Tax Increment Di<strong>st</strong>rict, and<br />
the Health Facilities Authority (HFA). The City Council serves as the board for the Community<br />
Redevelopment Agency and the Tax Increment Di<strong>st</strong>ricts. The CRA receives the City and County<br />
shares <<strong>st</strong>rong>of</<strong>st</strong>rong> the downtown tax increment revenue projected at $7.955 million in FY12, which will<br />
ultimately pay debt service on Public Improvement bond issues. The Bayboro and Intown We<strong>st</strong> Tax<br />
Increment Di<strong>st</strong>ricts are projected to receive $37,419 and $209,747 respectively. The property values<br />
in the downtown tax increment di<strong>st</strong>rict, and two smaller di<strong>st</strong>ricts decreased at a slower rate than in<br />
previous years. The revenue from these special di<strong>st</strong>ricts is used for improvements in the tax<br />
increment di<strong>st</strong>rict. The Health Facilities Authority issues bonds for health care facilities, and<br />
annually includes a small <strong>budget</strong> <<strong>st</strong>rong>of</<strong>st</strong>rong> $14,000 for minor expenses.<br />
FUND STRUCTURE<br />
The City <<strong>st</strong>rong>of</<strong>st</strong>rong> St. Petersburg uses ―funds‖ and ―account groups‖ to manage and report revenues,<br />
expenditures, and expenses as required by the City Charter, <strong>st</strong>ate <strong>st</strong>atutes, and generally accepted<br />
accounting principles (GAAP).<br />
Each <<strong>st</strong>rong>of</<strong>st</strong>rong> the City funds is a financial/accounting entity, and in a sense, a legal entity. Each fund has<br />
its own fund balance, which is accounted for separately. The target fund balance amount for each<br />
fund is <strong>st</strong>ated in Council’s ―fiscal policies.‖<br />
The following are the various fund categories the City uses:<br />
GOVERNMENTAL FUNDS are designed to focus on near-term liquidity. Consequently,<br />
governmental funds do no present fixed assets, long-term receivables, or long-term liabilities.<br />
Governmental Funds typically are used to account for activities supported by taxes, grants, and<br />
similar resources.<br />
PROPRIETARY FUNDS are used to account for the delivery <<strong>st</strong>rong>of</<strong>st</strong>rong> services similar to those found in<br />
the private sector. The services can be provided to outside parties for a pr<<strong>st</strong>rong>of</<strong>st</strong>rong>it, or internally to other<br />
departments for payment based on co<strong>st</strong>. There are two types <<strong>st</strong>rong>of</<strong>st</strong>rong> Proprietary Funds: Enterprise and<br />
Internal Service.<br />
FIDUCIARY FUNDS are used to account for assets held on behalf <<strong>st</strong>rong>of</<strong>st</strong>rong> outside parties or other funds.<br />
There are two types <<strong>st</strong>rong>of</<strong>st</strong>rong> Fiduciary Funds: Pension Plans and Agency Funds (including Non-<br />
Expendable Tru<strong>st</strong>s).<br />
The chart that follows illu<strong>st</strong>rates the interrelationship between funds. Dollars are transferred<br />
between funds for various purposes. For example, both the General Fund and the enterprise funds<br />
transfer dollars to CIP funds for ―pay-as-you-go‖ projects. Also, certain enterprise funds transfer<br />
dollars to the General Fund in the form <<strong>st</strong>rong>of</<strong>st</strong>rong> payments in lieu <<strong>st</strong>rong>of</<strong>st</strong>rong> taxes (PILOT) and general and<br />
admini<strong>st</strong>rative charges. Although each fund is a di<strong>st</strong>inct entity, all funds contribute to the overall<br />
operation <<strong>st</strong>rong>of</<strong>st</strong>rong> the City.<br />
Fiscal Year 2012 41
City <<strong>st</strong>rong>of</<strong>st</strong>rong> St. Petersburg, Florida - FY 2012 Proposed Fiscal Plan<br />
Relationship <<strong>st</strong>rong>of</<strong>st</strong>rong> Funds<br />
The following shows the flow <<strong>st</strong>rong>of</<strong>st</strong>rong> funding between the various types <<strong>st</strong>rong>of</<strong>st</strong>rong> Funds.<br />
Debt<br />
Service Funds<br />
Special<br />
Revenue<br />
Operating<br />
CIP<br />
GENERAL FUND<br />
Economic Stability Reserve<br />
Indu<strong>st</strong>rial Development Reserve<br />
Environmental Preservation<br />
Reserve<br />
Internal Services<br />
Key:<br />
Special Revenue<br />
Non-Operating<br />
Payment for City Provided Services<br />
City Subsidy<br />
Enterprise<br />
Funds<br />
Rate Payers<br />
Tru<strong>st</strong> &<br />
Agency<br />
BASIS OF ACCOUNTING<br />
Modified Accrual<br />
The modified accrual basis <<strong>st</strong>rong>of</<strong>st</strong>rong> accounting is utilized for the Governmental funds. Under this basis,<br />
revenues are recognized when they become susceptible to accrual; i.e., when they become both<br />
measurable and available. ―Available‖ means collectible within the current period or soon enough<br />
thereafter to be used to pay liabilities <<strong>st</strong>rong>of</<strong>st</strong>rong> the current period. Expenditures are generally recognized<br />
under the modified accrual basis <<strong>st</strong>rong>of</<strong>st</strong>rong> accounting in the period that the liability is incurred. The<br />
exception to this general rule is that expenditures for principal and intere<strong>st</strong> on general long-term debt<br />
are recognized when due and expenditures for compensated absences are recorded when paid.<br />
Accrual<br />
The accrual basis <<strong>st</strong>rong>of</<strong>st</strong>rong> accounting is utilized for the Proprietary and Fiduciary Funds. Under this basis,<br />
revenues are recognized in the period earned and expenses are recognized in the period that the<br />
liability is incurred. In contra<strong>st</strong> to Governmental Funds, depreciation is recorded.<br />
Budgetary Control and Amendments<br />
The General Fund is subject to <strong>budget</strong>ary control on a combination <<strong>st</strong>rong>of</<strong>st</strong>rong> fund and admini<strong>st</strong>ration levels<br />
(e.g., Leisure and Community Services Admini<strong>st</strong>ration includes the Parks & Recreation and Library<br />
Departments within the General Fund). The Mayor is authorized to transfer General Fund <strong>budget</strong>ed<br />
amounts between expenditure category within individual departments and admini<strong>st</strong>rations according<br />
to the original appropriation ordinance.<br />
Fiscal Year 2012 42
City <<strong>st</strong>rong>of</<strong>st</strong>rong> St. Petersburg, Florida - FY 2012 Proposed Fiscal Plan<br />
The City Council approves supplemental appropriations and appropriation transfers by resolution<br />
during the fiscal year. These transactions are then approved at fiscal yearend by ordinance.<br />
Major <strong>capital</strong> facilities and improvements, which are accounted for by the City within the Capital<br />
Projects Funds are subject to <strong>budget</strong>ary control on a project and fund basis. Appropriations for a<br />
specific project do not lapse until completion <<strong>st</strong>rong>of</<strong>st</strong>rong> the project.<br />
Encumbrances<br />
Encumbrance accounting, under which purchase orders, contracts, and other commitments for the<br />
expenditure <<strong>st</strong>rong>of</<strong>st</strong>rong> monies are recorded in order to reserve that portion <<strong>st</strong>rong>of</<strong>st</strong>rong> the applicable appropriation, is<br />
employed as an extension <<strong>st</strong>rong>of</<strong>st</strong>rong> formal <strong>budget</strong>ary integration. Encumbrances out<strong>st</strong>anding at fiscal<br />
yearend are carried forward and re-appropriated in the following year.<br />
Budget Basis <<strong>st</strong>rong>of</<strong>st</strong>rong> Accounting<br />
Budgets presented for Governmental Funds have been prepared on the modified accrual basis <<strong>st</strong>rong>of</<strong>st</strong>rong><br />
accounting, except for encumbrances and the net increase (decrease) in the fair value <<strong>st</strong>rong>of</<strong>st</strong>rong> inve<strong>st</strong>ments.<br />
Encumbrances are part <<strong>st</strong>rong>of</<strong>st</strong>rong> the overall <strong>budget</strong>ary control process and thus are included in the actual<br />
column with the related expenditures when a comparison with <strong>budget</strong> is made. Similarly, the net<br />
increase (decrease) in the fair value <<strong>st</strong>rong>of</<strong>st</strong>rong> inve<strong>st</strong>ments is excluded from related revenues when a<br />
comparison with <strong>budget</strong> is made. Depreciation is not included in <strong>budget</strong>ary <strong>st</strong>atements since it is not<br />
a use <<strong>st</strong>rong>of</<strong>st</strong>rong> expendable resources. For management decision and control purposes, enterprise debt<br />
service, <strong>capital</strong> project funds, and some reserve accounts, are <strong>budget</strong>ed separately, whereas in the<br />
financial <strong>st</strong>atements, these funds are combined with the corresponding <strong>operating</strong> fund.<br />
AT A GLANCE - CITY OF ST. PETERSBURG, FL<br />
The City <<strong>st</strong>rong>of</<strong>st</strong>rong> St. Petersburg was incorporated as a town in 1892 and later in 1903 as a <<strong>st</strong>rong>city</<strong>st</strong>rong>. It is<br />
located on the Pinellas Peninsula, on the central we<strong>st</strong> coa<strong>st</strong> <<strong>st</strong>rong>of</<strong>st</strong>rong> Florida bordered by Tampa Bay on the<br />
Ea<strong>st</strong>, the Gulf <<strong>st</strong>rong>of</<strong>st</strong>rong> Mexico on the We<strong>st</strong>, and Boca Ciega Bay to the South. It has a land mass <<strong>st</strong>rong>of</<strong>st</strong>rong> 60.9<br />
square miles with the highe<strong>st</strong> elevation above sea level <<strong>st</strong>rong>of</<strong>st</strong>rong> 61 feet.<br />
St. Petersburg is the fourth large<strong>st</strong> <<strong>st</strong>rong>city</<strong>st</strong>rong> in Florida and the 77 th large<strong>st</strong> <<strong>st</strong>rong>city</<strong>st</strong>rong> in the United States (US<br />
Census Bureau, Population Division: Annual E<strong>st</strong>imates <<strong>st</strong>rong>of</<strong>st</strong>rong> the Resident Population for Incorporated<br />
Places Over 100,000, Ranked by July 1, 2009 Population: April 1, 2000 to July 1, 2009 (SUB-<br />
EST2009-01), released September 2010, http://www.census.gov/pope<strong>st</strong>/cities/).<br />
The City is governed by a <strong>st</strong>rong mayor/council form <<strong>st</strong>rong>of</<strong>st</strong>rong> government; a sy<strong>st</strong>em that combines the<br />
<strong>st</strong>rong political leadership <<strong>st</strong>rong>of</<strong>st</strong>rong> a mayor with an elected City Council. The Mayor is responsible for<br />
running the daily affairs <<strong>st</strong>rong>of</<strong>st</strong>rong> the City. The City Council has a chair and a vice chair and mu<strong>st</strong> approve<br />
City policies, City <strong>budget</strong>, and the Mayor’s choices for <<strong>st</strong>rong>city</<strong>st</strong>rong> admini<strong>st</strong>rator, <<strong>st</strong>rong>city</<strong>st</strong>rong> attorney, and <<strong>st</strong>rong>city</<strong>st</strong>rong><br />
clerk.<br />
Fiscal Year 2012 43
City <<strong>st</strong>rong>of</<strong>st</strong>rong> St. Petersburg, Florida - FY 2012 Proposed Fiscal Plan<br />
The following charts provide demographic and household data and comparisons:<br />
Demographics<br />
Population<br />
St. Petersburg 246,378 1<br />
Pinellas County 916,542 2<br />
Tampa-St. Petersburg-Clearwater MSA 2,783,374 1<br />
St. Petersburg<br />
Median Age 42.8 1<br />
Female 52.1% 1<br />
Male 47.9% 1<br />
White 66.5% 1<br />
African-American 24.9% 1<br />
Hispanic 7.1% 1<br />
Asian 3.7% 1<br />
Total Households 107,581 1<br />
Average Household Income $58,711 1<br />
Average Household Size 2.2 2<br />
High School Graduate or Higher 86.2% 1<br />
Bachelor's Degree or Higher 27.3% 1<br />
Married 43.9% 1 MSA STATE<br />
Employees engaged in Manufacturing 6.9% 3 5.17% 3 4.7% 3<br />
Employees engaged in Health Services 19.4% 3 12.6% 3 13.0 3<br />
Employees engaged in Finance, Insurance, & Real E<strong>st</strong>ate 17.6% 3 8.3% 3 7.8% 3<br />
Unemployment Rate 11.1% 4 11.5% 4 11.0 4<br />
1 Source:St. Petersburg Economic Development Department,<br />
http://www.<strong>st</strong>pete.org/economic_development_dept/<strong>st</strong>ati<strong>st</strong>ical_market_data/demographics.asp<br />
2 Source: 2010 US Census, http://www.census.gov/<br />
3 Source: St. Petersburg Economic Development Department,<br />
http://www.<strong>st</strong>pete.org/economic_development_dept/<strong>st</strong>ati<strong>st</strong>ical_market_data/workforce.asp<br />
4 Source: Bureau <<strong>st</strong>rong>of</<strong>st</strong>rong> Labor Stati<strong>st</strong>ics February 2011 E<strong>st</strong>imate, http://www.bls.gov/data/#unemployment<br />
Fiscal Year 2012 44
City <<strong>st</strong>rong>of</<strong>st</strong>rong> St. Petersburg, Florida - FY 2012 Proposed Fiscal Plan<br />
CIVIC, CULTURAL & RECREATIONAL<br />
Major Annual Civic Events:<br />
Fe<strong>st</strong>ival <<strong>st</strong>rong>of</<strong>st</strong>rong> States (March-April)<br />
Honda Grand Prix <<strong>st</strong>rong>of</<strong>st</strong>rong> St. Petersburg (March)<br />
Mainsail Arts Fe<strong>st</strong>ival (April)<br />
St. Anthony’s Triathlon (April)<br />
Arts Alive! Museum Day (September)<br />
St. Petersburg International Folk Fair Fe<strong>st</strong>ival (November)<br />
St. Petersburg Bowl (December)<br />
Fir<strong>st</strong> Night (New Year’s Eve)<br />
Museums:<br />
St. Petersburg Museum <<strong>st</strong>rong>of</<strong>st</strong>rong> Fine Arts<br />
Salvador Dali Museum and Research In<strong>st</strong>itute<br />
St. Petersburg Museum <<strong>st</strong>rong>of</<strong>st</strong>rong> Hi<strong>st</strong>ory<br />
Dr. Carter G. Woodson African American Museum<br />
Great Explorations (―Hands-on‖ Museum)<br />
Florida International Museum<br />
Florida Holocau<strong>st</strong> Museum<br />
Pier Aquarium<br />
Cultural Organizations and Venues:<br />
The Florida Orche<strong>st</strong>ra<br />
American Stage Theater Company<br />
Mainsail Arts Fe<strong>st</strong>ival<br />
Mahaffey Theater<br />
Downtown Arts Association<br />
St. Petersburg Little Theater<br />
Palladium Theater<br />
The Coliseum<br />
Sunken Gardens<br />
Morean Arts Center<br />
In<strong>st</strong>itutions <<strong>st</strong>rong>of</<strong>st</strong>rong> Higher Learning:<br />
St. Petersburg College<br />
University <<strong>st</strong>rong>of</<strong>st</strong>rong> South Florida, St. Petersburg campus<br />
Eckerd College<br />
Poynter In<strong>st</strong>itute for Media Studies<br />
Stetson University College <<strong>st</strong>rong>of</<strong>st</strong>rong> Law<br />
Pinellas Technical Education Centers<br />
Fiscal Year 2012 45
City <<strong>st</strong>rong>of</<strong>st</strong>rong> St. Petersburg, Florida - FY 2012 Proposed Fiscal Plan<br />
Recreational Facilities and Venues:<br />
Three Public Golf Courses<br />
A Municipal Marina/Port<br />
The Pier<br />
The Coliseum<br />
Clam Bayou Nature Preserve<br />
Boyd Hill Nature Preserve/Lake Maggiore Environmental Education Center<br />
Five free Public Beaches<br />
One Main Library with six Branch Libraries<br />
137 <<strong>st</strong>rong>city</<strong>st</strong>rong> parks - (58 with playground equipment)<br />
33 Soccer/Football Fields<br />
66 Tennis Courts<br />
42 Baseball/S<<strong>st</strong>rong>of</<strong>st</strong>rong>tball Fields<br />
16 Community, Adult and Neighborhood Centers<br />
Nine Municipal Pools (North Shore Pool open year-round)<br />
21 Boat Ramps<br />
Six Dog Parks<br />
Two Skate Parks<br />
One Jai-alai Court<br />
Spectator Sports:<br />
Major League Baseball<br />
Home <<strong>st</strong>rong>of</<strong>st</strong>rong> the Tampa Bay Rays<br />
Home <<strong>st</strong>rong>of</<strong>st</strong>rong> the National Association <<strong>st</strong>rong>of</<strong>st</strong>rong> Minor League Baseball<br />
Birthplace <<strong>st</strong>rong>of</<strong>st</strong>rong> Spring Training<br />
Site <<strong>st</strong>rong>of</<strong>st</strong>rong> Baseball Boulevard, a one mile hi<strong>st</strong>orical trail along Central Avenue<br />
Tennis<br />
Ho<strong>st</strong>ed the World Group Finals <<strong>st</strong>rong>of</<strong>st</strong>rong> the Davis Cup - 1990<br />
Ho<strong>st</strong>ed fir<strong>st</strong> round <<strong>st</strong>rong>of</<strong>st</strong>rong> Davis Cup - 1995<br />
Home <<strong>st</strong>rong>of</<strong>st</strong>rong> the Hi<strong>st</strong>oric St. Petersburg Tennis Center<br />
Sailing<br />
St. Petersburg Yacht Club (e<strong>st</strong>ablished 1909)<br />
St. Petersburg Sailing Center<br />
Large<strong>st</strong> City Marina in Florida (610 slips)<br />
Ho<strong>st</strong> <<strong>st</strong>rong>of</<strong>st</strong>rong> Regatta Del Sol (annual Florida to Mexico race)<br />
Fiscal Year 2012 46
City <<strong>st</strong>rong>of</<strong>st</strong>rong> St. Petersburg, Florida - FY 2012 Proposed Fiscal Plan<br />
FISCAL POLICIES<br />
The City <<strong>st</strong>rong>of</<strong>st</strong>rong> St. Petersburg has adopted a comprehensive series <<strong>st</strong>rong>of</<strong>st</strong>rong> fiscal policies that embody recognized<br />
sound financial management concepts. These policies were originally approved by City Council in July<br />
1980. Subsequently, the 1980 policies were updated and expanded, and codified in the City’s<br />
Admini<strong>st</strong>rative Policies and Procedures. The previous revision to this policy <strong>st</strong>atement was approved by<br />
City Council July 19, 2002 (Resolution 2002-406); the City’s detailed Inve<strong>st</strong>ment Policy was revised<br />
and approved April 16, 2009 (Resolution 2009-215). New changes to these policies incorporated to<br />
keep them up to date and compliant with Governmental Accounting Standards Board Statement #54<br />
were adopted by City Council on Augu<strong>st</strong> 26, 2010 by Resolution 2010-442. It is anticipated that these<br />
policies will be amended as part <<strong>st</strong>rong>of</<strong>st</strong>rong> the City’s annual <strong>budget</strong> process and reconfirmed each year as a part<br />
<<strong>st</strong>rong>of</<strong>st</strong>rong> <strong>budget</strong> development.<br />
The fiscal policies are organized under four subject headings:<br />
I. General Fiscal Policy presents the overall guidelines for financial and accounting<br />
practices, including the basic framework for preparing the City’s <strong>operating</strong> and <strong>capital</strong><br />
<strong>budget</strong>s, maintaining accounting records, and funding services on a nondiscriminatory<br />
basis.<br />
II.<br />
III.<br />
IV.<br />
Fiscal Policy for Annual Operating Revenue and Expenses outlines the policies for<br />
<strong>budget</strong>ing and accounting for revenue and requirements, and providing adequate fund<br />
balances in the City’s various <strong>operating</strong> funds. This section includes several<br />
references to <strong>capital</strong> project funding in relation to the amount and type <<strong>st</strong>rong>of</<strong>st</strong>rong> support to be<br />
provided by the <strong>operating</strong> funds.<br />
Fiscal Policy on Inve<strong>st</strong>ments provides guidelines for inve<strong>st</strong>ing <strong>operating</strong> and <strong>capital</strong><br />
balances.<br />
Fiscal Policy for Capital Expenditures and Debt Financing directly relates to the<br />
resources and requirements <<strong>st</strong>rong>of</<strong>st</strong>rong> the Capital Improvement Program. Included are overall<br />
policies on issuance <<strong>st</strong>rong>of</<strong>st</strong>rong> debt, as well as guidelines applicable to specific fund types.<br />
The City attempts to adhere to these fiscal policies in the conduct <<strong>st</strong>rong>of</<strong>st</strong>rong> its operations. However, it mu<strong>st</strong> be<br />
noted that these policies are guidelines and not <strong>st</strong>atutory limitations. Some <<strong>st</strong>rong>of</<strong>st</strong>rong> the policies, particularly<br />
with regard to recommended fund balances, are designed as goals to be pursued, not necessarily<br />
achieved on an annual or ongoing basis. The City reserves the right to deviate from any or all <<strong>st</strong>rong>of</<strong>st</strong>rong> the<br />
fiscal policies if such action is determined by City Council to be in the be<strong>st</strong> intere<strong>st</strong> <<strong>st</strong>rong>of</<strong>st</strong>rong> St. Petersburg as a<br />
whole.<br />
47
City <<strong>st</strong>rong>of</<strong>st</strong>rong> St. Petersburg, Florida - FY 2012 Proposed Fiscal Plan<br />
I. GENERAL FISCAL POLICY<br />
A. GENERAL GUIDELINES<br />
1. The Annual Operating Budget <<strong>st</strong>rong>of</<strong>st</strong>rong> the City <<strong>st</strong>rong>of</<strong>st</strong>rong> St. Petersburg, Florida shall balance the public service<br />
needs <<strong>st</strong>rong>of</<strong>st</strong>rong> the community with the fiscal capabilities <<strong>st</strong>rong>of</<strong>st</strong>rong> the City. It is intended to achieve<br />
those goals and objectives e<strong>st</strong>ablished by Council for the next fiscal year. Service programs will<br />
represent a balance <<strong>st</strong>rong>of</<strong>st</strong>rong> services, but with special emphasis on the City’s public safety, environmental<br />
health, economic development, employment, physical appearance, living conditions, and affordable<br />
housing. Services shall be provided on a mo<strong>st</strong> co<strong>st</strong> effective basis.<br />
2. The City recognizes that its citizens deserve a commitment from the City to fiscal responsibility, and<br />
that a balanced <strong>operating</strong> <strong>budget</strong> is the corner<strong>st</strong>one <<strong>st</strong>rong>of</<strong>st</strong>rong> fiscal responsibility. Annual <strong>operating</strong><br />
expenditures (personal services, contracts, commodities, supplies, <strong>capital</strong> outlay, outside agency support,<br />
and transfers) will be fiscally balanced with revenues or income e<strong>st</strong>imates that can reasonably and<br />
normally be projected to be received during the fiscal year. New programs or changes in policies that<br />
would require the expenditure <<strong>st</strong>rong>of</<strong>st</strong>rong> additional <strong>operating</strong> funds will either be funded through reduction in<br />
programs <<strong>st</strong>rong>of</<strong>st</strong>rong> lower priority or through adju<strong>st</strong>ments to rates, service charges or taxes. Reque<strong>st</strong>s for new<br />
or modified programs or policies will be accompanied by an analysis <<strong>st</strong>rong>of</<strong>st</strong>rong> the short and long-term impact<br />
on the operational <strong>budget</strong> caused by such changed or new program or policy, with significant changes<br />
reported to the appropriate Council Committee and/or full Council.<br />
3. New programs, services, or facilities shall be based on general citizen demand, need or legislated<br />
Mandate.<br />
4. The City shall prepare and implement a Capital Improvement Program (CIP), consi<strong>st</strong>ent with State<br />
requirements, which shall schedule the funding and con<strong>st</strong>ruction <<strong>st</strong>rong>of</<strong>st</strong>rong> projects for a five-year period,<br />
including a one-year CIP Budget. The Capital Improvement Program shall balance the needs for<br />
improved public facilities and infra<strong>st</strong>ructure, consi<strong>st</strong>ent with the City’s Comprehensive Plan, within the<br />
fiscal capabilities and limitations <<strong>st</strong>rong>of</<strong>st</strong>rong> the City.<br />
5. The City shall maintain its accounting records in accordance with generally accepted accounting<br />
principles (GAAP), applied to governmental units as promulgated by the Governmental Accounting<br />
Standards Board (GASB) and the Financial Accounting Standards Board (FASB). In addition, Federal<br />
and State grant accounting <strong>st</strong>andards will be met.<br />
6. Consi<strong>st</strong>ent with Council Resolution 2009-247, a financial report shall be di<strong>st</strong>ributed to City Council<br />
following the close <<strong>st</strong>rong>of</<strong>st</strong>rong> each fiscal quarter. This report shall include the City’s inve<strong>st</strong>ments, pension<br />
funds, debt, revenues, expenditures/expenses and fund balances, and shall be presented in a form and<br />
forum specified by Council.<br />
48
City <<strong>st</strong>rong>of</<strong>st</strong>rong> St. Petersburg, Florida - FY 2012 Proposed Fiscal Plan<br />
7. The City shall provide funding for public services on a fair and equitable basis, and shall not<br />
discriminate in providing such services on the basis <<strong>st</strong>rong>of</<strong>st</strong>rong> race, color, national origin, religion, sex, sexual<br />
preference, marital <strong>st</strong>atus, age or disability.<br />
8. Budgets for all City departments and all other City expenditures/expenses shall be under Council<br />
appropriation control.<br />
9. Transfers between funds will be permitted with City Council approval which are consi<strong>st</strong>ent with City<br />
policies, resolutions, ordinances and external re<strong>st</strong>rictions.<br />
10. Inter-fund loans mu<strong>st</strong> be supported by a fiscally sound source <<strong>st</strong>rong>of</<strong>st</strong>rong> funds available for repayment and<br />
mu<strong>st</strong> comply with any applicable bond covenants.<br />
11. Preparation <<strong>st</strong>rong>of</<strong>st</strong>rong> the City’s Budget shall be in such format as to allow correlation with the<br />
expenditures/expenses reported in the City’s Annual Comprehensive Financial Report, with content <<strong>st</strong>rong>of</<strong>st</strong>rong><br />
said Budget to include that required by Section 6.01 <<strong>st</strong>rong>of</<strong>st</strong>rong> the City Charter and section 13(c), Chapter<br />
15505, Special Laws <<strong>st</strong>rong>of</<strong>st</strong>rong> the State <<strong>st</strong>rong>of</<strong>st</strong>rong> Florida, 1931, or as later revised by Ordinance <<strong>st</strong>rong>of</<strong>st</strong>rong> the City Council<br />
and now codified in §2-126 St. Petersburg City Code. Detailed e<strong>st</strong>imates per Section 13(c)(1) shall be<br />
by Object Code at the Division or Program level, and summarized by Department.<br />
12. An analysis shall be made to determine and project life cycle co<strong>st</strong> <<strong>st</strong>rong>of</<strong>st</strong>rong> ownership where appropriate,<br />
when it is <strong>proposed</strong> that the City lease or rent facilities or equipment from an outside source, if such<br />
co<strong>st</strong>s will commit the City to $50,000 or more in any one year.<br />
II. FISCAL POLICY FOR ANNUAL OPERATING REVENUES AND EXPENSES<br />
A. ALL FUNDS<br />
1. Revenue<br />
a. Revenue projections will be based on an analysis <<strong>st</strong>rong>of</<strong>st</strong>rong> hi<strong>st</strong>orical trends and reasonable assumptions <<strong>st</strong>rong>of</<strong>st</strong>rong><br />
future conditions using a conservative basis to ensure that e<strong>st</strong>imates are realized.<br />
b. The <strong>operating</strong> <strong>budget</strong> will be prepared based on 96% <<strong>st</strong>rong>of</<strong>st</strong>rong> the certified taxable value <<strong>st</strong>rong>of</<strong>st</strong>rong> the property<br />
tax roll.<br />
c. The City will not use long-term debt to finance expenditures/expenses required for operations.<br />
d. As a general rule, <strong>operating</strong> <strong>budget</strong>s will be balanced using current year revenues to finance current<br />
year expenditures. Minimum fund balances shall not normally be <strong>budget</strong>ed as a resource to support<br />
routine annual <strong>operating</strong> expenses. However, balances exceeding the policy targets may be <strong>budget</strong>ed as<br />
a resource to support <strong>capital</strong>, debt, or extraordinary major maintenance needs on a non-recurring basis,<br />
or for specific purposes, as assigned.<br />
2. Expenditures/Expenses<br />
49
City <<strong>st</strong>rong>of</<strong>st</strong>rong> St. Petersburg, Florida - FY 2012 Proposed Fiscal Plan<br />
a. Normal maintenance requirements necessary to su<strong>st</strong>ain the basic asset value will be included in the<br />
<strong>budget</strong> <<strong>st</strong>rong>of</<strong>st</strong>rong> the proper <strong>operating</strong> fund.<br />
b. Contractual obligations required by labor agreements and compensation plans for employees will be<br />
included in the <strong>budget</strong> or provided for through supplemental appropriations, dependent upon available<br />
funds.<br />
c. Capital funding will be provided for major improvements and automation <<strong>st</strong>rong>of</<strong>st</strong>rong> services based on<br />
multiple-year planning and appropriate co<strong>st</strong> benefit analysis.<br />
d. Equipment replacement (<strong>capital</strong> outlay) not funded by a replacement fund will be included in the<br />
<strong>operating</strong> <strong>budget</strong> <<strong>st</strong>rong>of</<strong>st</strong>rong> the department reque<strong>st</strong>ing the equipment.<br />
3. Fund Balance<br />
a. Maintaining an adequate fund balance is essential to the financial health <<strong>st</strong>rong>of</<strong>st</strong>rong> the City, to maintain high<br />
bond ratings and to ensure its ability to serve its citizens, meet emergency needs and unforeseen<br />
circum<strong>st</strong>ances. Accordingly, some <<strong>st</strong>rong>of</<strong>st</strong>rong> the funds will have fund balance reserve targets which are not<br />
requirements but are considered to be goals <<strong>st</strong>rong>of</<strong>st</strong>rong> the <<strong>st</strong>rong>city</<strong>st</strong>rong>. The General Fund unassigned fund balance<br />
target will be considered appropriate in the amount <<strong>st</strong>rong>of</<strong>st</strong>rong> 20% <<strong>st</strong>rong>of</<strong>st</strong>rong> the current year’s <strong>operating</strong> appropriations<br />
for the General Fund. The unre<strong>st</strong>ricted fund balance <<strong>st</strong>rong>of</<strong>st</strong>rong> the Economic Stability Fund will be included<br />
with the General Fund unassigned fund balance for purpose <<strong>st</strong>rong>of</<strong>st</strong>rong> determining if the target has been<br />
achieved.<br />
b. In compliance with governmental accounting <strong>st</strong>andards the following terminology will be used in<br />
reporting the City’s fund balances:<br />
Nonspendable fund balance – amounts that are not in a spendable form (such as inventory and<br />
prepaids) or are required to be maintained intact (such as the corpus <<strong>st</strong>rong>of</<strong>st</strong>rong> an endowment fund).<br />
Re<strong>st</strong>ricted fund balance – amounts con<strong>st</strong>rained to specific purposes by external providers (such as<br />
grantors, bondholders, and higher levels <<strong>st</strong>rong>of</<strong>st</strong>rong> government).<br />
Unre<strong>st</strong>ricted fund balance:<br />
Committed fund balance – amounts con<strong>st</strong>rained to specific purposes by City Council resolution<br />
or ordinance. To be reported as committed, amounts cannot be used for any other purpose unless<br />
the City Council reverses or amends the applicable resolution or ordinance to remove or change<br />
the con<strong>st</strong>raint.<br />
Assigned fund balance – amounts the City intends to use for a specific purpose. Intent can be<br />
expressed by the City Council or recommended by the Mayor/Admini<strong>st</strong>ration. There are two<br />
essential differences between committed fund balance and assigned fund balance. Fir<strong>st</strong>,<br />
committed fund balance requires action by the City Council, whereas assigned fund balance<br />
allows that authority to be delegated to some other body or <<strong>st</strong>rong>of</<strong>st</strong>rong>ficial. Second, formal action is<br />
50
City <<strong>st</strong>rong>of</<strong>st</strong>rong> St. Petersburg, Florida - FY 2012 Proposed Fiscal Plan<br />
necessary to impose, remove, or modify a con<strong>st</strong>raint reflected in committed fund balance,<br />
whereas less formality is necessary in the case <<strong>st</strong>rong>of</<strong>st</strong>rong> assigned fund balance.<br />
Unassigned fund balance – The General Fund, as the principal <strong>operating</strong> fund <<strong>st</strong>rong>of</<strong>st</strong>rong> the government,<br />
<<strong>st</strong>rong>of</<strong>st</strong>rong>ten will have net resources in excess <<strong>st</strong>rong>of</<strong>st</strong>rong> what can properly be classified in one <<strong>st</strong>rong>of</<strong>st</strong>rong> the four<br />
categories already described. If so, that surplus is presented as unassigned fund balance.<br />
c. Fund Balance Reserve Targets<br />
1. The general <strong>operating</strong> fund reserve target is 20% <<strong>st</strong>rong>of</<strong>st</strong>rong> the current year <strong>budget</strong>ed appropriations<br />
in that fund. For the purpose <<strong>st</strong>rong>of</<strong>st</strong>rong> determining if the target has been met, the unassigned fund balance <<strong>st</strong>rong>of</<strong>st</strong>rong><br />
the general fund and the balance <<strong>st</strong>rong>of</<strong>st</strong>rong> the economic <strong>st</strong>ability fund are added together and the combined<br />
amount is then compared with the annual appropriations <strong>budget</strong>.<br />
2. Other governmental funds <<strong>st</strong>rong>of</<strong>st</strong>rong> the <<strong>st</strong>rong>city</<strong>st</strong>rong> do not have specified fund balance targets.<br />
Recommended levels <<strong>st</strong>rong>of</<strong>st</strong>rong> committed and/or assigned fund balance will be determined on a case by case<br />
basis, based on the needs <<strong>st</strong>rong>of</<strong>st</strong>rong> each fund and as recommended by <<strong>st</strong>rong>city</<strong>st</strong>rong> <<strong>st</strong>rong>of</<strong>st</strong>rong>ficials and approved by City<br />
Council<br />
3. Fiduciary funds do not have fund balance targets. These funds do not represent resources<br />
available to support <<strong>st</strong>rong>city</<strong>st</strong>rong> activities and it would be inappropriate to e<strong>st</strong>ablish fund balance targets.<br />
4. Proprietary funds, which include both enterprise funds and internal service funds, have fund<br />
balance targets as shown in the li<strong>st</strong> below. Proprietary funds do not report fund balance amounts.<br />
However, for the purpose <<strong>st</strong>rong>of</<strong>st</strong>rong> setting targets, e<strong>st</strong>imated fund balance amounts will be determined based<br />
on a <strong>budget</strong>ary fund balance calculation performed by the Finance Department and the calculated<br />
amounts will be compared with the e<strong>st</strong>ablished targets.<br />
In mo<strong>st</strong> cases the specific targets for proprietary funds are a percentage <<strong>st</strong>rong>of</<strong>st</strong>rong> the annual, appropriated<br />
<strong>budget</strong> for that fund. Percentage targets can also be described in terms <<strong>st</strong>rong>of</<strong>st</strong>rong> a number <<strong>st</strong>rong>of</<strong>st</strong>rong> months <<strong>st</strong>rong>of</<strong>st</strong>rong><br />
<strong>operating</strong> co<strong>st</strong>s. For example, a fund balance reserve target equal to 8.3% is the same as a reserve target<br />
equal to one month <<strong>st</strong>rong>of</<strong>st</strong>rong> <strong>operating</strong> expenditures; 16.7% equals two months expenditures and 25% equals<br />
three months.<br />
A few proprietary funds have targets that are not based on annual <strong>operating</strong> co<strong>st</strong>s. In those cases there<br />
will be a notation as to what the target is based on. An example is the equipment replacement fund<br />
which has a target equal to 25% <<strong>st</strong>rong>of</<strong>st</strong>rong> the replacement co<strong>st</strong> <<strong>st</strong>rong>of</<strong>st</strong>rong> the equipment in the fund. The reason for the<br />
different approach is because this fund accounts for equipment that needs to be protected from loss due<br />
to natural disa<strong>st</strong>er.<br />
Some <<strong>st</strong>rong>of</<strong>st</strong>rong> the enterprise funds receive an annual subsidy from the general fund. In those cases there is no<br />
e<strong>st</strong>ablished fund balance target for the subsidized fund. If the fund becomes self-supporting,<br />
consideration will be given to e<strong>st</strong>ablishing a fund balance target.<br />
Unless otherwise noted, the targets shown below are a percentage <<strong>st</strong>rong>of</<strong>st</strong>rong> the annual, appropriated <strong>budget</strong>.<br />
51
City <<strong>st</strong>rong>of</<strong>st</strong>rong> St. Petersburg, Florida - FY 2012 Proposed Fiscal Plan<br />
Enterprise Funds<br />
Water Resources – 25% (8.3% in <strong>operating</strong> fund, 16.7% in water co<strong>st</strong> <strong>st</strong>abilization fund)<br />
Stormwater Utility Fund – 16.7%<br />
Sanitation Operating Fund – 16.7%<br />
Sanitation Equipment Replacement Fund – 25% <<strong>st</strong>rong>of</<strong>st</strong>rong> equipment replacement co<strong>st</strong><br />
Airport – no target<br />
Marina – 8.3%<br />
Golf Courses – 8.3%<br />
Jame<strong>st</strong>own – 8.3%<br />
Port – no target<br />
Parking Fund – no target 1<br />
Mahaffey Theater Fund – no target 1<br />
Pier Fund – no target 1<br />
Coliseum Fund – no target 1<br />
Sunken Gardens Fund – no target 1<br />
Tropicana Field Fund – no target 1<br />
1 These funds are being reclassified from special revenue funds to enterprise funds, effective with the<br />
fiscal year 2010 financial <strong>st</strong>atements and the fiscal year 2011 <strong>budget</strong>.<br />
Internal Service Funds<br />
Fleet Management Fund – 8.3%<br />
Equipment Replacement Fund – 25% <<strong>st</strong>rong>of</<strong>st</strong>rong> equipment replacement co<strong>st</strong><br />
Municipal Office Buildings Funds – 16.7%<br />
Information and Communication Services – 16.7%<br />
Technology and Infra<strong>st</strong>ructure Fund - $7,000,000 +/- $2,000,000<br />
Materials Management Fund – 8.3%<br />
Health Insurance Fund – 50%<br />
52
City <<strong>st</strong>rong>of</<strong>st</strong>rong> St. Petersburg, Florida - FY 2012 Proposed Fiscal Plan<br />
Life Insurance Fund – 25%<br />
Self Insurance Fund – 50%<br />
Commercial Insurance Fund – 50%<br />
Workers’ Compensation Fund – 25%<br />
Billing and Collections Fund – 16.7%<br />
5. Stabilization funds are a type <<strong>st</strong>rong>of</<strong>st</strong>rong> reserve fund maintained to <<strong>st</strong>rong>of</<strong>st</strong>rong>fset economic downturns, natural<br />
disa<strong>st</strong>ers, and other unforeseen events. Governmental Stabilization funds will be reported in the<br />
Comprehensive Annual Financial Report (CAFR) as committed fund balances in the appropriate fund<br />
and the level <<strong>st</strong>rong>of</<strong>st</strong>rong> funding will be reviewed annually by City Council. Additions to or reductions from a<br />
<strong>st</strong>abilization fund will be approved by City Council as part <<strong>st</strong>rong>of</<strong>st</strong>rong> the <strong>budget</strong> process or the supplemental<br />
appropriation process. E<strong>st</strong>ablishing the proper balances in <strong>st</strong>abilization funds will take into account risk<br />
exposure related to self-insurance and property insurance deductibles in the event <<strong>st</strong>rong>of</<strong>st</strong>rong> major <strong>st</strong>orm<br />
damage to City assets. Transfers from <strong>st</strong>abilization funds will not be allowed if they would cause the<br />
fund to be in a deficit position. The <<strong>st</strong>rong>city</<strong>st</strong>rong> maintains two <strong>st</strong>abilization arrangements, the “economic<br />
<strong>st</strong>ability fund” and the “water co<strong>st</strong> <strong>st</strong>abilization fund”.<br />
The balance in the economic <strong>st</strong>ability fund is combined with the general fund unassigned fund balance<br />
for purposes <<strong>st</strong>rong>of</<strong>st</strong>rong> determining if the general fund reserve target <<strong>st</strong>rong>of</<strong>st</strong>rong> 20% has been met. Permitted uses <<strong>st</strong>rong>of</<strong>st</strong>rong><br />
this fund have been e<strong>st</strong>ablished by City Council with Resolution 2003-480 as amended by a new<br />
resolution to be adopted by City Council on Augu<strong>st</strong> 26, 2010 by Resolution 2010-442. A portion <<strong>st</strong>rong>of</<strong>st</strong>rong> the<br />
balance in the water co<strong>st</strong> <strong>st</strong>abilization fund is pledged to meet two months (16.7%) <<strong>st</strong>rong>of</<strong>st</strong>rong> the three month<br />
(25%) fund balance reserve target e<strong>st</strong>ablished for the water resources <strong>operating</strong> fund. Permitted uses <<strong>st</strong>rong>of</<strong>st</strong>rong><br />
this fund have been e<strong>st</strong>ablished by Resolution 91-549 for Revenue Bond Series 1999 as amended by<br />
Resolution 2008-257.<br />
Economic Stability Fund<br />
Balances in the economic <strong>st</strong>ability fund represent committed fund balances which are available for<br />
expenditure only with the approval <<strong>st</strong>rong>of</<strong>st</strong>rong> <<strong>st</strong>rong>city</<strong>st</strong>rong> council and under the following conditions:<br />
The Economic Stability Fund may be used in the event <<strong>st</strong>rong>of</<strong>st</strong>rong> an e<strong>st</strong>imated <strong>budget</strong> shortfall amounting to<br />
more than 2% <<strong>st</strong>rong>of</<strong>st</strong>rong> the mo<strong>st</strong> recent adopted <strong>budget</strong>. Only the amount <<strong>st</strong>rong>of</<strong>st</strong>rong> the shortage above 2% may be<br />
taken from the Economic Stability Fund, while other <strong>budget</strong> balancing measures will be employed to<br />
<<strong>st</strong>rong>of</<strong>st</strong>rong>fset <strong>budget</strong> shortfalls up to and including 2%. If the 2% threshold has been met, the appropriate<br />
amount <<strong>st</strong>rong>of</<strong>st</strong>rong> resources to utilize from the Economic Stability Fund may take into account the economic<br />
climate, including the local unemployment rate, inflation rate, rate <<strong>st</strong>rong>of</<strong>st</strong>rong> personal income growth,<br />
assessed property values, and other factors as determined to be appropriate.<br />
The Economic Stability fund may be used in the event <<strong>st</strong>rong>of</<strong>st</strong>rong> damage to City property or loss <<strong>st</strong>rong>of</<strong>st</strong>rong> City<br />
assets due to disa<strong>st</strong>ers such as hurricane, tornado, flood, wind, terrorism, or other cata<strong>st</strong>rophic events<br />
when such an event results in a declaration <<strong>st</strong>rong>of</<strong>st</strong>rong> a <strong>st</strong>ate <<strong>st</strong>rong>of</<strong>st</strong>rong> emergency. Other funds <<strong>st</strong>rong>of</<strong>st</strong>rong> the <<strong>st</strong>rong>city</<strong>st</strong>rong> such as<br />
the equipment replacement funds, the self insurance fund and the Technology/Infra<strong>st</strong>ructure Fund<br />
will be used fir<strong>st</strong>, as appropriate to the circum<strong>st</strong>ances, before relying on the Economic Stability<br />
Fund.<br />
53
City <<strong>st</strong>rong>of</<strong>st</strong>rong> St. Petersburg, Florida - FY 2012 Proposed Fiscal Plan<br />
The economic <strong>st</strong>ability fund may be used to provide short-term (one year or less) advances, or longterm<br />
loans exceeding one-year in length, to other funds <<strong>st</strong>rong>of</<strong>st</strong>rong> the City for shortfalls due to economic<br />
impacts or for other purposes, as recommended by the Mayor and approved by City Council. A plan<br />
for repayment <<strong>st</strong>rong>of</<strong>st</strong>rong> the funds will be e<strong>st</strong>ablished before any such advance or loan is made.<br />
When economic <strong>st</strong>ability funds are used for any purpose, the fund will be replenished in an amount<br />
to meet the fund balance target, either from the fund for which the resources were required or from<br />
another fund <<strong>st</strong>rong>of</<strong>st</strong>rong> the City, within the time frame recommended by the Mayor or City Admini<strong>st</strong>rator<br />
and approved by City Council.<br />
Water Co<strong>st</strong> Stabilization Fund<br />
Balances in the water co<strong>st</strong> <strong>st</strong>abilization fund represent committed fund balances which are available for<br />
expenditure only with the approval <<strong>st</strong>rong>of</<strong>st</strong>rong> <<strong>st</strong>rong>city</<strong>st</strong>rong> council and under the conditions specified in Resolution 91-<br />
549 for Revenue Bond Series 1999 as amended by Resolution 2008-257 for the water co<strong>st</strong> <strong>st</strong>abilization<br />
fund.<br />
6. The balances <<strong>st</strong>rong>of</<strong>st</strong>rong> each fund will be maintained by using a conservative approach in e<strong>st</strong>imating<br />
revenues and expenditures/expenses, based on hi<strong>st</strong>orical and/or projected co<strong>st</strong>s.<br />
7. Funds which exceed their e<strong>st</strong>ablished fund balance target by 10% or more for two consecutive years<br />
will be reviewed and, if appropriate and permitted by law, the amount over target will be transferred to<br />
the General Fund, or other fund <<strong>st</strong>rong>of</<strong>st</strong>rong> the City, with approval <<strong>st</strong>rong>of</<strong>st</strong>rong> <<strong>st</strong>rong>city</<strong>st</strong>rong> Council.<br />
8. Funds which fall below their e<strong>st</strong>ablished fund balance target by 10% or more for two consecutive<br />
years will be reviewed by admini<strong>st</strong>ration. If it is determined that the fund balance target level is <strong>st</strong>ill<br />
appropriate, a corrective action plan to re<strong>st</strong>ore the fund to the appropriate level will be submitted to City<br />
Council for their approval.<br />
9. All fund balance targets will be reviewed annually, as part <<strong>st</strong>rong>of</<strong>st</strong>rong> the <strong>budget</strong> process, to determine if<br />
adju<strong>st</strong>ments need to be made.<br />
B. SPECIFIC GUIDELINES FOR INDIVIDUAL FUNDS<br />
1. General Fund<br />
a. The General Fund is the principal <strong>operating</strong> fund <<strong>st</strong>rong>of</<strong>st</strong>rong> the City and will account for activities that are<br />
not reported in another type <<strong>st</strong>rong>of</<strong>st</strong>rong> fund.<br />
b. It is the objective <<strong>st</strong>rong>of</<strong>st</strong>rong> the City to pay <strong>operating</strong> expenses <<strong>st</strong>rong>of</<strong>st</strong>rong> the General Funds from sources other than<br />
ad valorem taxes. Only when non-ad valorem tax sources <<strong>st</strong>rong>of</<strong>st</strong>rong> revenue are inadequate to support services<br />
at desired levels should ad valorem taxes be considered for assessment. Ad valorem taxes shall be<br />
earmarked to support the City <<strong>st</strong>rong>of</<strong>st</strong>rong> St. Petersburg Police and Fire departments.<br />
c. Service charges and fees for all General Fund services will be analyzed to ensure an appropriate<br />
proportional recovery <<strong>st</strong>rong>of</<strong>st</strong>rong> direct co<strong>st</strong>s and overhead.<br />
d. Available funds accruing in an Enterprise Fund which are not needed for working balance or future<br />
planned improvements may, at Council’s discretion, be transferred to the General Fund as an annual,<br />
54
City <<strong>st</strong>rong>of</<strong>st</strong>rong> St. Petersburg, Florida - FY 2012 Proposed Fiscal Plan<br />
<strong>budget</strong>ed Return on Inve<strong>st</strong>ment or Equity, except where prohibited by bond covenants or other legal<br />
requirements. This will be encouraged wherever feasible.<br />
2. Special Revenue Funds<br />
a. Special Revenue Funds will be used to account for and report the proceeds <<strong>st</strong>rong>of</<strong>st</strong>rong> specific sources that<br />
are re<strong>st</strong>ricted, committed, or assigned to expenditure for specified purposes other than debt service or<br />
<strong>capital</strong> projects.<br />
b. The Emergency Medical Services Fund will be <strong>budget</strong>ed to be fully supported by revenue from<br />
Pinellas County.<br />
3. Capital Projects Funds:<br />
a. Are used to account for and report financial resource that are re<strong>st</strong>ricted, committed, or assigned to<br />
expenditure for <strong>capital</strong> outlays, including the acquisition <<strong>st</strong>rong>of</<strong>st</strong>rong> con<strong>st</strong>ruction <<strong>st</strong>rong>of</<strong>st</strong>rong> <strong>capital</strong> facilities and<br />
other <strong>capital</strong> assets.<br />
b. Exclude those types <<strong>st</strong>rong>of</<strong>st</strong>rong> <strong>capital</strong>-related outflows financed by proprietary funds or for assets that will<br />
be held in tru<strong>st</strong> for individuals, private organizations, or other governments.<br />
4. Debt Service Funds:<br />
a. Are used to account for and report financial resources that are re<strong>st</strong>ricted, committed, or assigned to<br />
expenditure for principal and intere<strong>st</strong>.<br />
b. Should be used to report resources if legally mandated.<br />
c. Are financial resources that are being accumulated for principal and intere<strong>st</strong> maturing in future years<br />
should also be reported in debt service funds.<br />
5. Permanent Funds:<br />
a. Are used to account for and report resources that are re<strong>st</strong>ricted to the extent that only earnings, not<br />
principal, may be used for purposes that support the City’s programs.<br />
b. Do not include private purpose tru<strong>st</strong> funds which are used to account for and report situations where<br />
the government is required to use the principal or earnings for the benefit <<strong>st</strong>rong>of</<strong>st</strong>rong> individuals, private<br />
organizations, or other governments.<br />
6. Enterprise Funds<br />
a. Enterprise funds will be used to account for those activities where the co<strong>st</strong>s are expected to be<br />
funded sub<strong>st</strong>antially by external (non-City department) user fees and charges.<br />
b. Enterprise Funds will pay the General Fund their proportionate share <<strong>st</strong>rong>of</<strong>st</strong>rong> the co<strong>st</strong> <<strong>st</strong>rong>of</<strong>st</strong>rong> general<br />
admini<strong>st</strong>rative departments and a payment-in-lieu-<<strong>st</strong>rong>of</<strong>st</strong>rong>-taxes, which will be computed in a fashion that<br />
will relate the tax to a comparable commercial use, as limited by out<strong>st</strong>anding Bond resolutions. (Public<br />
Utilities bond re<strong>st</strong>rictions limit payments- in-lieu-<<strong>st</strong>rong>of</<strong>st</strong>rong>-taxes to fifteen percent (15%) <<strong>st</strong>rong>of</<strong>st</strong>rong> gross revenues).<br />
55
City <<strong>st</strong>rong>of</<strong>st</strong>rong> St. Petersburg, Florida - FY 2012 Proposed Fiscal Plan<br />
Water Resources (water, reclaimed water, and sewer), Stormwater, Sanitation, Golf Course, Airport,<br />
Marina, Port and Jame<strong>st</strong>own Housing are able to produce sufficient revenue from their service charges<br />
to fully recover all direct <strong>operating</strong> co<strong>st</strong>s and overhead, plus provide for debt service and major <strong>capital</strong><br />
outlay. Initial <strong>st</strong>artup <<strong>st</strong>rong>of</<strong>st</strong>rong> operations or specific circum<strong>st</strong>ances may require an individual enterprise to be<br />
subsidized for a limited period <<strong>st</strong>rong>of</<strong>st</strong>rong> time; however, it is fully expected that these operations will be totally<br />
self-supporting over time and will repay any subsidy to the General Fund, as revenues permit.<br />
1. Service charges, rent and fee <strong>st</strong>ructures will be e<strong>st</strong>ablished so as to ensure recovery <<strong>st</strong>rong>of</<strong>st</strong>rong> all co<strong>st</strong>s.<br />
2. The requirements <<strong>st</strong>rong>of</<strong>st</strong>rong> the Enterprise Operating Funds will include all expenses <<strong>st</strong>rong>of</<strong>st</strong>rong> the operations<br />
(salaries, benefits, services, commodities and <strong>capital</strong> outlay), including allocation <<strong>st</strong>rong>of</<strong>st</strong>rong> general and<br />
admini<strong>st</strong>rative co<strong>st</strong>s and payment-in-lieu-<<strong>st</strong>rong>of</<strong>st</strong>rong>-taxes, as well as any transfers to <strong>capital</strong> project<br />
funds, debt service funds or Return on Inve<strong>st</strong>ment/Equity.<br />
3. A review <<strong>st</strong>rong>of</<strong>st</strong>rong> co<strong>st</strong> <<strong>st</strong>rong>of</<strong>st</strong>rong> service and rate <strong>st</strong>ructures for Water Resources (water, sewer, and reclaimed<br />
water), Stormwater and Sanitation charges will be performed on an annual basis. The<br />
recommended <strong>budget</strong> will set forth the co<strong>st</strong> requirements to be recovered by the service charges<br />
that will be based on the co<strong>st</strong> <<strong>st</strong>rong>of</<strong>st</strong>rong> services provided. The impact <<strong>st</strong>rong>of</<strong>st</strong>rong> such co<strong>st</strong> <<strong>st</strong>rong>of</<strong>st</strong>rong> services on Rate<br />
Schedules charged for such services shall be presented to City Council in a timely manner to<br />
allow review and analysis prior to Council approval.<br />
4. Any Return on Equity for these operations shall be computed using a methodology similar to that<br />
used by the Florida Public Service Commission.<br />
5. The Airport, Port, Golf Course, and Marina fee <strong>st</strong>ructures will be reviewed on an annual basis,<br />
and will relate to competitive rates in other local private and public operations, and to the City’s<br />
<strong>operating</strong> and <strong>capital</strong> plan requirements.<br />
6. As provided for in section 3, it shall be the goal <<strong>st</strong>rong>of</<strong>st</strong>rong> the Golf Course and Marina Enterprises to<br />
return to the General Fund an annual Return on Inve<strong>st</strong>ment (ROI). This return on inve<strong>st</strong>ment<br />
may vary in amount from year to year to assure that the necessary <strong>capital</strong> improvements are<br />
made to maintain high quality golf course and marina facilities, with needed improvements<br />
taking priority over the Return on Inve<strong>st</strong>ment.<br />
7. The Jame<strong>st</strong>own fee <strong>st</strong>ructure will be reviewed on an annual basis and will relate to competitive<br />
rates in similar facilities, the anticipated level <<strong>st</strong>rong>of</<strong>st</strong>rong> Federal assi<strong>st</strong>ance to tenants, and to the City’s<br />
<strong>operating</strong> and <strong>capital</strong> plan requirements.<br />
8. The Parking Fund shall be used to account for <strong>operating</strong> revenue and expenditures, and <strong>capital</strong><br />
outlay and debt service transfer requirements, associated with City parking assets. Any funds not<br />
required for these purposes may be transferred to the General Fund after meeting any tax<br />
increment debt service shortfalls.<br />
9. The Mahaffey Theater, Pier, Sunken Gardens, Tropicana Field, and Coliseum Funds will be used<br />
to account for <strong>operating</strong> revenues, expenditures, and <strong>capital</strong> outlay associated with <strong>operating</strong><br />
these facilities. The income generated by these facilities may not cover their co<strong>st</strong>s and the<br />
shortfalls will require transfers from the General Operating Fund.<br />
7. Internal Service Funds<br />
56
City <<strong>st</strong>rong>of</<strong>st</strong>rong> St. Petersburg, Florida - FY 2012 Proposed Fiscal Plan<br />
a. Internal Service Funds will be used to account for the co<strong>st</strong> <<strong>st</strong>rong>of</<strong>st</strong>rong> providing specific goods or services to<br />
City departments where those services can reasonably be apportioned to the users on a co<strong>st</strong>reimbursement<br />
basis.<br />
b. Charges to departments for internal services rendered will be sufficient to cover the total co<strong>st</strong> <<strong>st</strong>rong>of</<strong>st</strong>rong><br />
performing services on an efficient basis. Rates or rate schedules for such charges shall be presented to<br />
City Council prior to planned date <<strong>st</strong>rong>of</<strong>st</strong>rong> implementation, and shall be accompanied by an analysis and<br />
ju<strong>st</strong>ification.<br />
c. Included in the co<strong>st</strong> <<strong>st</strong>rong>of</<strong>st</strong>rong> furnishing services will be the replacement <<strong>st</strong>rong>of</<strong>st</strong>rong> equipment considering<br />
inflationary co<strong>st</strong> factors.<br />
d. Lease purchase or borrowing <<strong>st</strong>rong>of</<strong>st</strong>rong> funds will be considered appropriate only if it involves a major<br />
conversion from which the co<strong>st</strong> saving benefits will accrue in future years during the useful life <<strong>st</strong>rong>of</<strong>st</strong>rong> assets<br />
acquired by such methods.<br />
III. FISCAL POLICY ON INVESTMENTS<br />
A. GENERAL GUIDELINES<br />
The inve<strong>st</strong>ment <<strong>st</strong>rong>of</<strong>st</strong>rong> all surplus <<strong>st</strong>rong>city</<strong>st</strong>rong> monies is controlled by the City’s Inve<strong>st</strong>ment Ordinance and designed<br />
to meet the City’s Inve<strong>st</strong>ment Plan Resolution, with specific inve<strong>st</strong>ment procedures outlined in the<br />
Treasury Division Procedures Manual. The City Inve<strong>st</strong>ment Plan and Procedures are in conformance<br />
with Florida Statutes Chapters 166.261 and 218.415.<br />
Some <<strong>st</strong>rong>of</<strong>st</strong>rong> the cash and inve<strong>st</strong>ment procedures are as follows:<br />
B. ALL FUNDS (except Pension Funds)<br />
1. Daily Cash Balances<br />
a. All daily checking account balances will earn intere<strong>st</strong> at a rate negotiated with a Qualified Florida<br />
Public Depository.<br />
2. Short-Term Cash Balances<br />
a. Overnight and short-term liquid cash balances may be deposited in Governmental Money Market<br />
Funds, or with the State Board <<strong>st</strong>rong>of</<strong>st</strong>rong> Admini<strong>st</strong>ration’s sponsored local government pool “Florida Prime<br />
Fund.”<br />
b. Arbitrage re<strong>st</strong>ricted bond proceeds for con<strong>st</strong>ruction funds may be held in a separate Governmental<br />
Money Market Fund, or with the State Board <<strong>st</strong>rong>of</<strong>st</strong>rong> Admini<strong>st</strong>ration’s sponsored local government pool<br />
“Florida Prime Fund,” and earn applicable overnight intere<strong>st</strong>.<br />
3. Mid-Term and Long Term Balances<br />
a. All other cash balances will be reinve<strong>st</strong>ed in mid-term to long-term inve<strong>st</strong>ments taking into<br />
consideration cash flow needs, risk tolerance, portfolio diversification, and rate <<strong>st</strong>rong>of</<strong>st</strong>rong> return.<br />
57
City <<strong>st</strong>rong>of</<strong>st</strong>rong> St. Petersburg, Florida - FY 2012 Proposed Fiscal Plan<br />
b. Where feasible, the City shall solicit proposals from a minimum <<strong>st</strong>rong>of</<strong>st</strong>rong> two firms, when purchasing or<br />
selling securities. Exceptions to the competitive bid process may be made as outlined in the Treasury<br />
Division Procedures manual. Detailed documentation shall be maintained under any selection process<br />
used.<br />
c. All inve<strong>st</strong>ments mu<strong>st</strong> be held at a money center bank or tru<strong>st</strong> bank in their tru<strong>st</strong> department to include<br />
clearing activities, inve<strong>st</strong>ment transfers and maturities, and reporting activity (exceptions include<br />
Governmental Money Market Fund balances, State Depository Certificates <<strong>st</strong>rong>of</<strong>st</strong>rong> Deposit, and Guaranteed<br />
Inve<strong>st</strong>ment Contracts).<br />
IV. FISCAL POLICY FOR CAPITAL EXPENDITURES AND DEBT FINANCING<br />
A. ALL FUNDS<br />
1. Revenue<br />
a. Revenue projections for the one-year Capital Improvement Program Budget and five-year Capital<br />
Improvement Program Plan shall be based on conservative assumptions <<strong>st</strong>rong>of</<strong>st</strong>rong> dedicated fees and taxes,<br />
future earnings and bond market conditions.<br />
2. Requirements<br />
a. Capital projects shall be ju<strong>st</strong>ified in relation to the applicable elements <<strong>st</strong>rong>of</<strong>st</strong>rong> the City’s Comprehensive<br />
Plan.<br />
b. E<strong>st</strong>imated requirements for <strong>capital</strong> projects shall include all co<strong>st</strong>s reasonably associated with the<br />
completion <<strong>st</strong>rong>of</<strong>st</strong>rong> the project.<br />
c. The impact <<strong>st</strong>rong>of</<strong>st</strong>rong> each project on the <strong>operating</strong> revenues and requirements <<strong>st</strong>rong>of</<strong>st</strong>rong> the City shall be analyzed<br />
as required by the General Fiscal Policy <strong>st</strong>ated above.<br />
d. Consi<strong>st</strong>ent with IRS regulations, timeframes for debt repayment will not exceed the average life <<strong>st</strong>rong>of</<strong>st</strong>rong><br />
improvements.<br />
3. Long Term Debt: Annual debt service payments will be level over the life <<strong>st</strong>rong>of</<strong>st</strong>rong> a bond issue, unless<br />
fiscal or other con<strong>st</strong>raints dictate an alternative approach. A policy <<strong>st</strong>rong>of</<strong>st</strong>rong> full disclosure will be followed in<br />
all financial reports and <<strong>st</strong>rong>of</<strong>st</strong>rong>ficial <strong>st</strong>atements for debt.<br />
4. Medium Term Debt: Lease-Purchase methods, bonds or other debt in<strong>st</strong>ruments may be used as a<br />
medium-term (4 to 10 years) method <<strong>st</strong>rong>of</<strong>st</strong>rong> borrowing for the financing <<strong>st</strong>rong>of</<strong>st</strong>rong> vehicles, other specialized types<br />
<<strong>st</strong>rong>of</<strong>st</strong>rong> equipment, or other <strong>capital</strong> improvements. The equipment or improvement mu<strong>st</strong> have an expected<br />
life <<strong>st</strong>rong>of</<strong>st</strong>rong> more than four years. The City will determine and utilize the lea<strong>st</strong> co<strong>st</strong>ly financing methods<br />
available. Such debt arrangements will be repaid within the expected life <<strong>st</strong>rong>of</<strong>st</strong>rong> the equipment or<br />
improvement acquired.<br />
5. Short Term Debt: Short-Term borrowing may be utilized for temporary funding <<strong>st</strong>rong>of</<strong>st</strong>rong> anticipated tax<br />
revenues, anticipated grant payments, anticipated bond proceeds, or other expected revenues.<br />
Anticipated funding is defined as an assured source with the anticipated amount based on conservative<br />
58
City <<strong>st</strong>rong>of</<strong>st</strong>rong> St. Petersburg, Florida - FY 2012 Proposed Fiscal Plan<br />
e<strong>st</strong>imates. Such borrowing may utilize a short-term note maturing before the end <<strong>st</strong>rong>of</<strong>st</strong>rong> the current<br />
appropriation period. Other short-term debt, such as tax exempt commercial paper, bond anticipation<br />
notes, tax anticipation notes, or grant anticipation notes, may be used when it provides immediate<br />
financing and an intere<strong>st</strong> advantage, or delays long-term debt until market conditions are more<br />
favorable. The City will determine and utilize the lea<strong>st</strong> co<strong>st</strong>ly method for short-term borrowing. Shortterm<br />
debt may be refunded in accordance with applicable Federal laws.<br />
B. SPECIFIC GUIDELINES<br />
1. General Capital Improvements: General <strong>capital</strong> improvements, or those improvements not related<br />
to municipally-owned enterprises, shall be funded from Governmental Funds revenues or fund balances,<br />
the sale <<strong>st</strong>rong>of</<strong>st</strong>rong> revenue bonds or general obligation bonds, and from special revenues, assessments and<br />
grants.<br />
a. Pay-As-You-Go Capital Improvements: Pay-as-you-go <strong>capital</strong> improvements shall be funded from<br />
Governmental Funds revenues or fund balances, <strong>st</strong>ate and federal grants, special assessments, or other<br />
sources <<strong>st</strong>rong>of</<strong>st</strong>rong> revenue which may become available to the City. In the case <<strong>st</strong>rong>of</<strong>st</strong>rong> special assessments,<br />
abutting property owners shall pay for local neighborhood improvements, unless exempted by Council.<br />
Major <strong>capital</strong> projects related to the delivery <<strong>st</strong>rong>of</<strong>st</strong>rong> general public services shall be paid from general<br />
purpose revenues.<br />
The One-Cent Infra<strong>st</strong>ructure Sales Surtax, approved by referendum in November 1989 and approved for<br />
second and third ten-year periods in March 1997 and March 2007, shall be used on a pay-as-you-go<br />
basis. The City will <strong>st</strong>rive to allocate the sales surtax funds in approximately the same proportions as<br />
presented in the 1989, 1997, and 2007 referendum materials. For the third reauthorization, the<br />
allocation <<strong>st</strong>rong>of</<strong>st</strong>rong> sales surtax dollars will be made in the following general proportions:<br />
Public Safety Improvements: 15 - 21%<br />
Neighborhood/Citywide Infra<strong>st</strong>ructure<br />
Improvements: 44 - 54%<br />
Recreation & Culture: 20 - 35%<br />
City Facility Improvements: 3 - 8%<br />
It is recognized that the allocation <<strong>st</strong>rong>of</<strong>st</strong>rong> funds in any given year <<strong>st</strong>rong>of</<strong>st</strong>rong> the program may vary significantly from<br />
these parameters due to prioritization and scheduling <<strong>st</strong>rong>of</<strong>st</strong>rong> projects, and that significant reductions in<br />
Penny proceeds may require an amendment <<strong>st</strong>rong>of</<strong>st</strong>rong> these percentages.<br />
b. Special Assessments: When special assessments are used for general <strong>capital</strong> improvements,<br />
demolitions, lot clearing, or reclaimed water sy<strong>st</strong>em extensions, the intere<strong>st</strong> rate charged will be<br />
e<strong>st</strong>ablished by City Council consi<strong>st</strong>ent with State law.<br />
59
City <<strong>st</strong>rong>of</<strong>st</strong>rong> St. Petersburg, Florida - FY 2012 Proposed Fiscal Plan<br />
c. Revenue Bond Debt Limit: Sale <<strong>st</strong>rong>of</<strong>st</strong>rong> revenue bonds shall be limited to that amount which can be<br />
supported from Non-Ad Valorem revenues, including covenant revenue debt. The total net annual<br />
governmental revenue bond debt service shall not exceed 25% <<strong>st</strong>rong>of</<strong>st</strong>rong> the total governmental purpose<br />
revenue and other funds available for such debt service, less all Ad Valorem tax revenues. Net annual<br />
debt service shall be gross annual debt service less e<strong>st</strong>imated intere<strong>st</strong> on Debt Service Reserve Accounts<br />
and funds from other governmental units designated for payment <<strong>st</strong>rong>of</<strong>st</strong>rong> such debt service.<br />
d. Private Activity Revenue Bonds: Private Activity Revenue Bonds will be limited to the issuing<br />
authority <<strong>st</strong>rong>of</<strong>st</strong>rong> the St. Petersburg Health Facilities Authority. The St. Petersburg Health Facilities<br />
Authority will review all bond applications and submit a recommendation to the City Council. The City<br />
and its Health Facility Authority will not be obligated either directly or indirectly for any debt service<br />
requirements.<br />
2. Enterprise Capital Improvements:<br />
a. Pay-as-you-go Improvements: Enterprise funds should support needed <strong>capital</strong> improvements on a<br />
pay-as-you-go basis to the greate<strong>st</strong> extent possible, except where analysis shows that it is in the <<strong>st</strong>rong>city</<strong>st</strong>rong>’s<br />
be<strong>st</strong> intere<strong>st</strong> to issue debt for such improvements. Water Resources funds pay-as-you-go projects in<br />
accordance with the minimum bond covenant requirement.<br />
b. Revenue Bond Debt Limit: Enterprise revenue bonds shall be used to finance revenue-producing<br />
<strong>capital</strong> facilities <<strong>st</strong>rong>of</<strong>st</strong>rong> the Enterprise Fund. Bond coverage will be provided from the Enterprise revenue<br />
sources, and may include General Fund revenue support.<br />
c. State Revolving Loan Fund: The Public Utilities Fund has available a federally-funded, belowmarket<br />
intere<strong>st</strong> rate loan pool. This pool may be used whenever its use is feasible and in the be<strong>st</strong> intere<strong>st</strong><br />
<<strong>st</strong>rong>of</<strong>st</strong>rong> the City.<br />
60
City <<strong>st</strong>rong>of</<strong>st</strong>rong> St. Petersburg, Florida - FY 2012 Proposed Fiscal Plan<br />
61
City <<strong>st</strong>rong>of</<strong>st</strong>rong> St. Petersburg, Florida - FY 2012 Proposed Fiscal Plan<br />
POSITION SUMMARY<br />
FTE By Department FY 2009<br />
Actual<br />
FY 2010<br />
Actual<br />
FY 2011<br />
Adopted<br />
General Operating Fund<br />
FY 2011<br />
Amended<br />
FY 2012<br />
Proposed<br />
FY 2012<br />
Change<br />
City Council 4.00 4.00 4.00 4.00 4.00 0.00%<br />
Mayor's Office 8.00 9.00 9.00 9.00 10.00 11.11%<br />
Legal Department 21.00 20.84 20.84 20.84 19.69 (5.52%)<br />
Public Works Admini<strong>st</strong>ration<br />
Department<br />
6.00 5.00 5.00 4.00 4.00 (20.00%)<br />
Procurement & Supply Management 11.81 11.81 11.80 11.82 11.80 0.00%<br />
Internal Services Admini<strong>st</strong>ration<br />
Department<br />
6.00 4.00 3.00 3.00 0.00 (100.00%)<br />
Neighborhood Partnership Department 4.00 4.00 4.00 4.00 3.00 (25.00%)<br />
Housing Department 21.00 2.61 5.94 7.90 3.94 (33.67%)<br />
Human Resources Department 31.20 26.70 27.70 23.95 26.50 (4.33%)<br />
City Development Admini<strong>st</strong>ration<br />
Department<br />
5.00 5.00 5.00 5.00 5.00 0.00%<br />
Codes Compliance Department 29.00 29.00 28.72 29.00 28.72 0.00%<br />
Engineering And Capital Improvements<br />
Department<br />
70.00 67.00 66.00 64.00 65.00 (1.52%)<br />
Police Department 753.00 751.00 742.00 742.00 738.00 (0.54%)<br />
Fire Department 259.00 249.00 243.00 243.00 243.00 0.00%<br />
Parks & Recreation Department 270.00 265.00 264.00 266.00 252.75 (4.26%)<br />
Library Department 69.00 68.00 68.00 68.00 65.00 (4.41%)<br />
City Clerk 9.00 9.00 9.00 9.00 9.00 0.00%<br />
Marketing & Communications<br />
Department<br />
16.00 16.00 16.00 17.00 17.00 6.25%<br />
Budget & Management Department 8.00 7.50 7.50 7.50 6.00 (20.00%)<br />
Audit Services Department 6.00 5.50 5.50 5.50 5.00 (9.09%)<br />
Transportation & Parking Management<br />
Department<br />
5.67 5.67 5.67 5.67 5.67 0.00%<br />
Downtown Enterprise Facilities<br />
Department<br />
6.00 6.00 6.00 6.00 6.00 0.00%<br />
Finance Department 19.00 19.00 19.00 18.00 18.00 (5.26%)<br />
Real E<strong>st</strong>ate & Property Management<br />
Department<br />
7.00 7.00 7.00 7.00 6.00 (14.29%)<br />
Planning & Economic Development<br />
Department<br />
38.35 35.75 34.75 34.75 31.65 (8.92%)<br />
Stormwater, Pavement & Traffic<br />
Operations Department<br />
55.00 53.00 54.00 54.00 52.00 (3.70%)<br />
Leisure & Community Services<br />
Admini<strong>st</strong>ration Department<br />
2.00 3.00 2.00 2.00 2.00 0.00%<br />
Full-Time FTE 1,740.03 1,689.38 1,674.42 1,671.92 1,638.72 (2.13%)<br />
City Council 8.00 8.00 8.00 4.00 8.00 0.00%<br />
Mayor's Office 0.00 1.00 1.00 1.50 0.80 (20.00%)<br />
Legal Department 1.75 1.75 1.00 1.00 1.00 0.00%<br />
Public Works Admini<strong>st</strong>ration<br />
Department<br />
0.00 1.00 0.50 0.75 0.75 50.00%<br />
Human Resources Department 1.00 0.50 0.50 0.50 0.50 0.00%<br />
Engineering And Capital Improvements<br />
Department<br />
38.00 38.50 38.50 37.10 30.85 (19.87%)<br />
Police Department 9.00 8.00 8.00 9.80 8.50 6.25%<br />
Fire Department 0.50 0.50 0.50 0.50 0.50 0.00%<br />
Parks & Recreation Department 273.34 259.00 256.80 263.50 243.77 (5.08%)<br />
Library Department 11.00 11.00 11.00 12.00 8.50 (22.73%)<br />
City Clerk 1.00 1.00 1.00 1.00 1.00 0.00%<br />
Marketing & Communications<br />
Department<br />
2.70 2.00 1.50 1.90 1.20 (19.72%)<br />
Downtown Enterprise Facilities<br />
Department<br />
0.50 0.50 0.50 0.50 0.80 60.00%<br />
Stormwater, Pavement & Traffic<br />
Operations Department<br />
2.00 2.00 2.00 3.20 3.20 60.00%<br />
Part-Time FTE 348.79 334.75 330.80 337.25 309.37 (6.48%)<br />
Total FTE 2,088.82 2,024.13 2,005.22 2,009.18 1,948.09 (2.85%)<br />
62
City <<strong>st</strong>rong>of</<strong>st</strong>rong> St. Petersburg, Florida - FY 2012 Proposed Fiscal Plan<br />
FTE By Department FY 2009<br />
Actual<br />
FY 2010<br />
Actual<br />
FY 2011<br />
Adopted<br />
FY 2011<br />
Amended<br />
FY 2012<br />
Proposed<br />
FY 2012<br />
Change<br />
Non-General Operating Funds<br />
Emergency Medical Services 92.00 85.00 85.00 85.00 85.00 0.00%<br />
Parking Revenue 23.33 23.33 23.33 23.33 23.33 0.00%<br />
Community Development Block<br />
Grant<br />
0.00 14.15 10.68 10.17 10.68 0.00%<br />
Emergency Shelter Grant Fund 0.00 0.13 0.07 0.14 0.07 0.00%<br />
Home Program 0.00 4.11 3.31 2.79 3.31 0.00%<br />
Building Permit Special Revenue 37.65 35.25 35.25 35.25 35.35 0.28%<br />
Coliseum Operating 5.00 5.00 5.00 5.00 5.00 0.00%<br />
Sunken Gardens 5.00 5.00 5.00 5.00 4.00 (20.00%)<br />
Police Grant Tru<strong>st</strong> Funds 0.00 10.00 10.00 10.00 10.00 0.00%<br />
Water Resources 334.00 321.00 323.00 323.00 323.00 0.00%<br />
Stormwater Utility Operating 64.00 61.00 63.00 63.00 63.00 0.00%<br />
Sanitation Operating 183.00 183.16 183.44 183.16 183.44 0.00%<br />
Airport Operating 3.00 3.00 3.00 3.00 3.00 0.00%<br />
Marina Operating 11.00 11.00 11.00 11.00 12.00 9.09%<br />
Golf Course Operating 28.00 26.00 26.00 26.00 24.00 (7.69%)<br />
Jame<strong>st</strong>own Complex 4.00 4.00 4.00 4.75 4.00 0.00%<br />
Port Operating 3.00 4.00 2.00 2.00 2.00 0.00%<br />
Fleet Management 76.00 76.00 72.00 72.00 69.00 (4.17%)<br />
Municipal Office Buildings 13.00 13.00 13.00 13.00 12.00 (7.69%)<br />
Information & Communication<br />
Services<br />
67.00 65.00 68.00 70.00 68.00 0.00%<br />
Supply Management 6.19 6.19 6.20 6.18 6.20 0.00%<br />
Health Insurance 0.50 3.20 3.20 5.20 4.05 26.56%<br />
Life Insurance 0.10 0.40 0.40 0.60 0.55 37.50%<br />
General Liabilities Claims 4.45 5.30 5.30 5.25 5.30 0.00%<br />
Commercial Insurance 1.10 0.25 0.25 0.20 0.25 0.00%<br />
Workers' Compensation 5.65 5.65 5.65 5.55 6.80 20.35%<br />
Billing & Collections 92.00 92.00 91.00 91.00 90.00 (1.10%)<br />
Deferred Compensation - Icma 0.00 0.50 0.50 0.50 0.50 0.00%<br />
Full-Time FTE 1,058.97 1,062.62 1,058.58 1,062.08 1,053.83 (0.45%)<br />
Coliseum Operating 3.23 0.50 0.50 0.50 0.30 (40.00%)<br />
Sunken Gardens 7.20 3.50 3.50 3.60 4.10 17.14%<br />
Water Resources 2.75 2.00 1.50 1.50 1.40 (6.67%)<br />
Stormwater Utility Operating 0.50 0.00 0.00 0.00 0.00 0.00%<br />
Sanitation Operating 2.50 5.00 3.50 4.70 4.60 31.43%<br />
Airport Operating 0.40 0.50 0.50 0.60 0.60 20.00%<br />
Marina Operating 6.40 4.50 3.00 4.00 4.80 60.00%<br />
Golf Course Operating 25.65 24.00 24.00 21.64 25.50 6.25%<br />
Port Operating 1.80 2.00 3.00 3.40 3.40 13.33%<br />
Fleet Management 1.00 0.00 0.00 0.00 0.00 0.00%<br />
Municipal Office Buildings 6.00 7.00 7.00 7.00 7.75 10.71%<br />
Information & Communication<br />
Services<br />
3.00 3.00 3.00 3.00 3.00 0.00%<br />
Supply Management 0.00 0.00 0.50 0.50 0.50 0.00%<br />
Billing & Collections 0.50 0.50 0.50 0.50 0.50 0.00%<br />
Part-Time FTE 60.93 52.50 50.50 50.94 56.45 11.78%<br />
Total FTE 1,119.90 1,115.12 1,109.08 1,113.02 1,110.28 0.11%<br />
City Full-Time FTE 2,799.00 2,752.00 2,733.00 2,734.00 2,692.55 (1.48%)<br />
City Part-Time FTE 409.72 387.25 381.30 388.19 365.82 (4.06%)<br />
City Total FTE 3,208.72 3,139.25 3,114.30 3,122.19 3,058.37 (1.80%)<br />
63
City <<strong>st</strong>rong>of</<strong>st</strong>rong> St. Petersburg, Florida - FY 2012 Proposed Fiscal Plan<br />
FTE By Department FY 2009<br />
Actual<br />
FY 2010<br />
Actual<br />
FY 2011<br />
Adopted<br />
FY 2011<br />
Amended<br />
FY 2012<br />
Proposed<br />
FY 2012<br />
Change<br />
City Development<br />
City Development Admini<strong>st</strong>ration<br />
Department<br />
5.00 5.00 5.00 5.00 5.00 0.00%<br />
Codes Compliance Department 36.00 36.00 40.00 40.00 40.00 0.00%<br />
Marketing & Communications<br />
Department<br />
16.00 16.00 16.00 17.00 17.00 6.25%<br />
Transportation & Parking Management<br />
Department<br />
9.00 9.00 9.00 9.00 9.00 0.00%<br />
Downtown Enterprise Facilities<br />
Department<br />
37.00 38.00 36.00 36.75 36.00 0.00%<br />
Real E<strong>st</strong>ate & Property Management<br />
Department<br />
13.00 13.00 13.00 13.00 12.00 (7.69%)<br />
Planning & Economic Development<br />
Department<br />
76.00 71.00 70.00 70.00 67.00 (4.29%)<br />
192.00 188.00 189.00 190.75 186.00 (1.59%)<br />
Full-Time FTE<br />
Marketing & Communications<br />
2.70 2.00 1.50 1.90 1.20 (19.72%)<br />
Department<br />
Downtown Enterprise Facilities<br />
19.53 11.50 11.00 12.60 14.00 27.27%<br />
Department<br />
Real E<strong>st</strong>ate & Property Management<br />
6.00 7.00 7.00 7.00 7.00 0.00%<br />
Department<br />
28.23 20.50 19.50 21.50 22.20 13.87%<br />
Part-Time FTE<br />
Admini<strong>st</strong>ration Total FTE 220.23 208.50 208.50 212.25 208.20 (0.14%)<br />
General Government Admini<strong>st</strong>ration<br />
City Council 4.00 4.00 4.00 4.00 4.00 0.00%<br />
Mayor's Office 8.00 9.00 9.00 9.00 10.00 11.11%<br />
Legal Department 21.00 20.84 20.84 20.84 19.69 (5.52%)<br />
Internal Services Admini<strong>st</strong>ration<br />
Department<br />
6.00 4.00 3.00 3.00 0.00 (100.00%)<br />
Human Resources Department 43.00 42.00 43.00 41.25 43.95 2.21%<br />
City Clerk 16.00 16.00 16.00 16.00 15.00 (6.25%)<br />
Budget & Management Department 8.00 7.50 7.50 7.50 6.00 (20.00%)<br />
Audit Services Department 6.00 5.50 5.50 5.50 5.00 (9.09%)<br />
Finance Department 19.00 19.00 19.00 18.00 18.00 (5.26%)<br />
Billing & Collections Department 106.00 107.00 106.00 106.00 105.00 (0.94%)<br />
Information & Communication<br />
Services Department<br />
67.00 65.00 68.00 70.00 68.00 0.00%<br />
304.00 299.84 301.84 301.09 294.64 (2.39%)<br />
Full-Time FTE<br />
City Council 8.00 8.00 8.00 4.00 8.00 0.00%<br />
Mayor's Office 0.00 1.00 1.00 1.50 0.80 (20.00%)<br />
Legal Department 1.75 1.75 1.00 1.00 1.00 0.00%<br />
Human Resources Department 1.00 0.50 0.50 0.50 0.50 0.00%<br />
City Clerk 1.00 1.00 1.00 1.00 1.75 75.00%<br />
Billing & Collections Department 0.50 0.50 0.50 0.50 0.50 0.00%<br />
Information & Communication<br />
3.00 3.00 3.00 3.00 3.00 0.00%<br />
Services Department<br />
15.25 15.75 15.00 11.50 15.55 3.67%<br />
Part-Time FTE<br />
Admini<strong>st</strong>ration Total FTE 319.25 315.59 316.84 312.59 310.19 (2.10%)<br />
64
City <<strong>st</strong>rong>of</<strong>st</strong>rong> St. Petersburg, Florida - FY 2012 Proposed Fiscal Plan<br />
FTE By Department FY 2009<br />
Actual<br />
FY 2010<br />
Actual<br />
FY 2011<br />
Adopted<br />
FY 2011<br />
Amended<br />
FY 2012<br />
Proposed<br />
FY 2012<br />
Change<br />
Leisure & Community Services Admini<strong>st</strong>ration<br />
Neighborhood Partnership Department 4.00 4.00 4.00 4.00 3.00 (25.00%)<br />
Housing Department 21.00 21.00 20.00 21.00 18.00 (10.00%)<br />
Parks & Recreation Department 270.00 265.00 264.00 266.00 252.75 (4.26%)<br />
Library Department 69.00 68.00 68.00 68.00 65.00 (4.41%)<br />
Leisure & Community Services<br />
Admini<strong>st</strong>ration Department<br />
2.00 3.00 2.00 2.00 2.00 0.00%<br />
Golf Course Department 28.00 26.00 26.00 26.00 24.00 (7.69%)<br />
394.00 387.00 384.00 387.00 364.75 (5.01%)<br />
Full-Time FTE<br />
Parks & Recreation Department 273.34 259.00 256.80 263.50 243.77 (5.08%)<br />
Library Department 11.00 11.00 11.00 12.00 8.50 (22.73%)<br />
Golf Course Department 25.65 24.00 24.00 21.64 25.50 6.25%<br />
309.99 294.00 291.80 297.14 277.77 (4.81%)<br />
Part-Time FTE<br />
Admini<strong>st</strong>ration Total FTE 703.99 681.00 675.80 684.14 642.52 (4.93%)<br />
65
City <<strong>st</strong>rong>of</<strong>st</strong>rong> St. Petersburg, Florida - FY 2012 Proposed Fiscal Plan<br />
FTE By Department FY 2009<br />
Actual<br />
FY 2010<br />
Actual<br />
FY 2011<br />
Adopted<br />
FY 2011<br />
Amended<br />
FY 2012<br />
Proposed<br />
FY 2012<br />
Change<br />
Public Safety<br />
Police Department 753.00 761.00 752.00 752.00 748.00 (0.53%)<br />
Fire Department 351.00 334.00 328.00 328.00 328.00 0.00%<br />
1,104.00 1,095.00 1,080.00 1,080.00 1,076.00 (0.37%)<br />
Full-Time FTE<br />
Police Department 9.00 8.00 8.00 9.80 8.50 6.25%<br />
Fire Department 0.50 0.50 0.50 0.50 0.50 0.00%<br />
9.50 8.50 8.50 10.30 9.00 5.88%<br />
Part-Time FTE<br />
Admini<strong>st</strong>ration Total FTE 1,113.50 1,103.50 1,088.50 1,090.30 1,085.00 (0.32%)<br />
Public Works Admini<strong>st</strong>ration<br />
Public Works Admini<strong>st</strong>ration<br />
Department<br />
6.00 5.00 5.00 4.00 4.00 (20.00%)<br />
Procurement & Supply Management 18.00 18.00 18.00 18.00 18.00 0.00%<br />
Engineering And Capital Improvements<br />
Department<br />
76.00 72.00 71.00 69.00 70.00 (1.41%)<br />
Stormwater, Pavement & Traffic<br />
Operations Department<br />
119.00 114.00 117.00 117.00 115.00 (1.71%)<br />
Water Resources Department 334.00 321.00 323.00 323.00 323.00 0.00%<br />
Sanitation Department 176.00 176.16 172.16 172.16 172.16 0.00%<br />
Fleet Management Department 76.00 76.00 72.00 72.00 69.00 (4.17%)<br />
805.00 782.16 778.16 775.16 771.16 (0.90%)<br />
Full-Time FTE<br />
Public Works Admini<strong>st</strong>ration<br />
0.00 1.00 0.50 0.75 0.75 50.00%<br />
Department<br />
Procurement & Supply Management 0.00 0.00 0.50 0.50 0.50 0.00%<br />
Engineering And Capital Improvements<br />
38.00 38.50 38.50 37.10 30.85 (19.87%)<br />
Department<br />
Stormwater, Pavement & Traffic<br />
2.50 2.00 2.00 3.20 3.20 60.00%<br />
Operations Department<br />
Water Resources Department 2.75 2.00 1.50 1.50 1.40 (6.67%)<br />
Sanitation Department 2.50 5.00 3.50 4.70 4.60 31.43%<br />
Fleet Management Department 1.00 0.00 0.00 0.00 0.00 0.00%<br />
46.75 48.50 46.50 47.75 41.30 (11.18%)<br />
Part-Time FTE<br />
Admini<strong>st</strong>ration Total FTE 851.75 830.66 824.66 822.91 812.46 (1.48%)<br />
City Full-Time FTE 2,799.00 2,752.00 2,733.00 2,734.00 2,692.55 (1.48%)<br />
City Part-Time FTE 409.72 387.25 381.30 388.19 365.82 (4.06%)<br />
City Total FTE 3,208.72 3,139.25 3,122.19 3,122.19 3,058.37 (2.04%)<br />
66
City <<strong>st</strong>rong>of</<strong>st</strong>rong> St. Petersburg, Florida - FY 2012 Proposed Fiscal Plan<br />
Revenue Highlights<br />
Total Operating Revenues<br />
The projected revenue in FY12 is $452.567 million for all <strong>operating</strong> funds, excluding internal service<br />
funds which are supported by internal charges. As indicated in the chart below, revenues for the<br />
General Fund and General Fund Reserves comprise the large<strong>st</strong> funding source at $198.441 million.<br />
Enterprise funds such as Water Resources ($102.710 million), Sanitation ($40.114 million), Stormwater<br />
($12.050 million), and others ($24.103 million) are funded with user fees and total $178.977 million or<br />
39.5% <<strong>st</strong>rong>of</<strong>st</strong>rong> all revenues.<br />
Special Revenue<br />
Operating Funds,<br />
$21,084<br />
Other Enterprise<br />
Funds, $24,103<br />
Stormwater,<br />
$12,050<br />
Sanitation<br />
Equipment, $2,030<br />
Debt/Non-Op<br />
Special Revenue<br />
Funds, $50,536<br />
Sanitation,<br />
$40,114<br />
FY 2012 REVENUES BY FUND SOURCE<br />
(000s omitted)<br />
General Fund &<br />
Reserves, $198,441<br />
Water Co<strong>st</strong><br />
Stabilization,<br />
$1,500<br />
Water Resources,<br />
$102,710<br />
The chart on the next page shows the major revenue sources for the General Fund. These six categories<br />
<<strong>st</strong>rong>of</<strong>st</strong>rong> revenue make up 76% <<strong>st</strong>rong>of</<strong>st</strong>rong> all General Fund revenue. As indicated on the chart, ad valorem taxes are a<br />
significant source <<strong>st</strong>rong>of</<strong>st</strong>rong> General Fund revenue at 35.3%, followed by utility taxes, which account for 19.8%<br />
<<strong>st</strong>rong>of</<strong>st</strong>rong> total General Fund revenue.<br />
67
City <<strong>st</strong>rong>of</<strong>st</strong>rong> St. Petersburg, Florida - FY 2012 Proposed Fiscal Plan<br />
Local Option Gas<br />
Tax<br />
State Aid To<br />
Cities<br />
Major General Fund Revenues FY12<br />
(000s omitted)<br />
$3,275<br />
$5,275<br />
Excise Taxes<br />
$11,112<br />
Franchise Taxes<br />
$20,725<br />
Utility Taxes<br />
$39,332<br />
Ad Valorem<br />
Taxes<br />
$70,116<br />
- 20,000 40,000 60,000 80,000<br />
MAJOR GENERAL FUND REVENUE SOURCES<br />
An eleven year hi<strong>st</strong>ory <<strong>st</strong>rong>of</<strong>st</strong>rong> each <<strong>st</strong>rong>of</<strong>st</strong>rong> the major General Fund revenue sources, including dollar amounts,<br />
and <strong>proposed</strong> <strong>budget</strong> for FY12, are shown in the charts and narrative that follow.<br />
Ad Valorem Taxes:<br />
Ad valorem taxes result from the levy <<strong>st</strong>rong>of</<strong>st</strong>rong> taxes on personal tangible property and real property. The<br />
State con<strong>st</strong>itution authorizes a <<strong>st</strong>rong>city</<strong>st</strong>rong> to levy up to 10 mills for <<strong>st</strong>rong>city</<strong>st</strong>rong>wide purposes on all taxable property<br />
within the <<strong>st</strong>rong>city</<strong>st</strong>rong>. Residents are allowed a $50,000 exemption from the taxable value <<strong>st</strong>rong>of</<strong>st</strong>rong> their home<strong>st</strong>eaded<br />
property. All property taxes resulting from the City’s <strong>operating</strong> millage will cover approximately 59%<br />
<<strong>st</strong>rong>of</<strong>st</strong>rong> the co<strong>st</strong> <<strong>st</strong>rong>of</<strong>st</strong>rong> police and fire services in FY12. Each year the Pinellas County Property Appraiser<br />
provides each jurisdiction within the County with the certified property valuation. State Statutes require<br />
that local jurisdictions <strong>budget</strong> a minimum <<strong>st</strong>rong>of</<strong>st</strong>rong> 95% <<strong>st</strong>rong>of</<strong>st</strong>rong> e<strong>st</strong>imated taxes based on the certified value. The<br />
City <<strong>st</strong>rong>of</<strong>st</strong>rong> St. Petersburg <strong>budget</strong>s 96% as per <<strong>st</strong>rong>city</<strong>st</strong>rong> policy. As shown in the chart below, ad valorem taxes<br />
have decreased over the la<strong>st</strong> four years to the lowe<strong>st</strong> level since FY04, this decrease is due to property<br />
tax reforms, Amendment 1, and the effect <<strong>st</strong>rong>of</<strong>st</strong>rong> the recession on taxable property values. As the housing<br />
market and property values decrease so will property tax revenue (assuming no increase in millage).<br />
68
City <<strong>st</strong>rong>of</<strong>st</strong>rong> St. Petersburg, Florida - FY 2012 Proposed Fiscal Plan<br />
$120,000,000<br />
Property Tax Revenue<br />
$100,000,000<br />
$80,000,000<br />
$60,000,000<br />
$40,000,000<br />
$20,000,000<br />
$-<br />
$64,548,000<br />
FY<br />
2002<br />
$68,702,000<br />
FY<br />
2003<br />
$73,801,194<br />
FY<br />
2004<br />
$81,427,760<br />
FY<br />
2005<br />
$91,875,123<br />
FY<br />
2006<br />
$103,976,171<br />
FY<br />
2007<br />
$100,812,274<br />
FY<br />
2008<br />
$94,785,536<br />
FY<br />
2009<br />
$83,484,249<br />
FY<br />
2010<br />
$74,922,762<br />
FY<br />
2011<br />
e<strong>st</strong><br />
$70,116,254<br />
FY<br />
2012<br />
bud<br />
$20,000,000<br />
$18,000,000<br />
Gross Taxable Value<br />
(000s omitted)<br />
$16,000,000<br />
$14,000,000<br />
$12,000,000<br />
$10,000,000<br />
$8,000,000<br />
$6,000,000<br />
$4,000,000<br />
$2,000,000<br />
$-<br />
$9,401,602<br />
FY<br />
2002<br />
$10,016,277<br />
FY<br />
2003<br />
$10,817,000<br />
FY<br />
2004<br />
$11,899,634<br />
FY<br />
2005<br />
$13,690,063<br />
FY<br />
2006<br />
$16,307,324<br />
FY<br />
2007<br />
$17,723,837<br />
FY<br />
2008<br />
$16,721,923<br />
FY<br />
2009<br />
$14,560,445<br />
FY<br />
2010<br />
$13,067,079<br />
FY<br />
2011<br />
e<strong>st</strong><br />
$12,265,020<br />
FY<br />
2012<br />
bud<br />
69
Utility Taxes:<br />
City <<strong>st</strong>rong>of</<strong>st</strong>rong> St. Petersburg, Florida - FY 2012 Proposed Fiscal Plan<br />
In accordance with <strong>st</strong>ate law, the utility tax is levied by the City on the purchase <<strong>st</strong>rong>of</<strong>st</strong>rong> electri<<strong>st</strong>rong>city</<strong>st</strong>rong>. The<br />
current rate is 10% <<strong>st</strong>rong>of</<strong>st</strong>rong> payments for electri<<strong>st</strong>rong>city</<strong>st</strong>rong> including gross receipt taxes and municipal franchise<br />
fees, but excluding a majority <<strong>st</strong>rong>of</<strong>st</strong>rong> the co<strong>st</strong> <<strong>st</strong>rong>of</<strong>st</strong>rong> fuel. Transfers from the Utility Tax Special Revenue Fund<br />
for debt service were finalized in FY10. This allowed the City to close the Utility Tax Special Revenue<br />
Fund and direct the utility tax revenue <strong>st</strong>raight to the General Fund. Given that a majority <<strong>st</strong>rong>of</<strong>st</strong>rong> the co<strong>st</strong> <<strong>st</strong>rong>of</<strong>st</strong>rong><br />
fuel included in the rate base is exempt from taxation, the utility tax provides a more consi<strong>st</strong>ent revenue<br />
base than the franchise tax. However, this tax is subject to variations in weather and to rate adju<strong>st</strong>ments.<br />
E<strong>st</strong>imates are based on hi<strong>st</strong>orical trends, with the mo<strong>st</strong> recent years given the mo<strong>st</strong> weight and adju<strong>st</strong>ed<br />
for any known base rate changes.<br />
Utility Tax Revenue<br />
$41,000,000<br />
$40,000,000<br />
$39,000,000<br />
$38,000,000<br />
$37,000,000<br />
$36,000,000<br />
$35,000,000<br />
$34,000,000<br />
$33,000,000<br />
$32,000,000<br />
$31,000,000<br />
$35,398,480<br />
FY<br />
2002<br />
$34,907,235<br />
FY<br />
2003<br />
$34,121,307<br />
FY<br />
2004<br />
$34,390,657<br />
$36,772,627<br />
FY FY<br />
2005 2006<br />
$36,697,023<br />
FY<br />
2007<br />
$36,706,685<br />
FY<br />
2008<br />
$38,633,741<br />
FY<br />
2009<br />
$39,711,520<br />
FY<br />
2010<br />
$39,208,670<br />
FY<br />
2011<br />
e<strong>st</strong><br />
$39,331,930<br />
FY<br />
2012<br />
bud<br />
Franchise Taxes:<br />
A franchise fee <<strong>st</strong>rong>of</<strong>st</strong>rong> 6% is levied on a business’s (Progress Energy) gross receipts for the sale <<strong>st</strong>rong>of</<strong>st</strong>rong> electri<<strong>st</strong>rong>city</<strong>st</strong>rong><br />
within the <<strong>st</strong>rong>city</<strong>st</strong>rong>. This fee is to compensate the City for the use <<strong>st</strong>rong>of</<strong>st</strong>rong> its rights-<<strong>st</strong>rong>of</<strong>st</strong>rong>-way. Franchise fee<br />
revenue is somewhat volatile due to inclusion <<strong>st</strong>rong>of</<strong>st</strong>rong> the co<strong>st</strong> <<strong>st</strong>rong>of</<strong>st</strong>rong> fuel in the rate base. The FY12 e<strong>st</strong>imate is<br />
based on hi<strong>st</strong>orical receipts and some information from Progress Energy and continues to be lower than<br />
the 2010 e<strong>st</strong>imate as some <<strong>st</strong>rong>of</<strong>st</strong>rong> the Franchise Tax Special Revenue Fund fund balance was used in FY<br />
2010.<br />
70
City <<strong>st</strong>rong>of</<strong>st</strong>rong> St. Petersburg, Florida - FY 2012 Proposed Fiscal Plan<br />
$25,000,000<br />
Franchise Tax Revenue<br />
$20,000,000<br />
$15,000,000<br />
$10,000,000<br />
$5,000,000<br />
$-<br />
$13,462,000<br />
FY<br />
2002<br />
$11,815,577<br />
FY<br />
2003<br />
$14,155,813<br />
FY<br />
2004<br />
$15,815,954<br />
FY<br />
2005<br />
$18,440,167<br />
FY<br />
2006<br />
$18,669,954<br />
FY<br />
2007<br />
$18,196,872<br />
FY<br />
2008<br />
$20,219,191<br />
FY<br />
2009<br />
$22,159,989<br />
FY<br />
2010<br />
$21,280,487<br />
FY<br />
2011<br />
e<strong>st</strong><br />
$20,724,720<br />
FY<br />
2012<br />
bud<br />
Excise Tax:<br />
The State <<strong>st</strong>rong>of</<strong>st</strong>rong> Florida levies and collects a 6.0% sales tax on qualifying retail purchases. A portion <<strong>st</strong>rong>of</<strong>st</strong>rong> the<br />
revenue collected is di<strong>st</strong>ributed to county and municipal governments. The current di<strong>st</strong>ribution rate to<br />
the local municipalities is 9.653% <<strong>st</strong>rong>of</<strong>st</strong>rong> the 6%. Current revenue projections are based on hi<strong>st</strong>orical<br />
receipts. Hi<strong>st</strong>orical sales tax revenue is shown in the chart below.<br />
$16,000,000<br />
$14,000,000<br />
$12,000,000<br />
$10,000,000<br />
$8,000,000<br />
$6,000,000<br />
$4,000,000<br />
$2,000,000<br />
$-<br />
$13,202,000<br />
$13,606,668<br />
State Half Cent Sales Tax Revenue<br />
$13,874,704<br />
$14,585,296<br />
$14,822,842<br />
$14,081,851<br />
$13,293,014<br />
$12,043,309<br />
$11,870,488<br />
$12,490,987<br />
$12,491,687<br />
FY FY FY FY FY FY FY FY FY FY FY<br />
2002 2003 2004 20052006<br />
2007 2008 2009 2010 2011 2012<br />
e<strong>st</strong> bud<br />
71
City <<strong>st</strong>rong>of</<strong>st</strong>rong> St. Petersburg, Florida - FY 2012 Proposed Fiscal Plan<br />
Local Option Gas Tax:<br />
The gas tax is levied on every net gallon <<strong>st</strong>rong>of</<strong>st</strong>rong> motor and diesel fuel sold within Pinellas County. Through<br />
FY07, the rate was $0.06 on motor fuel and diesel fuel sales with 75% <<strong>st</strong>rong>of</<strong>st</strong>rong> the revenue going to the<br />
County and the municipalities receiving the balance. The City’s share <<strong>st</strong>rong>of</<strong>st</strong>rong> the remaining 25% was<br />
40.28%. During FY07, the County passed an additional one cent tax, referred to as the "ninth cent", and<br />
revised the di<strong>st</strong>ribution formula effective September 2007. As a result, the City received sub<strong>st</strong>antially<br />
more revenue as indicated in the chart. Current revenue projections are based on hi<strong>st</strong>orical receipts.<br />
Hi<strong>st</strong>orical gas tax revenue is shown in the chart below.<br />
$4,000,000<br />
Local Option Gas Tax Revenue<br />
$3,500,000<br />
$3,000,000<br />
$2,500,000<br />
$2,000,000<br />
$1,500,000<br />
$1,000,000<br />
$500,000<br />
$-<br />
$2,199,440<br />
FY<br />
2002<br />
$2,241,353<br />
FY<br />
2003<br />
$2,318,772<br />
FY<br />
2004<br />
$2,390,990<br />
FY<br />
2005<br />
$2,367,937<br />
FY<br />
2006<br />
$2,285,019<br />
FY<br />
2007<br />
$3,359,779<br />
FY<br />
2008<br />
$3,510,104<br />
FY<br />
2009<br />
$3,274,266<br />
FY<br />
2010<br />
$3,224,606<br />
FY<br />
2011<br />
e<strong>st</strong><br />
$3,275,270<br />
FY<br />
2012<br />
bud<br />
Enterprise Funds<br />
The City operates a number <<strong>st</strong>rong>of</<strong>st</strong>rong> enterprise operations that are funded primarily from user fees and<br />
charges. These operations are expected to recover total co<strong>st</strong>s and do not receive general government<br />
support. The revenue hi<strong>st</strong>ories for the three large<strong>st</strong> <<strong>st</strong>rong>of</<strong>st</strong>rong> these funds are included below.<br />
Water Resources Fund:<br />
Water Resources revenues are provided primarily by charges for services making up $101.1 million <<strong>st</strong>rong>of</<strong>st</strong>rong><br />
the $102.7 million total. Each year inve<strong>st</strong>ment earnings from the Water Co<strong>st</strong> Stabilization Fund are<br />
transferred to the fund to help <<strong>st</strong>rong>of</<strong>st</strong>rong>fset the co<strong>st</strong> <<strong>st</strong>rong>of</<strong>st</strong>rong> water from Tampa Bay Water. For FY12, this is<br />
e<strong>st</strong>imated at $1.5 million compared to la<strong>st</strong> year's <strong>budget</strong> <<strong>st</strong>rong>of</<strong>st</strong>rong> $3.0 million. A rate <strong>st</strong>udy is currently<br />
underway for FY12.<br />
72
City <<strong>st</strong>rong>of</<strong>st</strong>rong> St. Petersburg, Florida - FY 2012 Proposed Fiscal Plan<br />
$120,000,000<br />
Water Resources Operating Fund Revenues<br />
$100,000,000<br />
$80,000,000<br />
$60,000,000<br />
$40,000,000<br />
$20,000,000<br />
$0<br />
$67,005,000<br />
$81,811,699<br />
$88,031,964<br />
$91,480,871<br />
$97,154,395<br />
$97,445,600<br />
$94,984,361<br />
$97,121,870<br />
$93,028,035<br />
$96,457,279<br />
$102,709,669<br />
FY<br />
2002<br />
FY<br />
2003<br />
FY<br />
2004<br />
FY<br />
2005<br />
FY<br />
2006<br />
FY<br />
2007<br />
FY<br />
2008<br />
FY<br />
2009<br />
FY<br />
2010<br />
FY<br />
2011<br />
e<strong>st</strong><br />
FY<br />
2012<br />
bud<br />
Sanitation Fund:<br />
Until FY04, the Sanitation Rate Stabilization Fund was used to <<strong>st</strong>rong>of</<strong>st</strong>rong>fset <strong>operating</strong> co<strong>st</strong>s for this service.<br />
Once the reserve was depleted, rate increases were required. A rate <strong>st</strong>udy is currently under way for<br />
FY12.<br />
$45,000,000<br />
$40,000,000<br />
$35,000,000<br />
$30,000,000<br />
$25,000,000<br />
$20,000,000<br />
Sanitation Operating Fund Revenues<br />
$15,000,000<br />
$10,000,000<br />
$5,000,000<br />
$0<br />
$30,542,000<br />
$30,470,690<br />
$34,407,000<br />
$34,061,112<br />
$37,593,017<br />
$40,122,265<br />
$40,601,003<br />
$41,175,623<br />
$40,459,253<br />
$40,557,179<br />
$40,113,876<br />
FY<br />
2002<br />
FY<br />
2003<br />
FY<br />
2004<br />
FY<br />
2005<br />
FY<br />
2006<br />
FY<br />
2007<br />
FY<br />
2008<br />
FY<br />
2009<br />
FY<br />
2010<br />
FY<br />
2011<br />
e<strong>st</strong><br />
FY<br />
2012<br />
bud<br />
73
City <<strong>st</strong>rong>of</<strong>st</strong>rong> St. Petersburg, Florida - FY 2012 Proposed Fiscal Plan<br />
Stormwater Fund:<br />
Stormwater revenue is derived almo<strong>st</strong> exclusively from <strong>st</strong>ormwater fees which have, up until FY09,<br />
been increased by CPI on an annual basis. City Council approved a change to the ordinance in FY09<br />
allowing City Council to vote on the potential annual Stormwater fee increase.<br />
$14,000,000<br />
Stormwater Operating Fund Revenues<br />
$12,000,000<br />
$10,000,000<br />
$8,000,000<br />
$6,000,000<br />
$4,000,000<br />
$2,000,000<br />
$0<br />
$8,695,000<br />
FY<br />
2002<br />
$8,868,781<br />
FY<br />
2003<br />
$8,800,000<br />
FY<br />
2004<br />
$11,304,705<br />
FY<br />
2005<br />
$10,660,976<br />
FY<br />
2006<br />
$11,395,951<br />
FY<br />
2007<br />
$11,878,468<br />
FY<br />
2008<br />
$12,258,012<br />
FY<br />
2009<br />
$12,328,294<br />
FY<br />
2010<br />
$12,325,530<br />
FY<br />
2011<br />
e<strong>st</strong><br />
$12,049,717<br />
FY<br />
2012<br />
bud<br />
74
City <<strong>st</strong>rong>of</<strong>st</strong>rong> St. Petersburg, Florida - FY 2012 Proposed Fiscal Plan<br />
FUND BUDGET SUMMARY<br />
General Fund (0001)<br />
The General Operating Fund is the principal fund <<strong>st</strong>rong>of</<strong>st</strong>rong> the City and is used to account for the receipt and expenditure <<strong>st</strong>rong>of</<strong>st</strong>rong> resources traditionally associated with local<br />
government and not required to be accounted for in another fund. Resources are provided primarily through taxes and intergovernmental revenues and are<br />
expended to provide basic services such as fire and police protection, parks, libraries, and <strong>st</strong>reet maintenance, as well as for admini<strong>st</strong>rative departments which<br />
perform support functions.<br />
Fund Budgetary Summary FY 2009<br />
Actual<br />
FY 2010<br />
Actual<br />
FY 2011<br />
Adopted<br />
FY 2011<br />
Amended<br />
FY 2011<br />
E<strong>st</strong>imated<br />
FY 2012<br />
Proposed<br />
FY 2012<br />
Change<br />
Salaries 103,556,427 103,612,024 101,273,331 101,599,843 102,131,770 97,314,423 (3.91%)<br />
Benefits 47,185,639 47,294,161 48,862,834 48,908,648 47,444,266 47,185,373 (3.43%)<br />
Contractual Services 36,383,409 33,681,344 33,418,457 34,610,249 31,668,382 33,802,064 1.15%<br />
Commodities 6,726,179 7,859,365 5,353,428 6,057,281 8,926,666 5,980,111 11.71%<br />
Capital 1,552,054 2,639,514 855,793 1,851,098 2,671,237 702,775 (17.88%)<br />
Grants & Aid 2,691,194 1,928,236 1,931,013 2,946,150 1,518,424 2,327,700 20.54%<br />
Transfers 13,339,988 7,846,604 7,256,231 7,724,231 7,615,531 7,127,249 (1.78%)<br />
Subsidies 5,367,000 4,662,700 4,214,335 4,214,335 4,224,335 3,993,000 (5.25%)<br />
Contingencies 0 0 362,953 262,953 0 1,224,968 237.50%<br />
Total Budget 216,801,890 209,523,949 203,528,375 208,174,788 206,200,611 199,657,663 (1.90%)<br />
Appropriations by Department FY 2009<br />
Actual<br />
FY 2010<br />
Actual<br />
FY 2011<br />
Adopted<br />
FY 2011<br />
Amended<br />
FY 2011<br />
E<strong>st</strong>imated<br />
FY 2012<br />
Proposed<br />
FY 2012<br />
Change<br />
Audit Services Department 968,013 940,845 947,843 991,603 994,289 857,321 (9.55%)<br />
Billing & Collections Department 0 0 0 200 0 0 0.00%<br />
Budget & Management Department 6,977,237 6,510,864 5,485,437 5,385,515 5,370,296 3,620,982 (33.99%)<br />
City Clerk 1,212,779 1,164,238 1,172,578 1,172,578 963,855 1,195,204 1.93%<br />
City Council 915,088 887,181 850,017 858,017 837,619 823,456 (3.12%)<br />
City Development Admini<strong>st</strong>ration<br />
689,805 646,924 607,207 607,207 630,515 637,376 4.97%<br />
Department<br />
Codes Compliance Department 2,480,642 2,523,703 2,466,853 2,470,462 2,424,207 2,439,255 (1.12%)<br />
Downtown Enterprise Facilities<br />
1,006,571 461,752 508,532 830,135 796,271 620,372 21.99%<br />
Department<br />
Engineering And Capital Improvements<br />
1,108,619 1,117,325 1,147,625 1,161,587 1,213,764 1,074,693 (6.36%)<br />
Department<br />
Finance Department 16,749,659 11,046,822 10,365,575 10,842,249 10,694,387 9,512,338 (8.23%)<br />
Fire Department 32,673,298 33,788,063 31,253,461 32,229,743 32,778,574 30,687,107 (1.81%)<br />
Fleet Management Department 116 0 0 0 0 0.00%<br />
Golf Course Department 72 24 0 0 0 0 0.00%<br />
Housing Department 346,061 353,059 345,868 345,868 416,012 328,575 (5.00%)<br />
Human Resources Department 4,251,188 3,696,092 3,748,460 3,994,005 3,779,362 3,379,970 (9.83%)<br />
Internal Services Admini<strong>st</strong>ration<br />
1,537,992 1,232,714 516,967 517,940 370,181 0 (100.00%)<br />
Department<br />
Legal Department 2,781,496 2,936,957 2,466,348 2,967,415 2,553,145 2,287,812 (7.24%)<br />
Leisure & Community Services<br />
347,854 306,075 285,431 285,974 246,174 279,032 (2.24%)<br />
Admini<strong>st</strong>ration Department<br />
Library Department 6,016,993 6,114,425 5,972,889 5,975,581 5,750,107 5,940,541 (0.54%)<br />
Marketing & Communications<br />
2,347,131 2,229,783 2,063,902 2,117,920 2,131,118 2,062,145 (0.09%)<br />
Department<br />
Mayor's Office 964,254 945,786 1,711,849 1,812,175 1,955,077 1,993,811 16.47%<br />
Neighborhood Partnership Department 449,652 425,128 361,947 361,947 405,919 333,533 (7.85%)<br />
75
City <<strong>st</strong>rong>of</<strong>st</strong>rong> St. Petersburg, Florida - FY 2012 Proposed Fiscal Plan<br />
Appropriations by Department FY 2009 FY 2010 FY 2011 FY 2011 FY 2011 FY 2012 FY 2012<br />
Actual Actual Adopted Amended E<strong>st</strong>imated Proposed Change<br />
Parks & Recreation Department 31,165,697 31,476,650 31,051,275 32,161,340 32,110,426 30,502,161 (1.77%)<br />
Planning & Economic Development<br />
4,379,284 4,328,545 3,747,205 3,867,198 3,768,244 3,386,025 (9.64%)<br />
Department<br />
Police Department 85,514,688 85,099,282 84,442,492 85,033,544 84,280,165 86,197,409 2.08%<br />
Procurement & Supply Management 1,209,974 1,179,482 1,224,343 1,227,846 1,169,293 1,134,835 (7.31%)<br />
Public Works Admini<strong>st</strong>ration<br />
5,547,694 5,402,886 5,734,319 5,734,973 5,600,158 5,452,100 (4.92%)<br />
Department<br />
Real E<strong>st</strong>ate & Property Management<br />
819,771 742,708 774,869 786,180 739,071 727,148 (6.16%)<br />
Department<br />
Sanitation Department 725 36,291 0 0 0 0.00%<br />
Stormwater, Pavement & Traffic<br />
3,778,829 3,439,436 3,591,146 3,652,664 3,334,996 3,494,395 (2.69%)<br />
Operations Department<br />
Transportation & Parking Management<br />
562,247 489,562 683,937 782,922 887,386 690,067 0.90%<br />
Department<br />
Water Resources Department (1,539) 1,347 0 0 0 0 0.00%<br />
Total Budget 216,801,890 209,523,949 203,528,375 208,174,788 206,200,611 199,657,663 (1.90%)<br />
Revenue Sources FY 2009<br />
Actual<br />
FY 2010<br />
Actual<br />
FY 2011<br />
Adopted<br />
FY 2011<br />
Amended<br />
FY 2011<br />
E<strong>st</strong>imated<br />
FY 2012<br />
Proposed<br />
FY 2012<br />
Change<br />
Property Taxes 95,140,129 83,484,249 74,922,762 74,922,762 74,922,762 70,116,254 (6.42%)<br />
Franchise Tax 803,340 901,448 20,814,460 20,814,460 21,280,487 20,724,720 (0.43%)<br />
Utility Tax 0 7,423,014 39,234,858 39,234,858 39,208,670 39,331,930 0.25%<br />
Business Taxes 2,596,245 2,405,903 2,500,000 2,500,000 2,391,080 2,500,000 0.00%<br />
Contractors Permits 56,966 50,808 35,000 35,000 65,868 35,000 0.00%<br />
Other License And Permits 287,464 343,557 343,500 343,500 229,878 701,060 104.09%<br />
Federal Grants 2,013,547 3,445,778 1,003,378 2,258,187 2,354,142 685,000 (31.73%)<br />
State Grants 14,455 1,385 0 89,556 0 0 0.00%<br />
State Shared Revenue 4,784,243 4,790,140 12,159,386 12,159,386 11,957,449 12,399,545 1.98%<br />
Grants From Other Local Units 1,674,172 1,396,870 838,807 1,629,358 838,807 838,807 0.00%<br />
Shared Revenue 0 0 7,547,057 7,547,057 9,236,331 7,262,783 (3.77%)<br />
General Government 225,056 279,700 359,042 359,042 102,793 396,692 10.49%<br />
Public Safety 3,821,350 2,106,171 2,398,600 2,398,600 1,635,121 2,297,410 (4.22%)<br />
Physical Environment Charges 0 30,561 0 0 0 0.00%<br />
Transportation Charges 103,139 103,178 85,000 85,000 20,621 155,000 82.35%<br />
Culture And Recreation Charges 5,784,269 5,386,951 6,314,384 6,327,604 6,830,318 6,798,129 7.66%<br />
Other Charges For Services 887,114 804,935 882,507 882,507 902,413 716,714 (18.79%)<br />
Traffic And Parking 709,126 556,488 1,007,576 1,169,576 823,332 2,862,015 184.05%<br />
Library Fines 128,463 132,161 142,810 142,810 47,827 137,520 (3.70%)<br />
Violation Of Local Ordinances 384,601 466,586 500,000 500,000 450,000 500,000 0.00%<br />
Intere<strong>st</strong> Earnings 1,073,055 877,013 1,380,000 1,380,000 813,488 548,136 (60.28%)<br />
Rents And Royalties 408,119 336,065 341,911 341,911 298,703 347,911 1.75%<br />
Special Assessment 0 0 73,050 73,050 0 73,050 0.00%<br />
Sale Of Fixed Assets 145,206 243,495 160,453 160,453 131,174 160,453 0.00%<br />
Sale Of Surplus Material 5,712 5,472 2,000 2,000 1,250 2,000 0.00%<br />
Contributions And Donations 619,041 55,996 16,470 16,470 19,040 16,450 (0.12%)<br />
Misc Revenue 479,986 375,116 606,036 606,036 1,494,763 892,624 47.29%<br />
General & Admini<strong>st</strong>rative 8,809,572 8,724,084 9,403,380 9,403,380 9,403,380 9,306,012 (1.04%)<br />
76
City <<strong>st</strong>rong>of</<strong>st</strong>rong> St. Petersburg, Florida - FY 2012 Proposed Fiscal Plan<br />
Revenue Sources FY 2009 FY 2010 FY 2011 FY 2011 FY 2011 FY 2012 FY 2012<br />
Actual Actual Adopted Amended E<strong>st</strong>imated Proposed Change<br />
Payment In Lieu Of Taxes 13,707,907 14,185,748 14,572,836 14,572,836 14,572,836 14,553,396 (0.13%)<br />
Interfund Transfers 70,367,110 74,256,523 2,667,082 2,674,032 2,674,032 3,727,195 39.75%<br />
Department Charges 802 208 500 500 500 500 0.00%<br />
Other Charges 650 (523) 0 0 0 0.00%<br />
Total Budget 215,030,838 213,169,081 200,312,845 202,629,930 202,707,065 198,086,306 (1.11%)<br />
Each year City Council has designated that portion <<strong>st</strong>rong>of</<strong>st</strong>rong> the General Operating Fund balance that exceeds the target balance for specific purposes. $6.888 million<br />
was designated at the end <<strong>st</strong>rong>of</<strong>st</strong>rong> both FY09 and FY10.<br />
For FY12, funds designated from prior year savings will be used to balance the <strong>budget</strong>.<br />
The City's fiscal policies call for a General Fund Operating Reserve target equal to 20% <<strong>st</strong>rong>of</<strong>st</strong>rong> the current year appropriations, with the fund balance <<strong>st</strong>rong>of</<strong>st</strong>rong> the Economic<br />
Stability Fund included. As <<strong>st</strong>rong>of</<strong>st</strong>rong> the end <<strong>st</strong>rong>of</<strong>st</strong>rong> FY11, the target fund balance is projected to be at the target.<br />
77
City <<strong>st</strong>rong>of</<strong>st</strong>rong> St. Petersburg, Florida - FY 2012 Proposed Fiscal Plan<br />
General Fund (0001)<br />
The General Operating Fund is the principal fund <<strong>st</strong>rong>of</<strong>st</strong>rong> the City and is used to account for the receipt and expenditure <<strong>st</strong>rong>of</<strong>st</strong>rong> resources traditionally associated with local<br />
government and not required to be accounted for in another fund. Resources are provided primarily through taxes and intergovernmental revenues and are<br />
expended to provide basic services such as fire and police protection, parks, libraries, and <strong>st</strong>reet maintenance, as well as for admini<strong>st</strong>rative departments which<br />
perform support functions.<br />
FY 2009<br />
Actual<br />
FY 2010<br />
Actual<br />
FY 2011<br />
Adopted<br />
FY 2011<br />
Amended<br />
FY 2011<br />
E<strong>st</strong>imated<br />
FY 2012<br />
Proposed<br />
FY 2012<br />
Change<br />
Revenue Summary<br />
Tax Revenue<br />
Property Taxes 95,140,129 83,484,249 74,922,762 74,922,762 74,922,762 70,116,254 (6.42%)<br />
Franchise Tax 803,340 901,448 20,814,460 20,814,460 21,280,487 20,724,720 (0.43%)<br />
Utility Tax 0 7,423,014 39,234,858 39,234,858 39,208,670 39,331,930 0.25%<br />
Total Tax Revenue 95,943,469 91,808,711 134,972,080 134,972,080 135,411,919 130,172,904 (3.56%)<br />
License And Permits<br />
Business Taxes 2,596,245 2,405,903 2,500,000 2,500,000 2,391,080 2,500,000 0.00%<br />
Contractors Permits 56,966 50,808 35,000 35,000 65,868 35,000 0.00%<br />
Other License And Permits 287,464 343,557 343,500 343,500 229,878 701,060 104.09%<br />
Total License And Permits 2,940,675 2,800,268 2,878,500 2,878,500 2,686,826 3,236,060 12.42%<br />
Intergovernmental Revenue<br />
Federal Grants 2,013,547 3,445,778 1,003,378 2,258,187 2,354,142 685,000 (31.73%)<br />
State Grants 14,455 1,385 0 89,556 0 0 0.00%<br />
State Shared Revenue 4,784,243 4,790,140 12,159,386 12,159,386 11,957,449 12,399,545 1.98%<br />
Grants From Other Local Units 1,674,172 1,396,870 838,807 1,629,358 838,807 838,807 0.00%<br />
Shared Revenue 0 0 7,547,057 7,547,057 9,236,331 7,262,783 (3.77%)<br />
Total Intergovernmental Revenue 8,486,417 9,634,173 21,548,628 23,683,544 24,386,729 21,186,135 (1.68%)<br />
Charges For Services<br />
General Government 225,056 279,700 359,042 359,042 102,793 396,692 10.49%<br />
Public Safety 3,821,350 2,106,171 2,398,600 2,398,600 1,635,121 2,297,410 (4.22%)<br />
Physical Environment Charges 0 30,561 0 0 0 0 0.00%<br />
Transportation Charges 103,139 103,178 85,000 85,000 20,621 155,000 82.35%<br />
Culture And Recreation Charges 5,784,269 5,386,951 6,314,384 6,327,604 6,830,318 6,798,129 7.66%<br />
Other Charges For Services 887,114 804,935 882,507 882,507 902,413 716,714 (18.79%)<br />
Total Charges For Services 10,820,928 8,711,496 10,039,533 10,052,753 9,491,266 10,363,945 3.23%<br />
Fines And Forfeitures<br />
Traffic And Parking 709,126 556,488 1,007,576 1,169,576 823,332 2,862,015 184.05%<br />
Library Fines 128,463 132,161 142,810 142,810 47,827 137,520 (3.70%)<br />
Violation Of Local Ordinances 384,601 466,586 500,000 500,000 450,000 500,000 0.00%<br />
Total Fines And Forfeitures 1,222,190 1,155,235 1,650,386 1,812,386 1,321,159 3,499,535 112.04%<br />
Misc Revenues<br />
Intere<strong>st</strong> Earnings 1,073,055 877,013 1,380,000 1,380,000 813,488 548,136 (60.28%)<br />
Rents And Royalties 408,119 336,065 341,911 341,911 298,703 347,911 1.75%<br />
Special Assessment 0 0 73,050 73,050 0 73,050 0.00%<br />
Sale Of Fixed Assets 145,206 243,495 160,453 160,453 131,174 160,453 0.00%<br />
Sale Of Surplus Material 5,712 5,472 2,000 2,000 1,250 2,000 0.00%<br />
Contributions And Donations 619,041 55,996 16,470 16,470 19,040 16,450 (0.12%)<br />
Misc Revenue 479,986 375,116 606,036 606,036 1,494,763 892,624 47.29%<br />
Total Misc Revenues 2,731,119 1,893,157 2,579,920 2,579,920 2,758,418 2,040,624 (20.90%)<br />
Transfer In<br />
General & Admini<strong>st</strong>rative 8,809,572 8,724,084 9,403,380 9,403,380 9,403,380 9,306,012 (1.04%)<br />
Payment In Lieu Of Taxes 13,707,907 14,185,748 14,572,836 14,572,836 14,572,836 14,553,396 (0.13%)<br />
Utility Tax Revenue 33,645,474 36,969,844 0 0 0 0 0.00%<br />
Local Option Tax Revenue 3,520,087 3,517,996 0 0 0 0 0.00%<br />
Franchise Tax Revenue 20,105,658 21,018,607 0 0 0 0 0.00%<br />
78
City <<strong>st</strong>rong>of</<strong>st</strong>rong> St. Petersburg, Florida - FY 2012 Proposed Fiscal Plan<br />
FY 2009 FY 2010 FY 2011 FY 2011 FY 2011 FY 2012 FY 2012<br />
Actual Actual Adopted Amended E<strong>st</strong>imated Proposed Change<br />
Excise Tax Revenue 11,574,243 11,224,566 831,495 831,495 831,495 1,431,495 72.16%<br />
Emergency Medical Services 0 0 0 6,950 6,950 0 0.00%<br />
Parking Revenue 17,456 15,000 122,896 122,896 122,896 427,476 247.84%<br />
Law Enforcement Tru<strong>st</strong> 42,809 0 0 0 0 0 0.00%<br />
School Crossing Guard Tru<strong>st</strong> 658,542 355,437 300,000 300,000 300,000 300,000 0.00%<br />
Weeki Wachee 47,766 0 0 0 0 20,000 0.00%<br />
Community Development Block Grant 0 0 272,615 272,615 272,615 498,148 82.73%<br />
Sanitation Operating 455,076 455,076 455,076 455,076 455,076 455,076 0.00%<br />
Airport Operating 0 0 50,000 50,000 50,000 50,000 0.00%<br />
Marina Operating 300,000 300,000 300,000 300,000 300,000 310,000 3.33%<br />
Jame<strong>st</strong>own Complex 0 0 35,000 35,000 35,000 35,000 0.00%<br />
Information & Communication Services 0 399,996 300,000 300,000 300,000 200,000 (33.33%)<br />
Total Transfer In 92,884,590 97,166,354 26,643,298 26,650,248 26,650,248 27,586,603 3.54%<br />
Internal Charges<br />
Department Charges 802 208 500 500 500 500 0.00%<br />
Other Charges 650 (523) 0 0 0 0 0.00%<br />
Total Internal Charges 1,452 (315) 500 500 500 500 0.00%<br />
Total<br />
Revenue Summary 215,030,840 213,169,079 200,312,845 202,629,931 202,707,065 198,086,306 (1.11%)<br />
Appropriations<br />
FY 2009<br />
Actual<br />
FY 2010<br />
Actual<br />
FY 2011<br />
Adopted<br />
FY 2011<br />
Amended<br />
FY 2011<br />
E<strong>st</strong>imated<br />
FY 2012<br />
Proposed<br />
FY 2012<br />
Change<br />
Wages And Benefits 150,742,066 150,906,185 150,136,165 150,508,491 149,576,036 144,499,796 (3.75%)<br />
Services And Commodities 43,109,588 41,540,709 38,771,885 40,667,530 40,595,048 39,782,175 2.61%<br />
Capital 1,552,054 2,639,514 855,793 1,851,098 2,671,237 702,775 (17.88%)<br />
Grants And Aid 2,691,194 1,928,236 1,931,013 2,946,150 1,518,424 2,327,700 20.54%<br />
Contingencies 0 0 362,953 262,953 0 1,224,968 237.50%<br />
Transfers Out<br />
Economic Stability 6,000,000 0 0 0 0 0 0.00%<br />
Arts And Cultural Programs 99,996 0 0 0 0 0 0.00%<br />
Bayboro Harbor Tax Increment Di<strong>st</strong>rict 0 0 52,329 52,329 52,329 20,513 (60.80%)<br />
Intown We<strong>st</strong> Tax Increment Di<strong>st</strong>rict 0 0 178,923 178,923 178,923 114,981 (35.74%)<br />
Neighborhood Stabilization Program 0 0 0 360,000 360,000 0 0.00%<br />
Mahaffey Theater Operating 934,000 965,700 774,000 774,000 733,000 670,000 (13.44%)<br />
Pier Operating 1,509,000 1,427,000 1,246,000 1,246,000 1,246,000 1,399,000 12.28%<br />
Coliseum Operating 193,000 232,000 176,000 176,000 228,000 201,000 14.20%<br />
Sunken Gardens 230,000 222,000 166,000 166,000 227,000 202,000 21.69%<br />
Tropicana Field 1,566,000 1,102,000 1,365,335 1,365,335 1,365,335 1,250,000 (8.45%)<br />
Community Redevelopment Di<strong>st</strong>rict 5,480,435 4,856,894 4,396,973 4,396,973 4,396,273 4,356,439 (0.92%)<br />
Ffgfc Loan 1,118,922 2,625,421 2,628,006 2,628,006 2,628,006 2,635,316 0.28%<br />
General Capital Improvements 640,635 364,290 0 108,000 0 0 0.00%<br />
Airport Operating 466,000 136,000 0 0 0 0 0.00%<br />
Jame<strong>st</strong>own Complex 0 70,000 0 0 0 0 0.00%<br />
Port Operating 469,000 508,000 487,000 487,000 425,000 271,000 (44.35%)<br />
Total Transfers Out 18,706,988 12,509,305 11,470,566 11,938,566 11,839,866 11,120,249 (3.05%)<br />
Total<br />
Appropriations 216,801,890 209,523,949 203,528,375 208,174,788 206,200,611 199,657,663 (1.90%)<br />
Increase/(Decrease) in Fund Balance (1,771,050) 3,645,130 (3,215,530) (5,544,857) (3,493,546) (1,571,357)<br />
Beginning Balance 26,390,780 24,743,276 27,358,621 27,358,621 27,358,621 24,743,992<br />
Adju<strong>st</strong>ments 123,546 (1,029,785) 0 878,917 878,917 0<br />
Ending Balance 24,743,276 27,358,621 24,143,091 22,692,681 24,743,992 23,172,635<br />
Each year City Council has designated that portion <<strong>st</strong>rong>of</<strong>st</strong>rong> the General Operating Fund balance that exceeds the target balance for specific purposes. $6.888 million<br />
was designated at the end <<strong>st</strong>rong>of</<strong>st</strong>rong> both FY09 and FY10.<br />
79
City <<strong>st</strong>rong>of</<strong>st</strong>rong> St. Petersburg, Florida - FY 2012 Proposed Fiscal Plan<br />
For FY12, funds designated from prior year savings will be used to balance the <strong>budget</strong>.<br />
The City's fiscal policies call for a General Fund Operating Reserve target equal to 20% <<strong>st</strong>rong>of</<strong>st</strong>rong> the current year appropriations, with the fund balance <<strong>st</strong>rong>of</<strong>st</strong>rong> the Economic<br />
Stability Fund included. As <<strong>st</strong>rong>of</<strong>st</strong>rong> the end <<strong>st</strong>rong>of</<strong>st</strong>rong> FY11, the target fund balance is projected to be at the target.<br />
80
City <<strong>st</strong>rong>of</<strong>st</strong>rong> St. Petersburg, Florida - FY 2012 Proposed Fiscal Plan<br />
Preservation Reserve (0002)<br />
The Environmental Preservation Reserve was e<strong>st</strong>ablished (Resolution 88-180) to provide a funded reserve for environmental preservation enhancement activities<br />
as specified in the agreements relating to the sale <<strong>st</strong>rong>of</<strong>st</strong>rong> the former Sod Farm area to Pinellas County in 1988.<br />
FY 2009<br />
Actual<br />
FY 2010<br />
Actual<br />
FY 2011<br />
Adopted<br />
FY 2011<br />
Amended<br />
FY 2011<br />
E<strong>st</strong>imated<br />
FY 2012<br />
Proposed<br />
FY 2012<br />
Change<br />
Revenue Summary<br />
License And Permits<br />
Contractors Permits 0 0 500 500 0 0 (100.00%)<br />
Total License And Permits 0 0 500 500 0 0 (100.00%)<br />
Misc Revenues<br />
Intere<strong>st</strong> Earnings 3,918 855 4,500 4,500 500 0 (100.00%)<br />
Total Misc Revenues 3,918 855 4,500 4,500 500 0 (100.00%)<br />
Total<br />
Revenue Summary 3,918 855 5,000 5,000 500 0 (100.00%)<br />
Increase/(Decrease) in Fund Balance 3,918 855 5,000 5,000 500 0<br />
Beginning Balance 907,047 910,965 911,820 911,820 911,820 912,320<br />
Adju<strong>st</strong>ments 0 0 0 0 0 0<br />
Ending Balance 910,965 911,820 916,820 916,820 912,320 912,320<br />
81
City <<strong>st</strong>rong>of</<strong>st</strong>rong> St. Petersburg, Florida - FY 2012 Proposed Fiscal Plan<br />
Indu<strong>st</strong>rial Development (0005)<br />
The Indu<strong>st</strong>rial Development Reserve was e<strong>st</strong>ablished in FY02 with the proceeds from the sale <<strong>st</strong>rong>of</<strong>st</strong>rong> a portion <<strong>st</strong>rong>of</<strong>st</strong>rong> the Sod Farm. A majority <<strong>st</strong>rong>of</<strong>st</strong>rong> the proceeds are<br />
re<strong>st</strong>ricted for the acquisition <<strong>st</strong>rong>of</<strong>st</strong>rong> indu<strong>st</strong>rial development property.<br />
FY 2009<br />
Actual<br />
FY 2010<br />
Actual<br />
FY 2011<br />
Adopted<br />
FY 2011<br />
Amended<br />
FY 2011<br />
E<strong>st</strong>imated<br />
FY 2012<br />
Proposed<br />
FY 2012<br />
Change<br />
Revenue Summary<br />
Misc Revenues<br />
Intere<strong>st</strong> Earnings 482 105 0 0 0 0 0.00%<br />
Total Misc Revenues 482 105 0 0 0 0 0.00%<br />
Total<br />
Revenue Summary 482 105 0 0 0 0 0.00%<br />
Transfers Out<br />
General Capital Improvements 0 123,710 0 0 0 0 0.00%<br />
Total Transfers Out 0 123,710 0 0 0 0 0.00%<br />
Total 0 123,710 0 0 0 0 0.00%<br />
Increase/(Decrease) in Fund Balance 482 (123,605) 0 0 0 0<br />
Beginning Balance 123,154 123,636 0 0 0 0<br />
Adju<strong>st</strong>ments 0 (31) 0 0 0 0<br />
Ending Balance 123,636 0 0 0 0 0<br />
82
City <<strong>st</strong>rong>of</<strong>st</strong>rong> St. Petersburg, Florida - FY 2012 Proposed Fiscal Plan<br />
Economic Stability (0008)<br />
The Economic Stability Fund was e<strong>st</strong>ablished in FY04 (Resolution 2003-480) and is to be used to <<strong>st</strong>rong>of</<strong>st</strong>rong>fset economic impacts on the <strong>budget</strong> from significant or<br />
su<strong>st</strong>ained increases in expenditures or significant decreases in revenue.<br />
FY 2009<br />
Actual<br />
FY 2010<br />
Actual<br />
FY 2011<br />
Adopted<br />
FY 2011<br />
Amended<br />
FY 2011<br />
E<strong>st</strong>imated<br />
FY 2012<br />
Proposed<br />
FY 2012<br />
Change<br />
Revenue Summary<br />
Misc Revenues<br />
Intere<strong>st</strong> Earnings 307,654 818,633 500,000 500,000 499,846 198,600 (60.28%)<br />
Total Misc Revenues 307,654 818,633 500,000 500,000 499,846 198,600 (60.28%)<br />
Transfer In<br />
General Fund 6,000,000 0 0 0 0 0 0.00%<br />
Utility Tax Revenue 0 412,116 0 0 0 0 0.00%<br />
Total Transfer In 6,000,000 412,116 0 0 0 0 0.00%<br />
Total<br />
Revenue Summary 6,307,654 1,230,749 500,000 500,000 499,846 198,600 (60.28%)<br />
Transfers Out<br />
Capital Improvement Variable Rate Debt 38,048 0 0 0 0 0 0.00%<br />
Airport Operating 1,009,594 0 0 0 0 0 0.00%<br />
Total Transfers Out 1,047,642 0 0 0 0 0 0.00%<br />
Total 1,047,642 0 0 0 0 0 0.00%<br />
Increase/(Decrease) in Fund Balance 5,260,012 1,230,749 500,000 500,000 499,846 198,600<br />
Beginning Balance 14,799,491 19,876,849 21,107,598 21,107,598 21,107,598 21,607,444<br />
Adju<strong>st</strong>ments (182,654) 0 0 0 0 0<br />
Ending Balance 19,876,849 21,107,598 21,607,598 21,607,598 21,607,444 21,806,044<br />
The Economic Stability Fund was used in FY09 to pay <<strong>st</strong>rong>of</<strong>st</strong>rong>f the Airport debt in accordance with policy to only use this fund for on-time, or non-recurring expenses.<br />
The Airport Operating Fund will repay the Economic Stability Fund from their future earnings.<br />
83
City <<strong>st</strong>rong>of</<strong>st</strong>rong> St. Petersburg, Florida - FY 2012 Proposed Fiscal Plan<br />
Health Facilities Authority (0051)<br />
This fund accounts for revenues that are service charges to non-pr<<strong>st</strong>rong>of</<strong>st</strong>rong>it health care organizations benefiting from tax exempt debt issues. Expenditures are the<br />
admini<strong>st</strong>rative co<strong>st</strong>s incurred by the authority.<br />
FY 2009<br />
Actual<br />
FY 2010<br />
Actual<br />
FY 2011<br />
Adopted<br />
FY 2011<br />
Amended<br />
FY 2011<br />
E<strong>st</strong>imated<br />
FY 2012<br />
Proposed<br />
FY 2012<br />
Change<br />
Revenue Summary<br />
Charges For Services<br />
General Government 7,500 5,000 14,000 14,000 5,000 14,000 0.00%<br />
Total Charges For Services 7,500 5,000 14,000 14,000 5,000 14,000 0.00%<br />
Fines And Forfeitures<br />
Violation Of Local Ordinances 2,500 0 0 0 0 0 0.00%<br />
Total Fines And Forfeitures 2,500 0 0 0 0 0 0.00%<br />
Misc Revenues<br />
Intere<strong>st</strong> Earnings 87 28 0 0 8 0 0.00%<br />
Total Misc Revenues 87 28 0 0 8 0 0.00%<br />
Total<br />
Revenue Summary 10,087 5,028 14,000 14,000 5,008 14,000 0.00%<br />
Appropriations<br />
FY 2009<br />
Actual<br />
FY 2010<br />
Actual<br />
FY 2011<br />
Adopted<br />
FY 2011<br />
Amended<br />
FY 2011<br />
E<strong>st</strong>imated<br />
FY 2012<br />
Proposed<br />
FY 2012<br />
Change<br />
Services And Commodities 175 175 14,000 14,000 175 14,000 0.00%<br />
Total<br />
Appropriations 175 175 14,000 14,000 175 14,000 0.00%<br />
Increase/(Decrease) in Fund Balance 9,912 4,853 0 0 4,833 0<br />
Beginning Balance 35,715 45,627 50,480 50,480 50,480 55,313<br />
Adju<strong>st</strong>ments 0 0 0 0 0 0<br />
Ending Balance 45,627 50,480 50,480 50,480 55,313 55,313<br />
84
City <<strong>st</strong>rong>of</<strong>st</strong>rong> St. Petersburg, Florida - FY 2012 Proposed Fiscal Plan<br />
Utility Tax Revenue (1001)<br />
This fund accounted for the revenue used to fund the debt service for out<strong>st</strong>anding Utility Tax Bonds. The remaining revenue was transferred to the General Fund.<br />
It was e<strong>st</strong>ablished in the Series 1986 Bonds and was closed in FY 2010.<br />
FY 2009<br />
Actual<br />
FY 2010<br />
Actual<br />
FY 2011<br />
Adopted<br />
FY 2011<br />
Amended<br />
FY 2011<br />
E<strong>st</strong>imated<br />
FY 2012<br />
Proposed<br />
FY 2012<br />
Change<br />
Revenue Summary<br />
Tax Revenue<br />
Utility Tax 38,633,875 32,288,506 0 0 0 0 0.00%<br />
Total Tax Revenue 38,633,875 32,288,506 0 0 0 0 0.00%<br />
Charges For Services<br />
Physical Environment Charges 0 (33) 0 0 0 0 0.00%<br />
Total Charges For Services 0 (33) 0 0 0 0 0.00%<br />
Misc Revenues<br />
Misc Revenue (134) (210) 0 0 0 0 0.00%<br />
Total Misc Revenues (134) (210) 0 0 0 0 0.00%<br />
Total<br />
Revenue Summary 38,633,741 32,288,263 0 0 0 0 0.00%<br />
Appropriations<br />
FY 2009<br />
Actual<br />
FY 2010<br />
Actual<br />
FY 2011<br />
Adopted<br />
FY 2011<br />
Amended<br />
FY 2011<br />
E<strong>st</strong>imated<br />
FY 2012<br />
Proposed<br />
FY 2012<br />
Change<br />
Services And Commodities 0 2,124 0 0 0 0 0.00%<br />
Transfers Out<br />
General Fund 33,645,474 36,969,844 0 0 0 0 0.00%<br />
Economic Stability 0 412,116 0 0 0 0 0.00%<br />
Police Grant Tru<strong>st</strong> Funds 0 11,080 0 0 0 0 0.00%<br />
Utility Tax Debt Service 2,816,747 1,881,585 0 0 0 0 0.00%<br />
Airport Operating 0 51,469 0 0 0 0 0.00%<br />
Marina Operating 0 286,930 0 0 0 0 0.00%<br />
Golf Course Operating 0 462,357 0 0 0 0 0.00%<br />
Health Insurance 0 1,584,344 0 0 0 0 0.00%<br />
Total Transfers Out 36,462,221 41,659,725 0 0 0 0 0.00%<br />
Total<br />
Appropriations 36,462,221 41,661,849 0 0 0 0 0.00%<br />
Increase/(Decrease) in Fund Balance 2,171,520 (9,373,586) 0 0 0 0<br />
Beginning Balance 7,202,068 9,373,588 0 0 0 0<br />
Adju<strong>st</strong>ments 0 (2) 0 0 0 0<br />
Ending Balance 9,373,588 0 0 0 0 0<br />
This fund is presented for hi<strong>st</strong>orical purposes.<br />
85
City <<strong>st</strong>rong>of</<strong>st</strong>rong> St. Petersburg, Florida - FY 2012 Proposed Fiscal Plan<br />
Local Option Tax Revenue (1003)<br />
The Local Option Tax Revenue Fund accounted for revenue received from the City's share <<strong>st</strong>rong>of</<strong>st</strong>rong> Pinellas County Local Option Gas Tax and Local Option Sales<br />
Surtax (F.S. 212.055) to fund transportation activities, purchase public safety vehicles, and make improvements to parks, buildings, roads, and other infra<strong>st</strong>ructure.<br />
Revenue was transferred to the <strong>capital</strong> improvement funds and to the General Fund. This fund was closed at the end <<strong>st</strong>rong>of</<strong>st</strong>rong> FY 2010.<br />
FY 2009<br />
Actual<br />
FY 2010<br />
Actual<br />
FY 2011<br />
Adopted<br />
FY 2011<br />
Amended<br />
FY 2011<br />
E<strong>st</strong>imated<br />
FY 2012<br />
Proposed<br />
FY 2012<br />
Change<br />
Revenue Summary<br />
Intergovernmental Revenue<br />
Shared Revenue 24,339,423 22,122,231 0 0 0 0 0.00%<br />
Total Intergovernmental Revenue 24,339,423 22,122,231 0 0 0 0 0.00%<br />
Charges For Services<br />
Other Charges For Services 0 567 0 0 0 0 0.00%<br />
Total Charges For Services 0 567 0 0 0 0 0.00%<br />
Misc Revenues<br />
Intere<strong>st</strong> Earnings 13,522 2,874 0 0 0 0 0.00%<br />
Total Misc Revenues 13,522 2,874 0 0 0 0 0.00%<br />
Total<br />
Revenue Summary 24,352,945 22,125,672 0 0 0 0 0.00%<br />
Transfers Out<br />
General Fund 3,520,087 3,517,996 0 0 0 0 0.00%<br />
Public Safety Capital Improvement 2,844,571 4,073,004 0 0 0 0 0.00%<br />
City & Neighborhood Infra<strong>st</strong>ructure 14,696,951 10,868,004 0 0 0 0 0.00%<br />
Recreation & Culture Capital 5,452,095 6,168,996 0 0 0 0 0.00%<br />
City Facilities Capital Improvement 711,143 1,280,004 0 0 0 0 0.00%<br />
Total Transfers Out 27,224,847 25,908,004 0 0 0 0 0.00%<br />
Total 27,224,847 25,908,004 0 0 0 0 0.00%<br />
Increase/(Decrease) in Fund Balance (2,871,902) (3,782,332) 0 0 0 0<br />
Beginning Balance 11,156,428 8,284,617 4,502,285 4,502,285 4,502,285 4,502,285<br />
Adju<strong>st</strong>ments 91 0 0 0 0 0<br />
Ending Balance 8,284,617 4,502,285 4,502,285 4,502,285 4,502,285 4,502,285<br />
This fund is presented for hi<strong>st</strong>orical purposes.<br />
86
City <<strong>st</strong>rong>of</<strong>st</strong>rong> St. Petersburg, Florida - FY 2012 Proposed Fiscal Plan<br />
Franchise Tax Revenue (1005)<br />
The Franchise Tax Revenue Fund accounted for revenue used as a secondary pledge for the debt service for out<strong>st</strong>anding Public Improvement Revenue Bonds. The<br />
remaining revenue was transferred to the General Fund. It was e<strong>st</strong>ablished in the Series 1988A Bonds and closed at the end <<strong>st</strong>rong>of</<strong>st</strong>rong> FY 2010.<br />
FY 2009<br />
Actual<br />
FY 2010<br />
Actual<br />
FY 2011<br />
Adopted<br />
FY 2011<br />
Amended<br />
FY 2011<br />
E<strong>st</strong>imated<br />
FY 2012<br />
Proposed<br />
FY 2012<br />
Change<br />
Revenue Summary<br />
Tax Revenue<br />
Franchise Tax 20,211,279 21,258,541 0 0 0 0 0.00%<br />
Total Tax Revenue 20,211,279 21,258,541 0 0 0 0 0.00%<br />
Misc Revenues<br />
Intere<strong>st</strong> Earnings 7,912 0 0 0 0 0 0.00%<br />
Total Misc Revenues 7,912 0 0 0 0 0 0.00%<br />
Transfer In<br />
Community Development Block Grant 0 558,058 0 0 0 0 0.00%<br />
Total Transfer In 0 558,058 0 0 0 0 0.00%<br />
Total<br />
Revenue Summary 20,219,191 21,816,599 0 0 0 0 0.00%<br />
Transfers Out<br />
General Fund 20,105,658 21,018,607 0 0 0 0 0.00%<br />
Banc Of America Notes Debt Service Fund 675,000 0 0 0 0 0 0.00%<br />
Capital Improvement Variable Rate Debt 2,455,000 0 0 0 0 0 0.00%<br />
General Capital Improvements 830,785 0 0 0 0 0 0.00%<br />
Total Transfers Out 24,066,443 21,018,607 0 0 0 0 0.00%<br />
Total 24,066,443 21,018,607 0 0 0 0 0.00%<br />
Increase/(Decrease) in Fund Balance (3,847,252) 797,992 0 0 0 0<br />
Beginning Balance 5,946,116 2,098,864 2,896,856 2,896,856 2,896,856 2,896,856<br />
Adju<strong>st</strong>ments 0 0 0 0 0 0<br />
Ending Balance 2,098,864 2,896,856 2,896,856 2,896,856 2,896,856 2,896,856<br />
This fund is presented for hi<strong>st</strong>orical purposes.<br />
87
City <<strong>st</strong>rong>of</<strong>st</strong>rong> St. Petersburg, Florida - FY 2012 Proposed Fiscal Plan<br />
Excise Tax Revenue (1007)<br />
This fund accounts for revenue used to fund the debt service for out<strong>st</strong>anding Excise Tax Secured Revenue Bonds. Once the debt service obligation is met, the<br />
remaining revenue goes directly to the General Fund. It was e<strong>st</strong>ablished in the Series 1984 Bonds.<br />
FY 2009<br />
Actual<br />
FY 2010<br />
Actual<br />
FY 2011<br />
Adopted<br />
FY 2011<br />
Amended<br />
FY 2011<br />
E<strong>st</strong>imated<br />
FY 2012<br />
Proposed<br />
FY 2012<br />
Change<br />
Revenue Summary<br />
Intergovernmental Revenue<br />
State Shared Revenue 15,169,135 14,996,314 0 0 0 0 0.00%<br />
Shared Revenue 4,691,881 4,502,390 0 0 0 0 0.00%<br />
Total Intergovernmental Revenue 19,861,016 19,498,704 0 0 0 0 0.00%<br />
Misc Revenues<br />
Intere<strong>st</strong> Earnings 5,991 0 0 0 0 0 0.00%<br />
Total Misc Revenues 5,991 0 0 0 0 0 0.00%<br />
Transfer In<br />
Community Development Block Grant 0 0 270,785 270,785 0 0 (100.00%)<br />
Total Transfer In 0 0 270,785 270,785 0 0 (100.00%)<br />
Total<br />
Revenue Summary 19,867,007 19,498,704 270,785 270,785 0 0 (100.00%)<br />
Transfers Out<br />
General Fund 11,574,243 11,224,566 831,495 831,495 831,495 1,431,495 72.16%<br />
Stadium Debt Service 8,535,489 8,541,112 0 0 0 0 0.00%<br />
General Capital Improvements 1,923,140 0 0 0 0 0 0.00%<br />
Total Transfers Out 22,032,872 19,765,678 831,495 831,495 831,495 1,431,495 72.16%<br />
Total 22,032,872 19,765,678 831,495 831,495 831,495 1,431,495 72.16%<br />
Increase/(Decrease) in Fund Balance (2,165,865) (266,974) (560,710) (560,710) (831,495) (1,431,495)<br />
Beginning Balance 4,705,895 2,540,030 2,327,663 2,327,663 2,327,663 1,496,168<br />
Adju<strong>st</strong>ments 0 54,607 0 0 0 0<br />
Ending Balance 2,540,030 2,327,663 1,766,953 1,766,953 1,496,168 64,673<br />
88
City <<strong>st</strong>rong>of</<strong>st</strong>rong> St. Petersburg, Florida - FY 2012 Proposed Fiscal Plan<br />
Emergency Medical Services (1009)<br />
The Emergency Medical Services Fund records pre-hospital advance life support/rescue activity and is funded by Pinellas County.<br />
FY 2009<br />
Actual<br />
FY 2010<br />
Actual<br />
FY 2011<br />
Adopted<br />
FY 2011<br />
Amended<br />
FY 2011<br />
E<strong>st</strong>imated<br />
FY 2012<br />
Proposed<br />
FY 2012<br />
Change<br />
Revenue Summary<br />
License And Permits<br />
Other License And Permits 0 50 0 0 0 0 0.00%<br />
Total License And Permits 0 50 0 0 0 0 0.00%<br />
Intergovernmental Revenue<br />
Federal Grants 1,952 0 0 319,960 623,000 0 0.00%<br />
State Shared Revenue 22,133 16,606 16,920 16,920 16,920 23,040 36.17%<br />
Total Intergovernmental Revenue 24,085 16,606 16,920 336,880 639,920 23,040 36.17%<br />
Charges For Services<br />
Public Safety 13,245,452 11,928,766 11,957,439 11,957,439 11,942,423 12,391,108 3.63%<br />
Other Charges For Services 744 3,840 0 0 5 0 0.00%<br />
Total Charges For Services 13,246,196 11,932,606 11,957,439 11,957,439 11,942,428 12,391,108 3.63%<br />
Misc Revenues<br />
Intere<strong>st</strong> Earnings 909 699 3,000 3,000 101 0 (100.00%)<br />
Sale Of Fixed Assets 5,194 0 0 0 10,465 0 0.00%<br />
Contributions And Donations 45 0 0 0 100 0 0.00%<br />
Misc Revenue (276) (696) 0 0 (25) 0 0.00%<br />
Total Misc Revenues 5,872 3 3,000 3,000 10,641 0 (100.00%)<br />
Total<br />
Revenue Summary 13,276,153 11,949,265 11,977,359 12,297,319 12,592,989 12,414,148 3.65%<br />
Appropriations<br />
FY 2009<br />
Actual<br />
FY 2010<br />
Actual<br />
FY 2011<br />
Adopted<br />
FY 2011<br />
Amended<br />
FY 2011<br />
E<strong>st</strong>imated<br />
FY 2012<br />
Proposed<br />
FY 2012<br />
Change<br />
Wages And Benefits 11,427,962 11,135,627 11,704,892 11,704,892 11,146,739 11,356,803 (2.97%)<br />
Services And Commodities 829,400 789,665 886,910 929,058 860,506 985,891 11.16%<br />
Capital 416,417 598,080 0 322,542 300,000 0 0.00%<br />
Transfers Out<br />
General Fund 0 0 0 6,950 0 0 0.00%<br />
Total Transfers Out 0 0 0 6,950 0 0 0.00%<br />
Total<br />
Appropriations 12,673,779 12,523,372 12,591,802 12,963,442 12,307,245 12,342,694 (1.98%)<br />
Increase/(Decrease) in Fund Balance 602,374 (574,107) (614,443) (666,123) 285,744 71,454<br />
Beginning Balance 766,646 1,798,392 1,224,285 1,224,285 1,224,285 1,554,758<br />
Adju<strong>st</strong>ments 429,372 0 0 44,729 44,729 0<br />
Ending Balance 1,798,392 1,224,285 609,842 602,891 1,554,758 1,626,212<br />
89
City <<strong>st</strong>rong>of</<strong>st</strong>rong> St. Petersburg, Florida - FY 2012 Proposed Fiscal Plan<br />
American Recovery & Reinve<strong>st</strong>ment Act (1017)<br />
This fund, e<strong>st</strong>ablished in FY09, accounts for revenue received under the American Recovery and Reinve<strong>st</strong>ment Act (ARRA) for HUD programs under the<br />
Homelessness Prevention and Rapid Re-Housing (HPRP) program and the Community Development Block Grant - Recovery (CDBG-R) program that assi<strong>st</strong><br />
persons experiencing homelessness and to provide funding for community infra<strong>st</strong>ructure improvements. The funds under these programs are intended to provide<br />
financial assi<strong>st</strong>ance and services to individuals and families who are experiencing homelessness to be quickly re-housed and <strong>st</strong>abilized, and fund <<strong>st</strong>rong>city</<strong>st</strong>rong> infra<strong>st</strong>ructure<br />
projects that provide essential services to all citizens. The HPRP funds assi<strong>st</strong> in numerous ways, including: short-term or medium-term rental assi<strong>st</strong>ance and<br />
housing relocation and <strong>st</strong>abilization services, including such activities as mediation, credit counseling, security or utility deposits, utility payments, moving co<strong>st</strong><br />
assi<strong>st</strong>ance, and case management.<br />
FY 2009<br />
Actual<br />
FY 2010<br />
Actual<br />
FY 2011<br />
Adopted<br />
FY 2011<br />
Amended<br />
FY 2011<br />
E<strong>st</strong>imated<br />
FY 2012<br />
Proposed<br />
FY 2012<br />
Change<br />
Revenue Summary<br />
Intergovernmental Revenue<br />
Federal Grants 5,970 607,867 0 0 720,543 0 0.00%<br />
Total Intergovernmental Revenue 5,970 607,867 0 0 720,543 0 0.00%<br />
Total<br />
Revenue Summary 5,970 607,867 0 0 720,543 0 0.00%<br />
Appropriations<br />
FY 2009<br />
Actual<br />
FY 2010<br />
Actual<br />
FY 2011<br />
Adopted<br />
FY 2011<br />
Amended<br />
FY 2011<br />
E<strong>st</strong>imated<br />
FY 2012<br />
Proposed<br />
FY 2012<br />
Change<br />
Wages And Benefits 5,597 107,713 0 0 3,524 0 0.00%<br />
Services And Commodities 365 442,084 0 0 52,211 0 0.00%<br />
Capital 8 460,664 0 1,223,489 262,215 0 0.00%<br />
Total<br />
Appropriations 5,970 1,010,461 0 1,223,489 317,950 0 0.00%<br />
Increase/(Decrease) in Fund Balance 0 (402,594) 0 (1,223,489) 402,593 0<br />
Beginning Balance 0 0 (402,594) (402,594) (402,594) 319,246<br />
Adju<strong>st</strong>ments 0 0 0 319,247 319,247 0<br />
Ending Balance 0 (402,594) (402,594) (1,306,836) 319,246 319,246<br />
90
City <<strong>st</strong>rong>of</<strong>st</strong>rong> St. Petersburg, Florida - FY 2012 Proposed Fiscal Plan<br />
Local Housing Assi<strong>st</strong>ance (1019)<br />
This fund accounts for revenue received under the State Housing Initiatives Partnership Program (SHIP) to produce and preserve affordable housing in St.<br />
Petersburg for low- to moderate-income earning households (Ordinance 90-G).<br />
FY 2009<br />
Actual<br />
FY 2010<br />
Actual<br />
FY 2011<br />
Adopted<br />
FY 2011<br />
Amended<br />
FY 2011<br />
E<strong>st</strong>imated<br />
FY 2012<br />
Proposed<br />
FY 2012<br />
Change<br />
Revenue Summary<br />
Intergovernmental Revenue<br />
State Grants 132,145 89,765 0 0 0 0 0.00%<br />
State Shared Revenue 2,113,444 0 0 0 0 0 0.00%<br />
Total Intergovernmental Revenue 2,245,589 89,765 0 0 0 0 0.00%<br />
Fines And Forfeitures<br />
Violation Of Local Ordinances 946 1,257 0 0 696 0 0.00%<br />
Total Fines And Forfeitures 946 1,257 0 0 696 0 0.00%<br />
Misc Revenues<br />
Intere<strong>st</strong> Earnings 453,107 286,551 10,000 10,000 39,015 3,972 (60.28%)<br />
Misc Revenue 434,010 297,692 390,000 390,000 360,850 496,028 27.19%<br />
Total Misc Revenues 887,117 584,243 400,000 400,000 399,865 500,000 25.00%<br />
Total<br />
Revenue Summary 3,133,652 675,265 400,000 400,000 400,561 500,000 25.00%<br />
Appropriations<br />
FY 2009<br />
Actual<br />
FY 2010<br />
Actual<br />
FY 2011<br />
Adopted<br />
FY 2011<br />
Amended<br />
FY 2011<br />
E<strong>st</strong>imated<br />
FY 2012<br />
Proposed<br />
FY 2012<br />
Change<br />
Wages And Benefits 275,556 94,270 19,256 19,256 0 53,350 177.06%<br />
Services And Commodities 2,381,176 3,216,142 380,744 3,286,931 3,031,602 446,650 17.31%<br />
Total<br />
Appropriations 2,656,732 3,310,412 400,000 3,306,187 3,031,602 500,000 25.00%<br />
Increase/(Decrease) in Fund Balance 476,920 (2,635,147) 0 (2,906,187) (2,631,041) 0<br />
Beginning Balance 4,982,194 5,460,496 2,631,042 2,631,042 2,631,042 4,228<br />
Adju<strong>st</strong>ments 1,382 (194,307) 0 4,227 4,227 0<br />
Ending Balance 5,460,496 2,631,042 2,631,042 (270,918) 4,228 4,228<br />
Due to <strong>st</strong>ate <strong>budget</strong> con<strong>st</strong>raints, no new funds for the SHIP program have been appropriated since FY09.<br />
91
City <<strong>st</strong>rong>of</<strong>st</strong>rong> St. Petersburg, Florida - FY 2012 Proposed Fiscal Plan<br />
Parking Revenue (1021)<br />
The Parking Fund accounts for the operation <<strong>st</strong>rong>of</<strong>st</strong>rong> City parking facilities. Its revenue is pledged for Tax Increment Financing (TIF) and other debt. It was<br />
e<strong>st</strong>ablished in the Series 1988A Bonds. Because <<strong>st</strong>rong>of</<strong>st</strong>rong> the new GASB 54 requirements, this fund was reclassified from a Special Revenue Fund to an Enterprise<br />
Fund in FY11.<br />
FY 2009<br />
Actual<br />
FY 2010<br />
Actual<br />
FY 2011<br />
Adopted<br />
FY 2011<br />
Amended<br />
FY 2011<br />
E<strong>st</strong>imated<br />
FY 2012<br />
Proposed<br />
FY 2012<br />
Change<br />
Revenue Summary<br />
License And Permits<br />
Other License And Permits 3,790 4,250 0 0 2,853 0 0.00%<br />
Total License And Permits 3,790 4,250 0 0 2,853 0 0.00%<br />
Charges For Services<br />
Transportation Charges 3,169,794 3,141,838 3,164,714 3,164,714 3,114,661 4,049,714 27.96%<br />
Other Charges For Services 9,827 9,453 0 0 0 0 0.00%<br />
Total Charges For Services 3,179,621 3,151,291 3,164,714 3,164,714 3,114,661 4,049,714 27.96%<br />
Fines And Forfeitures<br />
Traffic And Parking 1,571,864 1,577,518 1,476,000 1,476,000 1,731,025 1,370,000 (7.18%)<br />
Violation Of Local Ordinances 430 510 441 441 430 441 0.00%<br />
Total Fines And Forfeitures 1,572,294 1,578,028 1,476,441 1,476,441 1,731,455 1,370,441 (7.18%)<br />
Misc Revenues<br />
Intere<strong>st</strong> Earnings 153 406 0 0 130 0 0.00%<br />
Rents And Royalties 62,556 64,109 0 0 9,030 30,000 0.00%<br />
Sale Of Fixed Assets 0 6,327 0 0 0 0 0.00%<br />
Misc Revenue (223,423) (290,089) (200,000) (200,000) (122,003) (200,000) 0.00%<br />
Total Misc Revenues (160,714) (219,247) (200,000) (200,000) (112,843) (170,000) (15.00%)<br />
Internal Charges<br />
Other Charges (169) (104) 12 12 (117) 12 0.00%<br />
Total Internal Charges (169) (104) 12 12 (117) 12 0.00%<br />
Total<br />
Revenue Summary 4,594,822 4,514,218 4,441,167 4,441,167 4,736,009 5,250,167 18.22%<br />
Appropriations<br />
FY 2009<br />
Actual<br />
FY 2010<br />
Actual<br />
FY 2011<br />
Adopted<br />
FY 2011<br />
Amended<br />
FY 2011<br />
E<strong>st</strong>imated<br />
FY 2012<br />
Proposed<br />
FY 2012<br />
Change<br />
Wages And Benefits 889,511 1,624,296 2,192,851 2,192,851 2,206,803 2,103,621 (4.07%)<br />
Services And Commodities 3,269,551 2,302,702 2,096,868 2,092,480 1,887,712 2,241,594 6.90%<br />
Capital (274) 78,875 0 0 34,843 0 0.00%<br />
Transfers Out<br />
General Fund 17,456 15,000 122,896 122,896 122,896 427,476 247.84%<br />
Downtown Parking Improvement 106,251 250,000 105,000 105,000 105,000 0 (100.00%)<br />
Total Transfers Out 123,707 265,000 227,896 227,896 227,896 427,476 87.58%<br />
Total<br />
Appropriations 4,282,495 4,270,873 4,517,615 4,513,227 4,357,254 4,772,691 5.65%<br />
Increase/(Decrease) in Fund Balance 312,327 243,345 (76,448) (72,060) 378,755 477,476<br />
Beginning Balance (37,074) 278,740 524,000 524,000 524,000 902,755<br />
Adju<strong>st</strong>ments 3,487 1,915 0 0 0 0<br />
92
City <<strong>st</strong>rong>of</<strong>st</strong>rong> St. Petersburg, Florida - FY 2012 Proposed Fiscal Plan<br />
Ending Balance 278,740 524,000 447,552 451,940 902,755 1,380,231<br />
In FY12, revenues are expected to increase by 18.22%. The increase is mainly due to an increase in parking meter rates (from $0.75 to $1.00 per hour), an<br />
increase in the price <<strong>st</strong>rong>of</<strong>st</strong>rong> parking tickets by $5.00 for red zone parking tickets ($50,000), and from additional parking meters in the downtown area ($210,000).<br />
Expenditures will increased by 5.65% in FY12. This is mainly due to an increase in the transfer to the General Fund as a Return on Inve<strong>st</strong>ment (ROI) payment in<br />
the amount <<strong>st</strong>rong>of</<strong>st</strong>rong> $304,580 and $90,420 in Payment In Lieu <<strong>st</strong>rong>of</<strong>st</strong>rong> Taxes.<br />
A portion <<strong>st</strong>rong>of</<strong>st</strong>rong> the fund balance ($130,520) is designated for handicapped projects by the Committee to Advocate Persons with Impairments (CAPI).<br />
93
City <<strong>st</strong>rong>of</<strong>st</strong>rong> St. Petersburg, Florida - FY 2012 Proposed Fiscal Plan<br />
Law Enforcement Tru<strong>st</strong> (1023)<br />
The Law Enforcement Tru<strong>st</strong> Fund records revenue from the forfeiture and seizure <<strong>st</strong>rong>of</<strong>st</strong>rong> property. Its use is re<strong>st</strong>ricted by <strong>st</strong>ate <strong>st</strong>atute. Revenues are not projected for<br />
this fund and are only <strong>budget</strong>ed subsequent to receipt from available fund balance.<br />
FY 2009<br />
Actual<br />
FY 2010<br />
Actual<br />
FY 2011<br />
Adopted<br />
FY 2011<br />
Amended<br />
FY 2011<br />
E<strong>st</strong>imated<br />
FY 2012<br />
Proposed<br />
FY 2012<br />
Change<br />
Revenue Summary<br />
Intergovernmental Revenue<br />
Federal Grants 28,340 0 0 0 0 0 0.00%<br />
Total Intergovernmental Revenue 28,340 0 0 0 0 0 0.00%<br />
Fines And Forfeitures<br />
Traffic And Parking 402,687 964,935 0 0 217,631 0 0.00%<br />
Total Fines And Forfeitures 402,687 964,935 0 0 217,631 0 0.00%<br />
Misc Revenues<br />
Intere<strong>st</strong> Earnings 5,821 1,204 0 0 324 0 0.00%<br />
Misc Revenue 5,000 0 0 0 0 0 0.00%<br />
Total Misc Revenues 10,821 1,204 0 0 324 0 0.00%<br />
Total<br />
Revenue Summary 441,848 966,139 0 0 217,955 0 0.00%<br />
Appropriations<br />
FY 2009<br />
Actual<br />
FY 2010<br />
Actual<br />
FY 2011<br />
Adopted<br />
FY 2011<br />
Amended<br />
FY 2011<br />
E<strong>st</strong>imated<br />
FY 2012<br />
Proposed<br />
FY 2012<br />
Change<br />
Services And Commodities 129,651 419,872 192,994 474,599 466,109 186,335 (3.45%)<br />
Capital 214,838 42,715 0 56,266 10,508 0 0.00%<br />
Grants And Aid 33,949 34,820 0 85,289 40,724 0 0.00%<br />
Transfers Out<br />
General Fund 42,809 0 0 0 0 0 0.00%<br />
Total Transfers Out 42,809 0 0 0 0 0 0.00%<br />
Total<br />
Appropriations 421,247 497,407 192,994 616,154 517,341 186,335 (3.45%)<br />
Increase/(Decrease) in Fund Balance 20,601 468,732 (192,994) (616,154) (299,386) (186,335)<br />
Beginning Balance 858,679 880,839 1,341,000 1,341,000 1,341,000 1,092,092<br />
Adju<strong>st</strong>ments 1,559 (8,571) 0 50,478 50,478 0<br />
Ending Balance 880,839 1,341,000 1,148,006 775,324 1,092,092 905,757<br />
During FY11, a supplemental appropriation was approved for the FY11 Forfeiture Fund Award Program ($39,986).<br />
94
City <<strong>st</strong>rong>of</<strong>st</strong>rong> St. Petersburg, Florida - FY 2012 Proposed Fiscal Plan<br />
School Crossing Guard Tru<strong>st</strong> (1025)<br />
This fund records the revenue collected from the parking ticket surcharge. It is then transferred to the General Fund to reimburse the co<strong>st</strong> <<strong>st</strong>rong>of</<strong>st</strong>rong> the program (F.S.<br />
318.21(11)(b)).<br />
FY 2009<br />
Actual<br />
FY 2010<br />
Actual<br />
FY 2011<br />
Adopted<br />
FY 2011<br />
Amended<br />
FY 2011<br />
E<strong>st</strong>imated<br />
FY 2012<br />
Proposed<br />
FY 2012<br />
Change<br />
Revenue Summary<br />
Fines And Forfeitures<br />
Traffic And Parking 399,303 387,808 300,000 300,000 300,000 300,000 0.00%<br />
Total Fines And Forfeitures 399,303 387,808 300,000 300,000 300,000 300,000 0.00%<br />
Misc Revenues<br />
Intere<strong>st</strong> Earnings 1,339 39 0 0 5 0 0.00%<br />
Misc Revenue (30,000) (35,000) 0 0 0 0 0.00%<br />
Total Misc Revenues (28,661) (34,961) 0 0 5 0 0.00%<br />
Total<br />
Revenue Summary 370,642 352,847 300,000 300,000 300,005 300,000 0.00%<br />
Transfers Out<br />
General Fund 658,542 355,437 300,000 300,000 300,000 300,000 0.00%<br />
Total Transfers Out 658,542 355,437 300,000 300,000 300,000 300,000 0.00%<br />
Total 658,542 355,437 300,000 300,000 300,000 300,000 0.00%<br />
Increase/(Decrease) in Fund Balance (287,900) (2,590) 0 0 5 0<br />
Beginning Balance 333,079 45,179 42,589 42,589 42,589 42,594<br />
Adju<strong>st</strong>ments 0 0 0 0 0 0<br />
Ending Balance 45,179 42,589 42,589 42,589 42,594 42,594<br />
95
City <<strong>st</strong>rong>of</<strong>st</strong>rong> St. Petersburg, Florida - FY 2012 Proposed Fiscal Plan<br />
Weeki Wachee (1041)<br />
This fund was e<strong>st</strong>ablished during FY01 (Ordinance 530-G). In 1940, the City <<strong>st</strong>rong>of</<strong>st</strong>rong> St. Petersburg acquired property in Weeki Wachee Springs, Florida, as a potential<br />
future water source. For both economic and environmental reasons, this use was impractical and ultimately unachievable. On March 23, 1999, City voters<br />
approved a referendum authorizing the sale <<strong>st</strong>rong>of</<strong>st</strong>rong> the property. The referendum required that "any sale proceeds shall be deposited in an account from which monies<br />
can only be expended for parks, recreational, preservation and beautification purposes." Revenue will be transferred to other funds for <strong>capital</strong> or <strong>operating</strong><br />
expenses as authorized in the referendum approving the sale.<br />
FY 2009<br />
Actual<br />
FY 2010<br />
Actual<br />
FY 2011<br />
Adopted<br />
FY 2011<br />
Amended<br />
FY 2011<br />
E<strong>st</strong>imated<br />
FY 2012<br />
Proposed<br />
FY 2012<br />
Change<br />
Revenue Summary<br />
Misc Revenues<br />
Intere<strong>st</strong> Earnings 1,116,762 653,599 300,000 300,000 180,000 119,160 (60.28%)<br />
Total Misc Revenues 1,116,762 653,599 300,000 300,000 180,000 119,160 (60.28%)<br />
Transfer In<br />
Weeki Wachee Capital Improvements 155,000 0 0 0 0 0 0.00%<br />
Total Transfer In 155,000 0 0 0 0 0 0.00%<br />
Total<br />
Revenue Summary 1,271,762 653,599 300,000 300,000 180,000 119,160 (60.28%)<br />
Appropriations<br />
FY 2009<br />
Actual<br />
FY 2010<br />
Actual<br />
FY 2011<br />
Adopted<br />
FY 2011<br />
Amended<br />
FY 2011<br />
E<strong>st</strong>imated<br />
FY 2012<br />
Proposed<br />
FY 2012<br />
Change<br />
Services And Commodities 58,941 75,871 60,000 60,000 60,084 80,000 33.33%<br />
Transfers Out<br />
General Fund 47,766 0 0 0 0 20,000 0.00%<br />
Weeki Wachee Capital Improvements 0 0 0 1,682,000 1,682,000 0 0.00%<br />
Total Transfers Out 47,766 0 0 1,682,000 1,682,000 20,000 0.00%<br />
Total<br />
Appropriations 106,707 75,871 60,000 1,742,000 1,742,084 100,000 66.67%<br />
Increase/(Decrease) in Fund Balance 1,165,055 577,728 240,000 (1,442,000) (1,562,084) 19,160<br />
Beginning Balance 14,709,620 15,874,677 14,802,496 14,802,496 14,802,496 13,240,412<br />
Adju<strong>st</strong>ments 2 (1,649,909) 0 0 0 0<br />
Ending Balance 15,874,677 14,802,496 15,042,496 13,360,496 13,240,412 13,259,572<br />
Appropriations from the Weeki Wachee fund in FY12 include support for inve<strong>st</strong>ment management services and a transfer to the General Fund to support Weeki<br />
Wachee project maintenance.<br />
96
City <<strong>st</strong>rong>of</<strong>st</strong>rong> St. Petersburg, Florida - FY 2012 Proposed Fiscal Plan<br />
Arts And Cultural Programs (1042)<br />
This fund was e<strong>st</strong>ablished in 2009 (Ordinance 865-G) and shall be used only to provide City matching funds for grants and donations for art and cultural programs<br />
within the City, or to support art and cultural organizations located within the City.<br />
FY 2009<br />
Actual<br />
FY 2010<br />
Actual<br />
FY 2011<br />
Adopted<br />
FY 2011<br />
Amended<br />
FY 2011<br />
E<strong>st</strong>imated<br />
FY 2012<br />
Proposed<br />
FY 2012<br />
Change<br />
Revenue Summary<br />
Misc Revenues<br />
Intere<strong>st</strong> Earnings 53 87 0 0 19 0 0.00%<br />
Total Misc Revenues 53 87 0 0 19 0 0.00%<br />
Transfer In<br />
General Fund 99,996 0 0 0 0 0 0.00%<br />
Total Transfer In 99,996 0 0 0 0 0 0.00%<br />
Total<br />
Revenue Summary 100,049 87 0 0 19 0 0.00%<br />
Increase/(Decrease) in Fund Balance 100,049 87 0 0 19 0<br />
Beginning Balance 0 100,049 100,136 100,136 100,136 100,155<br />
Adju<strong>st</strong>ments 0 0 0 0 0 0<br />
Ending Balance 100,049 100,136 100,136 100,136 100,155 100,155<br />
97
City <<strong>st</strong>rong>of</<strong>st</strong>rong> St. Petersburg, Florida - FY 2012 Proposed Fiscal Plan<br />
Pro Sports Facility (1051)<br />
The Pro Sports Facility Fund accounts for revenue used to support debt service for Pr<<strong>st</strong>rong>of</<strong>st</strong>rong>essional Sports Facility Sales Tax Revenue Bonds (F.S. 125.0104).<br />
FY 2009<br />
Actual<br />
FY 2010<br />
Actual<br />
FY 2011<br />
Adopted<br />
FY 2011<br />
Amended<br />
FY 2011<br />
E<strong>st</strong>imated<br />
FY 2012<br />
Proposed<br />
FY 2012<br />
Change<br />
Revenue Summary<br />
Intergovernmental Revenue<br />
State Shared Revenue 2,000,004 2,000,004 2,000,000 2,000,000 2,000,000 2,000,000 0.00%<br />
Total Intergovernmental Revenue 2,000,004 2,000,004 2,000,000 2,000,000 2,000,000 2,000,000 0.00%<br />
Misc Revenues<br />
Intere<strong>st</strong> Earnings 1,305 44 10,000 10,000 2 3,972 (60.28%)<br />
Total Misc Revenues 1,305 44 10,000 10,000 2 3,972 (60.28%)<br />
Total<br />
Revenue Summary 2,001,309 2,000,048 2,010,000 2,010,000 2,000,002 2,003,972 (0.30%)<br />
Transfers Out<br />
Ffgfc Loan 76,375 71,529 78,754 78,754 78,754 71,234 (9.55%)<br />
Sports Facility Sales Tax Debt 1,923,629 1,928,475 1,921,250 1,921,250 1,921,250 1,928,770 0.39%<br />
Total Transfers Out 2,000,004 2,000,004 2,000,004 2,000,004 2,000,004 2,000,004 0.00%<br />
Total 2,000,004 2,000,004 2,000,004 2,000,004 2,000,004 2,000,004 0.00%<br />
Increase/(Decrease) in Fund Balance 1,305 44 9,996 9,996 (2) 3,968<br />
Beginning Balance 12,480 13,785 13,829 13,829 13,829 13,827<br />
Adju<strong>st</strong>ments 0 0 0 0 0 0<br />
Ending Balance 13,785 13,829 23,825 23,825 13,827 17,795<br />
98
City <<strong>st</strong>rong>of</<strong>st</strong>rong> St. Petersburg, Florida - FY 2012 Proposed Fiscal Plan<br />
Economic Development (1101)<br />
This fund accounts for revenue received for Brownfields Grant programs. This fund was closed in FY11.<br />
FY 2009<br />
Actual<br />
FY 2010<br />
Actual<br />
FY 2011<br />
Adopted<br />
FY 2011<br />
Amended<br />
FY 2011<br />
E<strong>st</strong>imated<br />
FY 2012<br />
Proposed<br />
FY 2012<br />
Change<br />
Transfers Out<br />
General Capital Improvements 0 12,636 0 0 0 0 0.00%<br />
Total Transfers Out 0 12,636 0 0 0 0 0.00%<br />
Total 0 12,636 0 0 0 0 0.00%<br />
Increase/(Decrease) in Fund Balance 0 (12,636) 0 0 0 0<br />
Beginning Balance 12,636 12,636 0 0 0 0<br />
Adju<strong>st</strong>ments 0 0 0 0 0 0<br />
Ending Balance 12,636 0 0 0 0 0<br />
This page is shown for hi<strong>st</strong>orical purposes only. The City has received three Brownfield grants. The fir<strong>st</strong> grant ($200,000) was for an environmental assessment<br />
on the Dome Indu<strong>st</strong>rial Park (formerly the Business Retention Target Area). The second grant ($350,000) was the Brownfields Cleanup Revolving Loan (CURL)<br />
Program, which was intended to provide an incentive for commercial and indu<strong>st</strong>rial property owners to conduct environmental cleanups in the Dome Indu<strong>st</strong>rial<br />
Park area. These two grants were awarded from the U.S. Environmental Agency. The third grant ($500,000) was a continuation <<strong>st</strong>rong>of</<strong>st</strong>rong> the Brownfields CURL<br />
Program and was provided by the State Office <<strong>st</strong>rong>of</<strong>st</strong>rong> Tourism, Trade and Economic Development (OTTED).<br />
99
City <<strong>st</strong>rong>of</<strong>st</strong>rong> St. Petersburg, Florida - FY 2012 Proposed Fiscal Plan<br />
Downtown Redevelopment Di<strong>st</strong>rict (1105)<br />
This fund accounts for revenue used to fund the debt service for out<strong>st</strong>anding Public Improvement Revenue Bonds. It was e<strong>st</strong>ablished in the Series 1988A Bonds.<br />
FY 2009<br />
Actual<br />
FY 2010<br />
Actual<br />
FY 2011<br />
Adopted<br />
FY 2011<br />
Amended<br />
FY 2011<br />
E<strong>st</strong>imated<br />
FY 2012<br />
Proposed<br />
FY 2012<br />
Change<br />
Revenue Summary<br />
Misc Revenues<br />
Intere<strong>st</strong> Earnings 138,342 116,353 0 0 49,818 0 0.00%<br />
Total Misc Revenues 138,342 116,353 0 0 49,818 0 0.00%<br />
Transfer In<br />
Community Redevelopment Di<strong>st</strong>rict 9,259,610 8,213,827 6,712,750 6,712,750 6,712,750 6,703,500 (0.14%)<br />
Total Transfer In 9,259,610 8,213,827 6,712,750 6,712,750 6,712,750 6,703,500 (0.14%)<br />
Debt & Loan Proceeds<br />
Debt Proceeds 0 0 0 0 4,520,000 0 0.00%<br />
Total Debt & Loan Proceeds 0 0 0 0 4,520,000 0 0.00%<br />
Total<br />
Revenue Summary 9,397,952 8,330,180 6,712,750 6,712,750 11,282,568 6,703,500 (0.14%)<br />
Appropriations<br />
FY 2009<br />
Actual<br />
FY 2010<br />
Actual<br />
FY 2011<br />
Adopted<br />
FY 2011<br />
Amended<br />
FY 2011<br />
E<strong>st</strong>imated<br />
FY 2012<br />
Proposed<br />
FY 2012<br />
Change<br />
Debt 0 0 0 42,000 36,126 0 0.00%<br />
Transfers Out<br />
Banc Of America Notes Debt Service Fund 820,979 820,979 820,979 820,979 820,979 823,228 0.27%<br />
Bb&T Notes 0 0 0 29,000 29,000 642,396 0.00%<br />
Redevelopment Debt Service 4,824,718 6,680,875 6,712,750 6,712,750 6,712,750 6,703,500 (0.14%)<br />
General Capital Improvements 0 3,027,000 0 4,478,706 4,478,706 0 0.00%<br />
Total Transfers Out 5,645,697 10,528,854 7,533,729 12,041,435 12,041,435 8,169,124 8.43%<br />
Total<br />
Appropriations 5,645,697 10,528,854 7,533,729 12,083,435 12,077,561 8,169,124 8.43%<br />
Increase/(Decrease) in Fund Balance 3,752,255 (2,198,674) (820,979) (5,370,685) (794,993) (1,465,624)<br />
Beginning Balance 1,096,565 4,834,336 2,635,662 2,635,662 2,635,662 1,840,669<br />
Adju<strong>st</strong>ments (14,484) 0 0 0 0 0<br />
Ending Balance 4,834,336 2,635,662 1,814,683 (2,735,023) 1,840,669 375,045<br />
100
City <<strong>st</strong>rong>of</<strong>st</strong>rong> St. Petersburg, Florida - FY 2012 Proposed Fiscal Plan<br />
Bayboro Harbor Tax Increment Di<strong>st</strong>rict (1106)<br />
The Community Redevelopment Agency (CRA) was e<strong>st</strong>ablished under Florida Law to act as the Redevelopment Agency for all Redevelopment Di<strong>st</strong>ricts. The St.<br />
Petersburg City Council is the governing body <<strong>st</strong>rong>of</<strong>st</strong>rong> the CRA and conducts business as the CRA in sessions that are separate from the regular Council meetings.<br />
State regulations require the inclusion <<strong>st</strong>rong>of</<strong>st</strong>rong> all dependent di<strong>st</strong>ricts in local government <strong>budget</strong>s. The fund balance is the amount available for di<strong>st</strong>ricts than the<br />
Bayboro Harbor Di<strong>st</strong>rict. This fund receives the City and County tax increment financing (TIF) payments for the Bayboro Harbor Di<strong>st</strong>rict that is an e<strong>st</strong>ablished<br />
tax management di<strong>st</strong>rict. Prior to FY10, these TIF payments were recorded in the CRA Tax Increment Fund. The amount accumulated for this di<strong>st</strong>rict was<br />
transferred in FY10.<br />
FY 2009<br />
Actual<br />
FY 2010<br />
Actual<br />
FY 2011<br />
Adopted<br />
FY 2011<br />
Amended<br />
FY 2011<br />
E<strong>st</strong>imated<br />
FY 2012<br />
Proposed<br />
FY 2012<br />
Change<br />
Revenue Summary<br />
Intergovernmental Revenue<br />
Shared Revenue 0 0 95,458 95,458 95,458 37,419 (60.80%)<br />
Total Intergovernmental Revenue 0 0 95,458 95,458 95,458 37,419 (60.80%)<br />
Misc Revenues<br />
Intere<strong>st</strong> Earnings 0 107 0 0 29 0 0.00%<br />
Total Misc Revenues 0 107 0 0 29 0 0.00%<br />
Transfer In<br />
Community Redevelopment Di<strong>st</strong>rict 0 151,556 0 0 0 0 0.00%<br />
Total Transfer In 0 151,556 0 0 0 0 0.00%<br />
Total<br />
Revenue Summary 0 151,663 95,458 95,458 95,487 37,419 (60.80%)<br />
Increase/(Decrease) in Fund Balance 0 151,663 95,458 95,458 95,487 37,419<br />
Beginning Balance 0 0 151,663 151,663 151,663 247,150<br />
Adju<strong>st</strong>ments 0 0 0 0 0 0<br />
Ending Balance 0 151,663 247,121 247,121 247,150 284,569<br />
101
City <<strong>st</strong>rong>of</<strong>st</strong>rong> St. Petersburg, Florida - FY 2012 Proposed Fiscal Plan<br />
Intown We<strong>st</strong> Tax Increment Di<strong>st</strong>rict (1107)<br />
The Community Redevelopment Agency (CRA) was e<strong>st</strong>ablished under Florida Law to act as the Redevelopment Agency for all Redevelopment Di<strong>st</strong>ricts. The St.<br />
Petersburg City Council is the governing body <<strong>st</strong>rong>of</<strong>st</strong>rong> the CRA and conducts business as the CRA in sessions that are separate from the regular Council meetings.<br />
State regulations require the inclusion <<strong>st</strong>rong>of</<strong>st</strong>rong> all dependent di<strong>st</strong>ricts in local government <strong>budget</strong>s. The fund balance is the amount available for di<strong>st</strong>ricts than the<br />
Intown We<strong>st</strong> Di<strong>st</strong>rict. This fund receives the City and County tax increment financing (TIF) payments for the Intown Di<strong>st</strong>rict that is an e<strong>st</strong>ablished tax<br />
management di<strong>st</strong>rict. Prior to FY10, these TIF payments were recorded in the CRA Tax Increment Fund. The amount accumulated for this di<strong>st</strong>rict was<br />
transferred in FY10.<br />
FY 2009<br />
Actual<br />
FY 2010<br />
Actual<br />
FY 2011<br />
Adopted<br />
FY 2011<br />
Amended<br />
FY 2011<br />
E<strong>st</strong>imated<br />
FY 2012<br />
Proposed<br />
FY 2012<br />
Change<br />
Revenue Summary<br />
Intergovernmental Revenue<br />
Shared Revenue 0 0 326,389 326,389 326,389 209,747 (35.74%)<br />
Total Intergovernmental Revenue 0 0 326,389 326,389 326,389 209,747 (35.74%)<br />
Misc Revenues<br />
Intere<strong>st</strong> Earnings 0 242 0 0 101 0 0.00%<br />
Total Misc Revenues 0 242 0 0 101 0 0.00%<br />
Transfer In<br />
Community Redevelopment Di<strong>st</strong>rict 0 502,176 0 0 0 0 0.00%<br />
Total Transfer In 0 502,176 0 0 0 0 0.00%<br />
Total<br />
Revenue Summary 0 502,418 326,389 326,389 326,490 209,747 (35.74%)<br />
Increase/(Decrease) in Fund Balance 0 502,418 326,389 326,389 326,490 209,747<br />
Beginning Balance 0 0 502,418 502,418 502,418 828,908<br />
Adju<strong>st</strong>ments 0 0 0 0 0 0<br />
Ending Balance 0 502,418 828,807 828,807 828,908 1,038,655<br />
102
City <<strong>st</strong>rong>of</<strong>st</strong>rong> St. Petersburg, Florida - FY 2012 Proposed Fiscal Plan<br />
Assessments Revenue (1108)<br />
This fund accounts for revenue from collection <<strong>st</strong>rong>of</<strong>st</strong>rong> principal and intere<strong>st</strong> on special assessments for <strong>capital</strong> improvements. Revenue is transferred to the General<br />
Capital Improvement Fund after collection expenses are paid to provide funding for <strong>capital</strong> projects.<br />
FY 2009<br />
Actual<br />
FY 2010<br />
Actual<br />
FY 2011<br />
Adopted<br />
FY 2011<br />
Amended<br />
FY 2011<br />
E<strong>st</strong>imated<br />
FY 2012<br />
Proposed<br />
FY 2012<br />
Change<br />
Revenue Summary<br />
Misc Revenues<br />
Intere<strong>st</strong> Earnings 37,535 32,445 40,000 40,000 8,794 15,888 (60.28%)<br />
Special Assessment 104,642 184,011 140,000 140,000 50,000 140,000 0.00%<br />
Misc Revenue 0 5,800 0 0 0 0 0.00%<br />
Total Misc Revenues 142,177 222,256 180,000 180,000 58,794 155,888 (13.40%)<br />
Total<br />
Revenue Summary 142,177 222,256 180,000 180,000 58,794 155,888 (13.40%)<br />
Appropriations<br />
FY 2009<br />
Actual<br />
FY 2010<br />
Actual<br />
FY 2011<br />
Adopted<br />
FY 2011<br />
Amended<br />
FY 2011<br />
E<strong>st</strong>imated<br />
FY 2012<br />
Proposed<br />
FY 2012<br />
Change<br />
Services And Commodities 230,232 177,156 166,126 166,126 55,376 98,131 (40.93%)<br />
Transfers Out<br />
General Capital Improvements 26,668 0 0 0 0 0 0.00%<br />
Total Transfers Out 26,668 0 0 0 0 0 0.00%<br />
Total<br />
Appropriations 256,900 177,156 166,126 166,126 55,376 98,131 (40.93%)<br />
Increase/(Decrease) in Fund Balance (114,723) 45,100 13,874 13,874 3,418 57,757<br />
Beginning Balance 140,380 25,657 70,757 70,757 70,757 74,175<br />
Adju<strong>st</strong>ments 0 0 0 0 0 0<br />
Ending Balance 25,657 70,757 84,631 84,631 74,175 131,932<br />
103
City <<strong>st</strong>rong>of</<strong>st</strong>rong> St. Petersburg, Florida - FY 2012 Proposed Fiscal Plan<br />
Community Development Block Grant (1111)<br />
This fund accounts for annual entitlement grant funds from the U.S. Department <<strong>st</strong>rong>of</<strong>st</strong>rong> Housing and Urban Development (HUD) that provide community block<br />
grants to expand economic opportunities, and provide decent housing and a suitable living environment principally for low- and moderate-income earning<br />
persons.<br />
FY 2009<br />
Actual<br />
FY 2010<br />
Actual<br />
FY 2011<br />
Adopted<br />
FY 2011<br />
Amended<br />
FY 2011<br />
E<strong>st</strong>imated<br />
FY 2012<br />
Proposed<br />
FY 2012<br />
Change<br />
Revenue Summary<br />
Intergovernmental Revenue<br />
Federal Grants 3,038,823 2,273,166 2,365,745 2,365,745 2,365,745 1,992,593 (15.77%)<br />
Total Intergovernmental Revenue 3,038,823 2,273,166 2,365,745 2,365,745 2,365,745 1,992,593 (15.77%)<br />
Fines And Forfeitures<br />
Violation Of Local Ordinances 501 1,090 0 0 187 0 0.00%<br />
Total Fines And Forfeitures 501 1,090 0 0 187 0 0.00%<br />
Misc Revenues<br />
Intere<strong>st</strong> Earnings 5,835 4,332 10,000 10,000 153 3,972 (60.28%)<br />
Rents And Royalties 24,031 22,983 0 0 4,417 0 0.00%<br />
Misc Revenue 126,393 108,059 140,000 140,000 9,365 96,028 (31.41%)<br />
Total Misc Revenues 156,259 135,374 150,000 150,000 13,935 100,000 (33.33%)<br />
Total<br />
Revenue Summary 3,195,583 2,409,630 2,515,745 2,515,745 2,379,867 2,092,593 (16.82%)<br />
Appropriations<br />
FY 2009<br />
Actual<br />
FY 2010<br />
Actual<br />
FY 2011<br />
Adopted<br />
FY 2011<br />
Amended<br />
FY 2011<br />
E<strong>st</strong>imated<br />
FY 2012<br />
Proposed<br />
FY 2012<br />
Change<br />
Wages And Benefits 856,080 808,956 939,752 939,752 577,369 790,745 (15.86%)<br />
Services And Commodities 756,787 734,775 747,361 3,431,547 2,181,532 521,417 (30.23%)<br />
Capital 1,193,520 (10,689) 0 (10,689) 0 0 0.00%<br />
Grants And Aid 0 8,258 0 0 528 0 0.00%<br />
Transfers Out<br />
General Fund 0 0 272,615 272,615 0 498,148 82.73%<br />
Franchise Tax Revenue 0 558,058 0 0 0 0 0.00%<br />
Excise Tax Revenue 0 0 270,785 270,785 0 0 (100.00%)<br />
Banc Of America Notes Debt Service Fund 285,605 283,095 285,232 285,232 233,583 282,283 (1.03%)<br />
Total Transfers Out 285,605 841,153 828,632 828,632 233,583 780,431 (5.82%)<br />
Total<br />
Appropriations 3,091,992 2,382,453 2,515,745 5,189,242 2,993,012 2,092,593 (16.82%)<br />
Increase/(Decrease) in Fund Balance 103,591 27,177 0 (2,673,497) (613,145) 0<br />
Beginning Balance 2,621,770 2,725,361 2,752,538 2,752,538 2,752,538 2,139,393<br />
Adju<strong>st</strong>ments 0 0 0 0 0 0<br />
Ending Balance 2,725,361 2,752,538 2,752,538 79,041 2,139,393 2,139,393<br />
The transfer to the General Fund is the repayment <<strong>st</strong>rong>of</<strong>st</strong>rong> funds advanced for the Jordan School Improvements project. The amount <<strong>st</strong>rong>of</<strong>st</strong>rong> the loan repayment is capped at<br />
25% <<strong>st</strong>rong>of</<strong>st</strong>rong> the current year grant revenue. There are scheduled in<strong>st</strong>allments in FY13 and FY14, and if necessary in FY15 until the loan is paid <<strong>st</strong>rong>of</<strong>st</strong>rong>f.<br />
104
City <<strong>st</strong>rong>of</<strong>st</strong>rong> St. Petersburg, Florida - FY 2012 Proposed Fiscal Plan<br />
Emergency Shelter Grant Fund (1112)<br />
This fund accounts for grant revenue from the U. S. Department <<strong>st</strong>rong>of</<strong>st</strong>rong> Housing and Urban Development to provide homeless persons with basic shelter and essential<br />
supportive services by assi<strong>st</strong>ing with the operational co<strong>st</strong>s <<strong>st</strong>rong>of</<strong>st</strong>rong> the shelter facilities.<br />
FY 2009<br />
Actual<br />
FY 2010<br />
Actual<br />
FY 2011<br />
Adopted<br />
FY 2011<br />
Amended<br />
FY 2011<br />
E<strong>st</strong>imated<br />
FY 2012<br />
Proposed<br />
FY 2012<br />
Change<br />
Revenue Summary<br />
Intergovernmental Revenue<br />
Federal Grants 0 0 0 0 2,156 97,039 0.00%<br />
Total Intergovernmental Revenue 0 0 0 0 2,156 97,039 0.00%<br />
Misc Revenues<br />
Misc Revenue 0 0 97,573 97,573 97,000 0 (100.00%)<br />
Total Misc Revenues 0 0 97,573 97,573 97,000 0 (100.00%)<br />
Total<br />
Revenue Summary 0 0 97,573 97,573 99,156 97,039 (0.55%)<br />
Appropriations<br />
FY 2009<br />
Actual<br />
FY 2010<br />
Actual<br />
FY 2011<br />
Adopted<br />
FY 2011<br />
Amended<br />
FY 2011<br />
E<strong>st</strong>imated<br />
FY 2012<br />
Proposed<br />
FY 2012<br />
Change<br />
Wages And Benefits 0 0 5,063 5,063 2,920 4,851 (4.19%)<br />
Services And Commodities 0 0 92,510 92,510 96,236 92,188 (0.35%)<br />
Total<br />
Appropriations 0 0 97,573 97,573 99,156 97,039 (0.55%)<br />
Increase/(Decrease) in Fund Balance 0 0 0 0 0 0<br />
Beginning Balance 98,772 103,667 103,667 103,667 103,667 103,667<br />
Adju<strong>st</strong>ments 4,895 0 0 0 0 0<br />
Ending Balance 103,667 103,667 103,667 103,667 103,667 103,667<br />
105
City <<strong>st</strong>rong>of</<strong>st</strong>rong> St. Petersburg, Florida - FY 2012 Proposed Fiscal Plan<br />
Home Program (1113)<br />
This fund accounts for grant revenue from the U.S. Department <<strong>st</strong>rong>of</<strong>st</strong>rong> Housing and Urban Development that provides resources to fulfill the City's Consolidated Plan<br />
initiatives that assi<strong>st</strong> low- and moderate-income earning persons in meeting their affordable housing needs.<br />
FY 2009<br />
Actual<br />
FY 2010<br />
Actual<br />
FY 2011<br />
Adopted<br />
FY 2011<br />
Amended<br />
FY 2011<br />
E<strong>st</strong>imated<br />
FY 2012<br />
Proposed<br />
FY 2012<br />
Change<br />
Revenue Summary<br />
Intergovernmental Revenue<br />
Federal Grants 1,822,244 2,204,739 1,389,703 1,389,703 1,389,703 1,229,023 (11.56%)<br />
Total Intergovernmental Revenue 1,822,244 2,204,739 1,389,703 1,389,703 1,389,703 1,229,023 (11.56%)<br />
Fines And Forfeitures<br />
Violation Of Local Ordinances 292 780 0 0 388 0 0.00%<br />
Total Fines And Forfeitures 292 780 0 0 388 0 0.00%<br />
Misc Revenues<br />
Intere<strong>st</strong> Earnings 17,864 21,921 0 0 17,891 0 0.00%<br />
Misc Revenue 187,101 214,930 150,000 150,000 140,257 200,000 33.33%<br />
Total Misc Revenues 204,965 236,851 150,000 150,000 158,148 200,000 33.33%<br />
Total<br />
Revenue Summary 2,027,501 2,442,370 1,539,703 1,539,703 1,548,239 1,429,023 (7.19%)<br />
Appropriations<br />
FY 2009<br />
Actual<br />
FY 2010<br />
Actual<br />
FY 2011<br />
Adopted<br />
FY 2011<br />
Amended<br />
FY 2011<br />
E<strong>st</strong>imated<br />
FY 2012<br />
Proposed<br />
FY 2012<br />
Change<br />
Wages And Benefits 111,118 156,677 156,623 156,623 209,394 146,902 (6.21%)<br />
Services And Commodities 1,891,409 2,235,571 1,373,080 1,373,437 1,338,845 1,272,121 (7.35%)<br />
Grants And Aid 0 0 10,000 10,000 0 10,000 0.00%<br />
Total<br />
Appropriations 2,002,527 2,392,248 1,539,703 1,540,060 1,548,239 1,429,023 (7.19%)<br />
Increase/(Decrease) in Fund Balance 24,974 50,122 0 (357) 0 0<br />
Beginning Balance 1,763,014 1,787,988 1,838,110 1,838,110 1,838,110 1,838,467<br />
Adju<strong>st</strong>ments 0 0 0 357 357 0<br />
Ending Balance 1,787,988 1,838,110 1,838,110 1,838,110 1,838,467 1,838,467<br />
106
City <<strong>st</strong>rong>of</<strong>st</strong>rong> St. Petersburg, Florida - FY 2012 Proposed Fiscal Plan<br />
Neighborhood Stabilization Program (1114)<br />
This fund is used to account for funds received from the U.S. Department <<strong>st</strong>rong>of</<strong>st</strong>rong> Housing and Urban Development to assi<strong>st</strong> local governments to address the effects <<strong>st</strong>rong>of</<strong>st</strong>rong><br />
abandoned and foreclosed properties. The uses <<strong>st</strong>rong>of</<strong>st</strong>rong> these funds are to e<strong>st</strong>ablish financing mechanisms, purchase and rehabilitate abandoned and foreclosed homes,<br />
e<strong>st</strong>ablish land banks for homes that have been foreclosed, demolish blighted <strong>st</strong>ructures, and redevelop demolished or vacant properties.<br />
FY 2009<br />
Actual<br />
FY 2010<br />
Actual<br />
FY 2011<br />
Adopted<br />
FY 2011<br />
Amended<br />
FY 2011<br />
E<strong>st</strong>imated<br />
FY 2012<br />
Proposed<br />
FY 2012<br />
Change<br />
Revenue Summary<br />
Intergovernmental Revenue<br />
Federal Grants 939,460 4,257,045 0 3,709,133 3,709,133 0 0.00%<br />
Total Intergovernmental Revenue 939,460 4,257,045 0 3,709,133 3,709,133 0 0.00%<br />
Misc Revenues<br />
Sale Of Fixed Assets 0 79,287 0 0 0 0 0.00%<br />
Total Misc Revenues 0 79,287 0 0 0 0 0.00%<br />
Transfer In<br />
General Fund 0 0 0 360,000 360,000 0 0.00%<br />
Total Transfer In 0 0 0 360,000 360,000 0 0.00%<br />
Total<br />
Revenue Summary 939,460 4,336,332 0 4,069,133 4,069,133 0 0.00%<br />
Appropriations<br />
FY 2009<br />
Actual<br />
FY 2010<br />
Actual<br />
FY 2011<br />
Adopted<br />
FY 2011<br />
Amended<br />
FY 2011<br />
E<strong>st</strong>imated<br />
FY 2012<br />
Proposed<br />
FY 2012<br />
Change<br />
Wages And Benefits 182,342 372,769 0 370,913 90 0 0.00%<br />
Services And Commodities 131,966 2,841,402 0 2,708,970 3,387,440 0 0.00%<br />
Capital 646,871 1,790,275 0 5,744,023 13,175 0 0.00%<br />
Total<br />
Appropriations 961,179 5,004,446 0 8,823,906 3,400,705 0 0.00%<br />
Increase/(Decrease) in Fund Balance (21,719) (668,114) 0 (4,754,773) 668,428 0<br />
Beginning Balance 21,405 (314) (668,428) (668,428) (668,428) 526,396<br />
Adju<strong>st</strong>ments 0 0 0 526,396 526,396 0<br />
Ending Balance (314) (668,428) (668,428) (4,896,805) 526,396 526,396<br />
107
City <<strong>st</strong>rong>of</<strong>st</strong>rong> St. Petersburg, Florida - FY 2012 Proposed Fiscal Plan<br />
Miscellaneous Tru<strong>st</strong> Funds (1115)<br />
This fund is an aggregate <<strong>st</strong>rong>of</<strong>st</strong>rong> many diverse tru<strong>st</strong> funds. Proceeds from each fund can only be used for the specific purpose <<strong>st</strong>rong>of</<strong>st</strong>rong> the tru<strong>st</strong>.<br />
FY 2009<br />
Actual<br />
FY 2010<br />
Actual<br />
FY 2011<br />
Adopted<br />
FY 2011<br />
Amended<br />
FY 2011<br />
E<strong>st</strong>imated<br />
FY 2012<br />
Proposed<br />
FY 2012<br />
Change<br />
Revenue Summary<br />
Miscellaneous Revenue<br />
Miscellaneous Revenue 687,551 916,032 1,500,000 1,500,000 1,500,000 1,500,000 0%<br />
Total Miscellaneous Revenue 687,551 916,032 1,500,000 1,500,000 1,500,000 1,500,000 0%<br />
Total<br />
Revenue Summary<br />
687,551 916,032 1,500,000 1,500,000 1,500,000 1,500,000 0%<br />
Appropriations<br />
FY 2009<br />
Actual<br />
FY 2010 FY 2011 FY 2011 FY 2011 FY 2012 FY 2012<br />
Actual Adopted Amended E<strong>st</strong>imated Proposed Change<br />
Services And Commodities 1,427,118 510,604 1,500,000 1,500,000 1,500,000 1,500,000 0%<br />
Total<br />
Appropriations<br />
687,551 916,032 1,500,000 1,500,000 1,500,000 1,500,000 0%<br />
Increase/(Decrease) in Fund Balance - - - - - - -<br />
Beginning Balance - - - - - - -<br />
Adju<strong>st</strong>ments - - - - - - -<br />
Ending Balance - - - - - - -<br />
108
City <<strong>st</strong>rong>of</<strong>st</strong>rong> St. Petersburg, Florida - FY 2012 Proposed Fiscal Plan<br />
Community Housing Tru<strong>st</strong> (1117)<br />
This fund was e<strong>st</strong>ablished in FY07 (Pinellas County Ordinance 06-28) with grant funding from Pinellas County. The purpose is to fund multi-family housing for<br />
low- to moderate-income earning persons and permanent rental housing for those with special needs.<br />
FY 2009<br />
Actual<br />
FY 2010<br />
Actual<br />
FY 2011<br />
Adopted<br />
FY 2011<br />
Amended<br />
FY 2011<br />
E<strong>st</strong>imated<br />
FY 2012<br />
Proposed<br />
FY 2012<br />
Change<br />
Revenue Summary<br />
Intergovernmental Revenue<br />
Grants From Other Local Units 911,579 0 0 0 0 0 0.00%<br />
Total Intergovernmental Revenue 911,579 0 0 0 0 0 0.00%<br />
Misc Revenues<br />
Intere<strong>st</strong> Earnings 132,619 89,614 0 0 8,588 0 0.00%<br />
Total Misc Revenues 132,619 89,614 0 0 8,588 0 0.00%<br />
Total<br />
Revenue Summary 1,044,198 89,614 0 0 8,588 0 0.00%<br />
Appropriations<br />
FY 2009<br />
Actual<br />
FY 2010<br />
Actual<br />
FY 2011<br />
Adopted<br />
FY 2011<br />
Amended<br />
FY 2011<br />
E<strong>st</strong>imated<br />
FY 2012<br />
Proposed<br />
FY 2012<br />
Change<br />
Wages And Benefits 41,904 62,085 0 0 0 0 0.00%<br />
Services And Commodities 1,028,727 1,525,892 0 1,347,818 1,335,077 0 0.00%<br />
Grants And Aid 290,934 0 0 0 0 0 0.00%<br />
Total<br />
Appropriations 1,361,565 1,587,977 0 1,347,818 1,335,077 0 0.00%<br />
Increase/(Decrease) in Fund Balance (317,367) (1,498,363) 0 (1,347,818) (1,326,489) 0<br />
Beginning Balance 3,157,033 2,839,666 1,341,303 1,341,303 1,341,303 14,814<br />
Adju<strong>st</strong>ments 0 0 0 0 0 0<br />
Ending Balance 2,839,666 1,341,303 1,341,303 (6,515) 14,814 14,814<br />
109
City <<strong>st</strong>rong>of</<strong>st</strong>rong> St. Petersburg, Florida - FY 2012 Proposed Fiscal Plan<br />
Building Permit Special Revenue (1151)<br />
This fund was e<strong>st</strong>ablished in FY08 to isolate the building permit revenues and expenses in accordance with the Florida building code (F.S. 553.80).<br />
FY 2009<br />
Actual<br />
FY 2010<br />
Actual<br />
FY 2011<br />
Adopted<br />
FY 2011<br />
Amended<br />
FY 2011<br />
E<strong>st</strong>imated<br />
FY 2012<br />
Proposed<br />
FY 2012<br />
Change<br />
Revenue Summary<br />
License And Permits<br />
Contractors Permits 2,675,583 2,775,690 2,631,000 2,631,000 3,027,984 2,631,000 0.00%<br />
Other License And Permits 0 0 6,000 6,000 0 6,000 0.00%<br />
Total License And Permits 2,675,583 2,775,690 2,637,000 2,637,000 3,027,984 2,637,000 0.00%<br />
Charges For Services<br />
General Government 437,430 434,187 414,000 414,000 172,521 414,000 0.00%<br />
Transportation Charges 0 (205) 0 0 0 0 0.00%<br />
Total Charges For Services 437,430 433,982 414,000 414,000 172,521 414,000 0.00%<br />
Misc Revenues<br />
Intere<strong>st</strong> Earnings 31,064 2,839 0 0 106 0 0.00%<br />
Special Assessment (720) 0 0 0 0 0 0.00%<br />
Sale Of Fixed Assets 2,377 0 0 0 0 0 0.00%<br />
Misc Revenue 0 10 0 0 0 0 0.00%<br />
Total Misc Revenues 32,721 2,849 0 0 106 0 0.00%<br />
Total<br />
Revenue Summary 3,145,734 3,212,521 3,051,000 3,051,000 3,200,611 3,051,000 0.00%<br />
Appropriations<br />
FY 2009<br />
Actual<br />
FY 2010<br />
Actual<br />
FY 2011<br />
Adopted<br />
FY 2011<br />
Amended<br />
FY 2011<br />
E<strong>st</strong>imated<br />
FY 2012<br />
Proposed<br />
FY 2012<br />
Change<br />
Wages And Benefits 3,298,524 2,895,434 2,791,990 2,791,990 2,714,086 2,878,267 3.09%<br />
Services And Commodities 967,396 473,071 658,992 659,106 707,306 607,337 (7.84%)<br />
Capital 0 725 0 725 0 0 0.00%<br />
Total<br />
Appropriations 4,265,920 3,369,230 3,450,982 3,451,821 3,421,392 3,485,604 1.00%<br />
Increase/(Decrease) in Fund Balance (1,120,186) (156,709) (399,982) (400,821) (220,781) (434,604)<br />
Beginning Balance 1,880,710 760,709 656,000 656,000 656,000 436,058<br />
Adju<strong>st</strong>ments 185 52,000 0 839 839 0<br />
Ending Balance 760,709 656,000 256,018 256,018 436,058 1,454<br />
Starting in FY12, 10% <<strong>st</strong>rong>of</<strong>st</strong>rong> the Planning and Economic Development Director's salaries and benefits will be paid out <<strong>st</strong>rong>of</<strong>st</strong>rong> the Building Permit Special Revenue Fund.<br />
110
City <<strong>st</strong>rong>of</<strong>st</strong>rong> St. Petersburg, Florida - FY 2012 Proposed Fiscal Plan<br />
Mahaffey Theater Operating (1201)<br />
This fund accounts for the operation <<strong>st</strong>rong>of</<strong>st</strong>rong> the Mahaffey Theater at the Progress Energy Center for the Arts and is subsidized by the General Fund.<br />
FY 2009<br />
Actual<br />
FY 2010<br />
Actual<br />
FY 2011<br />
Adopted<br />
FY 2011<br />
Amended<br />
FY 2011<br />
E<strong>st</strong>imated<br />
FY 2012<br />
Proposed<br />
FY 2012<br />
Change<br />
Revenue Summary<br />
Charges For Services<br />
Transportation Charges 282,850 241,916 174,255 174,255 171,977 254,255 45.91%<br />
Culture And Recreation Charges 2,667,752 2,271,337 1,994,653 1,994,653 2,131,198 1,994,653 0.00%<br />
Total Charges For Services 2,950,602 2,513,253 2,168,908 2,168,908 2,303,175 2,248,908 3.69%<br />
Misc Revenues<br />
Intere<strong>st</strong> Earnings 3,314 3,292 3,380 3,380 20,796 1,343 (60.27%)<br />
Contributions And Donations 0 0 448,576 448,576 448,576 448,576 0.00%<br />
Misc Revenue 308,488 214,791 55,717 55,717 180,684 159,717 186.66%<br />
Total Misc Revenues 311,802 218,083 507,673 507,673 650,056 609,636 20.08%<br />
Transfer In<br />
General Fund 934,000 965,700 774,000 774,000 733,000 670,000 (13.44%)<br />
Total Transfer In 934,000 965,700 774,000 774,000 733,000 670,000 (13.44%)<br />
Internal Charges<br />
Other Charges 0 (475) 0 0 0 0 0.00%<br />
Total Internal Charges 0 (475) 0 0 0 0 0.00%<br />
Total<br />
Revenue Summary 4,196,404 3,696,561 3,450,581 3,450,581 3,686,231 3,528,544 2.26%<br />
Appropriations<br />
FY 2009<br />
Actual<br />
FY 2010<br />
Actual<br />
FY 2011<br />
Adopted<br />
FY 2011<br />
Amended<br />
FY 2011<br />
E<strong>st</strong>imated<br />
FY 2012<br />
Proposed<br />
FY 2012<br />
Change<br />
Wages And Benefits 860,265 904,653 1,013,346 1,013,346 981,110 1,010,635 (0.27%)<br />
Services And Commodities 3,334,708 2,745,585 2,539,842 2,539,842 2,784,628 2,521,764 (0.71%)<br />
Capital 573 14,306 0 0 0 0 0.00%<br />
Total<br />
Appropriations 4,195,546 3,664,544 3,553,188 3,553,188 3,765,738 3,532,399 (0.59%)<br />
Increase/(Decrease) in Fund Balance 858 32,017 (102,607) (102,607) (79,507) (3,855)<br />
Beginning Balance 62,335 70,601 90,000 90,000 90,000 10,493<br />
Adju<strong>st</strong>ments 7,408 (12,618) 0 0 0 0<br />
Ending Balance 70,601 90,000 (12,607) (12,607) 10,493 6,638<br />
In FY12, there will be a 6.8% increase in the revenues, not including the General Fund subsidy. The revenue increase represents an anticipated increase in<br />
revenue from the Dali Museum parking lot ($80,000) and Miscellaneous Revenue ($104,000).<br />
The facility is subsidized by the General Fund. The Proposed Budget recommends a decrease in subsidy in the amount <<strong>st</strong>rong>of</<strong>st</strong>rong> $104,000 in FY12 over the FY11<br />
Adopted Budget amount. This reduction is due to the anticipated increase in the above revenues.<br />
111
City <<strong>st</strong>rong>of</<strong>st</strong>rong> St. Petersburg, Florida - FY 2012 Proposed Fiscal Plan<br />
Pier Operating (1203)<br />
The Pier Operating Fund accounts for the operation <<strong>st</strong>rong>of</<strong>st</strong>rong> the downtown waterfront retail/re<strong>st</strong>aurant complex and is subsidized by the General Fund.<br />
FY 2009<br />
Actual<br />
FY 2010<br />
Actual<br />
FY 2011<br />
Adopted<br />
FY 2011<br />
Amended<br />
FY 2011<br />
E<strong>st</strong>imated<br />
FY 2012<br />
Proposed<br />
FY 2012<br />
Change<br />
Revenue Summary<br />
Charges For Services<br />
Culture And Recreation Charges 512,576 491,614 474,424 474,424 338,865 246,034 (48.14%)<br />
Total Charges For Services 512,576 491,614 474,424 474,424 338,865 246,034 (48.14%)<br />
Misc Revenues<br />
Intere<strong>st</strong> Earnings 0 0 0 0 0 0 0.00%<br />
Rents And Royalties 816,122 727,297 752,716 752,716 643,237 680,163 (9.64%)<br />
Misc Revenue 82,516 61,630 66,860 66,860 163,889 47,511 (28.94%)<br />
Total Misc Revenues 898,638 788,927 819,576 819,576 807,126 727,674 (11.21%)<br />
Transfer In<br />
General Fund 1,509,000 1,427,000 1,246,000 1,246,000 1,246,000 1,399,000 12.28%<br />
Total Transfer In 1,509,000 1,427,000 1,246,000 1,246,000 1,246,000 1,399,000 12.28%<br />
Total<br />
Revenue Summary 2,920,214 2,707,541 2,540,000 2,540,000 2,391,991 2,372,708 (6.59%)<br />
Appropriations<br />
FY 2009<br />
Actual<br />
FY 2010<br />
Actual<br />
FY 2011<br />
Adopted<br />
FY 2011<br />
Amended<br />
FY 2011<br />
E<strong>st</strong>imated<br />
FY 2012<br />
Proposed<br />
FY 2012<br />
Change<br />
Wages And Benefits 816,360 747,912 757,997 757,997 746,115 664,604 (12.32%)<br />
Services And Commodities 2,106,548 2,067,726 1,829,612 1,831,618 1,701,441 1,709,265 (6.58%)<br />
Capital 0 9,145 0 0 0 0 0.00%<br />
Total<br />
Appropriations 2,922,908 2,824,783 2,587,609 2,589,615 2,447,556 2,373,869 (8.26%)<br />
Increase/(Decrease) in Fund Balance (2,694) (117,242) (47,609) (49,615) (55,565) (1,161)<br />
Beginning Balance 162,032 150,446 57,000 57,000 57,000 3,441<br />
Adju<strong>st</strong>ments (8,892) 23,796 0 2,006 2,006 0<br />
Ending Balance 150,446 57,000 9,391 9,391 3,441 2,280<br />
In FY12, there is a projected reduction in revenues <<strong>st</strong>rong>of</<strong>st</strong>rong> 24.7%, not including the General Fund subsidy. The decrease is mainly due to a decrease in rent revenue,<br />
including the loss <<strong>st</strong>rong>of</<strong>st</strong>rong> some tenants.<br />
Also in FY12, expenditures will be reduced by 8.26% and includes eliminating a full-time Lead Concierge position, reducing a full-time Accountant to part-time,<br />
and reducing various line items ($87,098) to better align the <strong>budget</strong> with projected FY11 expenses. The position savings will not result in a reduction in head<br />
count for the department since the positions are contract employees.<br />
The facility is subsidized by the General Fund. The Proposed Budget recommends an increase in subsidy in the amount <<strong>st</strong>rong>of</<strong>st</strong>rong> $153,000 in FY12 over the FY11<br />
Adopted Budget amount. This increase is due to the anticipated decrease in the above revenues and the use <<strong>st</strong>rong>of</<strong>st</strong>rong> fund balance to decrease the subsidy in FY11.<br />
112
City <<strong>st</strong>rong>of</<strong>st</strong>rong> St. Petersburg, Florida - FY 2012 Proposed Fiscal Plan<br />
Coliseum Operating (1205)<br />
The Coliseum Operating Fund accounts for the operation <<strong>st</strong>rong>of</<strong>st</strong>rong> the hi<strong>st</strong>oric ballroom/exhibit hall and is subsidized by the General Fund.<br />
FY 2009<br />
Actual<br />
FY 2010<br />
Actual<br />
FY 2011<br />
Adopted<br />
FY 2011<br />
Amended<br />
FY 2011<br />
E<strong>st</strong>imated<br />
FY 2012<br />
Proposed<br />
FY 2012<br />
Change<br />
Revenue Summary<br />
Charges For Services<br />
Transportation Charges 0 0 38,900 38,900 0 34,000 (12.60%)<br />
Culture And Recreation Charges 584,710 501,780 576,351 576,351 566,997 515,000 (10.64%)<br />
Total Charges For Services 584,710 501,780 615,251 615,251 566,997 549,000 (10.77%)<br />
Misc Revenues<br />
Intere<strong>st</strong> Earnings 272 86 3,500 3,500 16 1,390 (60.29%)<br />
Contributions And Donations 0 0 0 0 1,000 0 0.00%<br />
Misc Revenue (160) 298 3,000 3,000 22 0 (100.00%)<br />
Total Misc Revenues 112 384 6,500 6,500 1,038 1,390 (78.62%)<br />
Transfer In<br />
General Fund 193,000 232,000 176,000 176,000 228,000 201,000 14.20%<br />
Total Transfer In 193,000 232,000 176,000 176,000 228,000 201,000 14.20%<br />
Internal Charges<br />
Other Charges 164 69 0 0 10 0 0.00%<br />
Total Internal Charges 164 69 0 0 10 0 0.00%<br />
Total<br />
Revenue Summary 777,986 734,233 797,751 797,751 796,045 751,390 (5.81%)<br />
Appropriations<br />
FY 2009<br />
Actual<br />
FY 2010<br />
Actual<br />
FY 2011<br />
Adopted<br />
FY 2011<br />
Amended<br />
FY 2011<br />
E<strong>st</strong>imated<br />
FY 2012<br />
Proposed<br />
FY 2012<br />
Change<br />
Wages And Benefits 488,669 488,934 471,720 471,720 381,500 444,959 (5.67%)<br />
Services And Commodities 303,217 302,517 325,942 331,557 417,726 304,280 (6.65%)<br />
Total<br />
Appropriations 791,886 791,451 797,662 803,277 799,226 749,239 (6.07%)<br />
Increase/(Decrease) in Fund Balance (13,900) (57,218) 89 (5,526) (3,181) 2,151<br />
Beginning Balance 68,155 55,741 4,000 4,000 4,000 6,435<br />
Adju<strong>st</strong>ments 1,486 5,477 0 5,616 5,616 0<br />
Ending Balance 55,741 4,000 4,089 4,090 6,435 8,586<br />
In FY12, there is a projected reduction in revenues <<strong>st</strong>rong>of</<strong>st</strong>rong> 11.1%, not including the General Fund subsidy. The decrease is mainly due to a reduction in event activity<br />
due to economic conditions.<br />
Also in FY12, expenditures will decrease by 6.07%. The majority <<strong>st</strong>rong>of</<strong>st</strong>rong> the decrease is in personal services (Project Burden) and Other Special Services.<br />
The facility is subsidized by the General Fund. The Proposed Budget recommends an increase in subsidy in the amount <<strong>st</strong>rong>of</<strong>st</strong>rong> $25,000 in FY12 over the FY11<br />
Adopted Budget amount. This reduction is due to the anticipated decrease in the above revenues.<br />
113
City <<strong>st</strong>rong>of</<strong>st</strong>rong> St. Petersburg, Florida - FY 2012 Proposed Fiscal Plan<br />
Sunken Gardens (1207)<br />
The Sunken Gardens Fund accounts for the operation <<strong>st</strong>rong>of</<strong>st</strong>rong> the hi<strong>st</strong>oric botanical gardens and is subsidized by the General Fund.<br />
FY 2009<br />
Actual<br />
FY 2010<br />
Actual<br />
FY 2011<br />
Adopted<br />
FY 2011<br />
Amended<br />
FY 2011<br />
E<strong>st</strong>imated<br />
FY 2012<br />
Proposed<br />
FY 2012<br />
Change<br />
Revenue Summary<br />
Charges For Services<br />
Culture And Recreation Charges 622,957 593,922 708,700 708,700 624,354 670,000 (5.46%)<br />
Total Charges For Services 622,957 593,922 708,700 708,700 624,354 670,000 (5.46%)<br />
Misc Revenues<br />
Intere<strong>st</strong> Earnings 138 53 3,290 3,290 6 1,307 (60.27%)<br />
Rents And Royalties 19,993 11,616 0 0 0 0 0.00%<br />
Contributions And Donations 1,702 844 1,000 1,000 43 1,000 0.00%<br />
Misc Revenue 88 143 0 0 27 100 0.00%<br />
Total Misc Revenues 21,921 12,656 4,290 4,290 76 2,407 (43.89%)<br />
Transfer In<br />
General Fund 230,000 222,000 166,000 166,000 227,000 202,000 21.69%<br />
Total Transfer In 230,000 222,000 166,000 166,000 227,000 202,000 21.69%<br />
Internal Charges<br />
Other Charges (40) (199) 0 0 61 0 0.00%<br />
Total Internal Charges (40) (199) 0 0 61 0 0.00%<br />
Total<br />
Revenue Summary 874,838 828,379 878,990 878,990 851,491 874,407 (0.52%)<br />
Appropriations<br />
FY 2009<br />
Actual<br />
FY 2010<br />
Actual<br />
FY 2011<br />
Adopted<br />
FY 2011<br />
Amended<br />
FY 2011<br />
E<strong>st</strong>imated<br />
FY 2012<br />
Proposed<br />
FY 2012<br />
Change<br />
Wages And Benefits 510,492 478,009 529,165 529,165 447,490 499,035 (5.69%)<br />
Services And Commodities 380,101 394,539 349,438 354,370 417,607 375,113 7.35%<br />
Capital 6,782 1,769 0 0 1,113 0 0.00%<br />
Total<br />
Appropriations 897,375 874,317 878,603 883,535 866,210 874,148 (0.51%)<br />
Increase/(Decrease) in Fund Balance (22,537) (45,938) 387 (4,545) (14,719) 259<br />
Beginning Balance 41,378 41,357 15,000 15,000 15,000 5,213<br />
Adju<strong>st</strong>ments 22,516 19,581 0 4,932 4,932 0<br />
Ending Balance 41,357 15,000 15,387 15,387 5,213 5,472<br />
In FY12, there is a projected reduction in revenues <<strong>st</strong>rong>of</<strong>st</strong>rong> 5.4%, not including the General Fund subsidy. The decrease is mainly due to economic conditions.<br />
Also in FY12, the Account Clerk II position assigned to Sunken Gardens will be moved to Admini<strong>st</strong>ration and the Information Speciali<strong>st</strong> position in<br />
Admini<strong>st</strong>ration to Sunken Gardens. A vacant full-time Facilities Assi<strong>st</strong>ant position in Sunken Gardens will also be reduced to part-time. This reduction makes up<br />
the majority <<strong>st</strong>rong>of</<strong>st</strong>rong> the .51% decrease in expenditures for this fund.<br />
The facility is subsidized by the General Fund. The Proposed Budget recommends an increase in subsidy in the amount <<strong>st</strong>rong>of</<strong>st</strong>rong> $36,000 in FY12 over the FY11<br />
Adopted Budget amount. This reduction is due to the anticipated decrease in the above revenues.<br />
114
City <<strong>st</strong>rong>of</<strong>st</strong>rong> St. Petersburg, Florida - FY 2012 Proposed Fiscal Plan<br />
Tropicana Field (1208)<br />
The Tropicana Field Fund accounts for the operation <<strong>st</strong>rong>of</<strong>st</strong>rong> the domed baseball <strong>st</strong>adium and is subsidized by the General Fund.<br />
FY 2009<br />
Actual<br />
FY 2010<br />
Actual<br />
FY 2011<br />
Adopted<br />
FY 2011<br />
Amended<br />
FY 2011<br />
E<strong>st</strong>imated<br />
FY 2012<br />
Proposed<br />
FY 2012<br />
Change<br />
Revenue Summary<br />
Charges For Services<br />
Transportation Charges 0 0 24,665 24,665 0 24,665 0.00%<br />
Culture And Recreation Charges 1,590,031 1,131,382 1,073,494 1,073,494 1,137,117 1,110,038 3.40%<br />
Total Charges For Services 1,590,031 1,131,382 1,098,159 1,098,159 1,137,117 1,134,703 3.33%<br />
Misc Revenues<br />
Intere<strong>st</strong> Earnings 4,092 0 2,361 2,361 0 938 (60.27%)<br />
Total Misc Revenues 4,092 0 2,361 2,361 0 938 (60.27%)<br />
Transfer In<br />
General Fund 1,566,000 1,102,000 1,365,335 1,365,335 1,365,335 1,250,000 (8.45%)<br />
Total Transfer In 1,566,000 1,102,000 1,365,335 1,365,335 1,365,335 1,250,000 (8.45%)<br />
Total<br />
Revenue Summary 3,160,123 2,233,382 2,465,855 2,465,855 2,502,452 2,385,641 (3.25%)<br />
Appropriations<br />
FY 2009<br />
Actual<br />
FY 2010<br />
Actual<br />
FY 2011<br />
Adopted<br />
FY 2011<br />
Amended<br />
FY 2011<br />
E<strong>st</strong>imated<br />
FY 2012<br />
Proposed<br />
FY 2012<br />
Change<br />
Wages And Benefits 948,799 758,687 845,326 845,326 845,326 747,323 (11.59%)<br />
Services And Commodities 1,671,024 1,708,581 1,620,768 1,620,768 1,620,768 1,673,904 3.28%<br />
Transfers Out<br />
Tropicana Field Capital Projects 1,968,397 0 0 0 0 0 0.00%<br />
Total Transfers Out 1,968,397 0 0 0 0 0 0.00%<br />
Total<br />
Appropriations 4,588,220 2,467,268 2,466,094 2,466,094 2,466,094 2,421,227 (1.82%)<br />
Increase/(Decrease) in Fund Balance (1,428,097) (233,886) (239) (239) 36,358 (35,586)<br />
Beginning Balance 1,662,440 234,343 0 0 0 36,358<br />
Adju<strong>st</strong>ments 0 (457) 0 0 0 0<br />
Ending Balance 234,343 0 (239) (239) 36,358 772<br />
During FY10, the Tampa Bay Rays (TBR) <strong>capital</strong> portion <<strong>st</strong>rong>of</<strong>st</strong>rong> the revenue and expenditure <strong>budget</strong> ($500,000) for the TBR Naming Rights and Ticket Surcharge<br />
was eliminated. The revenue is now directly deposited into the <strong>capital</strong> fund in<strong>st</strong>ead <<strong>st</strong>rong>of</<strong>st</strong>rong> passing through the <strong>operating</strong> fund.<br />
In FY12, the <strong>budget</strong> for personal services will be decreased by $98,003 to reflect a decrease in the co<strong>st</strong> <<strong>st</strong>rong>of</<strong>st</strong>rong> providing police services for <<strong>st</strong>rong>of</<strong>st</strong>rong>fsite traffic control.<br />
This facility is subsidized by the General Fund. The Proposed Budget recommends a decrease in subsidy in the amount <<strong>st</strong>rong>of</<strong>st</strong>rong> $115,335 in FY12 over the FY11<br />
Adopted Budget amount. This reduction is due to the anticipated decrease in the above expenditures.<br />
115
City <<strong>st</strong>rong>of</<strong>st</strong>rong> St. Petersburg, Florida - FY 2012 Proposed Fiscal Plan<br />
Community Redevelopment Di<strong>st</strong>rict (1301)<br />
The Community Redevelopment Agency (CRA) was e<strong>st</strong>ablished under Florida Law to act as the Redevelopment Agency for all Redevelopment Di<strong>st</strong>ricts. The St.<br />
Petersburg City Council is the governing body <<strong>st</strong>rong>of</<strong>st</strong>rong> the CRA and conducts business as the CRA in sessions that are separate from the regular Council meetings.<br />
State regulations require the inclusion <<strong>st</strong>rong>of</<strong>st</strong>rong> all dependent di<strong>st</strong>ricts in local government <strong>budget</strong>s. The fund balance is the amount available for di<strong>st</strong>ricts than the<br />
Downtown Di<strong>st</strong>rict. Prior to FY10, this fund received the City and County tax increment financing (TIF) payments for all Redevelopment di<strong>st</strong>ricts that are<br />
e<strong>st</strong>ablished tax management di<strong>st</strong>ricts. The Downtown Di<strong>st</strong>rict monies were then transferred to the Redevelopment Special Revenue Fund; where they were further<br />
transferred to the Public Improvement Debt Service Fund to pay principal and intere<strong>st</strong> on TIF bond issues. Beginning in FY10, this fund will only receive the<br />
Downtown Di<strong>st</strong>rict monies. Separate funds have been e<strong>st</strong>ablished to received the TIF payments for the other di<strong>st</strong>ricts.<br />
FY 2009<br />
Actual<br />
FY 2010<br />
Actual<br />
FY 2011<br />
Adopted<br />
FY 2011<br />
Amended<br />
FY 2011<br />
E<strong>st</strong>imated<br />
FY 2012<br />
Proposed<br />
FY 2012<br />
Change<br />
Revenue Summary<br />
Intergovernmental Revenue<br />
Shared Revenue 10,016,267 8,843,107 7,587,275 7,587,275 7,587,275 7,946,955 4.74%<br />
Total Intergovernmental Revenue 10,016,267 8,843,107 7,587,275 7,587,275 7,587,275 7,946,955 4.74%<br />
Misc Revenues<br />
Intere<strong>st</strong> Earnings 9,263 3,064 20,000 20,000 10,000 7,944 (60.28%)<br />
Total Misc Revenues 9,263 3,064 20,000 20,000 10,000 7,944 (60.28%)<br />
Total<br />
Revenue Summary 10,025,530 8,846,171 7,607,275 7,607,275 7,597,275 7,954,899 4.57%<br />
Transfers Out<br />
Downtown Redevelopment Di<strong>st</strong>rict 9,259,610 8,213,827 6,712,750 6,712,750 6,712,750 6,703,500 (0.14%)<br />
Bayboro Harbor Tax Increment Di<strong>st</strong>rict 0 151,556 0 0 0 0 0.00%<br />
Intown We<strong>st</strong> Tax Increment Di<strong>st</strong>rict 0 502,176 0 0 0 0 0.00%<br />
General Capital Improvements 0 2,480,000 0 0 0 0 0.00%<br />
Total Transfers Out 9,259,610 11,347,559 6,712,750 6,712,750 6,712,750 6,703,500 (0.14%)<br />
Total 9,259,610 11,347,559 6,712,750 6,712,750 6,712,750 6,703,500 (0.14%)<br />
Increase/(Decrease) in Fund Balance 765,920 (2,501,388) 894,525 894,525 884,525 1,251,399<br />
Beginning Balance 1,735,468 2,501,388 0 0 0 884,525<br />
Adju<strong>st</strong>ments 0 0 0 0 0 0<br />
Ending Balance 2,501,388 0 894,525 894,525 884,525 2,135,924<br />
116
City <<strong>st</strong>rong>of</<strong>st</strong>rong> St. Petersburg, Florida - FY 2012 Proposed Fiscal Plan<br />
Police Grant Tru<strong>st</strong> Funds (1702)<br />
This tru<strong>st</strong> fund was e<strong>st</strong>ablished in FY10 to receive funds through the Edward Byrne Memorial Ju<strong>st</strong>ice Assi<strong>st</strong>ance Grant Program (JAG). JAG funding is required<br />
to be accounted for in a separate tru<strong>st</strong> fund account. JAG funds support a range <<strong>st</strong>rong>of</<strong>st</strong>rong> program areas including law enforcement, prosecution and court, prevention<br />
and education, corrections and community corrections, drug treatment and enforcement, planning, evaluation, technology improvement, and crime victim and<br />
witness initiatives.<br />
FY 2009<br />
Actual<br />
FY 2010<br />
Actual<br />
FY 2011<br />
Adopted<br />
FY 2011<br />
Amended<br />
FY 2011<br />
E<strong>st</strong>imated<br />
FY 2012<br />
Proposed<br />
FY 2012<br />
Change<br />
Revenue Summary<br />
Intergovernmental Revenue<br />
Federal Grants 0 680,736 0 237,533 1,164,098 0 0.00%<br />
State Grants 0 0 0 276,589 276,000 0 0.00%<br />
Total Intergovernmental Revenue 0 680,736 0 514,122 1,440,098 0 0.00%<br />
Misc Revenues<br />
Intere<strong>st</strong> Earnings 0 850 0 0 249 0 0.00%<br />
Total Misc Revenues 0 850 0 0 249 0 0.00%<br />
Total<br />
Revenue Summary 0 681,586 0 514,122 1,440,347 0 0.00%<br />
Appropriations<br />
FY 2009<br />
Actual<br />
FY 2010<br />
Actual<br />
FY 2011<br />
Adopted<br />
FY 2011<br />
Amended<br />
FY 2011<br />
E<strong>st</strong>imated<br />
FY 2012<br />
Proposed<br />
FY 2012<br />
Change<br />
Wages And Benefits 0 629,814 406,518 816,976 622,239 535,322 31.68%<br />
Services And Commodities 0 42,657 0 88,664 87,039 12,720 0.00%<br />
Grants And Aid 0 13,585 0 15,000 0 0 0.00%<br />
Total<br />
Appropriations 0 686,056 406,518 920,640 709,278 548,042 34.81%<br />
Increase/(Decrease) in Fund Balance 0 (4,470) (406,518) (406,518) 731,069 (548,042)<br />
Beginning Balance 0 0 0 0 0 731,069<br />
Adju<strong>st</strong>ments 0 4,470 0 0 0 0<br />
Ending Balance 0 0 (406,518) (406,518) 731,069 183,027<br />
The three year Edward Byrne Memorial Ju<strong>st</strong>ice Assi<strong>st</strong>ance Grant ($1,303,348) is in its third year and funds one full-time Information Clerk II ($37,474), three<br />
full-time Emergency Complaint Writers ($154,801), one full-time Office Sy<strong>st</strong>ems Speciali<strong>st</strong> ($43,215), one full-time Data Entry Operator I ($42,770), one fulltime<br />
Police Inve<strong>st</strong>igative Assi<strong>st</strong>ant ($69,515), and one full-time Intelligence Analy<strong>st</strong> ($58,870). In FY12, these grant funded positions will be included in the<br />
position summary for the fir<strong>st</strong> time.<br />
During FY11, a supplemental appropriation was approved for the FY10 Byrne Ju<strong>st</strong>ice Assi<strong>st</strong>ance Grant ($237,375).<br />
117
City <<strong>st</strong>rong>of</<strong>st</strong>rong> St. Petersburg, Florida - FY 2012 Proposed Fiscal Plan<br />
FFGFC Loan (2011)<br />
This fund was e<strong>st</strong>ablished in Series 1987A, B and C Bonds. Bond debt in this fund has supported improvements for General Government, the Bayfront Center,<br />
Pier, and Tropicana Field. In FY96, additional funding was added to pay $26.350 million in notes issued (along with Pro Sports Sales Tax Bonds) which were<br />
used to make Tropicana Field baseball ready. In FY97, $6.350 million was added to replace the air-conditioning sy<strong>st</strong>em at Tropicana Field. In FY98, $2.815<br />
million was added for a <<strong>st</strong>rong>city</<strong>st</strong>rong>-wide telephone switch, $1.770 million for new parking meter sy<strong>st</strong>em, and $8 million <<strong>st</strong>rong>of</<strong>st</strong>rong> previous FFGFC notes were refinanced. In<br />
FY01, the callable portions <<strong>st</strong>rong>of</<strong>st</strong>rong> the 1996 and 1997 bonds were refinanced using $17.840 million in commission notes, significantly lowering the debt requirements.<br />
In April 2007, $7.43 million in notes were issued for the Marina, repaying the $3.775 million balance <<strong>st</strong>rong>of</<strong>st</strong>rong> a 2006 SSGFC Marina Improvement Loan and adding<br />
$3.5 million for the con<strong>st</strong>ruction <<strong>st</strong>rong>of</<strong>st</strong>rong> a new Marina pier. These notes and the associated debt service are reflected and <strong>budget</strong>ed in the Marina Operating Fund. In<br />
FY 2009, the final payment was made on the original unrefunded portion <<strong>st</strong>rong>of</<strong>st</strong>rong> the 1996 FFGFC Note. Beginning in FY10, debt service payments are for the 2001<br />
Refunding Notes and the Marina Notes.<br />
FY 2009<br />
Actual<br />
FY 2010<br />
Actual<br />
FY 2011<br />
Adopted<br />
FY 2011<br />
Amended<br />
FY 2011<br />
E<strong>st</strong>imated<br />
FY 2012<br />
Proposed<br />
FY 2012<br />
Change<br />
Revenue Summary<br />
Misc Revenues<br />
Intere<strong>st</strong> Earnings 2,211 72 0 0 0 0 0.00%<br />
Total Misc Revenues 2,211 72 0 0 0 0 0.00%<br />
Transfer In<br />
General Fund 1,118,922 2,625,421 2,618,006 2,618,006 2,618,006 2,635,316 0.66%<br />
Pro Sports Facility 76,375 71,529 78,754 78,754 78,754 71,234 (9.55%)<br />
Total Transfer In 1,195,297 2,696,950 2,696,760 2,696,760 2,696,760 2,706,550 0.36%<br />
Total<br />
Revenue Summary 1,197,508 2,697,022 2,696,760 2,696,760 2,696,760 2,706,550 0.36%<br />
Appropriations<br />
FY 2009<br />
Actual<br />
FY 2010<br />
Actual<br />
FY 2011<br />
Adopted<br />
FY 2011<br />
Amended<br />
FY 2011<br />
E<strong>st</strong>imated<br />
FY 2012<br />
Proposed<br />
FY 2012<br />
Change<br />
Debt 1,714,760 2,697,021 2,696,760 2,696,760 2,696,760 2,706,550 0.36%<br />
Total<br />
Appropriations 1,714,760 2,697,021 2,696,760 2,696,760 2,696,760 2,706,550 0.36%<br />
Increase/(Decrease) in Fund Balance (517,252) 1 0 0 0 0<br />
Beginning Balance 517,251 (1) 0 0 0 0<br />
Adju<strong>st</strong>ments 0 0 0 0 0 0<br />
Ending Balance (1) 0 0 0 0 0<br />
118
City <<strong>st</strong>rong>of</<strong>st</strong>rong> St. Petersburg, Florida - FY 2012 Proposed Fiscal Plan<br />
Banc Of America Notes Debt Service Fund (2013)<br />
This debt fund, created in Resolution 2008-100, is used to record debt service payments for the Florida International Museum and the Mahaffey Theater.<br />
FY 2009<br />
Actual<br />
FY 2010<br />
Actual<br />
FY 2011<br />
Adopted<br />
FY 2011<br />
Amended<br />
FY 2011<br />
E<strong>st</strong>imated<br />
FY 2012<br />
Proposed<br />
FY 2012<br />
Change<br />
Revenue Summary<br />
Misc Revenues<br />
Intere<strong>st</strong> Earnings 657 562 600 600 109 500 (16.67%)<br />
Total Misc Revenues 657 562 600 600 109 500 (16.67%)<br />
Transfer In<br />
Franchise Tax Revenue 675,000 0 0 0 0 0 0.00%<br />
Downtown Redevelopment Di<strong>st</strong>rict 820,979 820,979 820,979 820,979 820,979 823,228 0.27%<br />
Community Development Block Grant 285,605 283,095 285,232 285,232 285,232 282,283 (1.03%)<br />
Total Transfer In 1,781,584 1,104,074 1,106,211 1,106,211 1,106,211 1,105,511 (0.06%)<br />
Total<br />
Revenue Summary 1,782,241 1,104,636 1,106,811 1,106,811 1,106,320 1,106,011 (0.07%)<br />
Appropriations<br />
FY 2009<br />
Actual<br />
FY 2010<br />
Actual<br />
FY 2011<br />
Adopted<br />
FY 2011<br />
Amended<br />
FY 2011<br />
E<strong>st</strong>imated<br />
FY 2012<br />
Proposed<br />
FY 2012<br />
Change<br />
Debt 1,172,215 1,173,020 1,178,269 1,178,269 1,178,269 1,181,512 0.28%<br />
Total<br />
Appropriations 1,172,215 1,173,020 1,178,269 1,178,269 1,178,269 1,181,512 0.28%<br />
Increase/(Decrease) in Fund Balance 610,026 (68,384) (71,458) (71,458) (71,949) (75,501)<br />
Beginning Balance 0 610,026 541,642 541,642 541,642 469,693<br />
Adju<strong>st</strong>ments 0 0 0 0 0 0<br />
Ending Balance 610,026 541,642 470,184 470,184 469,693 394,192<br />
119
City <<strong>st</strong>rong>of</<strong>st</strong>rong> St. Petersburg, Florida - FY 2012 Proposed Fiscal Plan<br />
BB&T Notes (2014)<br />
FY 2009<br />
Actual<br />
FY 2010<br />
Actual<br />
FY 2011<br />
Adopted<br />
FY 2011<br />
Amended<br />
FY 2011<br />
E<strong>st</strong>imated<br />
FY 2012<br />
Proposed<br />
FY 2012<br />
Change<br />
Revenue Summary<br />
Transfer In<br />
Downtown Redevelopment Di<strong>st</strong>rict 0 0 0 29,000 29,000 642,396 0.00%<br />
Total Transfer In 0 0 0 29,000 29,000 642,396 0.00%<br />
Total<br />
Revenue Summary 0 0 0 29,000 29,000 642,396 0.00%<br />
Appropriations<br />
FY 2009<br />
Actual<br />
FY 2010<br />
Actual<br />
FY 2011<br />
Adopted<br />
FY 2011<br />
Amended<br />
FY 2011<br />
E<strong>st</strong>imated<br />
FY 2012<br />
Proposed<br />
FY 2012<br />
Change<br />
Debt 0 0 0 29,000 29,000 642,396 0.00%<br />
Total<br />
Appropriations 0 0 0 29,000 29,000 642,396 0.00%<br />
Increase/(Decrease) in Fund Balance 0 0 0 0 0 0<br />
Beginning Balance 0 0 0 0 0 0<br />
Adju<strong>st</strong>ments 0 0 0 0 0 0<br />
Ending Balance 0 0 0 0 0 0<br />
120
City <<strong>st</strong>rong>of</<strong>st</strong>rong> St. Petersburg, Florida - FY 2012 Proposed Fiscal Plan<br />
Capital Improvement Variable Rate Debt (2015)<br />
Projects are financed by variable rate inve<strong>st</strong>ment pools. The fir<strong>st</strong> projects funded from this fund were the purchase <<strong>st</strong>rong>of</<strong>st</strong>rong> the Florida International Museum building,<br />
improvements to the Mangrove Bay Golf Course, and improvements to Albert Whitted Airport.<br />
FY 2009<br />
Actual<br />
FY 2010<br />
Actual<br />
FY 2011<br />
Adopted<br />
FY 2011<br />
Amended<br />
FY 2011<br />
E<strong>st</strong>imated<br />
FY 2012<br />
Proposed<br />
FY 2012<br />
Change<br />
Revenue Summary<br />
Misc Revenues<br />
Intere<strong>st</strong> Earnings 1,844 0 0 0 0 0 0.00%<br />
Total Misc Revenues 1,844 0 0 0 0 0 0.00%<br />
Transfer In<br />
Economic Stability 38,048 0 0 0 0 0 0.00%<br />
Franchise Tax Revenue 2,455,000 0 0 0 0 0 0.00%<br />
Total Transfer In 2,493,048 0 0 0 0 0 0.00%<br />
Total<br />
Revenue Summary 2,494,892 0 0 0 0 0 0.00%<br />
Appropriations<br />
FY 2009<br />
Actual<br />
FY 2010<br />
Actual<br />
FY 2011<br />
Adopted<br />
FY 2011<br />
Amended<br />
FY 2011<br />
E<strong>st</strong>imated<br />
FY 2012<br />
Proposed<br />
FY 2012<br />
Change<br />
Debt 2,494,893 0 0 0 0 0 0.00%<br />
Total<br />
Appropriations 2,494,893 0 0 0 0 0 0.00%<br />
Increase/(Decrease) in Fund Balance (1) 0 0 0 0 0<br />
Beginning Balance 0 0 0 0 0 0<br />
Adju<strong>st</strong>ments 1 0 0 0 0 0<br />
Ending Balance 0 0 0 0 0 0<br />
This debt was paid <<strong>st</strong>rong>of</<strong>st</strong>rong>f in FY09.<br />
121
City <<strong>st</strong>rong>of</<strong>st</strong>rong> St. Petersburg, Florida - FY 2012 Proposed Fiscal Plan<br />
Utility Tax Debt Service (2021)<br />
Utility Tax Revenue Bonds were issued on a number <<strong>st</strong>rong>of</<strong>st</strong>rong> occasions between 1977 and 1988 to provide resources for general purpose <strong>capital</strong> projects including<br />
neighborhood <strong>st</strong>reets and drainage, <strong>st</strong>reets and drainage for newly annexed areas, acquisition <<strong>st</strong>rong>of</<strong>st</strong>rong> property for expansion <<strong>st</strong>rong>of</<strong>st</strong>rong> the University <<strong>st</strong>rong>of</<strong>st</strong>rong> South Florida St.<br />
Petersburg Campus, and numerous other City services and general governmental facilities. The fund was e<strong>st</strong>ablished in the Series 1986 Bonds.<br />
FY 2009<br />
Actual<br />
FY 2010<br />
Actual<br />
FY 2011<br />
Adopted<br />
FY 2011<br />
Amended<br />
FY 2011<br />
E<strong>st</strong>imated<br />
FY 2012<br />
Proposed<br />
FY 2012<br />
Change<br />
Revenue Summary<br />
Misc Revenues<br />
Intere<strong>st</strong> Earnings 6,420 979 0 0 0 0 0.00%<br />
Total Misc Revenues 6,420 979 0 0 0 0 0.00%<br />
Transfer In<br />
Utility Tax Revenue 2,816,747 1,881,585 0 0 0 0 0.00%<br />
Total Transfer In 2,816,747 1,881,585 0 0 0 0 0.00%<br />
Total<br />
Revenue Summary 2,823,167 1,882,564 0 0 0 0 0.00%<br />
Appropriations<br />
FY 2009<br />
Actual<br />
FY 2010<br />
Actual<br />
FY 2011<br />
Adopted<br />
FY 2011<br />
Amended<br />
FY 2011<br />
E<strong>st</strong>imated<br />
FY 2012<br />
Proposed<br />
FY 2012<br />
Change<br />
Debt 2,822,500 2,824,064 0 0 0 0 0.00%<br />
Total<br />
Appropriations 2,822,500 2,824,064 0 0 0 0 0.00%<br />
Increase/(Decrease) in Fund Balance 667 (941,500) 0 0 0 0<br />
Beginning Balance 940,832 941,500 0 0 0 0<br />
Adju<strong>st</strong>ments 1 0 0 0 0 0<br />
Ending Balance 941,500 0 0 0 0 0<br />
This debt was paid <<strong>st</strong>rong>of</<strong>st</strong>rong>f in FY10.<br />
122
City <<strong>st</strong>rong>of</<strong>st</strong>rong> St. Petersburg, Florida - FY 2012 Proposed Fiscal Plan<br />
Stadium Debt Service (2025)<br />
This fund was e<strong>st</strong>ablished in the Series 1984 Bonds. Excise Tax Secured Revenue Bonds ($85 million) were issued in 1987 to con<strong>st</strong>ruct a multi-purpose domed<br />
<strong>st</strong>adium (Tropicana Field) in St. Petersburg. $114 million <<strong>st</strong>rong>of</<strong>st</strong>rong> refunding excise tax bonds were issued in October 1993 to refund the remaining out<strong>st</strong>anding 1984<br />
Excise Tax Secured Revenue Bonds and the 1989B Public Improvement Revenue Bond issue. The 1993 refunding Excise Tax Bonds are secured by a pledge <<strong>st</strong>rong>of</<strong>st</strong>rong><br />
the City's guaranteed entitlement <<strong>st</strong>rong>of</<strong>st</strong>rong> Municipal Revenue Sharing, the City's Half-Cent Sales Tax, and a portion <<strong>st</strong>rong>of</<strong>st</strong>rong> Pinellas County Touri<strong>st</strong> Development Taxes.<br />
This debt was remarketed in 2003 to yield a net savings to the City <<strong>st</strong>rong>of</<strong>st</strong>rong> $3.544 million in FY04. Debt Service requirements run through FY16.<br />
FY 2009<br />
Actual<br />
FY 2010<br />
Actual<br />
FY 2011<br />
Adopted<br />
FY 2011<br />
Amended<br />
FY 2011<br />
E<strong>st</strong>imated<br />
FY 2012<br />
Proposed<br />
FY 2012<br />
Change<br />
Revenue Summary<br />
Intergovernmental Revenue<br />
State Shared Revenue 0 0 8,513,700 8,513,700 7,310,464 7,030,423 (17.42%)<br />
Shared Revenue 0 0 0 0 1,203,227 1,462,477 0.00%<br />
Total Intergovernmental Revenue 0 0 8,513,700 8,513,700 8,513,691 8,492,900 (0.24%)<br />
Misc Revenues<br />
Intere<strong>st</strong> Earnings 555,814 247,168 333,457 333,457 125,834 299,980 (10.04%)<br />
Total Misc Revenues 555,814 247,168 333,457 333,457 125,834 299,980 (10.04%)<br />
Transfer In<br />
Excise Tax Revenue 8,535,489 8,541,112 0 0 0 0 0.00%<br />
Total Transfer In 8,535,489 8,541,112 0 0 0 0 0.00%<br />
Total<br />
Revenue Summary 9,091,303 8,788,280 8,847,157 8,847,157 8,639,525 8,792,880 (0.61%)<br />
Appropriations<br />
FY 2009<br />
Actual<br />
FY 2010<br />
Actual<br />
FY 2011<br />
Adopted<br />
FY 2011<br />
Amended<br />
FY 2011<br />
E<strong>st</strong>imated<br />
FY 2012<br />
Proposed<br />
FY 2012<br />
Change<br />
Debt 8,407,498 8,397,033 8,386,282 8,386,282 8,386,282 8,375,019 (0.13%)<br />
Transfers Out<br />
Water Co<strong>st</strong> Stabilization 549,888 242,873 300,000 300,000 300,000 245,000 (18.33%)<br />
Total Transfers Out 549,888 242,873 300,000 300,000 300,000 245,000 (18.33%)<br />
Total<br />
Appropriations 8,957,386 8,639,906 8,686,282 8,686,282 8,686,282 8,620,019 (0.76%)<br />
Increase/(Decrease) in Fund Balance 133,917 148,374 160,875 160,875 (46,757) 172,861<br />
Beginning Balance 7,172,911 7,306,828 7,455,202 7,455,202 7,455,202 7,408,445<br />
Adju<strong>st</strong>ments 0 0 0 0 0 0<br />
Ending Balance 7,306,828 7,455,202 7,616,077 7,616,077 7,408,445 7,581,306<br />
$9 million was transferred into this fund from the Water Co<strong>st</strong> Stabilization Funds as a reserve for the Excise Tax Debt as a result <<strong>st</strong>rong>of</<strong>st</strong>rong> the bond surety being<br />
downgraded in FY08. The intere<strong>st</strong> on these funds will be transferred back into the Water Co<strong>st</strong> Stabilization Fund for eventual transfer to the Water Resources<br />
operations.<br />
123
City <<strong>st</strong>rong>of</<strong>st</strong>rong> St. Petersburg, Florida - FY 2012 Proposed Fiscal Plan<br />
Sports Facility Sales Tax Debt (2027)<br />
This fund was e<strong>st</strong>ablished in 1995 with the Series 1995 Bonds for principal and intere<strong>st</strong> payments on the $28.730 million Pr<<strong>st</strong>rong>of</<strong>st</strong>rong>essional Sports Facility Sales Tax<br />
Revenue Bonds used for modifications to Tropicana Field; it is supported by State Sales Tax revenues earmarked for sports facilities under Florida Statutes<br />
Chapter 166, Section 212.20(6)(g) 5.A and Section 228.1162. In 2003, the 1995 bond issue was refinanced using the $27.185 million Pr<<strong>st</strong>rong>of</<strong>st</strong>rong>essional Sports Facility<br />
Sales Tax refinancing revenue bonds.<br />
FY 2009<br />
Actual<br />
FY 2010<br />
Actual<br />
FY 2011<br />
Adopted<br />
FY 2011<br />
Amended<br />
FY 2011<br />
E<strong>st</strong>imated<br />
FY 2012<br />
Proposed<br />
FY 2012<br />
Change<br />
Revenue Summary<br />
Misc Revenues<br />
Intere<strong>st</strong> Earnings 1,609 775 7,400 7,400 142 755 (89.80%)<br />
Total Misc Revenues 1,609 775 7,400 7,400 142 755 (89.80%)<br />
Transfer In<br />
Pro Sports Facility 1,923,629 1,928,475 1,921,250 1,921,250 1,921,250 1,928,770 0.39%<br />
Total Transfer In 1,923,629 1,928,475 1,921,250 1,921,250 1,921,250 1,928,770 0.39%<br />
Total<br />
Revenue Summary 1,925,238 1,929,250 1,928,650 1,928,650 1,921,392 1,929,525 0.05%<br />
Appropriations<br />
FY 2009<br />
Actual<br />
FY 2010<br />
Actual<br />
FY 2011<br />
Adopted<br />
FY 2011<br />
Amended<br />
FY 2011<br />
E<strong>st</strong>imated<br />
FY 2012<br />
Proposed<br />
FY 2012<br />
Change<br />
Debt 1,921,206 1,912,244 1,913,950 1,913,950 1,913,950 1,911,587 (0.12%)<br />
Total<br />
Appropriations 1,921,206 1,912,244 1,913,950 1,913,950 1,913,950 1,911,587 (0.12%)<br />
Increase/(Decrease) in Fund Balance 4,032 17,006 14,700 14,700 7,442 17,938<br />
Beginning Balance 1,453,588 1,457,620 1,474,626 1,474,626 1,474,626 1,482,068<br />
Adju<strong>st</strong>ments 0 0 0 0 0 0<br />
Ending Balance 1,457,620 1,474,626 1,489,326 1,489,326 1,482,068 1,500,006<br />
124
City <<strong>st</strong>rong>of</<strong>st</strong>rong> St. Petersburg, Florida - FY 2012 Proposed Fiscal Plan<br />
Redevelopment Debt Service (2035)<br />
These bonds were issued in 1985 as part <<strong>st</strong>rong>of</<strong>st</strong>rong> a multi-year program to provide infra<strong>st</strong>ructure improvements, including parking facilities, in the Downtown<br />
Redevelopment Area in accordance with interlocal agreements between the City, the Community Redevelopment Agency (CRA), and Pinellas County. The 1984<br />
and 1985 issues were refinanced during FY88; a new $9.8 million issue (1989A) was made in March 1989, and a new $22.5 million issue (1989B) occurred in<br />
Augu<strong>st</strong> 1989 for improvements to Tropicana Field. All out<strong>st</strong>anding issues except Series 1989B were refinanced in 1992. The 1989B issue was refunded with issue<br />
proceeds from the 1993 Excise Tax Refunding Bond issue dated October 1993. Debt service for the new issue (Series 1992) runs through FY12.<br />
FY 2009<br />
Actual<br />
FY 2010<br />
Actual<br />
FY 2011<br />
Adopted<br />
FY 2011<br />
Amended<br />
FY 2011<br />
E<strong>st</strong>imated<br />
FY 2012<br />
Proposed<br />
FY 2012<br />
Change<br />
Revenue Summary<br />
Misc Revenues<br />
Intere<strong>st</strong> Earnings 5,532 0 0 0 0 0 0.00%<br />
Total Misc Revenues 5,532 0 0 0 0 0 0.00%<br />
Transfer In<br />
Downtown Redevelopment Di<strong>st</strong>rict 4,824,718 6,680,875 6,712,750 6,712,750 6,712,750 6,703,500 (0.14%)<br />
Total Transfer In 4,824,718 6,680,875 6,712,750 6,712,750 6,712,750 6,703,500 (0.14%)<br />
Total<br />
Revenue Summary 4,830,250 6,680,875 6,712,750 6,712,750 6,712,750 6,703,500 (0.14%)<br />
Appropriations<br />
FY 2009<br />
Actual<br />
FY 2010<br />
Actual<br />
FY 2011<br />
Adopted<br />
FY 2011<br />
Amended<br />
FY 2011<br />
E<strong>st</strong>imated<br />
FY 2012<br />
Proposed<br />
FY 2012<br />
Change<br />
Debt 6,463,250 6,680,875 6,712,750 6,712,750 6,712,750 6,703,500 (0.14%)<br />
Total<br />
Appropriations 6,463,250 6,680,875 6,712,750 6,712,750 6,712,750 6,703,500 (0.14%)<br />
Increase/(Decrease) in Fund Balance (1,633,000) 0 0 0 0 0<br />
Beginning Balance 1,633,000 0 0 0 0 0<br />
Adju<strong>st</strong>ments 0 0 0 0 0 0<br />
Ending Balance 0 0 0 0 0 0<br />
125
City <<strong>st</strong>rong>of</<strong>st</strong>rong> St. Petersburg, Florida - FY 2012 Proposed Fiscal Plan<br />
Water Resources (4001)<br />
The Water Resources Operating Fund, like all other Enterprise Funds, is used to account for co<strong>st</strong>s that are funded sub<strong>st</strong>antially by external (non-City department)<br />
user fees and charges. The fund is required to cover all expenses <<strong>st</strong>rong>of</<strong>st</strong>rong> the operation (salaries, benefits, services, commodities, and <strong>capital</strong> outlay) and allocation <<strong>st</strong>rong>of</<strong>st</strong>rong><br />
general and admini<strong>st</strong>rative co<strong>st</strong>s, payment-in-lieu-<<strong>st</strong>rong>of</<strong>st</strong>rong>-taxes, as well as any transfers to <strong>capital</strong> project funds, debt service funds, or return on inve<strong>st</strong>ment/equity. Its<br />
use is governed by City Code Article 1, Section 27-1.<br />
FY 2009<br />
Actual<br />
FY 2010<br />
Actual<br />
FY 2011<br />
Adopted<br />
FY 2011<br />
Amended<br />
FY 2011<br />
E<strong>st</strong>imated<br />
FY 2012<br />
Proposed<br />
FY 2012<br />
Change<br />
Revenue Summary<br />
Intergovernmental Revenue<br />
Grants From Other Local Units 126,667 72,513 120,000 353,043 17,109 100,000 (16.67%)<br />
Total Intergovernmental Revenue 126,667 72,513 120,000 353,043 17,109 100,000 (16.67%)<br />
Charges For Services<br />
General Government 0 0 0 0 409 0 0.00%<br />
Physical Environment Charges 90,337,933 90,827,710 95,300,483 95,300,483 94,947,314 101,114,200 6.10%<br />
Other Charges For Services 19,367 6,300 0 0 0 0 0.00%<br />
Total Charges For Services 90,357,300 90,834,010 95,300,483 95,300,483 94,947,723 101,114,200 6.10%<br />
Misc Revenues<br />
Intere<strong>st</strong> Earnings 629,270 798,359 483,982 483,982 29,171 120,469 (75.11%)<br />
Rents And Royalties 24,512 13,244 15,000 15,000 5,520 15,000 0.00%<br />
Sale Of Fixed Assets 76,849 115,355 80,000 80,000 19,139 60,000 (25.00%)<br />
Sale Of Surplus Material 138,657 66,979 100,000 100,000 21,435 50,000 (50.00%)<br />
Contributions And Donations 250,000 0 0 0 0 0 0.00%<br />
Misc Revenue (248,443) (266,970) (255,000) (255,000) (76,789) (250,000) (1.96%)<br />
Total Misc Revenues 870,845 726,967 423,982 423,982 (1,524) (4,531) (101.07%)<br />
Transfer In<br />
Water Co<strong>st</strong> Stabilization 5,767,058 2,994,316 3,000,000 3,000,000 1,493,971 1,500,000 (50.00%)<br />
Total Transfer In 5,767,058 2,994,316 3,000,000 3,000,000 1,493,971 1,500,000 (50.00%)<br />
Total<br />
Revenue Summary 97,121,870 94,627,806 98,844,465 99,077,508 96,457,279 102,709,669 3.91%<br />
Appropriations<br />
FY 2009<br />
Actual<br />
FY 2010<br />
Actual<br />
FY 2011<br />
Adopted<br />
FY 2011<br />
Amended<br />
FY 2011<br />
E<strong>st</strong>imated<br />
FY 2012<br />
Proposed<br />
FY 2012<br />
Change<br />
Wages And Benefits 21,750,519 21,918,184 22,183,375 22,219,527 21,425,226 22,328,835 0.66%<br />
Services And Commodities 59,041,345 59,636,886 59,820,844 60,524,504 60,554,965 60,137,380 0.53%<br />
Capital 151,329 145,424 287,925 304,602 274,717 244,424 (15.11%)<br />
Debt (243,100) 0 0 0 0 0 0.00%<br />
Transfers Out<br />
Water Resources Debt 12,485,618 14,922,808 14,923,400 14,923,400 14,923,400 17,130,250 14.79%<br />
Water Resource Capital Projects 3,000,000 3,000,000 3,000,000 3,000,000 3,000,000 3,000,000 0.00%<br />
Total Transfers Out 15,485,618 17,922,808 17,923,400 17,923,400 17,923,400 20,130,250 12.31%<br />
Total<br />
Appropriations 96,185,711 99,623,302 100,215,544 100,972,033 100,178,308 102,840,889 2.62%<br />
Increase/(Decrease) in Fund Balance 936,159 (4,995,496) (1,371,079) (1,894,525) (3,721,029) (131,220)<br />
Beginning Balance 24,026,946 24,411,251 23,256,143 23,256,143 23,256,143 20,047,629<br />
Adju<strong>st</strong>ments (551,854) 3,840,388 0 512,515 512,515 0<br />
Ending Balance 24,411,251 23,256,143 21,885,064 21,874,133 20,047,629 19,916,409<br />
A rate <strong>st</strong>udy is in progress to identify any necessary rate increases.<br />
126
City <<strong>st</strong>rong>of</<strong>st</strong>rong> St. Petersburg, Florida - FY 2012 Proposed Fiscal Plan<br />
Water Resources Debt (4002)<br />
In FY85, Series 1985A for $22.345 million and Series 1985B for $19 million were issued. The $57 million Water Resources Revenue Bond Refunding Issue from<br />
1977 was retired, and $16.5 million in bond anticipation notes dated Augu<strong>st</strong> 1, 1982 were redeemed. Out<strong>st</strong>anding Water Resources bond issues were refinanced<br />
late in FY91. During FY93, there was a new issue <<strong>st</strong>rong>of</<strong>st</strong>rong> approximately $34 million which was subsequently refunded with Series 1999A and 1999B. Additional<br />
bonds were issued in FY03 ($45 million) and FY09 ($53.015 million). Resolution 91-549 e<strong>st</strong>ablished this fund.<br />
FY 2009<br />
Actual<br />
FY 2010<br />
Actual<br />
FY 2011<br />
Adopted<br />
FY 2011<br />
Amended<br />
FY 2011<br />
E<strong>st</strong>imated<br />
FY 2012<br />
Proposed<br />
FY 2012<br />
Change<br />
Revenue Summary<br />
Misc Revenues<br />
Intere<strong>st</strong> Earnings 76,886 150,886 149,858 149,858 60,035 151,111 0.84%<br />
Total Misc Revenues 76,886 150,886 149,858 149,858 60,035 151,111 0.84%<br />
Transfer In<br />
Water Resources 12,485,618 14,922,808 14,923,400 14,923,400 14,923,400 17,130,250 14.79%<br />
Total Transfer In 12,485,618 14,922,808 14,923,400 14,923,400 14,923,400 17,130,250 14.79%<br />
Debt & Loan Proceeds<br />
Debt Proceeds 28,286,131 0 0 0 5,448,080 1,188,752 0.00%<br />
Total Debt & Loan Proceeds 28,286,131 0 0 0 5,448,080 1,188,752 0.00%<br />
Total<br />
Revenue Summary 40,848,635 15,073,694 15,073,258 15,073,258 20,431,515 18,470,113 22.54%<br />
Appropriations<br />
FY 2009<br />
Actual<br />
FY 2010<br />
Actual<br />
FY 2011<br />
Adopted<br />
FY 2011<br />
Amended<br />
FY 2011<br />
E<strong>st</strong>imated<br />
FY 2012<br />
Proposed<br />
FY 2012<br />
Change<br />
Services And Commodities 7,800 0 0 0 0 0 0.00%<br />
Debt 35,666,055 13,450,561 15,020,476 15,020,476 13,842,861 18,046,144 20.14%<br />
Total<br />
Appropriations 35,673,855 13,450,561 15,020,476 15,020,476 13,842,861 18,046,144 20.14%<br />
Increase/(Decrease) in Fund Balance 5,174,780 1,623,133 52,782 52,782 6,588,654 423,969<br />
Beginning Balance 7,415,581 12,578,042 14,201,175 14,201,175 14,201,175 20,789,829<br />
Adju<strong>st</strong>ments (12,319) 0 0 0 0 0<br />
Ending Balance 12,578,042 14,201,175 14,253,957 14,253,957 20,789,829 21,213,798<br />
127
City <<strong>st</strong>rong>of</<strong>st</strong>rong> St. Petersburg, Florida - FY 2012 Proposed Fiscal Plan<br />
Water Co<strong>st</strong> Stabilization (4005)<br />
This fund was e<strong>st</strong>ablished in FY98 from the sale <<strong>st</strong>rong>of</<strong>st</strong>rong> the well fields to Tampa Bay Water in order to build a fund that could be drawn again<strong>st</strong> to help limit rate<br />
increases. On April 8, 1999, the City Council approved the transfer <<strong>st</strong>rong>of</<strong>st</strong>rong> intere<strong>st</strong> earnings from this fund to the Water Resources Operating Fund to partially <<strong>st</strong>rong>of</<strong>st</strong>rong>fset<br />
the co<strong>st</strong> <<strong>st</strong>rong>of</<strong>st</strong>rong> buying water.<br />
FY 2009<br />
Actual<br />
FY 2010<br />
Actual<br />
FY 2011<br />
Adopted<br />
FY 2011<br />
Amended<br />
FY 2011<br />
E<strong>st</strong>imated<br />
FY 2012<br />
Proposed<br />
FY 2012<br />
Change<br />
Revenue Summary<br />
Misc Revenues<br />
Intere<strong>st</strong> Earnings 5,217,171 3,545,364 2,700,000 2,700,000 1,193,971 1,255,000 (53.52%)<br />
Total Misc Revenues 5,217,171 3,545,364 2,700,000 2,700,000 1,193,971 1,255,000 (53.52%)<br />
Transfer In<br />
Stadium Debt Service 549,888 242,873 300,000 300,000 300,000 245,000 (18.33%)<br />
Total Transfer In 549,888 242,873 300,000 300,000 300,000 245,000 (18.33%)<br />
Total<br />
Revenue Summary 5,767,059 3,788,237 3,000,000 3,000,000 1,493,971 1,500,000 (50.00%)<br />
Transfers Out<br />
Water Resources 5,767,058 2,994,316 3,000,000 3,000,000 1,493,971 1,500,000 (50.00%)<br />
Total Transfers Out 5,767,058 2,994,316 3,000,000 3,000,000 1,493,971 1,500,000 (50.00%)<br />
Total 5,767,058 2,994,316 3,000,000 3,000,000 1,493,971 1,500,000 (50.00%)<br />
Increase/(Decrease) in Fund Balance 1 793,921 0 0 0 0<br />
Beginning Balance 85,703,909 83,234,971 83,241,427 83,241,427 83,241,427 83,241,427<br />
Adju<strong>st</strong>ments (2,468,939) (787,465) 0 0 0 0<br />
Ending Balance 83,234,971 83,241,427 83,241,427 83,241,427 83,241,427 83,241,427<br />
128
City <<strong>st</strong>rong>of</<strong>st</strong>rong> St. Petersburg, Florida - FY 2012 Proposed Fiscal Plan<br />
Stormwater Utility Operating (4011)<br />
The Stormwater Utility Operating Fund, like all other Enterprise Funds, is used to account for co<strong>st</strong>s that are funded sub<strong>st</strong>antially by external (non-City<br />
department) user fees and charges. The fund is required to cover all expenses <<strong>st</strong>rong>of</<strong>st</strong>rong> the operation (salaries, benefits, services, commodities, and <strong>capital</strong> outlay) and<br />
allocation <<strong>st</strong>rong>of</<strong>st</strong>rong> general and admini<strong>st</strong>rative co<strong>st</strong>s, payment-in-lieu-<<strong>st</strong>rong>of</<strong>st</strong>rong>-taxes, as well as any transfers to <strong>capital</strong> project funds, debt service funds, or return on<br />
inve<strong>st</strong>ment/equity.<br />
FY 2009<br />
Actual<br />
FY 2010<br />
Actual<br />
FY 2011<br />
Adopted<br />
FY 2011<br />
Amended<br />
FY 2011<br />
E<strong>st</strong>imated<br />
FY 2012<br />
Proposed<br />
FY 2012<br />
Change<br />
Revenue Summary<br />
Intergovernmental Revenue<br />
Federal Grants 45,363 0 0 0 0 0 0.00%<br />
State Grants 6,957 0 0 0 0 0 0.00%<br />
Total Intergovernmental Revenue 52,320 0 0 0 0 0 0.00%<br />
Charges For Services<br />
Physical Environment Charges 11,783,898 11,828,564 11,769,885 11,769,885 12,122,023 11,769,885 0.00%<br />
Other Charges For Services 256,513 486,969 300,000 300,000 183,593 300,000 0.00%<br />
Total Charges For Services 12,040,411 12,315,533 12,069,885 12,069,885 12,305,616 12,069,885 0.00%<br />
Misc Revenues<br />
Intere<strong>st</strong> Earnings 158,126 21,053 60,000 60,000 16,144 23,832 (60.28%)<br />
Sale Of Fixed Assets 20,622 2,609 7,000 7,000 16,124 7,000 0.00%<br />
Sale Of Surplus Material 2,431 15,700 0 0 3,289 0 0.00%<br />
Contributions And Donations 15,000 0 0 0 0 0 0.00%<br />
Misc Revenue (30,898) (26,600) (51,000) (51,000) (15,643) (51,000) 0.00%<br />
Total Misc Revenues 165,281 12,762 16,000 16,000 19,914 (20,168) (226.05%)<br />
Total<br />
Revenue Summary 12,258,012 12,328,295 12,085,885 12,085,885 12,325,530 12,049,717 (0.30%)<br />
Appropriations<br />
FY 2009<br />
Actual<br />
FY 2010<br />
Actual<br />
FY 2011<br />
Adopted<br />
FY 2011<br />
Amended<br />
FY 2011<br />
E<strong>st</strong>imated<br />
FY 2012<br />
Proposed<br />
FY 2012<br />
Change<br />
Wages And Benefits 4,125,546 4,261,276 3,547,687 3,499,267 4,058,260 3,508,181 (1.11%)<br />
Services And Commodities 4,686,744 4,727,961 4,785,369 4,887,418 5,263,587 5,119,720 6.99%<br />
Capital 683 2,415 0 0 381 0 0.00%<br />
Transfers Out<br />
Stormwater Debt Service 1,055,061 1,057,856 1,053,000 1,053,000 1,053,000 1,058,000 0.47%<br />
Stormwater Drainage Capital 1,494,804 1,930,000 800,000 800,000 800,000 800,000 0.00%<br />
Total Transfers Out 2,549,865 2,987,856 1,853,000 1,853,000 1,853,000 1,858,000 0.27%<br />
Total<br />
Appropriations 11,362,838 11,979,508 10,186,056 10,239,685 11,175,228 10,485,901 2.94%<br />
Increase/(Decrease) in Fund Balance 895,174 348,787 1,899,829 1,846,200 1,150,302 1,563,816<br />
Beginning Balance 2,591,556 3,304,412 4,120,068 4,120,068 4,120,068 5,336,307<br />
Adju<strong>st</strong>ments (182,318) 466,869 0 65,937 65,937 0<br />
Ending Balance 3,304,412 4,120,068 6,019,897 6,032,205 5,336,307 6,900,123<br />
A rate <strong>st</strong>udy is in progress to identify any necessary rate increases.<br />
129
City <<strong>st</strong>rong>of</<strong>st</strong>rong> St. Petersburg, Florida - FY 2012 Proposed Fiscal Plan<br />
Stormwater Debt Service (4012)<br />
The debt was issued in May 1999 (Resolution 99-287) and allowed for the acceleration <<strong>st</strong>rong>of</<strong>st</strong>rong> approximately 20 <strong>st</strong>ormwater projects.<br />
FY 2009<br />
Actual<br />
FY 2010<br />
Actual<br />
FY 2011<br />
Adopted<br />
FY 2011<br />
Amended<br />
FY 2011<br />
E<strong>st</strong>imated<br />
FY 2012<br />
Proposed<br />
FY 2012<br />
Change<br />
Revenue Summary<br />
Misc Revenues<br />
Intere<strong>st</strong> Earnings 919 317 3,032 3,032 59 332 (89.05%)<br />
Total Misc Revenues 919 317 3,032 3,032 59 332 (89.05%)<br />
Transfer In<br />
Stormwater Utility Operating 1,055,061 1,057,856 1,053,000 1,053,000 1,053,000 1,058,000 0.47%<br />
Total Transfer In 1,055,061 1,057,856 1,053,000 1,053,000 1,053,000 1,058,000 0.47%<br />
Total<br />
Revenue Summary 1,055,980 1,058,173 1,056,032 1,056,032 1,053,059 1,058,332 0.22%<br />
Appropriations<br />
FY 2009<br />
Actual<br />
FY 2010<br />
Actual<br />
FY 2011<br />
Adopted<br />
FY 2011<br />
Amended<br />
FY 2011<br />
E<strong>st</strong>imated<br />
FY 2012<br />
Proposed<br />
FY 2012<br />
Change<br />
Debt 1,052,737 1,053,076 1,055,252 1,055,252 1,055,252 1,053,332 (0.18%)<br />
Total<br />
Appropriations 1,052,737 1,053,076 1,055,252 1,055,252 1,055,252 1,053,332 (0.18%)<br />
Increase/(Decrease) in Fund Balance 3,243 5,097 780 780 (2,193) 5,000<br />
Beginning Balance 593,747 596,990 602,087 602,087 602,087 599,894<br />
Adju<strong>st</strong>ments 0 0 0 0 0 0<br />
Ending Balance 596,990 602,087 602,867 602,867 599,894 604,894<br />
130
City <<strong>st</strong>rong>of</<strong>st</strong>rong> St. Petersburg, Florida - FY 2012 Proposed Fiscal Plan<br />
Sanitation Operating (4021)<br />
The Sanitation Operating Fund, like all other Enterprise Funds, is used to account for co<strong>st</strong>s that are funded sub<strong>st</strong>antially by external (non-City department) user<br />
fees and charges. The fund is required to cover all expenses <<strong>st</strong>rong>of</<strong>st</strong>rong> the operation (salaries, benefits, services, commodities and <strong>capital</strong> outlay) and allocation <<strong>st</strong>rong>of</<strong>st</strong>rong> general<br />
and admini<strong>st</strong>rative co<strong>st</strong>s, payment-in-lieu-<<strong>st</strong>rong>of</<strong>st</strong>rong>-taxes, as well as any transfers to <strong>capital</strong> project funds, debt service funds, or return on inve<strong>st</strong>ment/equity. The<br />
Sanitation Operating Fund supports both Sanitation operations and part <<strong>st</strong>rong>of</<strong>st</strong>rong> the Codes Compliance Department (Sanitation/Codes Compliance Demolition division.)<br />
FY 2009<br />
Actual<br />
FY 2010<br />
Actual<br />
FY 2011<br />
Adopted<br />
FY 2011<br />
Amended<br />
FY 2011<br />
E<strong>st</strong>imated<br />
FY 2012<br />
Proposed<br />
FY 2012<br />
Change<br />
Revenue Summary<br />
Intergovernmental Revenue<br />
Federal Grants 14,777 0 0 0 0 0 0.00%<br />
State Grants 2,266 0 0 0 0 0 0.00%<br />
Grants From Other Local Units 190,686 189,581 190,398 190,398 0 190,398 0.00%<br />
Total Intergovernmental Revenue 207,729 189,581 190,398 190,398 0 190,398 0.00%<br />
Charges For Services<br />
General Government 1,930 11,276 0 0 5,424 0 0.00%<br />
Physical Environment Charges 40,025,836 39,761,394 39,691,000 39,691,000 40,240,323 39,406,000 (0.72%)<br />
Other Charges For Services 1,625 217 0 0 0 0 0.00%<br />
Total Charges For Services 40,029,391 39,772,887 39,691,000 39,691,000 40,245,747 39,406,000 (0.72%)<br />
Misc Revenues<br />
Intere<strong>st</strong> Earnings 395,054 270,162 258,000 258,000 60,784 102,478 (60.28%)<br />
Special Assessment 242,204 174,032 0 0 0 0 0.00%<br />
Sale Of Fixed Assets 235,205 17,546 108,000 108,000 147,861 108,000 0.00%<br />
Sale Of Surplus Material 26,776 217,293 304,000 304,000 130,503 304,000 0.00%<br />
Misc Revenue 39,264 (8,216) 3,000 3,000 (27,716) 3,000 0.00%<br />
Total Misc Revenues 938,503 670,817 673,000 673,000 311,432 517,478 (23.11%)<br />
Total<br />
Revenue Summary 41,175,623 40,633,285 40,554,398 40,554,398 40,557,179 40,113,876 (1.09%)<br />
Appropriations<br />
FY 2009<br />
Actual<br />
FY 2010<br />
Actual<br />
FY 2011<br />
Adopted<br />
FY 2011<br />
Amended<br />
FY 2011<br />
E<strong>st</strong>imated<br />
FY 2012<br />
Proposed<br />
FY 2012<br />
Change<br />
Wages And Benefits 12,764,972 12,970,460 13,527,843 13,527,843 11,858,769 13,550,654 0.17%<br />
Services And Commodities 23,197,584 23,136,160 22,829,589 22,911,003 23,919,236 22,530,828 (1.31%)<br />
Capital 16,082 7,979 0 30 1,811 0 0.00%<br />
Transfers Out<br />
General Fund 455,076 455,076 455,076 455,076 455,076 455,076 0.00%<br />
Sanitation Equipment Replacement 3,000,000 2,342,735 2,000,000 2,000,000 2,000,000 2,000,000 0.00%<br />
Total Transfers Out 3,455,076 2,797,811 2,455,076 2,455,076 2,455,076 2,455,076 0.00%<br />
Total<br />
Appropriations 39,433,714 38,912,410 38,812,508 38,893,952 38,234,892 38,536,558 (0.71%)<br />
Increase/(Decrease) in Fund Balance 1,741,909 1,720,875 1,741,890 1,660,446 2,322,287 1,577,318<br />
Beginning Balance 4,046,242 5,506,567 10,969,093 10,969,093 10,969,093 13,372,824<br />
Adju<strong>st</strong>ments (281,584) 3,741,651 0 81,444 81,444 0<br />
Ending Balance 5,506,567 10,969,093 12,710,983 12,710,983 13,372,824 14,950,142<br />
A rate <strong>st</strong>udy is in progress to determine any necessary rate increases.<br />
131
City <<strong>st</strong>rong>of</<strong>st</strong>rong> St. Petersburg, Florida - FY 2012 Proposed Fiscal Plan<br />
Sanitation Equipment Replacement (4027)<br />
This fund was e<strong>st</strong>ablished to provide a funded reserve for the replacement <<strong>st</strong>rong>of</<strong>st</strong>rong> Sanitation equipment including residential, commercial, and brush vehicles and<br />
receptacles. It also funds any <strong>capital</strong> projects related to Sanitation facilities.<br />
FY 2009<br />
Actual<br />
FY 2010<br />
Actual<br />
FY 2011<br />
Adopted<br />
FY 2011<br />
Amended<br />
FY 2011<br />
E<strong>st</strong>imated<br />
FY 2012<br />
Proposed<br />
FY 2012<br />
Change<br />
Revenue Summary<br />
Misc Revenues<br />
Intere<strong>st</strong> Earnings 83,898 89,725 75,000 75,000 (1,755) 29,790 (60.28%)<br />
Misc Revenue (2,346) 0 0 0 0 0 0.00%<br />
Total Misc Revenues 81,552 89,725 75,000 75,000 (1,755) 29,790 (60.28%)<br />
Transfer In<br />
Sanitation Operating 3,000,000 2,342,735 2,000,000 2,000,000 2,000,000 2,000,000 0.00%<br />
Total Transfer In 3,000,000 2,342,735 2,000,000 2,000,000 2,000,000 2,000,000 0.00%<br />
Total<br />
Revenue Summary 3,081,552 2,432,460 2,075,000 2,075,000 1,998,245 2,029,790 (2.18%)<br />
Appropriations<br />
FY 2009<br />
Actual<br />
FY 2010<br />
Actual<br />
FY 2011<br />
Adopted<br />
FY 2011<br />
Amended<br />
FY 2011<br />
E<strong>st</strong>imated<br />
FY 2012<br />
Proposed<br />
FY 2012<br />
Change<br />
Services And Commodities 2,420 0 1,700 1,700 232,000 500,000 29311.76%<br />
Capital 1,463,808 3,365,804 771,052 2,691,184 2,460,610 1,744,000 126.18%<br />
Total<br />
Appropriations 1,466,228 3,365,804 772,752 2,692,884 2,692,610 2,244,000 190.39%<br />
Increase/(Decrease) in Fund Balance 1,615,324 (933,344) 1,302,248 (617,884) (694,365) (214,210)<br />
Beginning Balance 2,606,868 4,255,691 3,375,000 3,375,000 3,375,000 4,600,767<br />
Adju<strong>st</strong>ments 33,499 52,653 0 1,920,132 1,920,132 0<br />
Ending Balance 4,255,691 3,375,000 4,677,248 4,677,248 4,600,767 4,386,557<br />
For FY12, a $2,000,000 transfer from the Sanitation Operating Fund to the Sanitation Equipment Replacement Fund was <strong>budget</strong>ed, which is inline with FY11.<br />
132
City <<strong>st</strong>rong>of</<strong>st</strong>rong> St. Petersburg, Florida - FY 2012 Proposed Fiscal Plan<br />
Airport Operating (4031)<br />
The Airport Operating Fund, like all other Enterprise Funds, is used to account for co<strong>st</strong>s that are funded sub<strong>st</strong>antially by external (non-City department) user fees<br />
and charges. The fund is required to cover all expenses <<strong>st</strong>rong>of</<strong>st</strong>rong> the operation (salaries, benefits, services, commodities, and <strong>capital</strong> outlay) and allocation <<strong>st</strong>rong>of</<strong>st</strong>rong> general and<br />
admini<strong>st</strong>rative co<strong>st</strong>s and payment-in-lieu-<<strong>st</strong>rong>of</<strong>st</strong>rong>-taxes, as well as any transfers to <strong>capital</strong> project funds, debt service funds, or return on inve<strong>st</strong>ment/equity.<br />
FY 2009<br />
Actual<br />
FY 2010<br />
Actual<br />
FY 2011<br />
Adopted<br />
FY 2011<br />
Amended<br />
FY 2011<br />
E<strong>st</strong>imated<br />
FY 2012<br />
Proposed<br />
FY 2012<br />
Change<br />
Revenue Summary<br />
Charges For Services<br />
Transportation Charges 894,795 941,530 945,800 945,800 980,196 993,100 5.00%<br />
Other Charges For Services 119 1,552 0 0 0 0 0.00%<br />
Total Charges For Services 894,914 943,082 945,800 945,800 980,196 993,100 5.00%<br />
Misc Revenues<br />
Intere<strong>st</strong> Earnings 550 103 6,100 6,100 1 0 (100.00%)<br />
Misc Revenue 451 2,623 0 0 23 0 0.00%<br />
Total Misc Revenues 1,001 2,726 6,100 6,100 24 0 (100.00%)<br />
Transfer In<br />
General Fund 466,000 136,000 0 0 0 0 0.00%<br />
Economic Stability 1,009,594 0 0 0 0 0 0.00%<br />
Utility Tax Revenue 0 51,469 0 0 0 0 0.00%<br />
Airport Capital Projects 180,406 0 0 0 0 0 0.00%<br />
Total Transfer In 1,656,000 187,469 0 0 0 0 0.00%<br />
Total<br />
Revenue Summary 2,551,915 1,133,277 951,900 951,900 980,220 993,100 4.33%<br />
Appropriations<br />
FY 2009<br />
Actual<br />
FY 2010<br />
Actual<br />
FY 2011<br />
Adopted<br />
FY 2011<br />
Amended<br />
FY 2011<br />
E<strong>st</strong>imated<br />
FY 2012<br />
Proposed<br />
FY 2012<br />
Change<br />
Wages And Benefits 344,352 335,601 366,610 366,610 251,497 362,584 (1.10%)<br />
Services And Commodities 522,880 528,461 513,067 519,696 631,208 546,597 6.54%<br />
Capital 773 5,656 0 702 0 0 0.00%<br />
Debt 1,582,493 0 0 0 0 0 0.00%<br />
Transfers Out<br />
General Fund 0 0 50,000 50,000 50,000 50,000 0.00%<br />
Airport Capital Projects 249,996 390,000 10,000 48,404 48,404 0 (100.00%)<br />
Total Transfers Out 249,996 390,000 60,000 98,404 98,404 50,000 (16.67%)<br />
Total<br />
Appropriations 2,700,494 1,259,718 939,677 985,412 981,109 959,181 2.08%<br />
Increase/(Decrease) in Fund Balance (148,579) (126,441) 12,223 (33,512) (889) 33,919<br />
Beginning Balance 316,870 176,734 114,000 114,000 114,000 120,443<br />
Adju<strong>st</strong>ments 8,443 63,707 0 7,332 7,332 0<br />
Ending Balance 176,734 114,000 126,223 87,820 120,443 154,362<br />
Since FY06, payments from the General Fund totaling $2.004 million have been needed for the Airport's operations. Because the Airport is an enterprise fund,<br />
these payments from the General Fund are considered a loan and will be repaid from future Airport revenues.<br />
The remaining Airport bonded debt, in the amount <<strong>st</strong>rong>of</<strong>st</strong>rong> $1,582,493, was paid in FY09. Part <<strong>st</strong>rong>of</<strong>st</strong>rong> this payment, $1,009,594, was provided by the Economic Stability<br />
Fund and will be repaid from future earnings <<strong>st</strong>rong>of</<strong>st</strong>rong> the Airport.<br />
133
City <<strong>st</strong>rong>of</<strong>st</strong>rong> St. Petersburg, Florida - FY 2012 Proposed Fiscal Plan<br />
In FY11, the Airport no longer required a loan from the General Fund and will pay back $50,000 to the General Fund. In FY12, it is <strong>proposed</strong> that the Airport<br />
continue paying back the General Fund at the amount <<strong>st</strong>rong>of</<strong>st</strong>rong> $50,000.<br />
Also in FY12, the Airport's revenues are expected to increase by 4.33% due to an increase in Airport rental charges and it's expenses by 2.08% due mainly to<br />
increases in Electric and Payment in Lieu <<strong>st</strong>rong>of</<strong>st</strong>rong> Taxes (PILOT).<br />
134
City <<strong>st</strong>rong>of</<strong>st</strong>rong> St. Petersburg, Florida - FY 2012 Proposed Fiscal Plan<br />
Marina Operating (4041)<br />
The Marina Operating Fund, like all other Enterprise Funds, is used to account for co<strong>st</strong>s that are funded sub<strong>st</strong>antially by external (non-City department) user fees<br />
and charges. The fund is required to cover all expenses <<strong>st</strong>rong>of</<strong>st</strong>rong> the operation (salaries, benefits, services, commodities, and <strong>capital</strong> outlay) and allocation <<strong>st</strong>rong>of</<strong>st</strong>rong> general and<br />
admini<strong>st</strong>rative co<strong>st</strong>s and payment-in-lieu-<<strong>st</strong>rong>of</<strong>st</strong>rong>-taxes, as well as any transfers to <strong>capital</strong> project funds, debt service funds, or return on inve<strong>st</strong>ment/equity.<br />
FY 2009<br />
Actual<br />
FY 2010<br />
Actual<br />
FY 2011<br />
Adopted<br />
FY 2011<br />
Amended<br />
FY 2011<br />
E<strong>st</strong>imated<br />
FY 2012<br />
Proposed<br />
FY 2012<br />
Change<br />
Revenue Summary<br />
Charges For Services<br />
Culture And Recreation Charges 2,763,957 2,782,018 2,954,287 2,954,287 3,173,408 3,222,903 9.09%<br />
Total Charges For Services 2,763,957 2,782,018 2,954,287 2,954,287 3,173,408 3,222,903 9.09%<br />
Fines And Forfeitures<br />
Traffic And Parking 980 340 0 0 80 0 0.00%<br />
Total Fines And Forfeitures 980 340 0 0 80 0 0.00%<br />
Misc Revenues<br />
Intere<strong>st</strong> Earnings 9,843 300 3,000 3,000 25 1,192 (60.27%)<br />
Misc Revenue 681 (12,113) 1,500 1,500 (10,868) 1,500 0.00%<br />
Total Misc Revenues 10,524 (11,813) 4,500 4,500 (10,843) 2,692 (40.18%)<br />
Transfer In<br />
Utility Tax Revenue 0 286,930 0 0 0 0 0.00%<br />
Total Transfer In 0 286,930 0 0 0 0 0.00%<br />
Internal Charges<br />
Other Charges (55) (678) 0 0 (58) 0 0.00%<br />
Total Internal Charges (55) (678) 0 0 (58) 0 0.00%<br />
Total<br />
Revenue Summary 2,775,406 3,056,797 2,958,787 2,958,787 3,162,587 3,225,595 9.02%<br />
Appropriations<br />
FY 2009<br />
Actual<br />
FY 2010<br />
Actual<br />
FY 2011<br />
Adopted<br />
FY 2011<br />
Amended<br />
FY 2011<br />
E<strong>st</strong>imated<br />
FY 2012<br />
Proposed<br />
FY 2012<br />
Change<br />
Wages And Benefits 860,984 895,237 910,395 910,395 800,269 983,496 8.03%<br />
Services And Commodities 767,801 866,270 915,336 948,302 1,243,036 1,156,135 26.31%<br />
Capital 5,968 3,000 0 0 0 0 0.00%<br />
Debt 672,794 673,725 670,971 670,971 669,916 670,771 (0.03%)<br />
Transfers Out<br />
General Fund 300,000 300,000 300,000 300,000 300,000 310,000 3.33%<br />
Marina Capital Improvement 350,004 350,004 105,000 105,000 105,000 105,000 0.00%<br />
Total Transfers Out 650,004 650,004 405,000 405,000 405,000 415,000 2.47%<br />
Total<br />
Appropriations 2,957,551 3,088,236 2,901,702 2,934,668 3,118,221 3,225,402 11.16%<br />
Increase/(Decrease) in Fund Balance (182,145) (31,439) 57,085 24,119 44,366 193<br />
Beginning Balance 469,220 284,888 225,000 225,000 225,000 302,333<br />
Adju<strong>st</strong>ments (2,187) (28,449) 0 32,967 32,967 0<br />
Ending Balance 284,888 225,000 282,085 282,086 302,333 302,526<br />
A rent increase is not <strong>budget</strong>ed for FY12. There was also no increase in FY10 and FY11.<br />
135
City <<strong>st</strong>rong>of</<strong>st</strong>rong> St. Petersburg, Florida - FY 2012 Proposed Fiscal Plan<br />
The debt service associated with the con<strong>st</strong>ruction at the Marina for the fifth pier and the renovations is $670,771.<br />
In FY12, the fund's revenues are projected to increase by 9.02% and it's expenses by 11.16%. Both increases are associated with the Marina Ship Store, which the<br />
City took over operations <<strong>st</strong>rong>of</<strong>st</strong>rong> in FY11.<br />
In FY12, two temporary positions at the Marina, a full-time Account Clerk II and a part-time Marina Assi<strong>st</strong>ant, will be added for the Marina Ship Store.<br />
136
City <<strong>st</strong>rong>of</<strong>st</strong>rong> St. Petersburg, Florida - FY 2012 Proposed Fiscal Plan<br />
Golf Course Operating (4061)<br />
The Golf Courses Operating Fund, like all other Enterprise Funds, is used to account for co<strong>st</strong>s that are funded sub<strong>st</strong>antially by external (non-City department) user<br />
fees and charges. The fund is required to cover all expenses <<strong>st</strong>rong>of</<strong>st</strong>rong> the operation (salaries, benefits, services, commodities, and <strong>capital</strong> outlay), allocation <<strong>st</strong>rong>of</<strong>st</strong>rong> general<br />
and admini<strong>st</strong>rative co<strong>st</strong>s, and payment-in-lieu-<<strong>st</strong>rong>of</<strong>st</strong>rong>-taxes, as well as any transfers to <strong>capital</strong> project funds, debt service funds, or return on inve<strong>st</strong>ment/equity.<br />
FY 2009<br />
Actual<br />
FY 2010<br />
Actual<br />
FY 2011<br />
Adopted<br />
FY 2011<br />
Amended<br />
FY 2011<br />
E<strong>st</strong>imated<br />
FY 2012<br />
Proposed<br />
FY 2012<br />
Change<br />
Revenue Summary<br />
Intergovernmental Revenue<br />
State Grants 35,000 0 0 0 0 0 0.00%<br />
Total Intergovernmental Revenue 35,000 0 0 0 0 0 0.00%<br />
Charges For Services<br />
Culture And Recreation Charges 3,719,831 3,272,489 3,780,250 3,780,250 3,567,296 3,756,120 (0.64%)<br />
Other Charges For Services 1,056 2,819 1,060 1,060 2,867 1,060 0.00%<br />
Total Charges For Services 3,720,887 3,275,308 3,781,310 3,781,310 3,570,163 3,757,180 (0.64%)<br />
Misc Revenues<br />
Intere<strong>st</strong> Earnings 2,028 269 2,030 2,030 27 806 (60.30%)<br />
Sale Of Fixed Assets 5,550 0 0 0 0 0 0.00%<br />
Contributions And Donations 140,907 4,480 0 0 0 0 0.00%<br />
Misc Revenue 1,434 2,083 0 0 232 0 0.00%<br />
Total Misc Revenues 149,919 6,832 2,030 2,030 259 806 (60.30%)<br />
Transfer In<br />
Utility Tax Revenue 0 462,357 0 0 0 0 0.00%<br />
Total Transfer In 0 462,357 0 0 0 0 0.00%<br />
Internal Charges<br />
Other Charges (790) 410 0 0 (40) 0 0.00%<br />
Total Internal Charges (790) 410 0 0 (40) 0 0.00%<br />
Total<br />
Revenue Summary 3,905,016 3,744,907 3,783,340 3,783,340 3,570,382 3,757,986 (0.67%)<br />
Appropriations<br />
FY 2009<br />
Actual<br />
FY 2010<br />
Actual<br />
FY 2011<br />
Adopted<br />
FY 2011<br />
Amended<br />
FY 2011<br />
E<strong>st</strong>imated<br />
FY 2012<br />
Proposed<br />
FY 2012<br />
Change<br />
Wages And Benefits 2,267,385 2,157,385 2,190,731 2,190,731 2,124,522 2,171,521 (0.88%)<br />
Services And Commodities 1,608,651 1,349,999 1,484,058 1,508,275 1,515,422 1,458,106 (1.75%)<br />
Capital 30,681 68,272 89,100 89,100 5,412 80,000 (10.21%)<br />
Debt 52,888 4,407 38,000 38,000 0 49,500 30.26%<br />
Total<br />
Appropriations 3,959,605 3,580,063 3,801,889 3,826,106 3,645,356 3,759,127 (1.12%)<br />
Increase/(Decrease) in Fund Balance (54,589) 164,844 (18,549) (42,766) (74,974) (1,141)<br />
Beginning Balance 226,833 216,037 335,881 335,881 335,881 285,124<br />
Adju<strong>st</strong>ments 43,793 (45,000) 0 24,217 24,217 0<br />
Ending Balance 216,037 335,881 317,332 317,332 285,124 283,983<br />
The Golf Courses Department has made several changes due to the downturn in the economy to remain pr<<strong>st</strong>rong>of</<strong>st</strong>rong>itable. The total reque<strong>st</strong> <<strong>st</strong>rong>of</<strong>st</strong>rong> $3.759 million is 1.1% less<br />
than the adopted FY 2011.<br />
137
City <<strong>st</strong>rong>of</<strong>st</strong>rong> St. Petersburg, Florida - FY 2012 Proposed Fiscal Plan<br />
The decrease is due to the reduction <<strong>st</strong>rong>of</<strong>st</strong>rong> a full-time Golf Course Attendant III position at Twin Brooks to a part-time Golf Course Attendant II, a full-time Golf<br />
Course Attendant III position at Cypress Links to a part-time Golf Course Attendant II, and miscellaneous line item reductions.<br />
A $1.00 increase in 18-hole greens fees is scheduled to take effect at Mangrove Bay, Twin Brooks and Cypress Links for the winter and summer seasons. A $.50<br />
increase in electric golf cart fees is scheduled to take effect at Cypress Links for the winter and summer seasons.<br />
Funding is scheduled for turf equipment replacement as replacement <<strong>st</strong>rong>of</<strong>st</strong>rong> turf equipment has been limited due to <strong>budget</strong> reductions over the pa<strong>st</strong> three years. The<br />
Golf Courses Department pays General & Admini<strong>st</strong>rative charges and Payment in Lieu <<strong>st</strong>rong>of</<strong>st</strong>rong> Taxes to the General Fund <<strong>st</strong>rong>of</<strong>st</strong>rong> $402,132, and the ROI payment <<strong>st</strong>rong>of</<strong>st</strong>rong><br />
$100,000 is temporarily put on hold until the Golf Courses fund balance is increased to a higher level.<br />
138
City <<strong>st</strong>rong>of</<strong>st</strong>rong> St. Petersburg, Florida - FY 2012 Proposed Fiscal Plan<br />
Jame<strong>st</strong>own Complex (4081)<br />
This fund was e<strong>st</strong>ablished to provide accounting for the Jame<strong>st</strong>own Housing Complex which provides affordable apartment units to low- and moderate-income<br />
earning families.<br />
FY 2009<br />
Actual<br />
FY 2010<br />
Actual<br />
FY 2011<br />
Adopted<br />
FY 2011<br />
Amended<br />
FY 2011<br />
E<strong>st</strong>imated<br />
FY 2012<br />
Proposed<br />
FY 2012<br />
Change<br />
Revenue Summary<br />
Charges For Services<br />
Housing Services 507,900 509,910 475,469 475,469 528,735 511,907 7.66%<br />
Total Charges For Services 507,900 509,910 475,469 475,469 528,735 511,907 7.66%<br />
Misc Revenues<br />
Intere<strong>st</strong> Earnings 799 177 1,314 1,314 86 0 (100.00%)<br />
Rents And Royalties 2,123 1,567 1,100 1,100 1,529 1,400 27.27%<br />
Misc Revenue 1,196 531 (4,175) (4,175) 6,524 (4,175) 0.00%<br />
Total Misc Revenues 4,118 2,275 (1,761) (1,761) 8,139 (2,775) 57.58%<br />
Transfer In<br />
General Fund 0 70,000 0 0 0 0 0.00%<br />
Total Transfer In 0 70,000 0 0 0 0 0.00%<br />
Total<br />
Revenue Summary 512,018 582,185 473,708 473,708 536,874 509,132 7.48%<br />
Appropriations<br />
FY 2009<br />
Actual<br />
FY 2010<br />
Actual<br />
FY 2011<br />
Adopted<br />
FY 2011<br />
Amended<br />
FY 2011<br />
E<strong>st</strong>imated<br />
FY 2012<br />
Proposed<br />
FY 2012<br />
Change<br />
Wages And Benefits 275,311 232,876 247,191 247,191 271,520 268,204 8.50%<br />
Services And Commodities 226,730 296,332 220,369 221,840 240,062 229,658 4.22%<br />
Capital 4,121 2,222 10,050 10,050 10,050 13,000 29.35%<br />
Transfers Out<br />
General Fund 0 0 35,000 35,000 35,000 35,000 0.00%<br />
Total Transfers Out 0 0 35,000 35,000 35,000 35,000 0.00%<br />
Total<br />
Appropriations 506,162 531,430 512,610 514,081 556,632 545,862 6.49%<br />
Increase/(Decrease) in Fund Balance 5,856 50,755 (38,902) (40,373) (19,758) (36,730)<br />
Beginning Balance 95,931 101,861 152,616 152,616 152,616 134,329<br />
Adju<strong>st</strong>ments 74 0 0 1,471 1,471 0<br />
Ending Balance 101,861 152,616 113,714 113,714 134,329 97,599<br />
Capital reque<strong>st</strong>s <<strong>st</strong>rong>of</<strong>st</strong>rong> $13,000 are being made for Jame<strong>st</strong>own for replacement <<strong>st</strong>rong>of</<strong>st</strong>rong> carpeting and air conditioning. If replaced, the equipment is charged to the<br />
Jame<strong>st</strong>own Operating Fund.<br />
139
City <<strong>st</strong>rong>of</<strong>st</strong>rong> St. Petersburg, Florida - FY 2012 Proposed Fiscal Plan<br />
Port Operating (4091)<br />
The Port Operating Fund, like all other Enterprise Funds, is used to account for co<strong>st</strong>s that are funded sub<strong>st</strong>antially by external (non-City department) user fees and<br />
charges. The enterprise funds are required to cover all expenses <<strong>st</strong>rong>of</<strong>st</strong>rong> the operation (salaries, benefits, services, commodities, and <strong>capital</strong> outlay) and all occasion <<strong>st</strong>rong>of</<strong>st</strong>rong><br />
general and admini<strong>st</strong>rative co<strong>st</strong>s and payment-in-lieu-<<strong>st</strong>rong>of</<strong>st</strong>rong>-taxes, as well as any transfers to <strong>capital</strong> project funds, debt service funds, or return on inve<strong>st</strong>ment/equity.<br />
FY 2009<br />
Actual<br />
FY 2010<br />
Actual<br />
FY 2011<br />
Adopted<br />
FY 2011<br />
Amended<br />
FY 2011<br />
E<strong>st</strong>imated<br />
FY 2012<br />
Proposed<br />
FY 2012<br />
Change<br />
Revenue Summary<br />
Charges For Services<br />
Transportation Charges 201,355 186,742 179,800 179,800 164,178 179,800 0.00%<br />
Total Charges For Services 201,355 186,742 179,800 179,800 164,178 179,800 0.00%<br />
Misc Revenues<br />
Intere<strong>st</strong> Earnings 428 0 1,140 1,140 0 453 (60.26%)<br />
Misc Revenue (11,024) (1,621) 3,273 3,273 3,343 3,273 0.00%<br />
Total Misc Revenues (10,596) (1,621) 4,413 4,413 3,343 3,726 (15.57%)<br />
Transfer In<br />
General Fund 469,000 508,000 487,000 487,000 425,000 271,000 (44.35%)<br />
Total Transfer In 469,000 508,000 487,000 487,000 425,000 271,000 (44.35%)<br />
Total<br />
Revenue Summary 659,759 693,121 671,213 671,213 592,521 454,526 (32.28%)<br />
Appropriations<br />
FY 2009<br />
Actual<br />
FY 2010<br />
Actual<br />
FY 2011<br />
Adopted<br />
FY 2011<br />
Amended<br />
FY 2011<br />
E<strong>st</strong>imated<br />
FY 2012<br />
Proposed<br />
FY 2012<br />
Change<br />
Wages And Benefits 375,296 380,176 325,346 325,346 247,909 322,010 (1.03%)<br />
Services And Commodities 291,269 281,855 371,732 377,507 443,043 132,209 (64.43%)<br />
Total<br />
Appropriations 666,565 662,031 697,078 702,853 690,952 454,219 (34.84%)<br />
Increase/(Decrease) in Fund Balance (6,806) 31,090 (25,865) (31,640) (98,431) 307<br />
Beginning Balance 20,672 21,267 123,000 123,000 123,000 30,344<br />
Adju<strong>st</strong>ments 7,401 70,643 0 5,775 5,775 0<br />
Ending Balance 21,267 123,000 97,135 97,135 30,344 30,651<br />
The facility is subsidized by the General Fund. The Proposed Budget recommends a decrease in subsidy in the amount <<strong>st</strong>rong>of</<strong>st</strong>rong> $216,000 in FY12 over the FY11<br />
Adopted Budget amount. This reduction is due to the Port no longer being charged for PILOT and General Admini<strong>st</strong>ration since it is subsidized.<br />
In FY12, the fund's expenses are projected to decrease by 34.84%. This is also due to the Port no longer being charged for PILOT and General Admini<strong>st</strong>ration.<br />
140
City <<strong>st</strong>rong>of</<strong>st</strong>rong> St. Petersburg, Florida - FY 2012 Proposed Fiscal Plan<br />
Fleet Management (5001)<br />
This fund is an Internal Service Fund that accounts for all fleet services. The primary users are the Police, Fire, Parks, Stormwater, Sanitation, and Water<br />
Resources departments.<br />
FY 2009<br />
Actual<br />
FY 2010<br />
Actual<br />
FY 2011<br />
Adopted<br />
FY 2011<br />
Amended<br />
FY 2011<br />
E<strong>st</strong>imated<br />
FY 2012<br />
Proposed<br />
FY 2012<br />
Change<br />
Revenue Summary<br />
Intergovernmental Revenue<br />
Federal Grants 140 0 0 241,195 0 0 0.00%<br />
Total Intergovernmental Revenue 140 0 0 241,195 0 0 0.00%<br />
Misc Revenues<br />
Intere<strong>st</strong> Earnings 11,253 16,366 24,525 24,525 10,055 9,741 (60.28%)<br />
Sale Of Fixed Assets 0 0 0 0 12,930 0 0.00%<br />
Sale Of Surplus Material 4,601 5,438 7,500 7,500 3,091 7,500 0.00%<br />
Misc Revenue 4,285 155 0 0 86 0 0.00%<br />
Total Misc Revenues 20,139 21,959 32,025 32,025 26,162 17,241 (46.16%)<br />
Internal Charges<br />
Department Charges 15,130,938 15,118,233 15,645,975 15,645,975 15,876,637 16,294,400 4.14%<br />
Other Charges (1) 0 0 0 0 0 0.00%<br />
Total Internal Charges 15,130,937 15,118,233 15,645,975 15,645,975 15,876,637 16,294,400 4.14%<br />
Total<br />
Revenue Summary 15,151,216 15,140,192 15,678,000 15,919,195 15,902,799 16,311,641 4.04%<br />
Appropriations<br />
FY 2009<br />
Actual<br />
FY 2010<br />
Actual<br />
FY 2011<br />
Adopted<br />
FY 2011<br />
Amended<br />
FY 2011<br />
E<strong>st</strong>imated<br />
FY 2012<br />
Proposed<br />
FY 2012<br />
Change<br />
Wages And Benefits 4,928,377 5,116,395 5,334,101 5,334,101 4,608,771 5,047,131 (5.38%)<br />
Services And Commodities 9,479,284 10,436,896 10,042,487 10,668,890 11,540,570 10,964,738 9.18%<br />
Capital 35,234 17,993 0 0 14,786 0 0.00%<br />
Transfers Out<br />
Workers' Compensation 0 721,716 0 0 0 0 0.00%<br />
Total Transfers Out 0 721,716 0 0 0 0 0.00%<br />
Total<br />
Appropriations 14,442,895 16,293,000 15,376,588 16,002,991 16,164,127 16,011,869 4.13%<br />
Increase/(Decrease) in Fund Balance 708,321 (1,152,808) 301,412 (83,796) (261,328) 299,772<br />
Beginning Balance 1,677,204 2,539,604 1,120,649 1,120,649 1,120,649 1,244,530<br />
Adju<strong>st</strong>ments 154,079 (266,147) 0 385,209 385,209 0<br />
Ending Balance 2,539,604 1,120,649 1,422,061 1,422,062 1,244,530 1,544,302<br />
141
City <<strong>st</strong>rong>of</<strong>st</strong>rong> St. Petersburg, Florida - FY 2012 Proposed Fiscal Plan<br />
Equipment Replacement (5002)<br />
The Equipment Replacement Fund is an Internal Service Fund that accounts for the normal replacement <<strong>st</strong>rong>of</<strong>st</strong>rong> City vehicles and related equipment that is used by<br />
City departments. The primary users are the Police, Fire, Parks, Stormwater, Sanitation, and Water Resources departments.<br />
FY 2009<br />
Actual<br />
FY 2010<br />
Actual<br />
FY 2011<br />
Adopted<br />
FY 2011<br />
Amended<br />
FY 2011<br />
E<strong>st</strong>imated<br />
FY 2012<br />
Proposed<br />
FY 2012<br />
Change<br />
Revenue Summary<br />
Misc Revenues<br />
Intere<strong>st</strong> Earnings 952,309 555,560 622,928 622,928 399,906 247,427 (60.28%)<br />
Sale Of Fixed Assets 572,180 51,067 0 0 167,451 0 0.00%<br />
Contributions And Donations 0 25,002 0 0 0 0 0.00%<br />
Misc Revenue (262,002) 0 0 0 0 0 0.00%<br />
Total Misc Revenues 1,262,487 631,629 622,928 622,928 567,357 247,427 (60.28%)<br />
Internal Charges<br />
Department Charges 4,227,314 2,820,868 3,160,072 3,160,072 3,475,200 3,476,215 10.00%<br />
Total Internal Charges 4,227,314 2,820,868 3,160,072 3,160,072 3,475,200 3,476,215 10.00%<br />
Total<br />
Revenue Summary 5,489,801 3,452,497 3,783,000 3,783,000 4,042,557 3,723,642 (1.57%)<br />
Appropriations<br />
FY 2009<br />
Actual<br />
FY 2010<br />
Actual<br />
FY 2011<br />
Adopted<br />
FY 2011<br />
Amended<br />
FY 2011<br />
E<strong>st</strong>imated<br />
FY 2012<br />
Proposed<br />
FY 2012<br />
Change<br />
Wages And Benefits 0 13,692 13,700 13,700 13,700 13,700 0.00%<br />
Services And Commodities 157,664 174,519 156,100 156,100 156,297 156,100 0.00%<br />
Capital 2,587,840 2,579,175 7,102,500 7,962,174 7,961,850 7,891,000 11.10%<br />
Transfers Out<br />
General Capital Improvements 333,996 0 0 0 0 0 0.00%<br />
Technology & Infra<strong>st</strong>ructure Fund 0 1,757,828 0 0 0 0 0.00%<br />
Total Transfers Out 333,996 1,757,828 0 0 0 0 0.00%<br />
Total<br />
Appropriations 3,079,500 4,525,214 7,272,300 8,131,974 8,131,847 8,060,800 10.84%<br />
Increase/(Decrease) in Fund Balance 2,410,301 (1,072,717) (3,489,300) (4,348,974) (4,089,290) (4,337,158)<br />
Beginning Balance 19,795,793 23,183,917 22,448,166 22,448,166 22,448,166 19,218,550<br />
Adju<strong>st</strong>ments 977,823 336,966 0 859,674 859,674 0<br />
Ending Balance 23,183,917 22,448,166 18,958,866 18,958,866 19,218,550 14,881,392<br />
142
City <<strong>st</strong>rong>of</<strong>st</strong>rong> St. Petersburg, Florida - FY 2012 Proposed Fiscal Plan<br />
Municipal Office Buildings (5005)<br />
This is an Internal Service Fund used to account for rents applied to City departments in City Hall, City Annex, and the Municipal Services Center (MSC) to cover<br />
the co<strong>st</strong> <<strong>st</strong>rong>of</<strong>st</strong>rong> maintenance, repairs, and security. The primary users include General Government and Community Development agencies.<br />
FY 2009<br />
Actual<br />
FY 2010<br />
Actual<br />
FY 2011<br />
Adopted<br />
FY 2011<br />
Amended<br />
FY 2011<br />
E<strong>st</strong>imated<br />
FY 2012<br />
Proposed<br />
FY 2012<br />
Change<br />
Revenue Summary<br />
Misc Revenues<br />
Intere<strong>st</strong> Earnings 52,721 9,421 20,244 20,244 20,591 8,041 (60.28%)<br />
Rents And Royalties 2,687,352 2,664,732 2,685,756 2,685,756 2,685,000 2,685,756 0.00%<br />
Sale Of Fixed Assets 434 0 0 0 0 0 0.00%<br />
Misc Revenue 1,368 0 0 0 500 0 0.00%<br />
Total Misc Revenues 2,741,875 2,674,153 2,706,000 2,706,000 2,706,091 2,693,797 (0.45%)<br />
Total<br />
Revenue Summary 2,741,875 2,674,153 2,706,000 2,706,000 2,706,091 2,693,797 (0.45%)<br />
Appropriations<br />
FY 2009<br />
Actual<br />
FY 2010<br />
Actual<br />
FY 2011<br />
Adopted<br />
FY 2011<br />
Amended<br />
FY 2011<br />
E<strong>st</strong>imated<br />
FY 2012<br />
Proposed<br />
FY 2012<br />
Change<br />
Wages And Benefits 987,084 968,106 976,203 976,203 916,783 988,016 1.21%<br />
Services And Commodities 1,463,410 1,428,794 1,436,271 1,446,941 1,368,906 1,402,984 (2.32%)<br />
Capital 3,260 72,698 0 21,800 9,295 0 0.00%<br />
Transfers Out<br />
General Capital Improvements 0 0 0 275,000 275,000 0 0.00%<br />
Total Transfers Out 0 0 0 275,000 275,000 0 0.00%<br />
Total<br />
Appropriations 2,453,754 2,469,598 2,412,474 2,719,944 2,569,984 2,391,000 (0.89%)<br />
Increase/(Decrease) in Fund Balance 288,121 204,555 293,526 (13,944) 136,107 302,797<br />
Beginning Balance 1,015,636 1,290,111 1,532,000 1,532,000 1,532,000 1,700,577<br />
Adju<strong>st</strong>ments (13,646) 37,334 0 32,470 32,470 0<br />
Ending Balance 1,290,111 1,532,000 1,825,526 1,550,526 1,700,577 2,003,374<br />
In FY12, the fund's expenses are projected to decrease by .89%. The reduction in expenses is due to the reduction <<strong>st</strong>rong>of</<strong>st</strong>rong> a full-time Security Officer position to parttime<br />
and reductions in services and commodities (Overtime, Other Office Supplies, and Electric).<br />
143
City <<strong>st</strong>rong>of</<strong>st</strong>rong> St. Petersburg, Florida - FY 2012 Proposed Fiscal Plan<br />
Information & Communication Services (5011)<br />
The Information & Communication Services (ICS) Fund is an Internal Service Fund that accounts for the technical infra<strong>st</strong>ructure and an employee base which<br />
assi<strong>st</strong>s City departments in determining and implementing their information/communication requirements. All City agencies are users <<strong>st</strong>rong>of</<strong>st</strong>rong> ICS' services and<br />
equipment.<br />
FY 2009<br />
Actual<br />
FY 2010<br />
Actual<br />
FY 2011<br />
Adopted<br />
FY 2011<br />
Amended<br />
FY 2011<br />
E<strong>st</strong>imated<br />
FY 2012<br />
Proposed<br />
FY 2012<br />
Change<br />
Revenue Summary<br />
Charges For Services<br />
Other Charges For Services 0 9,324 0 0 9,756 0 0.00%<br />
Total Charges For Services 0 9,324 0 0 9,756 0 0.00%<br />
Misc Revenues<br />
Intere<strong>st</strong> Earnings 34,014 40,314 62,110 62,110 8,266 24,670 (60.28%)<br />
Sale Of Fixed Assets 29,743 7,664 0 0 0 0 0.00%<br />
Misc Revenue 29,755 817 0 0 221 0 0.00%<br />
Total Misc Revenues 93,512 48,795 62,110 62,110 8,487 24,670 (60.28%)<br />
Internal Charges<br />
Department Charges 11,053,140 10,064,526 9,621,890 9,621,890 9,910,258 9,604,952 (0.18%)<br />
Total Internal Charges 11,053,140 10,064,526 9,621,890 9,621,890 9,910,258 9,604,952 (0.18%)<br />
Total<br />
Revenue Summary 11,146,652 10,122,645 9,684,000 9,684,000 9,928,501 9,629,622 (0.56%)<br />
Appropriations<br />
FY 2009<br />
Actual<br />
FY 2010<br />
Actual<br />
FY 2011<br />
Adopted<br />
FY 2011<br />
Amended<br />
FY 2011<br />
E<strong>st</strong>imated<br />
FY 2012<br />
Proposed<br />
FY 2012<br />
Change<br />
Wages And Benefits 5,834,948 5,823,622 5,866,490 5,990,712 5,991,190 6,060,354 3.30%<br />
Services And Commodities 4,144,076 4,260,356 4,023,322 4,362,396 4,164,675 3,910,785 (2.80%)<br />
Capital 252,641 475,359 165,000 270,551 165,650 19,000 (88.48%)<br />
Transfers Out<br />
General Fund 0 399,996 300,000 300,000 300,000 200,000 (33.33%)<br />
Technology & Infra<strong>st</strong>ructure Fund 0 999,401 0 0 0 0 0.00%<br />
Print Shop 19,000 58,436 0 0 0 0 0.00%<br />
Total Transfers Out 19,000 1,457,833 300,000 300,000 300,000 200,000 (33.33%)<br />
Total<br />
Appropriations 10,250,665 12,017,170 10,354,812 10,923,659 10,621,515 10,190,139 (1.59%)<br />
Increase/(Decrease) in Fund Balance 895,987 (1,894,525) (670,812) (1,239,659) (693,014) (560,517)<br />
Beginning Balance 2,195,138 3,210,394 1,707,000 1,707,000 1,707,000 1,308,610<br />
Adju<strong>st</strong>ments 119,269 391,131 0 294,624 294,624 0<br />
Ending Balance 3,210,394 1,707,000 1,036,188 761,965 1,308,610 748,093<br />
In FY11 the Printshop was consolidated with the ICS Department and two positions were <strong>budget</strong>ed. In FY12, the salary and wages increased due to three<br />
positions being <strong>budget</strong>ed in the Printshop.<br />
144
City <<strong>st</strong>rong>of</<strong>st</strong>rong> St. Petersburg, Florida - FY 2012 Proposed Fiscal Plan<br />
Pc Replacement (5015)<br />
The PC Replacement Fund was an Internal Service Fund that accounted for the normal replacement <<strong>st</strong>rong>of</<strong>st</strong>rong> <strong>st</strong>andard personal computer (PC) and laptop equipment that<br />
is used by City departments.<br />
FY 2009<br />
Actual<br />
FY 2010<br />
Actual<br />
FY 2011<br />
Adopted<br />
FY 2011<br />
Amended<br />
FY 2011<br />
E<strong>st</strong>imated<br />
FY 2012<br />
Proposed<br />
FY 2012<br />
Change<br />
Revenue Summary<br />
Misc Revenues<br />
Intere<strong>st</strong> Earnings 13,764 7,884 0 0 0 0 0.00%<br />
Sale Of Fixed Assets (2,268) 0 0 0 0 0 0.00%<br />
Total Misc Revenues 11,496 7,884 0 0 0 0 0.00%<br />
Internal Charges<br />
Department Charges 748,958 464,351 0 0 0 0 0.00%<br />
Total Internal Charges 748,958 464,351 0 0 0 0 0.00%<br />
Total<br />
Revenue Summary 760,454 472,235 0 0 0 0 0.00%<br />
Appropriations<br />
FY 2009<br />
Actual<br />
FY 2010<br />
Actual<br />
FY 2011<br />
Adopted<br />
FY 2011<br />
Amended<br />
FY 2011<br />
E<strong>st</strong>imated<br />
FY 2012<br />
Proposed<br />
FY 2012<br />
Change<br />
Wages And Benefits 0 14,004 0 0 0 0 0.00%<br />
Services And Commodities 0 148 0 0 0 0 0.00%<br />
Capital 121,782 210,117 0 36,106 36,106 0 0.00%<br />
Transfers Out<br />
Technology & Infra<strong>st</strong>ructure Fund 0 3,638,761 0 0 0 0 0.00%<br />
Total Transfers Out 0 3,638,761 0 0 0 0 0.00%<br />
Total<br />
Appropriations 121,782 3,863,030 0 36,106 36,106 0 0.00%<br />
Increase/(Decrease) in Fund Balance 638,672 (3,390,795) 0 (36,106) (36,106) 0<br />
Beginning Balance 1,647,937 2,310,552 0 0 0 0<br />
Adju<strong>st</strong>ments 23,943 1,080,243 0 36,106 36,106 0<br />
Ending Balance 2,310,552 0 0 0 0 0<br />
During FY10 the PC Replacement Fund was moved to a division within the new Technology and Infra<strong>st</strong>ructure Fund. The information on this page is provided<br />
for hi<strong>st</strong>orical purposes.<br />
145
City <<strong>st</strong>rong>of</<strong>st</strong>rong> St. Petersburg, Florida - FY 2012 Proposed Fiscal Plan<br />
Radio Replacement (5017)<br />
The Radio Replacement Fund was an Internal Service Fund that accounts for the normal replacement <<strong>st</strong>rong>of</<strong>st</strong>rong> portable radio equipment that was used by City<br />
departments. The primary users were the Police and Fire departments.<br />
FY 2009<br />
Actual<br />
FY 2010<br />
Actual<br />
FY 2011<br />
Adopted<br />
FY 2011<br />
Amended<br />
FY 2011<br />
E<strong>st</strong>imated<br />
FY 2012<br />
Proposed<br />
FY 2012<br />
Change<br />
Revenue Summary<br />
Misc Revenues<br />
Intere<strong>st</strong> Earnings 471 698 0 0 0 0 0.00%<br />
Total Misc Revenues 471 698 0 0 0 0 0.00%<br />
Internal Charges<br />
Department Charges 477,634 419,525 0 0 0 0 0.00%<br />
Total Internal Charges 477,634 419,525 0 0 0 0 0.00%<br />
Total<br />
Revenue Summary 478,105 420,223 0 0 0 0 0.00%<br />
Appropriations<br />
FY 2009<br />
Actual<br />
FY 2010<br />
Actual<br />
FY 2011<br />
Adopted<br />
FY 2011<br />
Amended<br />
FY 2011<br />
E<strong>st</strong>imated<br />
FY 2012<br />
Proposed<br />
FY 2012<br />
Change<br />
Capital 6,433 45,753 0 16,050 16,050 0 0.00%<br />
Transfers Out<br />
Technology & Infra<strong>st</strong>ructure Fund 0 1,162,851 0 0 0 0 0.00%<br />
Total Transfers Out 0 1,162,851 0 0 0 0 0.00%<br />
Total<br />
Appropriations 6,433 1,208,604 0 16,050 16,050 0 0.00%<br />
Increase/(Decrease) in Fund Balance 471,672 (788,381) 0 (16,050) (16,050) 0<br />
Beginning Balance 40,653 512,325 0 0 0 0<br />
Adju<strong>st</strong>ments 0 276,056 0 16,050 16,050 0<br />
Ending Balance 512,325 0 0 0 0 0<br />
During FY10 the Radio Replacement Fund was moved to a division within the new Technology and Infra<strong>st</strong>ructure Fund. The information on this page is provided<br />
for hi<strong>st</strong>orical purposes.<br />
146
City <<strong>st</strong>rong>of</<strong>st</strong>rong> St. Petersburg, Florida - FY 2012 Proposed Fiscal Plan<br />
Technology & Infra<strong>st</strong>ructure Fund (5019)<br />
The Technology and Infra<strong>st</strong>ructure Fund is an Internal Service Fund that was e<strong>st</strong>ablished in FY 2010 to centrally locate all technology/infra<strong>st</strong>ructure resources.<br />
The fund balances <<strong>st</strong>rong>of</<strong>st</strong>rong> the former PC and Radio Replacement Funds, and the amount above the target fund balance <<strong>st</strong>rong>of</<strong>st</strong>rong> the ICS fund were transferred here. In<br />
addition, reserves for television equipment contributed by the Marketing and Communications Department were transferred to this fund from the Equipment<br />
Replacement Fund.<br />
FY 2009<br />
Actual<br />
FY 2010<br />
Actual<br />
FY 2011<br />
Adopted<br />
FY 2011<br />
Amended<br />
FY 2011<br />
E<strong>st</strong>imated<br />
FY 2012<br />
Proposed<br />
FY 2012<br />
Change<br />
Revenue Summary<br />
Misc Revenues<br />
Intere<strong>st</strong> Earnings 0 0 98,500 98,500 40,833 39,124 (60.28%)<br />
Total Misc Revenues 0 0 98,500 98,500 40,833 39,124 (60.28%)<br />
Transfer In<br />
Equipment Replacement 0 1,757,828 0 0 0 0 0.00%<br />
Information & Communication Services 0 999,401 0 0 0 0 0.00%<br />
Pc Replacement 0 3,638,761 0 0 0 0 0.00%<br />
Radio Replacement 0 1,162,851 0 0 0 0 0.00%<br />
General Liabilities Claims 0 2,798,298 0 0 0 0 0.00%<br />
Total Transfer In 0 10,357,139 0 0 0 0 0.00%<br />
Internal Charges<br />
Department Charges 0 0 980,500 980,500 1,038,494 738,672 (24.66%)<br />
Total Internal Charges 0 0 980,500 980,500 1,038,494 738,672 (24.66%)<br />
Total<br />
Revenue Summary 0 10,357,139 1,079,000 1,079,000 1,079,327 777,796 (27.92%)<br />
Appropriations<br />
FY 2009<br />
Actual<br />
FY 2010<br />
Actual<br />
FY 2011<br />
Adopted<br />
FY 2011<br />
Amended<br />
FY 2011<br />
E<strong>st</strong>imated<br />
FY 2012<br />
Proposed<br />
FY 2012<br />
Change<br />
Wages And Benefits 0 0 14,000 14,000 4,668 14,000 0.00%<br />
Capital 0 0 705,532 2,986,428 1,579,396 766,090 8.58%<br />
Total<br />
Appropriations 0 0 719,532 3,000,428 1,584,064 780,090 8.42%<br />
Increase/(Decrease) in Fund Balance 0 10,357,139 359,468 (1,921,428) (504,737) (2,294)<br />
Beginning Balance 0 0 9,018,000 9,018,000 9,018,000 8,513,263<br />
Adju<strong>st</strong>ments 0 (1,339,139) 0 0 0 0<br />
Ending Balance 0 9,018,000 9,377,468 7,096,572 8,513,263 8,510,969<br />
The City has initiated a Virtual Desktop PC program that requires each virtual machine to have its own XP Pr<<strong>st</strong>rong>of</<strong>st</strong>rong>essional license loaded. These VECD (virtual<br />
enterprise centralized desktop) licenses are $100 per year, per machine and are recurring co<strong>st</strong>s. The Virtual Desktop initiative is directly tied to sub<strong>st</strong>antial co<strong>st</strong><br />
savings. By virtualizing desktop PCs, the City benefits by reducing the number <<strong>st</strong>rong>of</<strong>st</strong>rong> PC replacements for each year the equipment is in use. In<strong>st</strong>ead <<strong>st</strong>rong>of</<strong>st</strong>rong> a 4 year<br />
replacement cycle, the City may see a 6 or 7 year cycle, while <strong>st</strong>ill providing the late<strong>st</strong> desktop s<<strong>st</strong>rong>of</<strong>st</strong>rong>tware experience to the users ($277,800).<br />
The Budget Department charges this fund its salary and benefits co<strong>st</strong> related to the department's oversight <<strong>st</strong>rong>of</<strong>st</strong>rong> this fund.<br />
147
City <<strong>st</strong>rong>of</<strong>st</strong>rong> St. Petersburg, Florida - FY 2012 Proposed Fiscal Plan<br />
Supply Management (5031)<br />
The Materials Management Fund is an Internal Service Fund that accounts for the <strong>st</strong>orage and handling <<strong>st</strong>rong>of</<strong>st</strong>rong> identified materials for di<strong>st</strong>ribution to user agencies.<br />
The primary users <<strong>st</strong>rong>of</<strong>st</strong>rong> the Consolidated Warehouse are Parks, Water Resources, and Stormwater, Pavement & Traffic Operations.<br />
FY 2009<br />
Actual<br />
FY 2010<br />
Actual<br />
FY 2011<br />
Adopted<br />
FY 2011<br />
Amended<br />
FY 2011<br />
E<strong>st</strong>imated<br />
FY 2012<br />
Proposed<br />
FY 2012<br />
Change<br />
Revenue Summary<br />
Misc Revenues<br />
Intere<strong>st</strong> Earnings 3,293 722 0 0 121 0 0.00%<br />
Sale Of Fixed Assets 22,796 36,248 15,000 15,000 50,406 15,000 0.00%<br />
Sale Of Surplus Material 2,742 228 0 0 131 0 0.00%<br />
Misc Revenue (1,634) 1,254 0 0 0 0 0.00%<br />
Total Misc Revenues 27,197 38,452 15,000 15,000 50,658 15,000 0.00%<br />
Internal Charges<br />
Department Charges 501,748 495,450 510,000 510,000 499,000 510,000 0.00%<br />
Total Internal Charges 501,748 495,450 510,000 510,000 499,000 510,000 0.00%<br />
Total<br />
Revenue Summary 528,945 533,902 525,000 525,000 549,658 525,000 0.00%<br />
Appropriations<br />
FY 2009<br />
Actual<br />
FY 2010<br />
Actual<br />
FY 2011<br />
Adopted<br />
FY 2011<br />
Amended<br />
FY 2011<br />
E<strong>st</strong>imated<br />
FY 2012<br />
Proposed<br />
FY 2012<br />
Change<br />
Wages And Benefits 356,718 412,284 422,151 422,651 404,947 425,421 0.77%<br />
Services And Commodities 102,844 97,661 103,613 104,989 139,374 97,244 (6.15%)<br />
Capital 1,309 1,346 0 0 0 0 0.00%<br />
Transfers Out<br />
Workers' Compensation 0 249,523 0 0 0 0 0.00%<br />
Total Transfers Out 0 249,523 0 0 0 0 0.00%<br />
Total<br />
Appropriations 460,871 760,814 525,764 527,640 544,321 522,665 (0.59%)<br />
Increase/(Decrease) in Fund Balance 68,074 (226,912) (764) (2,640) 5,337 2,335<br />
Beginning Balance 238,715 124,721 (102,146) (102,146) (102,146) (94,933)<br />
Adju<strong>st</strong>ments (182,068) 45 0 1,876 1,876 0<br />
Ending Balance 124,721 (102,146) (102,910) (102,910) (94,933) (92,598)<br />
The overhead rate for FY12 is 15%.<br />
148
City <<strong>st</strong>rong>of</<strong>st</strong>rong> St. Petersburg, Florida - FY 2012 Proposed Fiscal Plan<br />
Print Shop (5041)<br />
FY 2009<br />
Actual<br />
FY 2010<br />
Actual<br />
FY 2011<br />
Adopted<br />
FY 2011<br />
Amended<br />
FY 2011<br />
E<strong>st</strong>imated<br />
FY 2012<br />
Proposed<br />
FY 2012<br />
Change<br />
Revenue Summary<br />
Transfer In<br />
Information & Communication Services 19,000 58,436 0 0 0 0 0.00%<br />
Total Transfer In 19,000 58,436 0 0 0 0 0.00%<br />
Internal Charges<br />
Department Charges 396,888 354,389 0 0 0 0 0.00%<br />
Total Internal Charges 396,888 354,389 0 0 0 0 0.00%<br />
Total<br />
Revenue Summary 415,888 412,825 0 0 0 0 0.00%<br />
Appropriations<br />
FY 2009<br />
Actual<br />
FY 2010<br />
Actual<br />
FY 2011<br />
Adopted<br />
FY 2011<br />
Amended<br />
FY 2011<br />
E<strong>st</strong>imated<br />
FY 2012<br />
Proposed<br />
FY 2012<br />
Change<br />
Wages And Benefits 183,646 151,696 0 0 0 0 0.00%<br />
Services And Commodities 237,246 206,405 0 857 0 0 0.00%<br />
Capital 0 29,550 0 0 0 0 0.00%<br />
Total<br />
Appropriations 420,892 387,651 0 857 0 0 0.00%<br />
Increase/(Decrease) in Fund Balance (5,004) 25,174 0 (857) 0 0<br />
Beginning Balance 0 (5,004) 0 0 0 0<br />
Adju<strong>st</strong>ments 0 (20,170) 0 857 0 0<br />
Ending Balance (5,004) 0 0 0 0 0<br />
149
City <<strong>st</strong>rong>of</<strong>st</strong>rong> St. Petersburg, Florida - FY 2012 Proposed Fiscal Plan<br />
Health Insurance (5121)<br />
This fund is an Internal Service Fund that accounts for health and dental insurance co<strong>st</strong>s for current and retired City employees.<br />
FY 2009<br />
Actual<br />
FY 2010<br />
Actual<br />
FY 2011<br />
Adopted<br />
FY 2011<br />
Amended<br />
FY 2011<br />
E<strong>st</strong>imated<br />
FY 2012<br />
Proposed<br />
FY 2012<br />
Change<br />
Revenue Summary<br />
Misc Revenues<br />
Intere<strong>st</strong> Earnings 239,171 205,472 99,574 99,574 76,478 39,551 (60.28%)<br />
Contributions And Donations 33,304,211 32,763,954 32,342,645 32,342,645 32,228,002 32,317,867 (0.08%)<br />
Misc Revenue 303,179 419,592 293,741 293,741 99,562 293,741 0.00%<br />
Total Misc Revenues 33,846,561 33,389,018 32,735,960 32,735,960 32,404,042 32,651,159 (0.26%)<br />
Transfer In<br />
Utility Tax Revenue 0 1,584,344 0 0 0 0 0.00%<br />
General Liabilities Claims 0 7,510,641 0 0 0 0 0.00%<br />
Total Transfer In 0 9,094,985 0 0 0 0 0.00%<br />
Total<br />
Revenue Summary 33,846,561 42,484,003 32,735,960 32,735,960 32,404,042 32,651,159 (0.26%)<br />
Appropriations<br />
FY 2009<br />
Actual<br />
FY 2010<br />
Actual<br />
FY 2011<br />
Adopted<br />
FY 2011<br />
Amended<br />
FY 2011<br />
E<strong>st</strong>imated<br />
FY 2012<br />
Proposed<br />
FY 2012<br />
Change<br />
Wages And Benefits 57,967 184,915 311,046 311,046 246,161 318,385 2.36%<br />
Services And Commodities 32,992,061 32,768,645 32,907,924 32,907,924 31,661,199 33,701,121 2.41%<br />
Total<br />
Appropriations 33,050,028 32,953,560 33,218,970 33,218,970 31,907,360 34,019,506 2.41%<br />
Increase/(Decrease) in Fund Balance 796,533 9,530,443 (483,010) (483,010) 496,682 (1,368,347)<br />
Beginning Balance 8,375,365 9,106,496 18,629,000 18,629,000 18,629,000 19,125,682<br />
Adju<strong>st</strong>ments (65,402) (7,939) 0 0 0 0<br />
Ending Balance 9,106,496 18,629,000 18,145,990 18,145,990 19,125,682 17,757,335<br />
Based upon our consultant's recommendations we are assuming a 15% increase in the Humana Medicare Supplemental Plans and a 7% increase in the United<br />
Health Plans, effective April 2012.<br />
150
City <<strong>st</strong>rong>of</<strong>st</strong>rong> St. Petersburg, Florida - FY 2012 Proposed Fiscal Plan<br />
Life Insurance (5123)<br />
This is an Internal Service Fund that accounts for life and disability insurance co<strong>st</strong>s for current and retired City employees.<br />
FY 2009<br />
Actual<br />
FY 2010<br />
Actual<br />
FY 2011<br />
Adopted<br />
FY 2011<br />
Amended<br />
FY 2011<br />
E<strong>st</strong>imated<br />
FY 2012<br />
Proposed<br />
FY 2012<br />
Change<br />
Revenue Summary<br />
Misc Revenues<br />
Intere<strong>st</strong> Earnings 2,713 479 12,448 12,448 83 4,944 (60.28%)<br />
Contributions And Donations 769,807 798,726 795,315 795,315 811,379 742,628 (6.62%)<br />
Misc Revenue 0 0 0 0 0 0 0.00%<br />
Total Misc Revenues 772,520 799,205 807,763 807,763 811,462 747,572 (7.45%)<br />
Total<br />
Revenue Summary 772,520 799,205 807,763 807,763 811,462 747,572 (7.45%)<br />
Appropriations<br />
FY 2009<br />
Actual<br />
FY 2010<br />
Actual<br />
FY 2011<br />
Adopted<br />
FY 2011<br />
Amended<br />
FY 2011<br />
E<strong>st</strong>imated<br />
FY 2012<br />
Proposed<br />
FY 2012<br />
Change<br />
Wages And Benefits 10,680 24,570 36,454 36,454 31,258 40,471 11.02%<br />
Services And Commodities 810,297 850,359 905,329 905,329 859,925 906,025 0.08%<br />
Transfers Out<br />
Workers' Compensation 0 216,035 0 0 0 0 0.00%<br />
Total Transfers Out 0 216,035 0 0 0 0 0.00%<br />
Total<br />
Appropriations 820,977 1,090,964 941,783 941,783 891,183 946,496 0.50%<br />
Increase/(Decrease) in Fund Balance (48,457) (291,759) (134,020) (134,020) (79,721) (198,924)<br />
Beginning Balance 560,979 512,549 221,000 221,000 221,000 141,279<br />
Adju<strong>st</strong>ments 27 210 0 0 0 0<br />
Ending Balance 512,549 221,000 86,980 86,980 141,279 (57,645)<br />
Wages and benefits increases represent labor di<strong>st</strong>ributions for six employees.<br />
151
City <<strong>st</strong>rong>of</<strong>st</strong>rong> St. Petersburg, Florida - FY 2012 Proposed Fiscal Plan<br />
General Liabilities Claims (5125)<br />
The Self Insurance Fund is an Internal Service Fund that accounts for the co<strong>st</strong> <<strong>st</strong>rong>of</<strong>st</strong>rong> self-insuring and self-admini<strong>st</strong>rating City claims.<br />
FY 2009<br />
Actual<br />
FY 2010<br />
Actual<br />
FY 2011<br />
Adopted<br />
FY 2011<br />
Amended<br />
FY 2011<br />
E<strong>st</strong>imated<br />
FY 2012<br />
Proposed<br />
FY 2012<br />
Change<br />
Revenue Summary<br />
Charges For Services<br />
General Government (38,351) 36,268 0 0 20,068 0 0.00%<br />
Total Charges For Services (38,351) 36,268 0 0 20,068 0 0.00%<br />
Misc Revenues<br />
Intere<strong>st</strong> Earnings 1,148,534 822,534 453,704 453,704 113,017 453,100 (0.13%)<br />
Contributions And Donations 2,378,640 2,419,908 1,801,296 1,801,296 2,021,432 1,796,935 (0.24%)<br />
Misc Revenue 51,492 7,408 0 0 1,143 0 0.00%<br />
Total Misc Revenues 3,578,666 3,249,850 2,255,000 2,255,000 2,135,592 2,250,035 (0.22%)<br />
Total<br />
Revenue Summary 3,540,315 3,286,118 2,255,000 2,255,000 2,155,660 2,250,035 (0.22%)<br />
Appropriations<br />
FY 2009<br />
Actual<br />
FY 2010<br />
Actual<br />
FY 2011<br />
Adopted<br />
FY 2011<br />
Amended<br />
FY 2011<br />
E<strong>st</strong>imated<br />
FY 2012<br />
Proposed<br />
FY 2012<br />
Change<br />
Wages And Benefits 432,959 442,401 386,907 386,907 431,659 439,494 13.59%<br />
Services And Commodities 24,997 975,733 1,880,892 1,880,892 1,904,945 1,826,178 (2.91%)<br />
Transfers Out<br />
Technology & Infra<strong>st</strong>ructure Fund 0 2,798,298 0 0 0 0 0.00%<br />
Health Insurance 0 7,510,641 0 0 0 0 0.00%<br />
Workers' Compensation 0 1,802,621 0 0 0 0 0.00%<br />
Total Transfers Out 0 12,111,560 0 0 0 0 0.00%<br />
Total<br />
Appropriations 457,956 13,529,694 2,267,799 2,267,799 2,336,604 2,265,672 (0.09%)<br />
Increase/(Decrease) in Fund Balance 3,082,359 (10,243,576) (12,799) (12,799) (180,944) (15,637)<br />
Beginning Balance 8,941,225 11,606,222 4,602,000 4,602,000 4,602,000 4,421,056<br />
Adju<strong>st</strong>ments (417,362) 3,239,354 0 0 0 0<br />
Ending Balance 11,606,222 4,602,000 4,589,201 4,589,201 4,421,056 4,405,419<br />
The wage and benefit increase represents labor di<strong>st</strong>ribution for three employees.<br />
152
City <<strong>st</strong>rong>of</<strong>st</strong>rong> St. Petersburg, Florida - FY 2012 Proposed Fiscal Plan<br />
Commercial Insurance (5127)<br />
This is an Internal Service Fund that accounts for the co<strong>st</strong> <<strong>st</strong>rong>of</<strong>st</strong>rong> commercial insurance for the City.<br />
FY 2009<br />
Actual<br />
FY 2010<br />
Actual<br />
FY 2011<br />
Adopted<br />
FY 2011<br />
Amended<br />
FY 2011<br />
E<strong>st</strong>imated<br />
FY 2012<br />
Proposed<br />
FY 2012<br />
Change<br />
Revenue Summary<br />
Misc Revenues<br />
Intere<strong>st</strong> Earnings 248,470 267,910 108,276 108,276 42,747 43,007 (60.28%)<br />
Contributions And Donations 4,950,852 5,076,744 4,835,724 4,835,724 4,902,912 4,836,456 0.02%<br />
Total Misc Revenues 5,199,322 5,344,654 4,944,000 4,944,000 4,945,659 4,879,463 (1.31%)<br />
Total<br />
Revenue Summary 5,199,322 5,344,654 4,944,000 4,944,000 4,945,659 4,879,463 (1.31%)<br />
Appropriations<br />
FY 2009<br />
Actual<br />
FY 2010<br />
Actual<br />
FY 2011<br />
Adopted<br />
FY 2011<br />
Amended<br />
FY 2011<br />
E<strong>st</strong>imated<br />
FY 2012<br />
Proposed<br />
FY 2012<br />
Change<br />
Wages And Benefits 28,828 29,000 87,875 87,875 28,136 28,537 (67.53%)<br />
Services And Commodities 5,072,934 5,058,356 4,855,968 4,855,968 4,878,179 4,852,894 (0.06%)<br />
Transfers Out<br />
Workers' Compensation 0 1,533,744 0 0 0 0 0.00%<br />
Total Transfers Out 0 1,533,744 0 0 0 0 0.00%<br />
Total<br />
Appropriations 5,101,762 6,621,100 4,943,843 4,943,843 4,906,315 4,881,431 (1.26%)<br />
Increase/(Decrease) in Fund Balance 97,560 (1,276,446) 157 157 39,344 (1,968)<br />
Beginning Balance 4,142,332 3,940,067 2,797,000 2,797,000 2,797,000 2,836,344<br />
Adju<strong>st</strong>ments (299,825) 133,379 0 0 0 0<br />
Ending Balance 3,940,067 2,797,000 2,797,157 2,797,157 2,836,344 2,834,376<br />
The decrease in expenditures <<strong>st</strong>rong>of</<strong>st</strong>rong> 1.26% represents labor di<strong>st</strong>ribution for a Risk Management Analy<strong>st</strong> to the Workers Compensation and Self Insurance Funds.<br />
153
City <<strong>st</strong>rong>of</<strong>st</strong>rong> St. Petersburg, Florida - FY 2012 Proposed Fiscal Plan<br />
Workers' Compensation (5129)<br />
The Workers' Compensation Fund is an Internal Service Fund that accounts for the co<strong>st</strong> <<strong>st</strong>rong>of</<strong>st</strong>rong> self-insuring the City for the co<strong>st</strong> <<strong>st</strong>rong>of</<strong>st</strong>rong> work-related injuries.<br />
FY 2009<br />
Actual<br />
FY 2010<br />
Actual<br />
FY 2011<br />
Adopted<br />
FY 2011<br />
Amended<br />
FY 2011<br />
E<strong>st</strong>imated<br />
FY 2012<br />
Proposed<br />
FY 2012<br />
Change<br />
Revenue Summary<br />
Charges For Services<br />
Other Charges For Services 80,184 59,926 0 0 30,707 0 0.00%<br />
Total Charges For Services 80,184 59,926 0 0 30,707 0 0.00%<br />
Misc Revenues<br />
Intere<strong>st</strong> Earnings 760,473 348,863 72,591 72,591 93,150 28,833 (60.28%)<br />
Contributions And Donations 5,351,002 6,643,356 7,051,309 7,051,309 7,151,948 7,023,258 (0.40%)<br />
Misc Revenue 61,941 71,001 6,000 6,000 0 6,000 0.00%<br />
Total Misc Revenues 6,173,416 7,063,220 7,129,900 7,129,900 7,245,098 7,058,091 (1.01%)<br />
Transfer In<br />
Fleet Management 0 721,716 0 0 0 0 0.00%<br />
Supply Management 0 249,523 0 0 0 0 0.00%<br />
Life Insurance 0 216,035 0 0 0 0 0.00%<br />
General Liabilities Claims 0 1,802,621 0 0 0 0 0.00%<br />
Commercial Insurance 0 1,533,744 0 0 0 0 0.00%<br />
Billing & Collections 0 1,466,197 0 0 0 0 0.00%<br />
Total Transfer In 0 5,989,836 0 0 0 0 0.00%<br />
Total<br />
Revenue Summary 6,253,600 13,112,982 7,129,900 7,129,900 7,275,805 7,058,091 (1.01%)<br />
Appropriations<br />
FY 2009<br />
Actual<br />
FY 2010<br />
Actual<br />
FY 2011<br />
Adopted<br />
FY 2011<br />
Amended<br />
FY 2011<br />
E<strong>st</strong>imated<br />
FY 2012<br />
Proposed<br />
FY 2012<br />
Change<br />
Wages And Benefits 431,161 470,746 551,687 551,687 463,174 673,904 22.15%<br />
Services And Commodities 6,244,933 10,391,283 6,574,952 6,574,952 6,465,510 6,574,036 (0.01%)<br />
Total<br />
Appropriations 6,676,094 10,862,029 7,126,639 7,126,639 6,928,684 7,247,940 1.70%<br />
Increase/(Decrease) in Fund Balance (422,494) 2,250,953 3,261 3,261 347,121 (189,849)<br />
Beginning Balance 382,980 (469,219) 15,109,000 15,109,000 15,109,000 15,456,121<br />
Adju<strong>st</strong>ments (429,705) 13,327,266 0 0 0 0<br />
Ending Balance (469,219) 15,109,000 15,112,261 15,112,261 15,456,121 15,266,272<br />
The increase in expenditures <<strong>st</strong>rong>of</<strong>st</strong>rong> 1.70% represents labor di<strong>st</strong>ribution for three employees.<br />
154
City <<strong>st</strong>rong>of</<strong>st</strong>rong> St. Petersburg, Florida - FY 2012 Proposed Fiscal Plan<br />
Billing & Collections (5201)<br />
The Billing & Collections Fund is an Internal Service Fund that accounts for the co<strong>st</strong> <<strong>st</strong>rong>of</<strong>st</strong>rong> providing billing and cu<strong>st</strong>omer services to the City enterprise operations<br />
which provide water, wa<strong>st</strong>ewater, reclaimed water, <strong>st</strong>ormwater management, refuse collection, and disposal services. It also accounts for the collection <<strong>st</strong>rong>of</<strong>st</strong>rong> all<br />
revenue for the City, including utility charges, special assessments, business taxes, property taxes, pa<strong>st</strong> due accounts, and other revenue due to the City.<br />
FY 2009<br />
Actual<br />
FY 2010<br />
Actual<br />
FY 2011<br />
Adopted<br />
FY 2011<br />
Amended<br />
FY 2011<br />
E<strong>st</strong>imated<br />
FY 2012<br />
Proposed<br />
FY 2012<br />
Change<br />
Revenue Summary<br />
Charges For Services<br />
General Government 129,147 151,907 150,000 150,000 222,185 200,000 33.33%<br />
Other Charges For Services 368 0 0 0 0 0 0.00%<br />
Total Charges For Services 129,515 151,907 150,000 150,000 222,185 200,000 33.33%<br />
Fines And Forfeitures<br />
Violation Of Local Ordinances 1,172,826 1,128,845 1,160,000 1,160,000 1,140,315 1,160,000 0.00%<br />
Total Fines And Forfeitures 1,172,826 1,128,845 1,160,000 1,160,000 1,140,315 1,160,000 0.00%<br />
Misc Revenues<br />
Intere<strong>st</strong> Earnings 284,807 199,322 249,951 249,951 232,659 250,000 0.02%<br />
Sale Of Fixed Assets 5,483 0 0 0 0 0 0.00%<br />
Misc Revenue (134,444) (99,245) (119,000) (119,000) (28,787) (119,000) 0.00%<br />
Total Misc Revenues 155,846 100,077 130,951 130,951 203,872 131,000 0.04%<br />
Internal Charges<br />
Other Charges 7,984,546 7,594,911 7,651,049 7,651,049 7,617,106 6,868,449 (10.23%)<br />
Total Internal Charges 7,984,546 7,594,911 7,651,049 7,651,049 7,617,106 6,868,449 (10.23%)<br />
Total<br />
Revenue Summary 9,442,733 8,975,740 9,092,000 9,092,000 9,183,478 8,359,449 (8.06%)<br />
Appropriations<br />
FY 2009<br />
Actual<br />
FY 2010<br />
Actual<br />
FY 2011<br />
Adopted<br />
FY 2011<br />
Amended<br />
FY 2011<br />
E<strong>st</strong>imated<br />
FY 2012<br />
Proposed<br />
FY 2012<br />
Change<br />
Wages And Benefits 5,202,244 5,367,719 5,361,548 5,361,548 5,156,141 5,235,630 (2.35%)<br />
Services And Commodities 3,878,410 3,593,995 3,828,516 3,802,119 3,586,995 3,181,679 (16.90%)<br />
Capital 47,567 8,200 0 0 0 0 0.00%<br />
Transfers Out<br />
Workers' Compensation 0 1,466,197 0 0 0 0 0.00%<br />
Total Transfers Out 0 1,466,197 0 0 0 0 0.00%<br />
Total<br />
Appropriations 9,128,221 10,436,111 9,190,064 9,163,667 8,743,136 8,417,309 (8.41%)<br />
Increase/(Decrease) in Fund Balance 314,512 (1,460,371) (98,064) (71,667) 440,342 (57,860)<br />
Beginning Balance 1,628,982 1,862,525 1,396,000 1,396,000 1,396,000 1,836,342<br />
Adju<strong>st</strong>ments (80,969) 993,846 0 0 0 0<br />
Ending Balance 1,862,525 1,396,000 1,297,936 1,324,333 1,836,342 1,778,482<br />
The Billing and Collections base <strong>budget</strong> decreased from FY11 due to the change in the way the ICS charges were allocated.<br />
155
City <<strong>st</strong>rong>of</<strong>st</strong>rong> St. Petersburg, Florida - FY 2012 Proposed Fiscal Plan<br />
Deferred Compensation - ICMA (6911)<br />
FY 2009<br />
Actual<br />
FY 2010<br />
Actual<br />
FY 2011<br />
Adopted<br />
FY 2011<br />
Amended<br />
FY 2011<br />
E<strong>st</strong>imated<br />
FY 2012<br />
Proposed<br />
FY 2012<br />
Change<br />
Revenue Summary<br />
Misc Revenues<br />
Intere<strong>st</strong> Earnings 191,389 5,149,160 0 0 0 0 0.00%<br />
Contributions And Donations 3,251,744 43,347,793 0 0 0 0 0.00%<br />
Misc Revenue 0 58,898 200,000 200,000 200,000 200,000 0.00%<br />
Total Misc Revenues 3,443,133 48,555,851 200,000 200,000 200,000 200,000 0.00%<br />
Transfer In<br />
General & Admini<strong>st</strong>rative 0 93,332 0 0 0 0 0.00%<br />
Total Transfer In 0 93,332 0 0 0 0 0.00%<br />
Total<br />
Revenue Summary 3,443,133 48,649,183 200,000 200,000 200,000 200,000 0.00%<br />
Appropriations<br />
FY 2009<br />
Actual<br />
FY 2010<br />
Actual<br />
FY 2011<br />
Adopted<br />
FY 2011<br />
Amended<br />
FY 2011<br />
E<strong>st</strong>imated<br />
FY 2012<br />
Proposed<br />
FY 2012<br />
Change<br />
Wages And Benefits 0 31,018 37,218 37,218 32,175 32,162 (13.58%)<br />
Services And Commodities 0 59,662 0 0 9,194 636 0.00%<br />
Total<br />
Appropriations 0 90,680 37,218 37,218 41,369 32,798 (11.88%)<br />
Increase/(Decrease) in Fund Balance 3,443,133 48,558,503 162,782 162,782 158,631 167,202<br />
Beginning Balance 0 3,443,133 52,001,636 52,001,636 52,001,636 52,160,267<br />
Adju<strong>st</strong>ments 0 0 0 0 0 0<br />
Ending Balance 3,443,133 52,001,636 52,164,418 52,164,418 52,160,267 52,327,469<br />
156
City <<strong>st</strong>rong>of</<strong>st</strong>rong> St. Petersburg, Florida - FY 2012 Proposed Fiscal Plan<br />
Internal Service Funds Used<br />
This shows the amount <<strong>st</strong>rong>of</<strong>st</strong>rong> Internal Service Fund reserves that are <strong>budget</strong>ed to be used.<br />
Appropriations FY 2009 FY 2010 FY 2011 FY 2011 FY 2011 FY 2012 FY 2012<br />
Actual Actual Adopted Amended E<strong>st</strong>imated Proposed Change<br />
Transfers (475,955) (21,798,290) (4,888,769) (8,364,950) (5,861,190) (6,732,554) 37.71%<br />
Total Appropriations (475,955) (21,798,290) (4,888,769) (8,364,950) (5,861,190) (6,732,554) 37.71%<br />
Increase/(Decrease) in Fund Balance (475,955) (21,798,290) (4,888,769) (8,364,950) (5,861,190) (6,732,554)<br />
157
City <<strong>st</strong>rong>of</<strong>st</strong>rong> St. Petersburg, Florida - FY 2012 Proposed Fiscal Plan<br />
COMBINED TOTAL DEBT REQUIREMENTS<br />
(PRINCIPAL AND INTEREST) - BY FISCAL YEAR<br />
ESTIMATED AS OF SEPTEMBER 30, 2012<br />
GOVERNMENTAL<br />
DEBT<br />
ENTERPRISE<br />
DEBT<br />
Notes and<br />
Total By<br />
Year Revenue Bonds Notes Revenue Bonds Fiscal Year<br />
2010-11 17,012,982.50 3,867,729.25 16,743,799.42 37,624,511.17<br />
2011-12 16,990,106.25 3,878,362.58 16,740,268.18 37,608,737.01<br />
2012-13 10,277,395.00 4,167,050.30 16,710,036.88 31,154,482.18<br />
2013-14 10,262,492.50 6,312,480.37 16,673,988.92 33,248,961.65<br />
2014-15 10,257,325.00 6,232,527.65 16,647,135.91 33,136,988.56<br />
2015-16 9,836,081.25 6,160,501.47 16,639,520.90 32,636,103.62<br />
2016-17 1,900,212.50 3,391,234.31 16,629,677.18 21,921,123.99<br />
2017-18 1,899,412.50 3,296,410.93 16,631,823.44 21,827,646.87<br />
2018-19 1,900,668.75 3,123,144.43 16,626,463.40 21,650,276.58<br />
2019-20 1,891,821.88 2,961,118.69 16,619,332.13 21,472,272.95<br />
2020-21 1,888,021.88 2,416,241.97 15,688,486.63 19,992,750.48<br />
2021-22 1,890,378.13 0.00 15,679,309.75 17,569,687.88<br />
2022-23 1,888,856.26 0.00 14,863,897.24 16,752,753.16<br />
2023-24 1,888,818.76 0.00 14,170,781.40 16,059,600.06<br />
2024-25 1,884,293.76 0.00 14,025,210.03 15,909,503.79<br />
2025-26 1,396,565.63 0.00 14,020,706.90 15,417,272.53<br />
2026-27 0.00 0.00 14,014,397.52 14,014,397.52<br />
2027-28 0.00 0.00 14,011,222.52 14,011,222.52<br />
2028-29 0.00 0.00 14,003,056.89 14,003,056.89<br />
158
City <<strong>st</strong>rong>of</<strong>st</strong>rong> St. Petersburg, Florida - FY 2012 Proposed Fiscal Plan<br />
2029-30 0.00 0.00 13,973,314.38 13,973,314.38<br />
2030-31 0.00 0.00 13,965,634.38 13,965,634.38<br />
2031-32 0.00 0.00 13,961,928.13 13,961,928.13<br />
2032-33 0.00 0.00 13,958,790.63 13,958,790.63<br />
2033-34 0.00 0.00 13,915,596.88 13,915,596.88<br />
2034-35 0.00 0.00 13,925,025..00 13,925,025.00<br />
2035-36 0.00 0.00 13,904,500.00 13,904,500.00<br />
2036-37 0.00 0.00 9,757,500.00 9,757,500.00<br />
2037-38 0.00 0.00 9,739,912.50 9,739,912.50<br />
2038-39 0.00 0.00 9,733,950.00 9,733,950.00<br />
2039-40 0.00 0.00 9,728,850.00 9,728,850.00<br />
Total $ 93,065,432.55 45,806,801.95 433,704,117.14 572,576,351.31<br />
DEBT SERVICE FORECAST<br />
Fiscal Policy Compliance: General Revenue Debt<br />
The City's Fiscal Policies <strong>st</strong>ate that total net General Revenue Debt Service shall not exceed 25% <<strong>st</strong>rong>of</<strong>st</strong>rong> net<br />
revenue available for this purpose<br />
General Revenue Bond Debt vs. Policy Limit<br />
Actual FY04-10, E<strong>st</strong>imated FY11-12<br />
30.00%<br />
25.00%<br />
20.00%<br />
15.00%<br />
10.00%<br />
5.00%<br />
0.00%<br />
2004 2005 2006 2007 2008 2009 2010 2011 2012<br />
Policy Limit 25.00% 25.00% 25.00% 25.00% 25.00% 25.00% 25.00% 25.00% 25.00%<br />
Actual 7.28% 7.10% 7.04% 6.72% 8.05% 6.39% 6.84% 6.61% 7.00%<br />
Policy Limit<br />
Actual<br />
159
City <<strong>st</strong>rong>of</<strong>st</strong>rong> St. Petersburg, Florida - FY 2012 Proposed Fiscal Plan<br />
City Development<br />
City Development<br />
Total Full Time Equivalents (FTE) = 208.20<br />
City Development Admini<strong>st</strong>ration Department<br />
Total Full Time Equivalents (FTE) = 5.00<br />
Codes Compliance Department<br />
Total Full Time Equivalents (FTE) = 40.00<br />
Downtown Enterprise Facilities Department<br />
Total Full Time Equivalents (FTE) = 50.00<br />
Marketing & Communications Department<br />
Total Full Time Equivalents (FTE) = 18.20<br />
Planning & Economic Development Department<br />
Total Full Time Equivalents (FTE) = 67.00<br />
Real E<strong>st</strong>ate & Property Management Department<br />
Total Full Time Equivalents (FTE) = 19.00<br />
Transportation & Parking Management Department<br />
Total Full Time Equivalents (FTE) = 9.00<br />
160
City <<strong>st</strong>rong>of</<strong>st</strong>rong> St. Petersburg, Florida - FY 2012 Proposed Fiscal Plan<br />
City Development<br />
Budgetary Co<strong>st</strong> Summary<br />
FY 2009<br />
Actual<br />
FY 2010<br />
Actual<br />
FY 2011<br />
Adopted<br />
FY 2011<br />
Amended<br />
FY 2011<br />
E<strong>st</strong>imated<br />
FY 2012<br />
Proposed<br />
FY 2012<br />
Change<br />
Wages And Benefits 17,970,590 18,111,251 18,505,689 18,505,689 17,787,203 18,179,335 (1.76%)<br />
Services And Commodities 18,150,133 16,012,102 15,079,891 15,341,054 15,999,967 14,962,472 (0.78%)<br />
Capital 132,336 200,930 10,050 118,066 583,019 56,000 457.21%<br />
Debt 2,255,288 673,725 670,971 670,971 669,916 670,771 (0.03%)<br />
Grants And Aid 1,190,179 622,426 794,313 1,166,401 438,074 731,000 (7.97%)<br />
Transfers Out 2,868,397 1,040,004 500,000 538,404 813,404 500,000 0.00%<br />
Total Budget 42,566,923 36,660,437 35,560,914 36,340,585 36,291,583 35,099,578 (1.30%)<br />
Appropriations By<br />
Fund/Department<br />
FY 2009<br />
Actual<br />
FY 2010<br />
Actual<br />
FY 2011<br />
Adopted<br />
FY 2011<br />
Amended<br />
FY 2011<br />
E<strong>st</strong>imated<br />
FY 2012<br />
Proposed<br />
FY 2012<br />
Change<br />
General Operating Fund<br />
City Development Admini<strong>st</strong>ration<br />
Department<br />
689,805 646,924 607,207 607,207 630,515 637,376 4.97%<br />
Codes Compliance Department 2,480,642 2,523,703 2,466,853 2,470,462 2,424,207 2,439,255 (1.12%)<br />
Downtown Enterprise Facilities<br />
Department<br />
1,006,571 461,752 508,532 830,135 796,271 620,372 21.99%<br />
Marketing & Communications<br />
Department<br />
2,347,131 2,229,783 2,063,902 2,117,920 2,131,118 2,062,145 (0.09%)<br />
Planning & Economic Development<br />
Department<br />
4,379,284 4,328,545 3,747,205 3,867,198 3,768,244 3,386,025 (9.64%)<br />
Real E<strong>st</strong>ate & Property Management<br />
Department<br />
819,771 742,708 774,869 786,180 739,071 727,148 (6.16%)<br />
Transportation & Parking Management<br />
Department<br />
562,247 489,562 683,937 782,922 887,386 690,067 0.90%<br />
Total General Operating Fund 12,285,451 11,422,977 10,852,505 11,462,024 11,376,812 10,562,388 (2.67%)<br />
Non-General Funds<br />
Airport Operating 2,700,698 1,258,309 939,677 985,413 981,109 959,181 2.08%<br />
American Recovery & Reinve<strong>st</strong>ment<br />
Act<br />
0 300 0 0 0 0 0.00%<br />
Building Permit Special Revenue 4,265,920 3,369,229 3,450,982 3,451,821 3,421,392 3,485,604 1.00%<br />
Coliseum Operating 791,885 791,451 797,662 803,278 799,226 749,239 (6.07%)<br />
Jame<strong>st</strong>own Complex 506,161 531,429 512,610 514,081 556,632 545,862 6.49%<br />
Mahaffey Theater Operating 4,195,547 3,664,543 3,553,188 3,553,188 3,765,738 3,532,399 (0.59%)<br />
Marina Operating 2,957,298 3,088,501 2,901,702 2,934,669 3,118,221 3,225,402 11.16%<br />
Municipal Office Buildings 2,095,527 2,164,352 2,082,490 2,114,960 2,272,984 2,050,309 (1.55%)<br />
Neighborhood Stabilization<br />
Program<br />
52,961 81,859 0 0 0 0 0.00%<br />
Parking Revenue 2,815,614 2,562,479 2,735,348 2,723,235 2,723,902 2,794,575 2.17%<br />
Pier Operating 2,922,908 2,824,783 2,587,609 2,589,615 2,447,556 2,373,869 (8.26%)<br />
Port Operating 666,280 662,192 697,078 702,853 690,952 454,219 (34.84%)<br />
Sanitation Operating 844,211 907,181 1,105,366 1,115,807 764,740 1,034,156 (6.44%)<br />
Sunken Gardens 878,242 863,584 878,603 883,535 866,210 874,148 (0.51%)<br />
Technology & Infra<strong>st</strong>ructure<br />
Fund<br />
0 0 0 40,015 40,015 37,000 0.00%<br />
Tropicana Field 4,588,220 2,467,268 2,466,094 2,466,094 2,466,094 2,421,227 (1.82%)<br />
Total Non-General Funds 30,281,472 25,237,461 24,708,409 24,878,561 24,914,771 24,537,190 (0.69%)<br />
Total Budget 42,566,923 36,660,437 35,560,914 36,340,585 36,291,583 35,099,578 (1.30%)<br />
161
Revenue Sources<br />
City <<strong>st</strong>rong>of</<strong>st</strong>rong> St. Petersburg, Florida - FY 2012 Proposed Fiscal Plan<br />
FY 2009<br />
Actual<br />
FY 2010<br />
Actual<br />
FY 2011<br />
Adopted<br />
FY 2011<br />
Amended<br />
FY 2011<br />
E<strong>st</strong>imated<br />
FY 2012<br />
Proposed<br />
FY 2012<br />
Change<br />
Contractors Permits 2,689,693 2,791,180 2,631,000 2,631,000 3,033,259 2,631,000 0.00%<br />
Other License And Permits 14,384 14,939 11,100 11,100 4,065 78,100 603.60%<br />
Federal Grants 187,654 145,673 142,000 142,000 11,241 0 (100.00%)<br />
General Government 525,731 534,716 529,092 529,092 196,484 529,092 0.00%<br />
Transportation Charges 3,657,157 3,502,796 3,691,134 3,691,134 3,609,014 3,838,534 3.99%<br />
Housing Services 507,900 509,910 475,469 475,469 528,735 511,907 7.66%<br />
Culture And Recreation Charges 8,760,133 7,794,848 7,792,959 7,792,959 7,974,684 7,769,678 (0.30%)<br />
Other Charges For Services 28,059 22,797 20,000 20,000 17,482 20,000 0.00%<br />
Traffic And Parking 980 340 0 0 80 0 0.00%<br />
Violation Of Local Ordinances 384,831 466,258 500,441 500,441 450,430 500,441 0.00%<br />
Intere<strong>st</strong> Earnings 120,550 80,222 130,579 130,579 109,608 48,923 (62.53%)<br />
Rents And Royalties 3,901,309 3,706,668 3,757,483 3,757,483 3,591,472 3,721,230 (0.96%)<br />
Special Assessment (720) 0 73,050 73,050 0 73,050 0.00%<br />
Sale Of Fixed Assets 28,251 43,125 0 0 0 0 0.00%<br />
Contributions And Donations 6,702 12,452 454,576 454,576 454,619 454,576 0.00%<br />
Misc Revenue 465,309 267,449 126,625 126,625 344,280 351,824 177.85%<br />
General & Admini<strong>st</strong>rative 1,409,412 1,344,816 1,385,160 1,385,160 1,385,160 1,241,712 (10.36%)<br />
Other Charges (125) (1,389) 12 12 (106) 12 0.00%<br />
Transfer From General Fund 5,367,000 4,662,700 4,214,335 4,214,335 4,224,335 3,993,000 (5.25%)<br />
Transfer From Economic Stability 1,009,594 0 0 0 0 0 0.00%<br />
Transfer From Parking Revenue 14,900 15,000 22,896 22,896 22,896 22,896 0.00%<br />
Transfer From Airport Capital<br />
180,406 0 0 0 0 0 0.00%<br />
Projects<br />
Sunken Gardens 3,404 35,252 (387) 4,545 14,725 (259) (33.07%)<br />
General Fund 9,648,958 8,924,776 8,168,546 8,778,065 9,133,318 7,999,420 (2.07%)<br />
Building Permit Special Revenue 1,151,250 159,547 399,982 400,821 220,887 434,604 8.66%<br />
Port Operating 6,520 (30,929) 25,865 31,640 98,431 (307) (101.19%)<br />
Municipal Office Buildings (620,540) (501,891) (623,510) (591,040) (433,026) (643,488) 3.20%<br />
Airport Operating 148,782 176,501 (12,223) 33,513 889 (33,919) 177.50%<br />
Pier Operating 2,693 117,242 47,609 49,615 55,565 1,161 (97.56%)<br />
Marina Operating 181,891 318,634 (57,085) (24,118) (44,366) (193) (99.66%)<br />
Mahaffey Theater Operating (857) (32,017) 102,607 102,607 79,507 3,855 (96.24%)<br />
Sanitation Operating 842,281 895,904 1,105,366 1,115,807 759,316 1,034,156 (6.44%)<br />
Jame<strong>st</strong>own Complex (5,058) (50,579) 38,902 40,373 19,844 36,730 (5.58%)<br />
Parking Revenue 453,530 360,156 407,181 395,068 421,901 411,408 1.04%<br />
Tropicana Field 1,428,097 233,886 239 239 (36,358) 35,586 14789.54%<br />
Coliseum Operating 13,899 57,296 (89) 5,527 3,197 (2,151) 2316.85%<br />
Neighborhood Stabilization<br />
52,961 81,859 0 0 0 0 0.00%<br />
Program<br />
American Recovery & Reinve<strong>st</strong>ment<br />
0 300 0 0 0 0 0.00%<br />
Act<br />
Technology & Infra<strong>st</strong>ructure<br />
0 0 0 40,015 40,015 37,000 0.00%<br />
Fund<br />
Total Revenue 42,566,923 36,660,437 35,560,914 36,340,585 36,291,583 35,099,578 (1.30%)<br />
Position Summary By Department<br />
FY 2009<br />
Actual<br />
FY 2010<br />
Actual<br />
FY 2011<br />
Adopted<br />
FY 2012<br />
Proposed<br />
FY 2012<br />
Change<br />
City Development Admini<strong>st</strong>ration Department 5.00 5.00 5.00 5.00 0.00%<br />
Codes Compliance Department 36.00 36.00 40.00 40.00 0.00%<br />
Downtown Enterprise Facilities Department 37.00 38.00 36.00 36.00 0.00%<br />
Marketing & Communications Department 16.00 16.00 16.00 17.00 6.25%<br />
Planning & Economic Development Department 76.00 71.00 70.00 67.00 (4.29%)<br />
Real E<strong>st</strong>ate & Property Management Department 13.00 13.00 13.00 12.00 (7.69%)<br />
Transportation & Parking Management Department 9.00 9.00 9.00 9.00 0.00%<br />
Total Full-Time FTE 192.00 188.00 189.00 186.00 (1.59%)<br />
Downtown Enterprise Facilities Department 19.53 11.50 11.00 14.00 27.27%<br />
Marketing & Communications Department 2.70 2.00 1.50 1.20 (19.72%)<br />
Real E<strong>st</strong>ate & Property Management Department 6.00 7.00 7.00 7.00 0.00%<br />
Total Part-Time FTE 28.23 20.50 19.50 22.20 13.87%<br />
162
City <<strong>st</strong>rong>of</<strong>st</strong>rong> St. Petersburg, Florida - FY 2012 Proposed Fiscal Plan<br />
Position Summary By Department<br />
FY 2009<br />
Actual<br />
FY 2010<br />
Actual<br />
FY 2011<br />
Adopted<br />
FY 2012<br />
Proposed<br />
FY 2012<br />
Change<br />
Total FTE 220.23 208.50 208.50 208.20 (0.14%)<br />
163
Department Mission Statement<br />
City <<strong>st</strong>rong>of</<strong>st</strong>rong> St. Petersburg, Florida - FY 2012 Proposed Fiscal Plan<br />
City Development<br />
City Development Admini<strong>st</strong>ration Department<br />
The mission <<strong>st</strong>rong>of</<strong>st</strong>rong> City Development Admini<strong>st</strong>ration Department (CDA) is to provide team leadership and management guidance to all departments and activities<br />
within the City Development Admini<strong>st</strong>ration.<br />
Services Provided<br />
City Development Admini<strong>st</strong>ration Department (CDA) provides the following services:<br />
• CDA provides management and admini<strong>st</strong>rative services to all CDA departments: Codes Compliance, Planning & Economic Development, Real E<strong>st</strong>ate &<br />
Property Management, Marketing & Communications, Transportation & Parking Management, and Downtown Enterprise Facilities (Airport, Port, Marina,<br />
Jame<strong>st</strong>own, Dwight Jones Center, Mahaffey Theater, Pier, Coliseum, Sunken Gardens, and Tropicana Field).<br />
• This department also plays a lead role in major downtown events (e.g. Honda Grand Prix <<strong>st</strong>rong>of</<strong>st</strong>rong> St. Petersburg), sports franchise negotiations and coordination,<br />
convention business recruitment, development projects, and other special programs.<br />
Budgetary Co<strong>st</strong> Summary<br />
FY 2009<br />
Actual<br />
FY 2010<br />
Actual<br />
FY 2011<br />
Adopted<br />
FY 2011<br />
Amended<br />
FY 2011<br />
E<strong>st</strong>imated<br />
FY 2012<br />
Proposed<br />
FY 2012<br />
Change<br />
Wages And Benefits 562,111 561,490 544,551 544,551 544,812 572,770 5.18%<br />
Services And Commodities 121,873 85,434 62,656 62,656 85,703 64,606 3.11%<br />
Capital 5,821 0 0 0 0 0 0.00%<br />
Total Budget 689,805 646,924 607,207 607,207 630,515 637,376 4.97%<br />
Appropriations By Fund/Program<br />
FY 2009<br />
Actual<br />
FY 2010<br />
Actual<br />
FY 2011<br />
Adopted<br />
FY 2011<br />
Amended<br />
FY 2011<br />
E<strong>st</strong>imated<br />
FY 2012<br />
Proposed<br />
FY 2012<br />
Change<br />
General Operating Fund<br />
City Development Admini<strong>st</strong>ration Program 689,805 646,924 607,207 607,207 630,515 637,376 4.97%<br />
Total Budget 689,805 646,924 607,207 607,207 630,515 637,376 4.97%<br />
Revenue Sources<br />
FY 2009<br />
Actual<br />
FY 2010<br />
Actual<br />
FY 2011<br />
Adopted<br />
FY 2011<br />
Amended<br />
FY 2011<br />
E<strong>st</strong>imated<br />
FY 2012<br />
Proposed<br />
FY 2012<br />
Change<br />
Contributions And Donations 0 4,543 0 0 0 0 0.00%<br />
Misc Revenue 57,883 738 0 0 0 0 0.00%<br />
General & Admini<strong>st</strong>rative 303,660 286,740 295,344 295,344 295,344 295,344 0.00%<br />
General Fund 328,262 354,903 311,863 311,863 335,171 342,032 9.67%<br />
Total Revenue 689,805 646,924 607,207 607,207 630,515 637,376 4.97%<br />
Position Summary<br />
FY 2009<br />
Actual<br />
FY 2010<br />
Actual<br />
FY 2011<br />
Adopted<br />
FY 2012<br />
Proposed<br />
FY 2012<br />
Change<br />
City Development Admini<strong>st</strong>ration Program 5.00 5.00 5.00 5.00 0.00%<br />
Total Full-Time FTE 5.00 5.00 5.00 5.00 0.00%<br />
Total FTE 5.00 5.00 5.00 5.00 0.00%<br />
- In FY12, the department's <strong>budget</strong> will increase by 4.97%. The majority <<strong>st</strong>rong>of</<strong>st</strong>rong> the increase is in salaries and benefits due to changes in the City's<br />
organizational <strong>st</strong>ructure.<br />
164
Department Mission Statement<br />
City <<strong>st</strong>rong>of</<strong>st</strong>rong> St. Petersburg, Florida - FY 2012 Proposed Fiscal Plan<br />
Codes Compliance Department<br />
The mission <<strong>st</strong>rong>of</<strong>st</strong>rong> the Codes Compliance Assi<strong>st</strong>ance Department is to educate property owners and enforce the municipal codes, including zoning issues and<br />
housing/vegetation maintenance <strong>st</strong>andards, in order to maintain the quality and extend the life <<strong>st</strong>rong>of</<strong>st</strong>rong> the exi<strong>st</strong>ing housing <strong>st</strong>ock, to <strong>st</strong>abilize neighborhoods, and to<br />
protect the public.<br />
Services Provided<br />
The Codes Department provides the following services:<br />
• Encourage voluntary compliance with municipal codes through education and notification.<br />
• Encourage code compliance through admini<strong>st</strong>ration <<strong>st</strong>rong>of</<strong>st</strong>rong> legal processes such as the Code Enforcement Board, Special Magi<strong>st</strong>rate, and municipal ordinance<br />
violation prosecution (notices to appear, trials, and arraignments) in County court.<br />
• Address a variety <<strong>st</strong>rong>of</<strong>st</strong>rong> municipal code issues involving zoning and redevelopment regulations, vegetation maintenance, rental housing inspection, securing<br />
<strong>st</strong>ructures, inoperative motor vehicles, junk and rubbish, <strong>st</strong>ructure disrepair, and unsafe <strong>st</strong>ructures.<br />
• Support neighborhoods, City teams, and City initiatives that improve the quality <<strong>st</strong>rong>of</<strong>st</strong>rong> life in St. Petersburg.<br />
• Refer citizens in need to volunteer help, loan programs, and other City services provided by Police, Fire, Planning & Economic Development Services, and<br />
Sanitation.<br />
• Support City Council to craft and admini<strong>st</strong>er ordinances which address community concerns.<br />
• Address blighting issues which include overgrown vegetation, junk and rubbish, and inoperative motor vehicles.<br />
• Discourage unsafe maintenance and parking practices on private property that may otherwise lead to criminal activity and vehicle accidents.<br />
• Address unfit and unsafe <strong>st</strong>ructures through condemnation resulting in rehabilitation or demolition.<br />
• Provide admini<strong>st</strong>rative and clerical services, including a citizen telephone call center, in support <<strong>st</strong>rong>of</<strong>st</strong>rong> the various education and enforcement programs.<br />
• Admini<strong>st</strong>er and supervise the Neighborhood Team, commonly called the N-Team; this includes <strong>budget</strong> and expenditure oversight.<br />
Budgetary Co<strong>st</strong> Summary<br />
FY 2009<br />
Actual<br />
FY 2010<br />
Actual<br />
FY 2011<br />
Adopted<br />
FY 2011<br />
Amended<br />
FY 2011<br />
E<strong>st</strong>imated<br />
FY 2012<br />
Proposed<br />
FY 2012<br />
Change<br />
Wages And Benefits 2,370,223 2,445,201 2,712,428 2,712,428 2,556,823 2,658,856 (1.98%)<br />
Services And Commodities 956,095 996,025 859,791 873,841 632,124 814,555 (5.26%)<br />
Total Budget 3,326,318 3,441,226 3,572,219 3,586,269 3,188,947 3,473,411 (2.77%)<br />
Appropriations By Fund/Program<br />
FY 2009<br />
Actual<br />
FY 2010<br />
Actual<br />
FY 2011<br />
Adopted<br />
FY 2011<br />
Amended<br />
FY 2011<br />
E<strong>st</strong>imated<br />
FY 2012<br />
Proposed<br />
FY 2012<br />
Change<br />
General Operating Fund<br />
Codes Compliance Assi<strong>st</strong>ance Program 2,480,642 2,523,703 2,466,853 2,470,462 2,424,207 2,439,255 (1.12%)<br />
Neighborhood Stabilization Program<br />
Housing Tru<strong>st</strong> Funds Program 1,465 10,446 0 0 0 0 0.00%<br />
Sanitation Operating<br />
Sanitation & Codes Compliance Program 844,211 907,076 1,105,366 1,115,807 764,740 1,034,156 (6.44%)<br />
Total Budget 3,326,318 3,441,226 3,572,219 3,586,269 3,188,947 3,473,411 (2.77%)<br />
Revenue Sources<br />
FY 2009<br />
Actual<br />
FY 2010<br />
Actual<br />
FY 2011<br />
Adopted<br />
FY 2011<br />
Amended<br />
FY 2011<br />
E<strong>st</strong>imated<br />
FY 2012<br />
Proposed<br />
FY 2012<br />
Change<br />
General Government 1,321 742 3,000 3,000 183 3,000 0.00%<br />
Violation Of Local Ordinances 384,401 465,748 500,000 500,000 450,000 500,000 0.00%<br />
Special Assessment 0 0 73,050 73,050 0 73,050 0.00%<br />
Sale Of Fixed Assets 0 7,925 0 0 0 0 0.00%<br />
Misc Revenue 24 42 0 0 1 0 0.00%<br />
General Fund 2,095,315 2,049,667 1,890,803 1,894,412 1,974,198 1,863,205 (1.46%)<br />
Sanitation Operating 843,791 906,656 1,105,366 1,115,807 764,565 1,034,156 (6.44%)<br />
Neighborhood Stabilization<br />
Program<br />
1,465 10,446 0 0 0 0 0.00%<br />
165
Revenue Sources<br />
City <<strong>st</strong>rong>of</<strong>st</strong>rong> St. Petersburg, Florida - FY 2012 Proposed Fiscal Plan<br />
FY 2009<br />
Actual<br />
FY 2010<br />
Actual<br />
FY 2011<br />
Adopted<br />
FY 2011<br />
Amended<br />
FY 2011<br />
E<strong>st</strong>imated<br />
FY 2012<br />
Proposed<br />
FY 2012<br />
Change<br />
Total Revenue 3,326,318 3,441,226 3,572,219 3,586,269 3,188,947 3,473,411 (2.77%)<br />
Position Summary<br />
FY 2009<br />
Actual<br />
FY 2010<br />
Actual<br />
FY 2011<br />
Adopted<br />
FY 2012<br />
Proposed<br />
FY 2012<br />
Change<br />
Codes Compliance Assi<strong>st</strong>ance Program 29.00 29.00 28.72 28.72 0.00%<br />
Sanitation & Codes Compliance Program 7.00 7.00 11.28 11.28 0.00%<br />
Total Full-Time FTE 36.00 36.00 40.00 40.00 0.00%<br />
Total FTE 36.00 36.00 40.00 40.00 0.00%<br />
- No changes in <strong>st</strong>affing or services for FY12. There was a 25% reduction in Codes personnel over the la<strong>st</strong> three years, and these efficiencies<br />
continue to reap benefits. The FY12 <strong>budget</strong> will be 1.1% less than FY11 because <<strong>st</strong>rong>of</<strong>st</strong>rong> greater accuracy in the personnel model.<br />
- The Codes Compliance Department's performance measures address the Mayor's goals <<strong>st</strong>rong>of</<strong>st</strong>rong> Seamlessness and Service.<br />
Objective and Performance Measure<br />
Unit Of<br />
Measure<br />
FY 2009<br />
Actual<br />
FY 2010<br />
Actual<br />
FY 2011<br />
Target<br />
FY2011<br />
E<strong>st</strong>imate<br />
FY 2012<br />
Proposed<br />
Codes Compliance Program Objective<br />
The department objectives are to respond to every reque<strong>st</strong> to inve<strong>st</strong>igate reported violations, to competently communicate program requirements to<br />
all affected citizens, to provide consi<strong>st</strong>ent due process before assessing penalty fines and liens, to protect the public from nuisance property<br />
conditions such as unfit and unsafe <strong>st</strong>ructures, overgrowth, vacant and open <strong>st</strong>ructures, and other public health and safety nuisance conditions, to<br />
provide incentives to correct code violations and to provide deterrents to incipient code violations, and to responsibly admini<strong>st</strong>er all processes at the<br />
lowe<strong>st</strong> possible co<strong>st</strong> with the highe<strong>st</strong> possible output.<br />
Number <<strong>st</strong>rong>of</<strong>st</strong>rong> Code Enforcement Board Cases # 2,000 1,673 2,000 1,500 1,600<br />
Number <<strong>st</strong>rong>of</<strong>st</strong>rong> Code Enforcement Liens # 600 1,190 1,000 1,200 1,400<br />
Number <<strong>st</strong>rong>of</<strong>st</strong>rong> Codes Compliance Cases Opened # 22,000 25,141 25,000 25,000 26,000<br />
Number <<strong>st</strong>rong>of</<strong>st</strong>rong> Codes Compliance Inspections # 74,000 91,672 78,000 85,000 88,000<br />
Number <<strong>st</strong>rong>of</<strong>st</strong>rong> Codes Compliance Notices and Letters # 35,000 32,535 35,000 32,000 33,000<br />
Number <<strong>st</strong>rong>of</<strong>st</strong>rong> County Court Cases # 800 756 1,000 900 1,000<br />
Number <<strong>st</strong>rong>of</<strong>st</strong>rong> Overgrowth Cases Opened # 6,200 5,837 5,500 6,000 6,500<br />
Number <<strong>st</strong>rong>of</<strong>st</strong>rong> Securing Cases Opened # 500 1,219 1,000 1,200 1,300<br />
Number <<strong>st</strong>rong>of</<strong>st</strong>rong> Special Magi<strong>st</strong>rate Cases # 1,800 2,153 1,000 1,800 2,000<br />
Value <<strong>st</strong>rong>of</<strong>st</strong>rong> Code Enforcement Liens Certified $ 1,625,000 3,433,000 1,500,000 1,700,000 1,800,000<br />
Value <<strong>st</strong>rong>of</<strong>st</strong>rong> Code Enforcement Liens Collected $ 140,000 467,320 150,000 180,000 200,000<br />
Condemnation Program Objective<br />
The City's Condemnation Program objectives are to address unfit and unsafe <strong>st</strong>ructures through condemnation that results in rehabilitation or<br />
demolition; to coordinate demolition <<strong>st</strong>rong>of</<strong>st</strong>rong> City-acquired <strong>st</strong>ructures in support <<strong>st</strong>rong>of</<strong>st</strong>rong> City development projects; to provide assi<strong>st</strong>ance to codes<br />
inve<strong>st</strong>igators to order securing <<strong>st</strong>rong>of</<strong>st</strong>rong> vacant and open <strong>st</strong>ructures under compels conditions; and to assi<strong>st</strong> the City's Legal Department to abate public<br />
nuisance property conditions and coordinate any abatements authorized by court order.<br />
Number <<strong>st</strong>rong>of</<strong>st</strong>rong> Condemnation Appeals Received # 20 13 20 20 20<br />
Number <<strong>st</strong>rong>of</<strong>st</strong>rong> Condemned Structures Demolished by Private # 25 32 25 25 25<br />
Owners<br />
Number <<strong>st</strong>rong>of</<strong>st</strong>rong> Condemned Structures Repaired by Private # 30 16 30 20 20<br />
Owners<br />
Number <<strong>st</strong>rong>of</<strong>st</strong>rong> Structures Demolished by City Program # 65 107 75 75 75<br />
Provide Assi<strong>st</strong>ance to Residents to Correct Violations<br />
166
City <<strong>st</strong>rong>of</<strong>st</strong>rong> St. Petersburg, Florida - FY 2012 Proposed Fiscal Plan<br />
Objective and Performance Measure<br />
Unit Of<br />
FY 2009 FY 2010 FY 2011 FY2011 FY 2012<br />
Measure<br />
Actual Actual Target E<strong>st</strong>imate Proposed<br />
Community Assi<strong>st</strong>ance provides assi<strong>st</strong>ance to homeowners physically or financially unable to correct minor code violations. The program<br />
addresses four issues: increasing volunteers from the community, training inmates and reducing recidivism, dealing with an aging housing <strong>st</strong>ock;<br />
and helping low income and elderly homeowners bring their properties up to minimum code.<br />
Community Assi<strong>st</strong>ance Projects # 273 290 200 200 225<br />
Homes Completed # 198 228 200 200 200<br />
Volunteers # 1,000 1,500 1,000 1,200 1,400<br />
167
Department Mission Statement<br />
City <<strong>st</strong>rong>of</<strong>st</strong>rong> St. Petersburg, Florida - FY 2012 Proposed Fiscal Plan<br />
Downtown Enterprise Facilities Department<br />
The mission <<strong>st</strong>rong>of</<strong>st</strong>rong> the Downtown Enterprise Facilities Department is to oversee the management and operation <<strong>st</strong>rong>of</<strong>st</strong>rong> its assigned facilities, ensuring safe and enjoyable<br />
access to residents and visitors, while taking measures to operate those facilities efficiently and economically, and <strong>st</strong>abilizing and reducing subsidies where<br />
possible.<br />
Services Provided<br />
The Downtown Enterprise Facilities Department provides the following services:<br />
• Oversight <<strong>st</strong>rong>of</<strong>st</strong>rong> the management, operation, and/or contract management for the following City facilities and related business: the Pier, the Port, the Marina,<br />
Albert Whitted Airport, Jame<strong>st</strong>own, Dwight Jones Center, Sunken Gardens, the Coliseum, Mahaffey Theater at the Progress Energy Center, Tropicana Field, and<br />
Progress Energy Park.<br />
Budgetary Co<strong>st</strong> Summary<br />
FY 2009<br />
Actual<br />
FY 2010<br />
Actual<br />
FY 2011<br />
Adopted<br />
FY 2011<br />
Amended<br />
FY 2011<br />
E<strong>st</strong>imated<br />
FY 2012<br />
Proposed<br />
FY 2012<br />
Change<br />
Wages And Benefits 5,487,918 5,231,236 5,491,734 5,491,734 5,059,531 5,390,576 (1.84%)<br />
Services And Commodities 9,751,398 9,348,536 8,817,000 8,877,257 9,671,827 8,828,571 0.13%<br />
Capital 24,255 36,041 10,050 10,752 498,163 13,000 29.35%<br />
Debt 2,255,288 673,725 670,971 670,971 669,916 670,771 (0.03%)<br />
Grants And Aid 826,554 284,376 353,000 673,741 50,168 353,000 0.00%<br />
Transfers Out 2,868,397 1,040,004 500,000 538,404 538,404 500,000 0.00%<br />
Total Budget 21,213,810 16,613,918 15,842,755 16,262,860 16,488,009 15,755,918 (0.55%)<br />
Appropriations By Fund/Program<br />
FY 2009<br />
Actual<br />
FY 2010<br />
Actual<br />
FY 2011<br />
Adopted<br />
FY 2011<br />
Amended<br />
FY 2011<br />
E<strong>st</strong>imated<br />
FY 2012<br />
Proposed<br />
FY 2012<br />
Change<br />
General Operating Fund<br />
Downtown Enterprise Facilities Program 932,416 397,307 385,730 107,056 86,000 202,704 (47.45%)<br />
Dwight Jones Center Program 74,131 65,916 69,802 70,039 35,298 64,668 (7.36%)<br />
Housing Admini<strong>st</strong>ration Program 24 40 0 40 0 0 0.00%<br />
Non-Department Program 0 (1,511) 0 0 156 0 0.00%<br />
Non-Departmental/Arts/Social Services 0 0 53,000 653,000 674,817 353,000 566.04%<br />
Totals for General Operating Fund 1,006,571 461,752 508,532 830,135 796,271 620,372 21.99%<br />
Mahaffey Theater Operating<br />
Mahaffey Theater Program 4,195,547 3,664,543 3,553,188 3,553,188 3,765,738 3,532,399 (0.59%)<br />
Pier Operating<br />
Pier Program 2,922,908 2,824,783 2,587,609 2,589,615 2,447,556 2,373,869 (8.26%)<br />
Coliseum Operating<br />
Coliseum Program 791,885 791,451 797,662 803,278 799,226 749,239 (6.07%)<br />
Sunken Gardens<br />
Non-Department Program<br />
Sunken Gardens Program<br />
0<br />
878,242<br />
0<br />
863,584<br />
0<br />
878,603<br />
0<br />
883,535<br />
478<br />
865,732<br />
0<br />
874,148<br />
0.00%<br />
(0.51%)<br />
Totals for Sunken Gardens 878,242 863,584 878,603 883,535 866,210 874,148 (0.51%)<br />
Tropicana Field<br />
Tropicana Field Program 4,588,220 2,467,268 2,466,094 2,466,094 2,466,094 2,421,227 (1.82%)<br />
Sanitation Operating<br />
Non-Department Program 0 105 0 0 0 0 0.00%<br />
Airport Operating<br />
Airport Program 2,700,698 1,258,309 939,677 985,413 981,109 959,181 2.08%<br />
Marina Operating<br />
Marina Program 2,957,298 3,088,501 2,901,702 2,934,669 3,118,221 3,225,402 11.16%<br />
Jame<strong>st</strong>own Complex<br />
Jame<strong>st</strong>own Complex Program 506,161 531,429 512,610 514,081 556,632 545,862 6.49%<br />
168
Appropriations By Fund/Program<br />
City <<strong>st</strong>rong>of</<strong>st</strong>rong> St. Petersburg, Florida - FY 2012 Proposed Fiscal Plan<br />
FY 2009<br />
Actual<br />
FY 2010<br />
Actual<br />
FY 2011<br />
Adopted<br />
FY 2011<br />
Amended<br />
FY 2011<br />
E<strong>st</strong>imated<br />
FY 2012<br />
Proposed<br />
FY 2012<br />
Change<br />
Port Operating<br />
Port Program 666,280 662,192 697,078 702,853 690,952 454,219 (34.84%)<br />
Total Budget 21,213,810 16,613,918 15,842,755 16,262,860 16,488,009 15,755,918 (0.55%)<br />
Revenue Sources<br />
FY 2009<br />
Actual<br />
FY 2010<br />
Actual<br />
FY 2011<br />
Adopted<br />
FY 2011<br />
Amended<br />
FY 2011<br />
E<strong>st</strong>imated<br />
FY 2012<br />
Proposed<br />
FY 2012<br />
Change<br />
Transportation Charges 1,379,000 1,370,187 1,363,420 1,363,420 1,316,374 1,485,820 8.98%<br />
Housing Services 507,900 509,910 475,469 475,469 528,735 511,907 7.66%<br />
Culture And Recreation Charges 8,760,133 7,794,848 7,792,959 7,792,959 7,974,684 7,769,678 (0.30%)<br />
Other Charges For Services 119 1,552 0 0 0 0 0.00%<br />
Traffic And Parking 980 340 0 0 80 0 0.00%<br />
Intere<strong>st</strong> Earnings 18,637 3,712 24,085 24,085 20,822 6,623 (72.50%)<br />
Rents And Royalties 843,708 746,928 758,088 758,088 647,096 685,835 (9.53%)<br />
Sale Of Fixed Assets 0 0 0 0 0 0 0.00%<br />
Contributions And Donations 1,702 844 449,576 449,576 449,619 449,576 0.00%<br />
Misc Revenue 382,297 266,392 126,175 126,175 343,661 207,926 64.79%<br />
Other Charges 69 (1,284) 0 0 13 0 0.00%<br />
Transfer From General Fund 5,367,000 4,662,700 4,214,335 4,214,335 4,224,335 3,993,000 (5.25%)<br />
Transfer From Economic Stability 1,009,594 0 0 0 0 0 0.00%<br />
Transfer From Airport Capital<br />
Projects<br />
180,406 0 0 0 0 0 0.00%<br />
Sunken Gardens 3,404 35,252 (387) 4,545 14,725 (259) (33.07%)<br />
Port Operating 6,520 (30,929) 25,865 31,640 98,431 (307) (101.19%)<br />
General Fund 982,893 432,397 493,210 814,813 791,179 605,050 22.68%<br />
Airport Operating 148,782 176,501 (12,223) 33,513 889 (33,919) 177.50%<br />
Mahaffey Theater Operating (857) (32,017) 102,607 102,607 79,484 3,855 (96.24%)<br />
Marina Operating 181,891 318,634 (57,085) (24,118) (44,366) (193) (99.66%)<br />
Pier Operating 2,693 117,242 47,609 49,615 55,565 1,161 (97.56%)<br />
Jame<strong>st</strong>own Complex (5,058) (50,579) 38,902 40,373 19,844 36,730 (5.58%)<br />
Coliseum Operating 13,899 57,296 (89) 5,527 3,197 (2,151) 2316.85%<br />
Tropicana Field 1,428,097 233,886 239 239 (36,358) 35,586 14789.54%<br />
Sanitation Operating 0 105 0 0 0 0 0.00%<br />
Total Revenue 21,213,810 16,613,918 15,842,755 16,262,860 16,488,009 15,755,918 (0.55%)<br />
Position Summary<br />
FY 2009<br />
Actual<br />
FY 2010<br />
Actual<br />
FY 2011<br />
Adopted<br />
FY 2012<br />
Proposed<br />
FY 2012<br />
Change<br />
Jame<strong>st</strong>own Complex Program 4.00 4.00 4.00 4.00 0.00%<br />
Downtown Enterprise Facilities Program 6.00 6.00 6.00 6.00 0.00%<br />
Coliseum Program 5.00 5.00 5.00 5.00 0.00%<br />
Sunken Gardens Program 5.00 5.00 5.00 4.00 (20.00%)<br />
Airport Program 3.00 3.00 3.00 3.00 0.00%<br />
Marina Program 11.00 11.00 11.00 12.00 9.09%<br />
Port Program 3.00 4.00 2.00 2.00 0.00%<br />
Total Full-Time FTE 37.00 38.00 36.00 36.00 0.00%<br />
Dwight Jones Center Program 0.50 0.50 0.50 0.80 60.00%<br />
Coliseum Program 3.23 0.50 0.50 0.30 (40.00%)<br />
Sunken Gardens Program 7.20 3.50 3.50 4.10 17.14%<br />
Airport Program 0.40 0.50 0.50 0.60 20.00%<br />
Marina Program 6.40 4.50 3.00 4.80 60.00%<br />
Port Program 1.80 2.00 3.00 3.40 13.33%<br />
Total Part-Time FTE 19.53 11.50 11.00 14.00 27.27%<br />
169
City <<strong>st</strong>rong>of</<strong>st</strong>rong> St. Petersburg, Florida - FY 2012 Proposed Fiscal Plan<br />
Position Summary<br />
FY 2009<br />
Actual<br />
FY 2010<br />
Actual<br />
FY 2011<br />
Adopted<br />
FY 2012<br />
Proposed<br />
FY 2012<br />
Change<br />
Total FTE 56.53 49.50 47.00 50.00 6.38%<br />
- All co<strong>st</strong>s required for the admini<strong>st</strong>ration <<strong>st</strong>rong>of</<strong>st</strong>rong> this department (DEF), except for the Progress Energy Park charges, are allocated to the facilities<br />
managed according to the e<strong>st</strong>imated amount <<strong>st</strong>rong>of</<strong>st</strong>rong> time spent directing and assi<strong>st</strong>ing in each operation.<br />
- The six full-time positions in the Downtown Enterprise Facilities Program are currently <strong>st</strong>affed at different locations but provide admini<strong>st</strong>rative<br />
and accounting services through the Downtown Enterprise Facilities Department, with salaries and benefits co<strong>st</strong>s allocated to each facility.<br />
- In FY12, the Account Clerk II position assigned to Sunken Gardens will be moved to Admini<strong>st</strong>ration and the Information Speciali<strong>st</strong> position in<br />
Admini<strong>st</strong>ration to Sunken Gardens. Also a vacant full-time Facilities Assi<strong>st</strong>ant position in Sunken Gardens will be reduced to part-time.<br />
- Capital reque<strong>st</strong>s in the amount <<strong>st</strong>rong>of</<strong>st</strong>rong> $13,000 are being made for Jame<strong>st</strong>own for replacement <<strong>st</strong>rong>of</<strong>st</strong>rong> carpeting and air conditioning. If replaced, the<br />
equipment is charged to the Jame<strong>st</strong>own Operating Fund.<br />
- The department's General Fund <strong>budget</strong> increased by 21.99% in FY12 due to an increase in the internal service charge for Self Insurance and in<br />
wages and benefits due to a change in the City's organizational <strong>st</strong>ructure.<br />
- The FY12 amount for Non-Departmental co<strong>st</strong>s is $53,000, which includes $15,000 for the Pier Aquarium and $38,000 for the Florida<br />
Orche<strong>st</strong>ra.<br />
- In FY12, two temporary positions at the Marina, a full-time Account Clerk II and a part-time Marina Assi<strong>st</strong>ant, will be added for the Marina<br />
Ship Store.<br />
- Part-time FTE calculations reflect actual hours worked.<br />
The Downtown Enterprise Facilities Department's fir<strong>st</strong>, fourth, fifth, and sixth performance measures address the Mayor's goal <<strong>st</strong>rong>of</<strong>st</strong>rong> Service.<br />
While the third, fourth, and seventh performance measures are linked to the Mayor's goal <<strong>st</strong>rong>of</<strong>st</strong>rong> Sports, Arts & Culture. The fifth performance<br />
measure also addresses the Mayor's goal <<strong>st</strong>rong>of</<strong>st</strong>rong> Small Business.<br />
Objective and Performance Measure<br />
Unit Of<br />
Measure<br />
FY 2009<br />
Actual<br />
FY 2010<br />
Actual<br />
FY 2011<br />
Target<br />
FY2011<br />
E<strong>st</strong>imate<br />
FY 2012<br />
Proposed<br />
Airport - Aircraft Operations, Based Aircraft & Lease Value<br />
The objective <<strong>st</strong>rong>of</<strong>st</strong>rong> the Airport, as a City enterprise, is to generate sufficient funds from its operation to support itself.<br />
Airport - Number <<strong>st</strong>rong>of</<strong>st</strong>rong> Airport Operations # 83,398 77,600 80,000 85,200 85,200<br />
Airport - Number <<strong>st</strong>rong>of</<strong>st</strong>rong> Based Aircraft # 185 185 185 185 185<br />
Airport - Total Lease Value $ 895,960 943,059 951,900 936,000 993,000<br />
General Fund loan for the Airport $ 466,000 136,000 0 0 0<br />
Coliseum<br />
The objective <<strong>st</strong>rong>of</<strong>st</strong>rong> the Coliseum is to help reduce reliance on General Fund subsidy by maintaining/increasing <strong>operating</strong> revenues through public<br />
utilization <<strong>st</strong>rong>of</<strong>st</strong>rong> the building, which is partially measured by the number <<strong>st</strong>rong>of</<strong>st</strong>rong> events held and attendance.<br />
Coliseum Number <<strong>st</strong>rong>of</<strong>st</strong>rong> Performances # 148 146 185 146 148<br />
Coliseum Total Attendance # 83,057 83,040 85,000 83,000 85,000<br />
Subsidy for the Coliseum $ 193,000 232,000 176,000 228,000 201,000<br />
Mahaffey Performances & Attendance<br />
The objective <<strong>st</strong>rong>of</<strong>st</strong>rong> the Mahaffey Theater is to help reduce reliance on General Fund subsidy by maintaining/increasing <strong>operating</strong> revenues through<br />
public utilization <<strong>st</strong>rong>of</<strong>st</strong>rong> the building, which is partially measured by the number <<strong>st</strong>rong>of</<strong>st</strong>rong> events held and attendance.<br />
170
City <<strong>st</strong>rong>of</<strong>st</strong>rong> St. Petersburg, Florida - FY 2012 Proposed Fiscal Plan<br />
Objective and Performance Measure<br />
Unit Of<br />
FY 2009 FY 2010 FY 2011 FY2011 FY 2012<br />
Measure<br />
Actual Actual Target E<strong>st</strong>imate Proposed<br />
Mahaffey Performances # 263 246 275 248 275<br />
Mahaffey Total Attendance # 177,000 165,000 185,000 165,000 185,000<br />
Subsidy for Mahaffey Theater $ 934,000 934,000 774,000 733,000 670,000<br />
Marina Objectives Occupancy Rate and Transient Docks<br />
The objectives <<strong>st</strong>rong>of</<strong>st</strong>rong> the Municipal Marina are to achieve a 95% occupancy rate in filling all slips and achieve 450 visits to the Transient Dock.<br />
Marina Number <<strong>st</strong>rong>of</<strong>st</strong>rong> Transient Boats Docked # 479 403 450 444 450<br />
Marina Occupancy Rate % 94 92 94 91 93<br />
Pier<br />
The objective <<strong>st</strong>rong>of</<strong>st</strong>rong> the Pier is to balance the needs <<strong>st</strong>rong>of</<strong>st</strong>rong> the community, while enhancing the Pier's revenues and thus reducing subsidy subject to the<br />
limitations <<strong>st</strong>rong>of</<strong>st</strong>rong> the funds available in the Pier's Operating Budget<br />
Pier Number <<strong>st</strong>rong>of</<strong>st</strong>rong> Visitors (E<strong>st</strong>imated) # 952,000 780,740 1,000,000 750,000 700,000<br />
Pier Special Events # 289 250 200 138 54<br />
Subsidy for the Pier $ 1,509,000 1,427,000 1,246,000 1,246,000 1,399,000<br />
Port Objectives - Leases, Ship Days, and Visiting Ships<br />
The objective <<strong>st</strong>rong>of</<strong>st</strong>rong> the Port is to maintain or increase the number <<strong>st</strong>rong>of</<strong>st</strong>rong> leases, ship days, and visiting vessels per year.<br />
Port Leases # 1 1 2 1 1<br />
Port Number <<strong>st</strong>rong>of</<strong>st</strong>rong> Ship Days Per Year # 745 764 550 680 680<br />
Port Number <<strong>st</strong>rong>of</<strong>st</strong>rong> Visiting Ships # 41 42 30 32 35<br />
Subsidy for the Port $ 469,000 508,000 487,000 425,000 271,000<br />
Sunken Gardens<br />
The objective <<strong>st</strong>rong>of</<strong>st</strong>rong> Sunken Gardens is to help reduce reliance on General Fund subsidy by maintaining/increasing <strong>operating</strong> revenues through public<br />
utilization <<strong>st</strong>rong>of</<strong>st</strong>rong> the building, which can be measured by total revenue and attendance.<br />
Subsidy for Sunken Gardens $ 230,000 222,000 166,000 227,000 202,000<br />
Sunken Gardens Revenue $ 645,000 606,332 713,000 702,481 672,407<br />
Sunken Gardens Total Attendance # 52,585 47,733 66,000 50,000 52,000<br />
171
Department Mission Statement<br />
City <<strong>st</strong>rong>of</<strong>st</strong>rong> St. Petersburg, Florida - FY 2012 Proposed Fiscal Plan<br />
Marketing & Communications Department<br />
The mission <<strong>st</strong>rong>of</<strong>st</strong>rong> the Marketing & Communications Department is to provide citizens, businesses, and visitors <<strong>st</strong>rong>of</<strong>st</strong>rong> the City information to enhance their lives,<br />
opportunities, and experiences through the promotion <<strong>st</strong>rong>of</<strong>st</strong>rong> the City's services, diverse communities, and cultural events and organizations.<br />
Services Provided<br />
The Marketing & Communications Department provides the following services:<br />
• Communicates with media.<br />
• Disseminates news and press releases.<br />
• Coordinates press conferences and ceremonial events.<br />
• Coordinates and places City advertising.<br />
• Provides marketing services to support City departments, including the Mayor's Office.<br />
• Oversees content and design for the City web site, www.<strong>st</strong>pete.org.<br />
• Creates graphic design for print, web, and other purposes.<br />
• Coordinates City photography.<br />
• Broadca<strong>st</strong>s 24 hours a day via three cable channels (615 - Brighthouse, 15 - Knology, and 20 - Verizon FiOS) and a USF FCC-licensed broadca<strong>st</strong> channel<br />
(35). Also, webca<strong>st</strong>s via live <strong>st</strong>reaming on City's website.<br />
• Broadca<strong>st</strong>s gavel-to-gavel coverage <<strong>st</strong>rong>of</<strong>st</strong>rong> the City Council, City Council Committees, City Council Workshops, City Council Committees <<strong>st</strong>rong>of</<strong>st</strong>rong> the Whole and<br />
seven other City boards/commissions.<br />
• Produces/broadca<strong>st</strong>s informational feature programs, promotional spots, weekly and monthly television programs, and bulletin board information regarding<br />
City events and services.<br />
• Provides other services such as maintaining A/V equipment in Council Chamber and City Hall, providing video documentation <<strong>st</strong>rong>of</<strong>st</strong>rong> key City issues or events,<br />
creating an on-hold message for <<strong>st</strong>rong>city</<strong>st</strong>rong> phone services, etc.<br />
Recruits and supports the planning and promotion <<strong>st</strong>rong>of</<strong>st</strong>rong> events that generate an economic impact for the City and help enhance a positive national and international<br />
pr<<strong>st</strong>rong>of</<strong>st</strong>rong>ile <<strong>st</strong>rong>of</<strong>st</strong>rong> the City.<br />
• Promotes and produces St. Pete International Baseball including all advertising, media, game day activities, etc.<br />
• Collaborates with local organizations and Visit St. Pete/Clearwater to enhance tourism opportunities.<br />
• Provides outreach services at major City events and conferences/meetings.<br />
• Coordinates the City's <strong>st</strong>reet banner program.<br />
• Provides <strong>st</strong>affing for the International Relations Committee and maintains relationships with Si<strong>st</strong>er Cities <<strong>st</strong>rong>of</<strong>st</strong>rong> Takamatsu, Japan and St.Petersburg, Russia.<br />
• Oversees Community Cultural Plan through the Arts Advisory Committee.<br />
• Oversees the process for City grant funding to arts organizations through the Arts Advisory Committee.<br />
• Oversees the City's public art program through the Public Art Commission.<br />
• Acts as an advocate for and liaison with the City's museums and arts/cultural organizations.<br />
• Facilitates St. Petersburg Arts - a collaborative <<strong>st</strong>rong>of</<strong>st</strong>rong> the Executive Directors and Board Presidents <<strong>st</strong>rong>of</<strong>st</strong>rong> St. Petersburg's cultural in<strong>st</strong>itutions and arts organizations.<br />
Budgetary Co<strong>st</strong> Summary<br />
FY 2009<br />
Actual<br />
FY 2010<br />
Actual<br />
FY 2011<br />
Adopted<br />
FY 2011<br />
Amended<br />
FY 2011<br />
E<strong>st</strong>imated<br />
FY 2012<br />
Proposed<br />
FY 2012<br />
Change<br />
Wages And Benefits 1,345,796 1,314,667 1,287,085 1,287,085 1,288,964 1,342,849 4.33%<br />
Services And Commodities 784,662 641,343 494,817 548,835 560,154 431,296 (12.84%)<br />
Capital 1,611 11,268 0 40,015 40,015 43,000 0.00%<br />
Grants And Aid 215,062 262,505 282,000 282,000 282,000 282,000 0.00%<br />
Total Budget 2,347,131 2,229,783 2,063,902 2,157,935 2,171,133 2,099,145 1.71%<br />
Appropriations By Fund/Program<br />
FY 2009<br />
Actual<br />
FY 2010<br />
Actual<br />
FY 2011<br />
Adopted<br />
FY 2011<br />
Amended<br />
FY 2011<br />
E<strong>st</strong>imated<br />
FY 2012<br />
Proposed<br />
FY 2012<br />
Change<br />
General Operating Fund<br />
Arts & International Relations Program 388,555 114,875 125,363 126,158 123,977 116,370 (7.17%)<br />
Marketing & Communications Program 1,249,684 1,417,047 1,115,082 1,168,305 1,212,117 1,153,219 3.42%<br />
Non-Departmental/Arts/Social Services 0 0 282,000 282,000 282,000 282,000 0.00%<br />
Television Program 708,892 697,861 541,457 541,457 513,024 510,556 (5.71%)<br />
Totals for General Operating Fund 2,347,131 2,229,783 2,063,902 2,117,920 2,131,118 2,062,145 (0.09%)<br />
Technology & Infra<strong>st</strong>ructure Fund<br />
Non-Department Program 0 0 0 40,015 40,015 37,000 0.00%<br />
172
Appropriations By Fund/Program<br />
City <<strong>st</strong>rong>of</<strong>st</strong>rong> St. Petersburg, Florida - FY 2012 Proposed Fiscal Plan<br />
FY 2009<br />
Actual<br />
FY 2010<br />
Actual<br />
FY 2011<br />
Adopted<br />
FY 2011<br />
Amended<br />
FY 2011<br />
E<strong>st</strong>imated<br />
FY 2012<br />
Proposed<br />
FY 2012<br />
Change<br />
Total Budget 2,347,131 2,229,783 2,063,902 2,157,935 2,171,133 2,099,145 1.71%<br />
Revenue Sources<br />
FY 2009<br />
Actual<br />
FY 2010<br />
Actual<br />
FY 2011<br />
Adopted<br />
FY 2011<br />
Amended<br />
FY 2011<br />
E<strong>st</strong>imated<br />
FY 2012<br />
Proposed<br />
FY 2012<br />
Change<br />
Other Charges For Services 25,865 16,494 20,000 20,000 17,245 20,000 0.00%<br />
Contributions And Donations 5,000 6,065 5,000 5,000 5,000 5,000 0.00%<br />
Misc Revenue 924 829 450 450 179 450 0.00%<br />
General & Admini<strong>st</strong>rative 895,440 918,804 946,368 946,368 946,368 946,368 0.00%<br />
Transfer From Parking Revenue 14,900 15,000 22,896 22,896 22,896 22,896 0.00%<br />
General Fund 1,405,002 1,272,591 1,069,188 1,123,206 1,139,430 1,067,431 (0.16%)<br />
Technology & Infra<strong>st</strong>ructure<br />
Fund<br />
0 0 0 40,015 40,015 37,000 0.00%<br />
Total Revenue 2,347,131 2,229,783 2,063,902 2,157,935 2,171,133 2,099,145 1.71%<br />
Position Summary<br />
FY 2009<br />
Actual<br />
FY 2010<br />
Actual<br />
FY 2011<br />
Adopted<br />
FY 2012<br />
Proposed<br />
FY 2012<br />
Change<br />
Marketing & Communications Program 11.00 11.00 11.00 12.00 9.09%<br />
Television Program 4.00 4.00 4.00 4.00 0.00%<br />
Arts & International Relations Program 1.00 1.00 1.00 1.00 0.00%<br />
Total Full-Time FTE 16.00 16.00 16.00 17.00 6.25%<br />
Marketing & Communications Program 0.50 0.50 0.50 0.00 (100.00%)<br />
Television Program 2.20 1.50 1.00 1.20 20.42%<br />
Total Part-Time FTE 2.70 2.00 1.50 1.20 (19.72%)<br />
Total FTE 18.70 18.00 17.50 18.20 4.02%<br />
- In FY12, the department's General Fund <strong>budget</strong> will decrease by 0.09%. Changes to the <strong>budget</strong> include adding $93,296 for a full-time Event<br />
Recruit & Mgmt Manager position, changing the Marketing & Communications Assi<strong>st</strong>ant Director position to Creative Services Manager<br />
($5,222), eliminating a part-time Account Clerk II ($15,459), reducing the hours for a Video Production Speciali<strong>st</strong> ($10,405) and decreasing<br />
services and commodities (Other Special Services, Printing and Binding, Po<strong>st</strong>age/Special Delivery, and Photography Supplies).<br />
- The FY12 amount for Non-Departmental co<strong>st</strong>s is $282,000, which includes $25,000 for Fir<strong>st</strong> Night, $175,000 for Arts Grants, $35,000 for the<br />
Fe<strong>st</strong>ival <<strong>st</strong>rong>of</<strong>st</strong>rong> States, $35,000 for MLK Fe<strong>st</strong>ival <<strong>st</strong>rong>of</<strong>st</strong>rong> Bands, and $12,000 for the Museum <<strong>st</strong>rong>of</<strong>st</strong>rong> Hi<strong>st</strong>ory.<br />
- In FY12, the department is suspending the transfer to the Technology and Infra<strong>st</strong>ructure Fund (5019) for special equipment replacement<br />
($128,270) for a second year.<br />
- $43,000 in <strong>capital</strong> outlay is reque<strong>st</strong>ed in FY12, which includes $37,000 from the Technology and Infra<strong>st</strong>ructure Fund and $6,000 from the<br />
General Fund for replacement <<strong>st</strong>rong>of</<strong>st</strong>rong> television equipment.<br />
- Part-time FTE calculations were adju<strong>st</strong>ed to reflect actual hours worked.<br />
The Marketing and Communications Department's fir<strong>st</strong> performance measure addresses the Mayor's goal <<strong>st</strong>rong>of</<strong>st</strong>rong> Sports, Arts & Culture, while the<br />
second performance measure is linked to the Mayor's goal <<strong>st</strong>rong>of</<strong>st</strong>rong> Service.<br />
173
Objective and Performance Measure<br />
City <<strong>st</strong>rong>of</<strong>st</strong>rong> St. Petersburg, Florida - FY 2012 Proposed Fiscal Plan<br />
Unit Of<br />
Measure<br />
FY 2009<br />
Actual<br />
FY 2010<br />
Actual<br />
FY 2011<br />
Target<br />
FY2011<br />
E<strong>st</strong>imate<br />
FY 2012<br />
Proposed<br />
Admini<strong>st</strong>ration Objectives<br />
The objective <<strong>st</strong>rong>of</<strong>st</strong>rong> the Marketing & Communications Admini<strong>st</strong>ration Division is to increase the number <<strong>st</strong>rong>of</<strong>st</strong>rong> page views on the City's website through<br />
various methods <<strong>st</strong>rong>of</<strong>st</strong>rong> promotion and to retain, attract, and promote events in the City to increase attendance.<br />
Event Marketing: Downtown Event Attendance # 5,997,343 5,604,489 5,600,000 5,500,000 5,600,000<br />
Event Marketing: Number <<strong>st</strong>rong>of</<strong>st</strong>rong> Events Downtown # 1,778 1,897 1,800 1,810 1,815<br />
Web Site # Page Views # 64,957 53,771 53,000 53,000 53,000<br />
Web Site Pages Viewed Per Visit (Average) # 4.47 3.35 3.00 3.00 3.00<br />
Television Objective<br />
The objective <<strong>st</strong>rong>of</<strong>st</strong>rong> the Television Division is to increase the hours <<strong>st</strong>rong>of</<strong>st</strong>rong> original programming through the development <<strong>st</strong>rong>of</<strong>st</strong>rong> new programs, public service<br />
announcements, press conferences, and other events.<br />
WSPF-TV: Hours <<strong>st</strong>rong>of</<strong>st</strong>rong> Original Programs Produced # 328 420.50 415 420 425<br />
174
Department Mission Statement<br />
City <<strong>st</strong>rong>of</<strong>st</strong>rong> St. Petersburg, Florida - FY 2012 Proposed Fiscal Plan<br />
Planning & Economic Development Department<br />
The mission <<strong>st</strong>rong>of</<strong>st</strong>rong> the Planning & Economic Development Department is to broaden the City's economic base and encourage economic expansion in St. Petersburg<br />
and to implement City regulations, development goals, and State regulations through planning and permitting services.<br />
Services Provided<br />
Planning provides the following services:<br />
• Prepare, maintain, and amend as needed the City's Comprehensive Plan as required by Florida Statutes Chapter 163 including the Evaluation & Appraisal<br />
report and subsequent Comprehensive Plan text amendments.<br />
• Prepare and maintain City's records <<strong>st</strong>rong>of</<strong>st</strong>rong> zoning and land use for every parcel.<br />
• Process private applications for amendments to the Comprehensive Plan map and text.<br />
• Participate with review agencies including regional planning council and <strong>st</strong>ate planning agency.<br />
• Prepare, implement, and amend the City's Land Development Regulations as required by Florida Statutes Chapter 163 including: zoning; hi<strong>st</strong>oric<br />
preservation; neighborhood design review; landscaping, tree preservation, and environmental preservation; airport zoning; non-<strong>st</strong>ructural uses: pushcarts, sidewalk<br />
sales, temporary uses, roadside vending, and special approval uses ( i.e. adult use and alcoholic beverage).<br />
• Meet with property owners, developers, and design pr<<strong>st</strong>rong>of</<strong>st</strong>rong>essionals to identify which land development regulations apply to their property, review their<br />
development goals, and identify the process to achieve their goals.<br />
• Review applications for con<strong>st</strong>ruction, which includes providing plan review for zoning, engineering, fire and building, plumbing, electrical, and mechanical<br />
by licensed plan examiners, issuing con<strong>st</strong>ruction permits, providing inspections by licensed inspection <strong>st</strong>aff, and maintaining records <<strong>st</strong>rong>of</<strong>st</strong>rong> all the above.<br />
• Maintain the City's participation in the Federal Emergency Management Agency's Flood Insurance program including code enforcement, con<strong>st</strong>ruction plan<br />
review and inspection, and annual reporting.<br />
Economic Development provides the following services:<br />
• Business retention and recruitment, including lead response, marketing, and incentive programs.<br />
• Community Redevelopment Area (CRA) Program, including admini<strong>st</strong>ration <<strong>st</strong>rong>of</<strong>st</strong>rong> all seven <<strong>st</strong>rong>of</<strong>st</strong>rong> the City's exi<strong>st</strong>ing CRA areas.<br />
• Annexation <<strong>st</strong>rong>of</<strong>st</strong>rong> unincorporated lands, including identifying and pursuing viable annexation candidates.<br />
• Development <<strong>st</strong>rong>of</<strong>st</strong>rong> Regional Impact Program, including admini<strong>st</strong>ration <<strong>st</strong>rong>of</<strong>st</strong>rong> the City's two City-sponsored areawide Development <<strong>st</strong>rong>of</<strong>st</strong>rong> Regional Impact (DRI) for<br />
the downtown and gateway areas.<br />
• Demographic research for internal and external purposes and cu<strong>st</strong>omers.<br />
• Policy guidance to City admini<strong>st</strong>ration for Midtown and the greater Childs Park area.<br />
• Community development services/facilitation.<br />
• Assi<strong>st</strong>ance in the creation, retention, and expansion <<strong>st</strong>rong>of</<strong>st</strong>rong> business in Midtown, the greater Childs Park area, and <<strong>st</strong>rong>city</<strong>st</strong>rong>wide.<br />
Budgetary Co<strong>st</strong> Summary<br />
FY 2009<br />
Actual<br />
FY 2010<br />
Actual<br />
FY 2011<br />
Adopted<br />
FY 2011<br />
Amended<br />
FY 2011<br />
E<strong>st</strong>imated<br />
FY 2012<br />
Proposed<br />
FY 2012<br />
Change<br />
Wages And Benefits 6,574,591 6,175,051 5,743,202 5,743,202 5,714,884 5,573,516 (2.95%)<br />
Services And Commodities 1,920,029 1,390,867 1,315,672 1,339,658 1,353,300 1,222,113 (7.11%)<br />
Capital 31,086 80,923 0 45,499 35,546 0 0.00%<br />
Grants And Aid 128,563 55,545 139,313 190,660 85,906 76,000 (45.45%)<br />
Total Budget 8,654,269 7,702,387 7,198,187 7,319,019 7,189,636 6,871,629 (4.54%)<br />
Appropriations By Fund/Program<br />
FY 2009<br />
Actual<br />
FY 2010<br />
Actual<br />
FY 2011<br />
Adopted<br />
FY 2011<br />
Amended<br />
FY 2011<br />
E<strong>st</strong>imated<br />
FY 2012<br />
Proposed<br />
FY 2012<br />
Change<br />
General Operating Fund<br />
Business Assi<strong>st</strong>ance Program<br />
Community Enrichment Admin Program<br />
655,833<br />
331,158<br />
629,478<br />
333,279<br />
645,001<br />
313,430<br />
696,348<br />
313,430<br />
900,948<br />
222,265<br />
880,526<br />
0<br />
36.52%<br />
(100.00%)<br />
Con<strong>st</strong>ruction Services & Permitting<br />
2,891 33,795 676,007 676,132 713,978 945,743 39.90%<br />
Program<br />
Development Review Services Program 798,937 810,139 775,906 775,906 762,533 712,178 (8.21%)<br />
Midtown Economic Development Program 120,626 159,940 106,807 106,807 38,697 0 (100.00%)<br />
Non-Department Program 0 4,256 0 0 1,455 0 0.00%<br />
Non-Departmental/Arts/Social Services 0 42,728 76,000 76,000 76,000 76,000 0.00%<br />
Permitting & Codes Admini<strong>st</strong>ration<br />
Program<br />
724,811 678,267 0 5,088 0 0 0.00%<br />
Planning and Economic Development<br />
Program<br />
1,073,406 1,013,526 969,947 1,023,797 1,045,385 771,578 (20.45%)<br />
175
Appropriations By Fund/Program<br />
City <<strong>st</strong>rong>of</<strong>st</strong>rong> St. Petersburg, Florida - FY 2012 Proposed Fiscal Plan<br />
FY 2009<br />
Actual<br />
FY 2010<br />
Actual<br />
FY 2011<br />
Adopted<br />
FY 2011<br />
Amended<br />
FY 2011<br />
E<strong>st</strong>imated<br />
FY 2012<br />
Proposed<br />
FY 2012<br />
Change<br />
Urban Design & Hi<strong>st</strong>oric Preservation<br />
360,660 348,205 0 0 0 0 0.00%<br />
Program<br />
Weed & Seed Program 310,962 274,934 184,107 193,691 6,983 0 (100.00%)<br />
Totals for General Operating Fund 4,379,284 4,328,545 3,747,205 3,867,198 3,768,244 3,386,025 (9.64%)<br />
Neighborhood Stabilization Program<br />
Housing Tru<strong>st</strong> Funds Program 9,065 4,613 0 0 0 0 0.00%<br />
Building Permit Special Revenue<br />
Con<strong>st</strong>ruction Services & Permitting<br />
Program<br />
4,265,920 3,369,229 3,450,982 3,451,821 3,421,392 3,485,604 1.00%<br />
Total Budget 8,654,269 7,702,387 7,198,187 7,319,019 7,189,636 6,871,629 (4.54%)<br />
Revenue Sources<br />
FY 2009<br />
Actual<br />
FY 2010<br />
Actual<br />
FY 2011<br />
Adopted<br />
FY 2011<br />
Amended<br />
FY 2011<br />
E<strong>st</strong>imated<br />
FY 2012<br />
Proposed<br />
FY 2012<br />
Change<br />
Contractors Permits 2,689,693 2,791,180 2,631,000 2,631,000 3,033,259 2,631,000 0.00%<br />
Other License And Permits 14,384 14,939 11,100 11,100 4,065 78,100 603.60%<br />
Federal Grants 187,654 145,673 142,000 142,000 11,241 0 (100.00%)<br />
General Government 524,411 533,974 525,072 525,072 196,301 525,072 0.00%<br />
Transportation Charges 0 (205) 0 0 0 0 0.00%<br />
Special Assessment (720) 0 0 0 0 0 0.00%<br />
Sale Of Fixed Assets 2,377 0 0 0 0 0 0.00%<br />
Contributions And Donations 0 1,000 0 0 0 0 0.00%<br />
Misc Revenue 1,607 (650) 0 0 (73) 143,448 0.00%<br />
General & Admini<strong>st</strong>rative 210,312 139,272 143,448 143,448 143,448 0 (100.00%)<br />
General Fund 3,865,745 3,923,900 3,345,585 3,465,578 3,585,757 3,059,405 (8.55%)<br />
Building Permit Special Revenue 1,151,250 159,547 399,982 400,821 220,887 434,604 8.66%<br />
Sanitation Operating (1,510) (10,856) 0 0 (5,249) 0 0.00%<br />
Neighborhood Stabilization<br />
Program<br />
9,065 4,613 0 0 0 0 0.00%<br />
Total Revenue 8,654,269 7,702,387 7,198,187 7,319,019 7,189,636 6,871,629 (4.54%)<br />
Position Summary<br />
FY 2009<br />
Actual<br />
FY 2010<br />
Actual<br />
FY 2011<br />
Adopted<br />
FY 2012<br />
Proposed<br />
FY 2012<br />
Change<br />
Development Review Services Program 9.00 9.00 9.00 8.00 (11.11%)<br />
Con<strong>st</strong>ruction Services & Permitting Program 48.00 43.00 42.00 45.00 7.14%<br />
Community Enrichment Admin Program 2.00 2.00 2.00 0.00 (100.00%)<br />
Weed & Seed Program 2.00 2.00 2.00 0.00 (100.00%)<br />
Business Assi<strong>st</strong>ance Program 6.00 6.00 6.00 8.00 33.33%<br />
Midtown Economic Development Program 1.00 1.00 1.00 0.00 (100.00%)<br />
Planning and Economic Development Program 8.00 8.00 8.00 6.00 (25.00%)<br />
Total Full-Time FTE 76.00 71.00 70.00 67.00 (4.29%)<br />
Total FTE 76.00 71.00 70.00 67.00 (4.29%)<br />
- The Con<strong>st</strong>ruction Services and Permitting Program was transferred out <<strong>st</strong>rong>of</<strong>st</strong>rong> the General Fund into a new Building Permit Special Revenue Fund<br />
in FY08. This move was in response to State Statute 553.80 that requires revenue and expenses for the enforcement <<strong>st</strong>rong>of</<strong>st</strong>rong> the Florida building code<br />
be in a separate fund.<br />
- The department's General Fund <strong>budget</strong> will decrease by 9.64% in FY12. The majority <<strong>st</strong>rong>of</<strong>st</strong>rong> this decrease is due to the Community Enrichment<br />
176
City <<strong>st</strong>rong>of</<strong>st</strong>rong> St. Petersburg, Florida - FY 2012 Proposed Fiscal Plan<br />
Department being reorganized and consolidated with the Planning & Economic Development Department in FY11. The reorganization resulted<br />
in a net savings totaling ($226,819) for the Community Enrichment portion <<strong>st</strong>rong>of</<strong>st</strong>rong> the new combined department <strong>budget</strong>. This reorganization<br />
includes, eliminating a full-time Senior Admini<strong>st</strong>rator position ($188,780), eliminating a full-time Special Projects Manager position ($63,677),<br />
and line item reductions ($116,362) related to the loss <<strong>st</strong>rong>of</<strong>st</strong>rong> the Weed & Seed grant revenue ($142,000).<br />
- Also in FY12, a full-time vacant Economic Development Analy<strong>st</strong> position ($60,480), a color copier ($2,640), and a commission will be<br />
eliminated. There will be an increase in various revenues ($5,000) and 10% <<strong>st</strong>rong>of</<strong>st</strong>rong> the department Director's salaries and benefits ($13,805) will be<br />
moved to the Building Permits Special Revenue Fund (BPSRF).<br />
- In FY12, Budgeted Salary Savings will be shown in the Budget Department's <strong>budget</strong> in<strong>st</strong>ead <<strong>st</strong>rong>of</<strong>st</strong>rong> the individual departments' <strong>budget</strong>s. For this<br />
reason, the department's Building Permit Special Revenue Fund <strong>budget</strong> will increase by 1.0%.<br />
The department's fir<strong>st</strong> five performance measures address the Mayor's goals <<strong>st</strong>rong>of</<strong>st</strong>rong> Small Business and Su<strong>st</strong>ainability. The fir<strong>st</strong>, fifth, and sixth<br />
performance measures address the Mayor's goal <<strong>st</strong>rong>of</<strong>st</strong>rong> Seamlessness. The sixth and eighth performance measures address the Mayor's goal <<strong>st</strong>rong>of</<strong>st</strong>rong><br />
Safety. The seventh performance measure addresses the Mayor's goals <<strong>st</strong>rong>of</<strong>st</strong>rong> Service and Su<strong>st</strong>ainability.<br />
Objective and Performance Measure<br />
Unit Of<br />
Measure<br />
FY 2009<br />
Actual<br />
FY 2010<br />
Actual<br />
FY 2011<br />
Target<br />
FY2011<br />
E<strong>st</strong>imate<br />
FY 2012<br />
Proposed<br />
Business Creation, Retention, and Expansion, # <<strong>st</strong>rong>of</<strong>st</strong>rong> SBE's Cert<br />
Continue to work on the following: Community Development issues, business development, assi<strong>st</strong>ance, retention, and expansion to further the<br />
Mayor's charge to promote economic opportunities in a seamless St. Petersburg.<br />
Contracts Awarded to Small Business Enterprises (SBEs) $ 11,674,000 10,139,000 6,000,000 8,000,000 8,000,000<br />
Number <<strong>st</strong>rong>of</<strong>st</strong>rong> Clients Counseled (Total) # 924 863 800 850 850<br />
Number <<strong>st</strong>rong>of</<strong>st</strong>rong> Corridor Business Counseling Sessions # 1,886 2,075 1,300 2,000 2,050<br />
Number <<strong>st</strong>rong>of</<strong>st</strong>rong> Corridor Businesses Counseled # 398 433 350 395 415<br />
Number <<strong>st</strong>rong>of</<strong>st</strong>rong> Small Business Enterprises (SBEs) Certified # 320 419 420 510 610<br />
(cumulative)<br />
Number <<strong>st</strong>rong>of</<strong>st</strong>rong> Workshop Attendances # 1,581 1,577 1,600 1,600 1,600<br />
Number <<strong>st</strong>rong>of</<strong>st</strong>rong> Workshop Attendees # 1,156 1,232 900 1,200 1,250<br />
Number <<strong>st</strong>rong>of</<strong>st</strong>rong> Workshop Titles # 31 38 28 35 35<br />
Number <<strong>st</strong>rong>of</<strong>st</strong>rong> Workshops Held # 144 170 144 160 160<br />
Total Number <<strong>st</strong>rong>of</<strong>st</strong>rong> Client Counseling Sessions # 2,850 2,838 1,900 2,300 2,300<br />
Increase Number <<strong>st</strong>rong>of</<strong>st</strong>rong> Businesses<br />
Promoting economic opportunity.<br />
Business Tax Receipts # 15,768 15,498 16,000 15,980 16,000<br />
Maximize Employment in the St. Petersburg Gateway Area<br />
Fill all available <<strong>st</strong>rong>of</<strong>st</strong>rong>fice space in the St. Petersburg Gateway and mid-Pinellas area with employment generating businesses.<br />
Exi<strong>st</strong>ing & Available Office Space St. Petersburg Gateway % 15.10 14.60 14.00 14.00 13.00<br />
Maximize Indu<strong>st</strong>rial Employment in the Gateway Area<br />
Promote economic opportunity by filling all available indu<strong>st</strong>rial space with employment generating businesses.<br />
Exi<strong>st</strong>ing & Available Indu<strong>st</strong>rial Space St. Petersburg<br />
Gateway<br />
% 10.80 12.10 10.00 11.00 10.00<br />
Maximize Retail Activity in St. Petersburg<br />
Fill all available retail space with employment generating uses that provide a full range <<strong>st</strong>rong>of</<strong>st</strong>rong> goods and services to the citizens and visitors <<strong>st</strong>rong>of</<strong>st</strong>rong> St.<br />
Petersburg.<br />
177
City <<strong>st</strong>rong>of</<strong>st</strong>rong> St. Petersburg, Florida - FY 2012 Proposed Fiscal Plan<br />
Objective and Performance Measure<br />
Unit Of<br />
FY 2009 FY 2010 FY 2011 FY2011 FY 2012<br />
Measure<br />
Actual Actual Target E<strong>st</strong>imate Proposed<br />
Exi<strong>st</strong>ing & Available Retail Space Citywide % 8.00 8.70 9.00 8.00 7.00<br />
Regulation <<strong>st</strong>rong>of</<strong>st</strong>rong> con<strong>st</strong>ruction activity<br />
Regulate and admini<strong>st</strong>er land use and development, and ensure public safety through the regulation <<strong>st</strong>rong>of</<strong>st</strong>rong> con<strong>st</strong>ruction activity by issuing permits.<br />
Con<strong>st</strong>ruction Value Permitted $ 248,016,348 195,328,617 200,000,000 200,000,000 200,000,000<br />
Dollars Generated from Permits and Fees $ 3,115,479 3,191,479 3,000,000 3,000,000 3,000,000<br />
Total Permits Issued # 14,000 15,894 14,000 15,050 15,000<br />
Taxable Value Per Capita<br />
Increase the taxable value <<strong>st</strong>rong>of</<strong>st</strong>rong> the City so that necessary government services and desired amenities can be provided to the citizens at the lowe<strong>st</strong><br />
possible millage rate.<br />
Taxable Value Per Capita $ 58,000 59,416 60,300 60,000 60,000<br />
Weed & Seed<br />
To provide a program for the community that will weed out drugs, gang violence, violent crimes and seed by re<strong>st</strong>oring neighborhoods through<br />
educational, recreational, social, and economic development.<br />
Mental Health Forum/Training Attendees #<br />
Safe Haven Services: Sew What (sewing), Youth<br />
#<br />
105<br />
82<br />
132<br />
108<br />
150<br />
175<br />
150<br />
250<br />
150<br />
250<br />
Leadership Academy, DEFY (Drug Education for Youth)<br />
and MEIC (Toa<strong>st</strong> Ma<strong>st</strong>ers)<br />
178
City <<strong>st</strong>rong>of</<strong>st</strong>rong> St. Petersburg, Florida - FY 2012 Proposed Fiscal Plan<br />
Department Mission Statement<br />
Real E<strong>st</strong>ate & Property Management Department<br />
The mission <<strong>st</strong>rong>of</<strong>st</strong>rong> the Real E<strong>st</strong>ate & Property Management Department is to provide technical and pr<<strong>st</strong>rong>of</<strong>st</strong>rong>essional expertise in the negotiation <<strong>st</strong>rong>of</<strong>st</strong>rong> acquisitions for the<br />
City <<strong>st</strong>rong>of</<strong>st</strong>rong> St. Petersburg's <strong>capital</strong> and neighborhood improvement projects, dispositions <<strong>st</strong>rong>of</<strong>st</strong>rong> surplus real e<strong>st</strong>ate, and leasing <<strong>st</strong>rong>of</<strong>st</strong>rong> various City-owned properties while<br />
managing each in a manner to maximize contributions to the economic and revenue base for the City, in addition to overseeing the design, con<strong>st</strong>ruction,<br />
renovation, and maintenance <<strong>st</strong>rong>of</<strong>st</strong>rong> the City`s municipal <<strong>st</strong>rong>of</<strong>st</strong>rong>fice buildings [City Hall, City Hall Annex, Municipal Services Center (MSC), and MSC Garage].<br />
Services Provided<br />
The Real E<strong>st</strong>ate & Property Management Department provides the following real e<strong>st</strong>ate services:<br />
• Prepares contracts, monitors and directs the appraisal, acquisition, and disposition <<strong>st</strong>rong>of</<strong>st</strong>rong> real e<strong>st</strong>ate, including but not limited to the negotiation, contract, and<br />
closing <<strong>st</strong>rong>of</<strong>st</strong>rong> real e<strong>st</strong>ate transactions for various City departments in accordance with City policy.<br />
• Prepares contracts, monitors and manages the appraisal, acquisition, and disposition <<strong>st</strong>rong>of</<strong>st</strong>rong> City-owned real e<strong>st</strong>ates under Florida Statute 163.<br />
• Initiates, monitors, and directs payments for real e<strong>st</strong>ate related services, including but not limited to appraisals, real e<strong>st</strong>ate closings, demolitions, and<br />
environmental inspections.<br />
• Prepares leases, monitors and manages commercial and non-pr<<strong>st</strong>rong>of</<strong>st</strong>rong>it leases for City-owned properties, including but not limited to tenant contact, rent<br />
collection, and lease enforcement.<br />
• Provides real e<strong>st</strong>ate support and information services for all City departments including but not limited to valuation information, property maps, ownership<br />
information, <<strong>st</strong>rong>of</<strong>st</strong>rong>ficial records, including appraisals, deeds, mortgages, title and environmental reports, and survey and legal descriptions.<br />
The Municipal Office Buildings Fund provides the followings services:<br />
• Provides admini<strong>st</strong>rative direction to ensure proper management and maintenance <<strong>st</strong>rong>of</<strong>st</strong>rong> municipal <<strong>st</strong>rong>of</<strong>st</strong>rong>fice buildings including City Hall, City Hall Annex, MSC,<br />
and MSC Garage.<br />
Budgetary Co<strong>st</strong> Summary<br />
FY 2009<br />
Actual<br />
FY 2010<br />
Actual<br />
FY 2011<br />
Adopted<br />
FY 2011<br />
Amended<br />
FY 2011<br />
E<strong>st</strong>imated<br />
FY 2012<br />
Proposed<br />
FY 2012<br />
Change<br />
Wages And Benefits 1,275,877 1,309,509 1,225,269 1,225,269 1,201,630 1,203,858 (1.75%)<br />
Services And Commodities 1,612,288 1,591,952 1,632,090 1,654,071 1,526,130 1,573,599 (3.58%)<br />
Capital 69,564 72,698 0 21,800 9,295 0 0.00%<br />
Transfers Out 0 0 0 0 275,000 0 0.00%<br />
Total Budget 2,957,729 2,974,159 2,857,359 2,901,140 3,012,055 2,777,457 (2.80%)<br />
Appropriations By Fund/Program<br />
FY 2009<br />
Actual<br />
FY 2010<br />
Actual<br />
FY 2011<br />
Adopted<br />
FY 2011<br />
Amended<br />
FY 2011<br />
E<strong>st</strong>imated<br />
FY 2012<br />
Proposed<br />
FY 2012<br />
Change<br />
General Operating Fund<br />
Real E<strong>st</strong>ate & Property Mgmt Admin<br />
Program<br />
819,771 742,708 774,869 786,180 739,071 727,148 (6.16%)<br />
American Recovery & Reinve<strong>st</strong>ment Act<br />
Non-Department Program 0 300 0 0 0 0 0.00%<br />
Neighborhood Stabilization Program<br />
Housing Tru<strong>st</strong> Funds Program 42,431 66,800 0 0 0 0 0.00%<br />
Municipal Office Buildings<br />
Municipal Office Buildings Program<br />
Non-Department Program<br />
2,095,527<br />
0<br />
2,164,352<br />
0<br />
2,082,490<br />
0<br />
2,114,960<br />
0<br />
2,272,902<br />
82<br />
2,050,309<br />
0<br />
(1.55%)<br />
0.00%<br />
Totals for Municipal Office Buildings 2,095,527 2,164,352 2,082,490 2,114,960 2,272,984 2,050,309 (1.55%)<br />
Total Budget 2,957,729 2,974,159 2,857,359 2,901,140 3,012,055 2,777,457 (2.80%)<br />
179
City <<strong>st</strong>rong>of</<strong>st</strong>rong> St. Petersburg, Florida - FY 2012 Proposed Fiscal Plan<br />
Revenue Sources<br />
FY 2009<br />
Actual<br />
FY 2010<br />
Actual<br />
FY 2011<br />
Adopted<br />
FY 2011<br />
Amended<br />
FY 2011<br />
E<strong>st</strong>imated<br />
FY 2012<br />
Proposed<br />
FY 2012<br />
Change<br />
General Government 0 0 1,020 1,020 0 1,020 0.00%<br />
Other Charges For Services 530 2,391 0 0 168 0 0.00%<br />
Intere<strong>st</strong> Earnings 101,913 76,510 106,494 106,494 88,786 42,300 (60.28%)<br />
Rents And Royalties 2,995,045 2,895,631 2,999,395 2,999,395 2,935,346 3,005,395 0.20%<br />
Sale Of Fixed Assets 434 30,200 0 0 0 0 0.00%<br />
Misc Revenue 1,368 9 0 0 500 0 0.00%<br />
Municipal Office Buildings (620,540) (501,891) (623,510) (591,040) (433,026) (643,488) 3.20%<br />
General Fund 436,548 404,209 373,960 385,271 420,281 372,230 (0.46%)<br />
Neighborhood Stabilization<br />
Program<br />
42,431 66,800 0 0 0 0 0.00%<br />
American Recovery & Reinve<strong>st</strong>ment<br />
Act<br />
0 300 0 0 0 0 0.00%<br />
Total Revenue 2,957,729 2,974,159 2,857,359 2,901,140 3,012,055 2,777,457 (2.80%)<br />
Position Summary<br />
FY 2009<br />
Actual<br />
FY 2010<br />
Actual<br />
FY 2011<br />
Adopted<br />
FY 2012<br />
Proposed<br />
FY 2012<br />
Change<br />
Real E<strong>st</strong>ate & Property Mgmt Admin Program 7.00 7.00 7.00 6.00 (14.29%)<br />
Municipal Office Buildings Program 6.00 6.00 6.00 6.00 0.00%<br />
Total Full-Time FTE 13.00 13.00 13.00 12.00 (7.69%)<br />
Municipal Office Buildings Program 6.00 7.00 7.00 7.00 0.00%<br />
Total Part-Time FTE 6.00 7.00 7.00 7.00 0.00%<br />
Total FTE 19.00 20.00 20.00 19.00 (5.00%)<br />
- In FY12, the department's General Fund <strong>budget</strong> will decrease by 6.16%, mainly due to the elimination <<strong>st</strong>rong>of</<strong>st</strong>rong> a full-time Admini<strong>st</strong>rative Services<br />
Officer position ($86,737).<br />
- Also in FY12, there will be a 1.55% reduction in the department's Municipal Office Buildings Fund <strong>budget</strong> mainly due to a reduction in<br />
Electric ($15,000).<br />
The Real E<strong>st</strong>ate & Property Management Department's performance measure addresses the Mayor's goal <<strong>st</strong>rong>of</<strong>st</strong>rong> Su<strong>st</strong>ainability.<br />
Objective and Performance Measure<br />
Unit Of<br />
Measure<br />
FY 2009<br />
Actual<br />
FY 2010<br />
Actual<br />
FY 2011<br />
Target<br />
FY2011<br />
E<strong>st</strong>imate<br />
FY 2012<br />
Proposed<br />
Property Management<br />
To manage City-owned property so that the value to the City is maximized.<br />
Leases Monitored # 123 138 130 142 150<br />
Properties Acquired or Disposed # 25 80 70 47 25<br />
Properties Inventoried # 1,235 1,208 1,260 1,209 1,190<br />
180
Department Mission Statement<br />
City <<strong>st</strong>rong>of</<strong>st</strong>rong> St. Petersburg, Florida - FY 2012 Proposed Fiscal Plan<br />
Transportation & Parking Management Department<br />
The mission <<strong>st</strong>rong>of</<strong>st</strong>rong> the Transportation & Parking Management Department is to provide superior transportation services to the citizens <<strong>st</strong>rong>of</<strong>st</strong>rong> St. Petersburg that maintain<br />
consi<strong>st</strong>ency with the City's Comprehensive Plan and support neighborhood cohesiveness, enhanced public safety, economic development, and improved quality <<strong>st</strong>rong>of</<strong>st</strong>rong><br />
life as outlined in the City's Vision 20/20 Program.<br />
Services Provided<br />
The Transportation & Parking Management Department provides the following services:<br />
• Provides well maintained roadways with proper lighting, safe and accessible sidewalks and crossings for pede<strong>st</strong>rians, bicycle lanes, neighborhood traffic<br />
management programs, and efficient intersections.<br />
• Provides management and planning for downtown parking facilities.<br />
Budgetary Co<strong>st</strong> Summary<br />
FY 2009<br />
Actual<br />
FY 2010<br />
Actual<br />
FY 2011<br />
Adopted<br />
FY 2011<br />
Amended<br />
FY 2011<br />
E<strong>st</strong>imated<br />
FY 2012<br />
Proposed<br />
FY 2012<br />
Change<br />
Wages And Benefits 354,074 1,074,097 1,501,420 1,501,420 1,420,559 1,436,910 (4.30%)<br />
Services And Commodities 3,003,788 1,957,944 1,897,865 1,984,736 2,170,729 2,027,732 6.84%<br />
Grants And Aid 20,000 20,000 20,000 20,000 20,000 20,000 0.00%<br />
Total Budget 3,377,861 3,052,041 3,419,285 3,506,156 3,611,288 3,484,642 1.91%<br />
Appropriations By Fund/Program<br />
FY 2009<br />
Actual<br />
FY 2010<br />
Actual<br />
FY 2011<br />
Adopted<br />
FY 2011<br />
Amended<br />
FY 2011<br />
E<strong>st</strong>imated<br />
FY 2012<br />
Proposed<br />
FY 2012<br />
Change<br />
General Operating Fund<br />
Non-Department Program 0 361 0 0 0 0 0.00%<br />
Transportation Planning Admini<strong>st</strong>ration<br />
0 1,854 0 0 3,675 0 0.00%<br />
Program<br />
Transportation Program 562,247 487,347 683,937 782,922 883,711 690,067 0.90%<br />
Totals for General Operating Fund 562,247 489,562 683,937 782,922 887,386 690,067 0.90%<br />
Parking Revenue<br />
Parking Revenue Program 2,815,614 2,562,479 2,735,348 2,723,235 2,723,902 2,794,575 2.17%<br />
Total Budget 3,377,861 3,052,041 3,419,285 3,506,156 3,611,288 3,484,642 1.91%<br />
Revenue Sources<br />
FY 2009<br />
Actual<br />
FY 2010<br />
Actual<br />
FY 2011<br />
Adopted<br />
FY 2011<br />
Amended<br />
FY 2011<br />
E<strong>st</strong>imated<br />
FY 2012<br />
Proposed<br />
FY 2012<br />
Change<br />
Transportation Charges 2,278,157 2,132,814 2,327,714 2,327,714 2,292,640 2,352,714 1.07%<br />
Other Charges For Services 1,544 2,360 0 0 69 0 0.00%<br />
Violation Of Local Ordinances 430 510 441 441 430 441 0.00%<br />
Rents And Royalties 62,556 64,109 0 0 9,030 30,000 0.00%<br />
Sale Of Fixed Assets 25,440 5,000 0 0 0 0 0.00%<br />
Misc Revenue 21,206 89 0 0 12 0 0.00%<br />
Other Charges (194) (106) 12 12 (119) 12 0.00%<br />
General Fund 535,192 487,109 683,937 782,922 887,302 690,067 0.90%<br />
Parking Revenue 453,530 360,156 407,181 395,068 421,901 411,408 1.04%<br />
Mahaffey Theater Operating 0 0 0 0 23 0 0.00%<br />
Total Revenue 3,377,861 3,052,041 3,419,285 3,506,156 3,611,288 3,484,642 1.91%<br />
181
City <<strong>st</strong>rong>of</<strong>st</strong>rong> St. Petersburg, Florida - FY 2012 Proposed Fiscal Plan<br />
Position Summary<br />
FY 2009<br />
Actual<br />
FY 2010<br />
Actual<br />
FY 2011<br />
Adopted<br />
FY 2012<br />
Proposed<br />
FY 2012<br />
Change<br />
Parking Revenue Program 3.33 3.33 3.33 3.33 0.00%<br />
Transportation Program 5.67 5.67 5.67 5.67 0.00%<br />
Total Full-Time FTE 9.00 9.00 9.00 9.00 0.00%<br />
Total FTE 9.00 9.00 9.00 9.00 0.00%<br />
- In FY12, the department's General Fund <strong>budget</strong> will increase by 0.9%. The increase is mainly due to an increase in Fuel ($31,410).<br />
- Also in FY12, the amount <<strong>st</strong>rong>of</<strong>st</strong>rong> salaries and benefits charged to <strong>capital</strong> projects will increase by $46,454.<br />
- Starting in FY12, the Parking Fund will be charged Pilot in Lieu <<strong>st</strong>rong>of</<strong>st</strong>rong> Taxes ($90,420), which is the main reason the fund's <strong>budget</strong> will increase<br />
by 2.17%. There will also be reductions in Contract Employees ($32,000), Electric ($46,000) and Facility Repairs & Renovations ($7,000).<br />
- Also in FY12, there will be changes made to various revenue line items in the Parking Fund to bring the <strong>budget</strong> in line with actual revenues for<br />
a net increase <<strong>st</strong>rong>of</<strong>st</strong>rong> $55,000.<br />
- The FY 2010 Adopted and FY 2008 Actual revenue amounts differ from the FY10 Adopted Budget Book due to the School Crossing Guard<br />
Tru<strong>st</strong> Fund being inadvertently included in this department in<strong>st</strong>ead <<strong>st</strong>rong>of</<strong>st</strong>rong> the Engineering and Capital Improvements Department.<br />
All <<strong>st</strong>rong>of</<strong>st</strong>rong> the Transportation & Parking Department's performance measures address the Mayor's goal <<strong>st</strong>rong>of</<strong>st</strong>rong> Service.<br />
Objective and Performance Measure<br />
Unit Of<br />
Measure<br />
FY 2009<br />
Actual<br />
FY 2010<br />
Actual<br />
FY 2011<br />
Target<br />
FY2011<br />
E<strong>st</strong>imate<br />
FY 2012<br />
Proposed<br />
BayWalk Parking Garage<br />
To provide convenient, co<strong>st</strong>-effective parking to the public and visitors and to operate a fiscally healthy facility and parking revenue fund.<br />
BayWalk Parking Garage Expenses $ 1,165,000 1,009,000 1,062,000 1,023,000 1,013,500<br />
BayWalk Parking Garage Number <<strong>st</strong>rong>of</<strong>st</strong>rong> Users # 343,000 226,000 275,000 220,000 250,000<br />
BayWalk Parking Garage Revenues $ 801,000 689,000 957,000 650,000 857,000<br />
South Core Parking Garage<br />
To provide superior parking to the City <<strong>st</strong>rong>of</<strong>st</strong>rong> St. Petersburg residents, workers, daily commuters, and visitors, as well as during special events.<br />
South Core Parking Garage Expenses $ 526,000 440,000 527,000 530,000 517,000<br />
South Core Parking Garage Number <<strong>st</strong>rong>of</<strong>st</strong>rong> Users # 164,000 166,000 164,000 167,000 180,000<br />
South Core Parking Garage Revenue $ 553,000 579,000 553,000 625,000 628,000<br />
182
City <<strong>st</strong>rong>of</<strong>st</strong>rong> St. Petersburg, Florida - FY 2012 Proposed Fiscal Plan<br />
General Government Admini<strong>st</strong>ration<br />
General Government Admini<strong>st</strong>ration<br />
Total Full Time Equivalents (FTE) = 310.19<br />
Audit Services Department<br />
Total Full Time Equivalents (FTE) = 5.00<br />
Billing & Collections Department<br />
Total Full Time Equivalents (FTE) = 105.50<br />
Budget & Management Department<br />
Total Full Time Equivalents (FTE) = 6.00<br />
City Clerk<br />
Total Full Time Equivalents (FTE) = 16.75<br />
City Council<br />
Total Full Time Equivalents (FTE) = 12.00<br />
Finance Department<br />
Total Full Time Equivalents (FTE) = 18.00<br />
Human Resources Department<br />
Total Full Time Equivalents (FTE) = 44.45<br />
Information & Communication Services Department<br />
Total Full Time Equivalents (FTE) = 71.00<br />
Internal Services Admini<strong>st</strong>ration Department<br />
Total Full Time Equivalents (FTE) = 0.00<br />
Legal Department<br />
Total Full Time Equivalents (FTE) = 20.69<br />
Mayor's Office<br />
Total Full Time Equivalents (FTE) = 10.80<br />
183
City <<strong>st</strong>rong>of</<strong>st</strong>rong> St. Petersburg, Florida - FY 2012 Proposed Fiscal Plan<br />
General Government Admini<strong>st</strong>ration<br />
Budgetary Co<strong>st</strong> Summary<br />
FY 2009<br />
Actual<br />
FY 2010<br />
Actual<br />
FY 2011<br />
Adopted<br />
FY 2011<br />
Amended<br />
FY 2011<br />
E<strong>st</strong>imated<br />
FY 2012<br />
Proposed<br />
FY 2012<br />
Change<br />
Wages And Benefits 23,455,846 23,490,989 23,037,130 23,209,029 22,591,008 20,389,456 (11.49%)<br />
Services And Commodities 60,518,410 64,760,035 60,747,716 61,633,248 59,116,661 59,431,943 (2.17%)<br />
Capital 444,807 857,036 879,532 3,280,713 2,282,437 743,800 (15.43%)<br />
Debt 61,472,012 38,187,894 36,963,739 37,034,739 35,851,250 40,620,040 9.89%<br />
Grants And Aid 860,688 871,582 1,001,000 1,292,169 833,192 971,000 (3.00%)<br />
Transfers Out 154,795,099 177,748,187 32,676,440 39,616,096 37,729,417 32,116,848 (1.71%)<br />
Contingencies 0 0 362,953 262,953 0 1,224,968 237.50%<br />
Total Budget 301,546,862 305,915,722 155,668,510 166,328,946 158,403,965 155,498,055 (0.11%)<br />
Appropriations By<br />
Fund/Department<br />
FY 2009<br />
Actual<br />
FY 2010<br />
Actual<br />
FY 2011<br />
Adopted<br />
FY 2011<br />
Amended<br />
FY 2011<br />
E<strong>st</strong>imated<br />
FY 2012<br />
Proposed<br />
FY 2012<br />
Change<br />
General Operating Fund<br />
Audit Services Department 968,013 940,845 947,843 991,603 994,289 857,321 (9.55%)<br />
Billing & Collections Department 0 0 0 200 0 0 0.00%<br />
Budget & Management Department 6,977,237 6,510,864 5,485,437 5,385,515 5,370,296 3,620,982 (33.99%)<br />
City Clerk 1,212,779 1,164,238 1,172,578 1,172,578 963,855 1,195,204 1.93%<br />
City Council 915,088 887,181 850,017 858,017 837,619 823,456 (3.12%)<br />
Finance Department 16,749,659 11,046,822 10,365,575 10,842,249 10,694,387 9,512,338 (8.23%)<br />
Human Resources Department 4,251,188 3,696,092 3,748,460 3,994,005 3,779,362 3,379,970 (9.83%)<br />
Internal Services Admini<strong>st</strong>ration<br />
Department<br />
1,537,992 1,232,714 516,967 517,940 370,181 0 (100.00%)<br />
Legal Department 2,781,496 2,936,957 2,466,348 2,967,415 2,553,145 2,287,812 (7.24%)<br />
Mayor’s Office 964,254 945,786 1,711,849 1,812,175 1,955,077 1,993,811 16.47%<br />
Total General Operating Fund 36,357,705 29,361,497 27,265,074 28,541,697 27,518,211 23,670,894 (13.18%)<br />
Non-General Funds<br />
Assessments Revenue 256,900 177,156 166,126 166,126 55,376 98,131 (40.93%)<br />
Banc Of America Notes Debt<br />
Service Fund<br />
1,172,215 1,173,020 1,178,269 1,178,269 1,178,269 1,181,512 0.28%<br />
Bb&T Notes 0 0 0 29,000 29,000 642,396 0.00%<br />
Billing & Collections 9,128,220 10,436,111 9,190,064 9,163,667 8,743,136 8,417,309 (8.41%)<br />
Capital Improvement Variable<br />
Rate Debt<br />
2,494,893 0 0 0 0 0 0.00%<br />
Commercial Insurance 5,101,762 6,621,100 4,943,843 4,943,843 4,906,315 4,881,431 (1.26%)<br />
Community Redevelopment Di<strong>st</strong>rict 9,259,610 11,347,559 6,712,750 6,712,750 6,712,750 6,703,500 (0.14%)<br />
Deferred Compensation - Icma 1,621,663 4,316,712 37,218 37,218 41,369 32,798 (11.88%)<br />
Downtown Redevelopment Di<strong>st</strong>rict 5,645,697 10,528,854 7,533,729 12,083,435 12,077,561 8,169,124 8.43%<br />
Economic Development 0 12,636 0 0 0 0 0.00%<br />
Economic Stability 1,047,643 0 0 0 0 0 0.00%<br />
Emergency Medical Services 0 0 0 6,950 0 0 0.00%<br />
Equipment Replacement 0 1,757,828 0 0 0 0 0.00%<br />
Excise Tax Revenue 22,032,872 19,765,678 831,495 831,495 831,495 1,431,495 72.16%<br />
Ffgfc Loan 1,714,760 2,697,021 2,696,760 2,696,760 2,696,760 2,706,550 0.36%<br />
Fleet Management 0 721,716 0 0 0 0 0.00%<br />
Franchise Tax Revenue 24,066,443 21,018,607 0 0 0 0 0.00%<br />
General Liabilities Claims 457,956 13,529,694 2,267,799 2,267,799 2,336,604 2,265,672 (0.09%)<br />
Health Facilities Authority 175 175 14,000 14,000 175 14,000 0.00%<br />
Health Insurance 33,050,027 32,953,551 33,218,970 33,218,970 31,907,360 34,019,506 2.41%<br />
Indu<strong>st</strong>rial Development 0 123,710 0 0 0 0 0.00%<br />
Information & Communication<br />
Services<br />
10,250,665 12,017,169 10,354,812 10,923,658 10,621,617 10,190,139 (1.59%)<br />
Life Insurance 820,977 1,090,965 941,783 941,783 891,183 946,496 0.50%<br />
Local Option Tax Revenue 27,224,846 25,908,004 0 0 0 0 0.00%<br />
Municipal Office Buildings 358,226 305,246 329,984 604,984 297,000 340,691 3.24%<br />
Parking Revenue 1,097,940 1,369,130 1,390,949 1,395,763 1,287,241 1,569,085 12.81%<br />
Pc Replacement 121,782 3,863,030 0 36,106 36,106 0 0.00%<br />
184
Appropriations By<br />
Fund/Department<br />
City <<strong>st</strong>rong>of</<strong>st</strong>rong> St. Petersburg, Florida - FY 2012 Proposed Fiscal Plan<br />
FY 2009<br />
Actual<br />
FY 2010<br />
Actual<br />
FY 2011<br />
Adopted<br />
FY 2011<br />
Amended<br />
FY 2011<br />
E<strong>st</strong>imated<br />
FY 2012<br />
Proposed<br />
FY 2012<br />
Change<br />
Print Shop 420,892 387,651 0 857 0 0 0.00%<br />
Pro Sports Facility 2,000,004 2,000,004 2,000,004 2,000,004 2,000,004 2,000,004 0.00%<br />
Radio Replacement 6,433 1,208,604 0 16,050 16,050 0 0.00%<br />
Redevelopment Debt Service 6,463,250 6,680,875 6,712,750 6,712,750 6,712,750 6,703,500 (0.14%)<br />
Sanitation Operating 0 342,731 0 0 0 0 0.00%<br />
School Crossing Guard Tru<strong>st</strong> 658,542 355,437 300,000 300,000 300,000 300,000 0.00%<br />
Sports Facility Sales Tax<br />
Debt<br />
1,921,206 1,912,244 1,913,950 1,913,950 1,913,950 1,911,587 (0.12%)<br />
Stadium Debt Service 8,957,385 8,639,905 8,686,282 8,686,282 8,686,282 8,620,019 (0.76%)<br />
Stormwater Debt Service 1,052,737 1,053,076 1,055,252 1,055,252 1,055,252 1,053,332 (0.18%)<br />
Stormwater Utility Operating 700,386 137,856 0 0 0 0 0.00%<br />
Supply Management (19,409) 238,128 0 0 0 0 0.00%<br />
Technology & Infra<strong>st</strong>ructure<br />
Fund<br />
0 0 719,532 2,960,413 1,544,049 734,800 2.12%<br />
Utility Tax Debt Service 2,822,500 2,824,064 0 0 0 0 0.00%<br />
Utility Tax Revenue 36,462,221 41,661,849 0 0 0 0 0.00%<br />
Water Co<strong>st</strong> Stabilization 5,767,058 2,994,316 3,000,000 3,000,000 1,493,971 1,500,000 (50.00%)<br />
Water Resources (1,405,978) (5,648) 0 0 500 0 0.00%<br />
Water Resources Debt 35,673,855 13,450,561 15,020,476 15,020,476 13,842,861 18,046,144 20.14%<br />
Weeki Wachee 106,707 75,871 60,000 1,742,000 1,742,084 100,000 66.67%<br />
Workers' Compensation 6,676,094 10,862,030 7,126,639 7,126,639 6,928,684 7,247,940 1.70%<br />
Total Non-General Funds 265,189,156 276,554,225 128,403,436 137,787,249 130,885,754 131,827,161 2.67%<br />
Total Budget 301,546,862 305,915,722 155,668,510 166,328,946 158,403,965 155,498,055 (0.11%)<br />
Revenue Sources<br />
FY 2009<br />
Actual<br />
FY 2010<br />
Actual<br />
FY 2011<br />
Adopted<br />
FY 2011<br />
Amended<br />
FY 2011<br />
E<strong>st</strong>imated<br />
FY 2012<br />
Proposed<br />
FY 2012<br />
Change<br />
Property Taxes 95,140,129 83,484,249 74,922,762 74,922,762 74,922,762 70,116,254 (6.42%)<br />
Franchise Tax 21,014,619 22,159,989 20,814,460 20,814,460 21,280,487 20,724,720 (0.43%)<br />
Utility Tax 38,633,875 39,711,520 39,234,858 39,234,858 39,208,670 39,331,930 0.25%<br />
Business Taxes 2,596,245 2,405,903 2,500,000 2,500,000 2,391,080 2,500,000 0.00%<br />
Contractors Permits 4,750 4,238 500 500 49,769 0 (100.00%)<br />
Other License And Permits 4,250 13,750 5,100 5,100 0 5,100 0.00%<br />
Federal Grants 809,907 1,167,887 150,000 394,512 11,387 0 (100.00%)<br />
State Shared Revenue 21,695,936 21,522,551 22,398,873 22,398,873 21,199,278 21,147,223 (5.59%)<br />
Shared Revenue 39,047,572 35,467,727 15,556,179 15,556,179 18,448,680 16,919,381 8.76%<br />
General Government 129,146 216,547 189,800 189,800 254,564 239,800 26.34%<br />
Transportation Charges 891,637 1,009,024 837,000 837,000 821,998 1,697,000 102.75%<br />
Other Charges For Services 140,349 126,186 106,400 106,400 158,847 103,705 (2.53%)<br />
Traffic And Parking 1,971,166 1,965,326 1,776,000 1,776,000 2,031,025 1,670,000 (5.97%)<br />
Violation Of Local Ordinances 1,175,526 1,129,696 1,160,000 1,160,000 1,140,315 1,160,000 0.00%<br />
Intere<strong>st</strong> Earnings 12,117,011 14,023,803 6,571,283 6,571,283 3,483,996 3,470,817 (47.18%)<br />
Rents And Royalties 94,957 98,718 24,000 24,000 46,027 24,000 0.00%<br />
Special Assessment 104,642 184,011 140,000 140,000 50,000 140,000 0.00%<br />
Sale Of Fixed Assets 32,958 7,734 10,000 10,000 0 10,000 0.00%<br />
Contributions And Donations 50,006,256 91,050,481 46,826,709 46,826,709 47,115,673 46,717,144 (0.23%)<br />
Misc Revenue 152,042 183,866 630,441 630,441 1,373,355 630,981 0.09%<br />
General & Admini<strong>st</strong>rative 6,613,260 6,694,292 7,216,572 7,216,572 7,216,572 7,262,652 0.64%<br />
Payment In Lieu Of Taxes 13,707,907 14,185,748 14,572,836 14,572,836 14,572,836 14,553,396 (0.13%)<br />
Debt Proceeds 28,286,131 0 0 0 9,968,080 1,188,752 0.00%<br />
Department Charges 13,178,367 11,798,240 10,602,390 10,602,390 10,948,752 10,343,624 (2.44%)<br />
Other Charges 7,984,573 7,594,834 7,651,049 7,651,049 7,617,108 6,868,449 (10.23%)<br />
Transfer From General Fund 7,218,918 2,625,421 2,618,006 2,618,006 2,978,006 2,635,316 0.66%<br />
Transfer From Economic Stability 38,048 0 0 0 0 0 0.00%<br />
Transfer From Utility Tax<br />
36,462,221 41,659,725 0 0 0 0 0.00%<br />
Revenue<br />
Transfer From Local Option<br />
3,520,087 3,517,996 0 0 0 0 0.00%<br />
Tax Revenue<br />
185
Revenue Sources<br />
City <<strong>st</strong>rong>of</<strong>st</strong>rong> St. Petersburg, Florida - FY 2012 Proposed Fiscal Plan<br />
FY 2009<br />
Actual<br />
FY 2010<br />
Actual<br />
FY 2011<br />
Adopted<br />
FY 2011<br />
Amended<br />
FY 2011<br />
E<strong>st</strong>imated<br />
FY 2012<br />
Proposed<br />
FY 2012<br />
Change<br />
Transfer From Franchise Tax<br />
23,235,658 21,018,607 0 0 0 0 0.00%<br />
Revenue<br />
Transfer From Excise Tax Revenue 20,109,732 19,765,678 831,495 831,495 831,495 1,431,495 72.16%<br />
Transfer From Emergency Medical<br />
0 0 0 6,950 6,950 0 0.00%<br />
Services<br />
Transfer From Parking Revenue 0 0 100,000 100,000 100,000 404,580 304.58%<br />
Transfer From School Crossing<br />
658,542 355,437 300,000 300,000 300,000 300,000 0.00%<br />
Guard Tru<strong>st</strong><br />
Transfer From Weeki Wachee 0 0 0 0 0 20,000 0.00%<br />
Transfer From Pro Sports Facility 2,000,004 2,000,004 2,000,004 2,000,004 2,000,004 2,000,004 0.00%<br />
Transfer From Downtown Redevelopment<br />
5,645,697 7,501,854 7,533,729 7,562,729 7,562,729 8,169,124 8.43%<br />
Di<strong>st</strong>rict<br />
Transfer From Community Development<br />
285,605 841,153 828,632 828,632 557,847 780,431 (5.82%)<br />
Block Grant<br />
Transfer From Community Redevelopment<br />
9,259,610 8,867,559 6,712,750 6,712,750 6,712,750 6,703,500 (0.14%)<br />
Di<strong>st</strong>rict<br />
Transfer From Stadium Debt<br />
549,888 242,873 300,000 300,000 300,000 245,000 (18.33%)<br />
Service<br />
Transfer From Weeki Wachee<br />
155,000 0 0 0 0 0 0.00%<br />
Capital Improvements<br />
Transfer From Water Resources 12,485,618 14,922,808 14,923,400 14,923,400 14,923,400 17,130,250 14.79%<br />
Transfer From Stormwater Utility<br />
1,055,061 1,057,856 1,053,000 1,053,000 1,053,000 1,058,000 0.47%<br />
Operating<br />
Transfer From Sanitation Operating 455,076 797,807 455,076 455,076 455,076 455,076 0.00%<br />
Transfer From Airport Operating 0 0 50,000 50,000 50,000 50,000 0.00%<br />
Transfer From Marina Operating 300,000 300,000 300,000 300,000 300,000 310,000 3.33%<br />
Transfer From Jame<strong>st</strong>own Complex 0 0 35,000 35,000 35,000 35,000 0.00%<br />
Transfer From Fleet Management 0 721,716 0 0 0 0 0.00%<br />
Transfer From Equipment Replacement 0 1,757,828 0 0 0 0 0.00%<br />
Transfer From Information<br />
19,000 1,457,833 300,000 300,000 300,000 200,000 (33.33%)<br />
& Communication Services<br />
Transfer From Pc Replacement 0 3,638,761 0 0 0 0 0.00%<br />
Transfer From Radio Replacement 0 1,162,851 0 0 0 0 0.00%<br />
Transfer From Supply Management 0 249,523 0 0 0 0 0.00%<br />
Transfer From Life Insurance 0 216,035 0 0 0 0 0.00%<br />
Transfer From General Liabilities<br />
0 12,111,560 0 0 0 0 0.00%<br />
Claims<br />
Transfer From Commercial Insurance 0 1,533,744 0 0 0 0 0.00%<br />
Transfer From Billing & Collections 0 1,466,197 0 0 0 0 0.00%<br />
General Fund (159,355,251) (166,585,993) (156,138,000) (155,112,839) (158,051,739) (155,034,662) (0.71%)<br />
Franchise Tax Revenue 3,847,252 (797,992) 0 0 0 0 0.00%<br />
Utility Tax Revenue (2,171,642) 9,373,356 0 0 0 0 0.00%<br />
Water Resources (1,885,245) (544,263) (51,532) (51,532) (26,077) (20,469) (60.28%)<br />
Economic Development 0 12,636 0 0 0 0 0.00%<br />
Preservation Reserve (3,918) (855) (5,000) (5,000) (500) 0 (100.00%)<br />
Billing & Collections (335,890) 1,460,370 98,064 71,667 (440,342) 57,860 (41.00%)<br />
Information & Communication<br />
(895,987) 1,894,525 670,812 1,239,658 693,116 560,517 (16.44%)<br />
Services<br />
Parking Revenue (1,121,082) (926,507) (722,051) (717,237) (1,143,784) (1,297,915) 79.75%<br />
Excise Tax Revenue 2,165,866 266,975 560,710 560,710 831,495 1,431,495 155.30%<br />
Stadium Debt Service (133,918) (148,375) (160,875) (160,875) 46,757 (172,861) 7.45%<br />
Pro Sports Facility (1,305) (44) (9,996) (9,996) 2 (3,968) (60.30%)<br />
Community Development Block<br />
(74) 0 0 0 0 0 0.00%<br />
Grant<br />
Community Redevelopment Di<strong>st</strong>rict (765,920) 2,501,388 (894,525) (894,525) (884,525) (1,251,399) 39.90%<br />
Bayboro Harbor Tax Increment<br />
0 (151,662) (95,458) (95,458) (95,487) (37,419) (60.80%)<br />
Di<strong>st</strong>rict<br />
Local Option Tax Revenue 2,871,901 3,782,900 0 0 0 0 0.00%<br />
Intown We<strong>st</strong> Tax Increment<br />
0 (502,419) (326,389) (326,389) (326,490) (209,747) (35.74%)<br />
Di<strong>st</strong>rict<br />
General Liabilities Claims (3,082,359) 10,243,576 12,799 12,799 180,900 15,637 22.17%<br />
Health Facilities Authority (9,912) (4,853) 0 0 (4,833) 0 0.00%<br />
Indu<strong>st</strong>rial Development (482) 123,605 0 0 0 0 0.00%<br />
Weeki Wachee (1,165,055) (577,728) (240,000) 1,442,000 1,562,084 (19,160) (92.02%)<br />
Marina Operating 0 (286,930) 0 0 0 0 0.00%<br />
Workers' Compensation 422,494 (2,250,952) (3,261) (3,261) (347,121) 189,849 (5921.80%)<br />
School Crossing Guard Tru<strong>st</strong> 257,900 (32,410) 0 0 (5) 0 0.00%<br />
Stormwater Utility Operating 546,102 118,442 0 0 (16,130) 0 0.00%<br />
Sanitation Equipment Replacement (19) (342,731) 0 0 0 0 0.00%<br />
186
Revenue Sources<br />
City <<strong>st</strong>rong>of</<strong>st</strong>rong> St. Petersburg, Florida - FY 2012 Proposed Fiscal Plan<br />
FY 2009<br />
Actual<br />
FY 2010<br />
Actual<br />
FY 2011<br />
Adopted<br />
FY 2011<br />
Amended<br />
FY 2011<br />
E<strong>st</strong>imated<br />
FY 2012<br />
Proposed<br />
FY 2012<br />
Change<br />
Water Resources Debt (5,174,780) (1,623,133) (52,782) (52,782) (6,588,654) (423,969) 703.25%<br />
Sanitation Operating 0 342,731 0 0 0 0 0.00%<br />
Community Housing Tru<strong>st</strong> (44,527) (89,614) 0 0 (8,588) 0 0.00%<br />
Pc Replacement (630,169) 3,392,137 0 36,106 36,106 0 0.00%<br />
Building Permit Special Revenue (31,064) (2,839) 0 0 (106) 0 0.00%<br />
Assessments Revenue 114,723 (45,100) (13,874) (13,874) (3,418) (57,757) 316.30%<br />
Commercial Insurance (97,560) 1,276,446 (157) (157) (39,344) 1,968 (1353.50%)<br />
Technology & Infra<strong>st</strong>ructure<br />
0 (10,357,139) (359,468) 1,881,413 464,722 (42,996) (88.04%)<br />
Fund<br />
Downtown Redevelopment Di<strong>st</strong>rict (3,702,888) 2,313,237 820,979 5,370,685 844,308 1,465,624 78.52%<br />
Economic Stability (5,260,011) (1,230,749) (500,000) (500,000) (499,846) (198,600) (60.28%)<br />
Equipment Replacement 333 1,696,898 0 0 159 0 0.00%<br />
Fleet Management (3,669) 721,716 0 0 0 0 0.00%<br />
Redevelopment Debt Service 1,633,000 0 0 0 0 0 0.00%<br />
Deferred Compensation - Icma (1,821,471) (44,332,471) (162,782) (162,782) (158,631) (167,202) 2.72%<br />
Water Co<strong>st</strong> Stabilization 0 (793,921) 0 0 0 0 0.00%<br />
Health Insurance (796,533) (9,530,452) 483,010 483,010 (496,682) 1,368,347 183.30%<br />
Ffgfc Loan 517,252 0 0 0 0 0 0.00%<br />
Utility Tax Debt Service (667) 941,500 0 0 0 0 0.00%<br />
Municipal Office Buildings 332,419 297,335 329,984 604,984 296,919 340,691 3.24%<br />
Bb&T Notes 0 0 0 0 0 0 0.00%<br />
Law Enforcement Tru<strong>st</strong> (1,240) (25) 0 0 0 0 0.00%<br />
Print Shop 5,004 (25,174) 0 857 0 0 0.00%<br />
Banc Of America Notes Debt<br />
(610,027) 68,384 71,458 71,458 71,949 75,501 5.66%<br />
Service Fund<br />
Coliseum Operating 0 (77) 0 0 (16) 0 0.00%<br />
Airport Operating 0 (51,469) 0 0 0 0 0.00%<br />
Police Grant Tru<strong>st</strong> Funds 0 (11,930) 0 0 (249) 0 0.00%<br />
Sports Facility Sales Tax<br />
(4,031) (17,006) (14,700) (14,700) (7,442) (17,938) 22.03%<br />
Debt<br />
Stormwater Debt Service (3,243) (5,096) (780) (780) 2,193 (5,000) 541.03%<br />
Sunken Gardens 0 (46) 0 0 (6) 0 0.00%<br />
Life Insurance 48,458 291,760 134,020 134,020 79,721 198,924 48.43%<br />
Emergency Medical Services 0 0 0 6,950 0 0 0.00%<br />
Radio Replacement (471,672) 788,381 0 16,050 16,050 0 0.00%<br />
Arts And Cultural Programs (100,049) (87) 0 0 (19) 0 0.00%<br />
Supply Management (521,156) (257,322) 0 0 0 0 0.00%<br />
Golf Course Operating 0 (462,357) 0 0 0 0 0.00%<br />
Neighborhood Stabilization<br />
Program<br />
0 0 0 0 (360,000) 0 0.00%<br />
Total Revenue 301,546,862 305,915,722 155,668,510 166,328,946 158,403,965 155,498,055 (0.11%)<br />
Position Summary By Department<br />
FY 2009<br />
Actual<br />
FY 2010<br />
Actual<br />
FY 2011<br />
Adopted<br />
FY 2012<br />
Proposed<br />
FY 2012<br />
Change<br />
Audit Services Department 6.00 5.50 5.50 5.00 (9.09%)<br />
Billing & Collections Department 106.00 107.00 106.00 105.00 (0.94%)<br />
Budget & Management Department 8.00 7.50 7.50 6.00 (20.00%)<br />
City Clerk 16.00 16.00 16.00 15.00 (6.25%)<br />
City Council 4.00 4.00 4.00 4.00 0.00%<br />
Finance Department 19.00 19.00 19.00 18.00 (5.26%)<br />
Human Resources Department 43.00 42.00 43.00 43.95 2.21%<br />
Information & Communication Services Department 67.00 65.00 68.00 68.00 0.00%<br />
Internal Services Admini<strong>st</strong>ration Department 6.00 4.00 3.00 0.00 (100.00%)<br />
Legal Department 21.00 20.84 20.84 19.69 (5.52%)<br />
Mayor's Office 8.00 9.00 9.00 10.00 11.11%<br />
Total Full-Time FTE 304.00 299.84 301.84 294.64 (2.39%)<br />
Billing & Collections Department 0.50 0.50 0.50 0.50 0.00%<br />
City Clerk 1.00 1.00 1.00 1.75 75.00%<br />
City Council 8.00 8.00 8.00 8.00 0.00%<br />
Human Resources Department 1.00 0.50 0.50 0.50 0.00%<br />
Information & Communication Services Department 3.00 3.00 3.00 3.00 0.00%<br />
Legal Department 1.75 1.75 1.00 1.00 0.00%<br />
187
City <<strong>st</strong>rong>of</<strong>st</strong>rong> St. Petersburg, Florida - FY 2012 Proposed Fiscal Plan<br />
Position Summary By Department<br />
FY 2009<br />
Actual<br />
FY 2010<br />
Actual<br />
FY 2011<br />
Adopted<br />
FY 2012<br />
Proposed<br />
FY 2012<br />
Change<br />
Mayor's Office 0.00 1.00 1.00 0.80 (20.00%)<br />
Total Part-Time FTE 15.25 15.75 15.00 15.55 3.67%<br />
Total FTE 319.25 315.59 316.84 310.19 (2.10%)<br />
188
Department Mission Statement<br />
City <<strong>st</strong>rong>of</<strong>st</strong>rong> St. Petersburg, Florida - FY 2012 Proposed Fiscal Plan<br />
Audit Services Department<br />
The mission <<strong>st</strong>rong>of</<strong>st</strong>rong> the Audit Services Department is to provide an independent objective assurance and consulting services function within the City, designed to add<br />
value and improve the organization's operations. The primary objective is to assi<strong>st</strong> management in the effective discharge <<strong>st</strong>rong>of</<strong>st</strong>rong> their duties. To this end, the<br />
Department provides analysis, appraisals, recommendations, counsel, and information concerning the activities and programs reviewed. The underlying basis for<br />
Department objectives is to promote effective control at a reasonable co<strong>st</strong>.<br />
Services Provided<br />
The Audit Services Department provides the following services:<br />
• Financial and compliance audits.<br />
• Operational and performance audits.<br />
• Revenue/contract audits.<br />
• Utility tax, and franchise fee audits.<br />
• Special reviews and analysis.<br />
• Grant audits.<br />
• IT audits.<br />
• Sales tax audits.<br />
• Fraud and other inve<strong>st</strong>igations.<br />
• Consulting assignments.<br />
• Hurricane co<strong>st</strong> recovery.<br />
Budgetary Co<strong>st</strong> Summary<br />
FY 2009<br />
Actual<br />
FY 2010<br />
Actual<br />
FY 2011<br />
Adopted<br />
FY 2011<br />
Amended<br />
FY 2011<br />
E<strong>st</strong>imated<br />
FY 2012<br />
Proposed<br />
FY 2012<br />
Change<br />
Wages And Benefits 534,997 526,345 535,690 535,690 538,684 509,272 (4.93%)<br />
Services And Commodities 433,015 414,500 412,153 455,913 455,605 348,049 (15.55%)<br />
Total Budget 968,013 940,845 947,843 991,603 994,289 857,321 (9.55%)<br />
Appropriations By Fund/Program<br />
FY 2009<br />
Actual<br />
FY 2010<br />
Actual<br />
FY 2011<br />
Adopted<br />
FY 2011<br />
Amended<br />
FY 2011<br />
E<strong>st</strong>imated<br />
FY 2012<br />
Proposed<br />
FY 2012<br />
Change<br />
General Operating Fund<br />
Audit Services Program 968,013 940,845 947,843 991,603 994,289 857,321 (9.55%)<br />
Total Budget 968,013 940,845 947,843 991,603 994,289 857,321 (9.55%)<br />
Revenue Sources<br />
FY 2009<br />
Actual<br />
FY 2010<br />
Actual<br />
FY 2011<br />
Adopted<br />
FY 2011<br />
Amended<br />
FY 2011<br />
E<strong>st</strong>imated<br />
FY 2012<br />
Proposed<br />
FY 2012<br />
Change<br />
General & Admini<strong>st</strong>rative 530,400 445,680 459,048 459,048 459,048 459,048 0.00%<br />
General Fund 437,613 495,165 488,795 532,555 535,241 398,273 (18.52%)<br />
Total Revenue 968,013 940,845 947,843 991,603 994,289 857,321 (9.55%)<br />
Position Summary<br />
FY 2009<br />
Actual<br />
FY 2010<br />
Actual<br />
FY 2011<br />
Adopted<br />
FY 2012<br />
Proposed<br />
FY 2012<br />
Change<br />
Audit Services Program 6.00 5.50 5.50 5.00 (9.09%)<br />
Total Full-Time FTE 6.00 5.50 5.50 5.00 (9.09%)<br />
189
City <<strong>st</strong>rong>of</<strong>st</strong>rong> St. Petersburg, Florida - FY 2012 Proposed Fiscal Plan<br />
Position Summary<br />
FY 2009<br />
Actual<br />
FY 2010<br />
Actual<br />
FY 2011<br />
Adopted<br />
FY 2012<br />
Proposed<br />
FY 2012<br />
Change<br />
Total FTE 6.00 5.50 5.50 5.00 (9.09%)<br />
- The Audit Services <strong>budget</strong> decreased by 9.55% in FY12.<br />
- The department will eliminate the full-time Executive Secretary that is currently shared with another department ($33,260).<br />
- The Department will also reduce other various line-items by $1,340.<br />
- These reductions are in addition to a decrease in mandated items in the Audit <strong>budget</strong> including a $39,000 decrease to the external audit<br />
contract and a $25,000 decrease for the biennial management evaluation required by City Charter (FY12 is an <<strong>st</strong>rong>of</<strong>st</strong>rong>f year).<br />
The Audit Services Department's performance measure addresses the Mayor's goal <<strong>st</strong>rong>of</<strong>st</strong>rong> Service.<br />
Objective and Performance Measure<br />
Unit Of<br />
Measure<br />
FY 2009<br />
Actual<br />
FY 2010<br />
Actual<br />
FY 2011<br />
Target<br />
FY2011<br />
E<strong>st</strong>imate<br />
FY 2012<br />
Proposed<br />
Audit Recommendations Accepted by Management<br />
The objective <<strong>st</strong>rong>of</<strong>st</strong>rong> Audit Services is to assi<strong>st</strong> management in the effective discharge <<strong>st</strong>rong>of</<strong>st</strong>rong> their responsibilities by furnishing them with independent and<br />
objective analyses, appraisals, recommendations, and pertinent comments concerning the activities audited. The underlying basis for this objective<br />
is to promote effective control at a reasonable co<strong>st</strong>. Audit Services makes recommendations to management designed to accomplish this objective.<br />
Audit Recommendations Accepted by Management % 94 100 98 98 98<br />
190
Department Mission Statement<br />
City <<strong>st</strong>rong>of</<strong>st</strong>rong> St. Petersburg, Florida - FY 2012 Proposed Fiscal Plan<br />
Billing & Collections Department<br />
The mission <<strong>st</strong>rong>of</<strong>st</strong>rong> the Billing & Collections Department is to provide every cu<strong>st</strong>omer with a consi<strong>st</strong>ent, accurate response to every reque<strong>st</strong> in a prompt and timely<br />
manner, at all times serving with courtesy, hone<strong>st</strong>y, and fairness.<br />
Services Provided<br />
The Billing & Collections Department provides the following services:<br />
• The Utility Accounts Division reads over 95,000 meters per month and bills 90,000+ accounts each month. This function also takes over 25,000 calls per<br />
month responding to cu<strong>st</strong>omer issues.<br />
• The Business Tax Division issues over 17,000 business tax receipts annually and licenses taxicabs on an annual basis.<br />
• The Central Cashier function accepts mo<strong>st</strong> monies collected by the City and deposits those funds with the bank.<br />
• The Parking Enforcement division oversees the enforcement <<strong>st</strong>rong>of</<strong>st</strong>rong> parking regulations in the downtown area and issues 50,000+ tickets annually. This division<br />
also collects parking ticket payments and collects coins from the parking meters downtown.<br />
• The Special Assessment section files liens again<strong>st</strong> properties for codes violations and nonpayment <<strong>st</strong>rong>of</<strong>st</strong>rong> utility bills.<br />
• The False Alarm group bills citizens that exceed limits for police false alarms.<br />
Budgetary Co<strong>st</strong> Summary<br />
FY 2009<br />
Actual<br />
FY 2010<br />
Actual<br />
FY 2011<br />
Adopted<br />
FY 2011<br />
Amended<br />
FY 2011<br />
E<strong>st</strong>imated<br />
FY 2012<br />
Proposed<br />
FY 2012<br />
Change<br />
Wages And Benefits 5,882,897 6,051,998 6,199,645 6,199,645 6,094,731 6,007,720 (3.10%)<br />
Services And Commodities 4,150,511 3,911,560 4,066,026 4,039,643 3,663,460 3,464,484 (14.79%)<br />
Capital 47,567 68,453 0 0 0 0 0.00%<br />
Total Budget 10,080,975 10,032,011 10,265,671 10,239,288 9,758,191 9,472,204 (7.73%)<br />
Appropriations By Fund/Program<br />
FY 2009<br />
Actual<br />
FY 2010<br />
Actual<br />
FY 2011<br />
Adopted<br />
FY 2011<br />
Amended<br />
FY 2011<br />
E<strong>st</strong>imated<br />
FY 2012<br />
Proposed<br />
FY 2012<br />
Change<br />
General Operating Fund<br />
Non-Department Program 0 0 0 200 0 0 0.00%<br />
Parking Revenue<br />
Non-Department Program<br />
Parking Enforcement Program<br />
0<br />
952,755<br />
73<br />
1,062,024<br />
0<br />
1,075,607<br />
0<br />
1,075,421<br />
0<br />
1,015,055<br />
0<br />
1,054,895<br />
0.00%<br />
(1.93%)<br />
Totals for Parking Revenue 952,755 1,062,097 1,075,607 1,075,421 1,015,055 1,054,895 (1.93%)<br />
Billing & Collections<br />
Parking Enforcement Program<br />
Utility Accounts Program<br />
0<br />
9,128,220<br />
0<br />
8,969,914<br />
0<br />
9,190,064<br />
0<br />
9,163,667<br />
5<br />
8,743,131<br />
0<br />
8,417,309<br />
0.00%<br />
(8.41%)<br />
Totals for Billing & Collections 9,128,220 8,969,914 9,190,064 9,163,667 8,743,136 8,417,309 (8.41%)<br />
Total Budget 10,080,975 10,032,011 10,265,671 10,239,288 9,758,191 9,472,204 (7.73%)<br />
Revenue Sources<br />
FY 2009<br />
Actual<br />
FY 2010<br />
Actual<br />
FY 2011<br />
Adopted<br />
FY 2011<br />
Amended<br />
FY 2011<br />
E<strong>st</strong>imated<br />
FY 2012<br />
Proposed<br />
FY 2012<br />
Change<br />
General Government 129,147 151,907 150,000 150,000 222,185 200,000 33.33%<br />
Transportation Charges 891,637 1,009,024 837,000 837,000 821,998 1,697,000 102.75%<br />
Traffic And Parking 1,971,166 1,965,326 1,776,000 1,776,000 2,031,025 1,670,000 (5.97%)<br />
Violation Of Local Ordinances 1,172,826 1,128,845 1,160,000 1,160,000 1,140,315 1,160,000 0.00%<br />
Intere<strong>st</strong> Earnings 284,883 199,012 249,951 249,951 232,650 250,000 0.02%<br />
Sale Of Fixed Assets 5,483 70 0 0 0 0 0.00%<br />
Misc Revenue (351,913) (390,025) (319,000) (319,000) (150,787) (319,000) 0.00%<br />
Other Charges 7,984,571 7,594,955 7,651,049 7,651,049 7,617,108 6,868,449 (10.23%)<br />
191
Revenue Sources<br />
City <<strong>st</strong>rong>of</<strong>st</strong>rong> St. Petersburg, Florida - FY 2012 Proposed Fiscal Plan<br />
FY 2009<br />
Actual<br />
FY 2010<br />
Actual<br />
FY 2011<br />
Adopted<br />
FY 2011<br />
Amended<br />
FY 2011<br />
E<strong>st</strong>imated<br />
FY 2012<br />
Proposed<br />
FY 2012<br />
Change<br />
Billing & Collections (341,309) (5,764) 98,064 71,667 (440,333) 57,860 (41.00%)<br />
Parking Revenue (1,266,213) (1,233,532) (1,037,393) (1,037,579) (1,415,970) (1,812,105) 74.68%<br />
General Fund 0 0 0 200 0 0 0.00%<br />
School Crossing Guard Tru<strong>st</strong> (399,302) (387,808) (300,000) (300,000) (300,000) (300,000) 0.00%<br />
Total Revenue 10,080,975 10,032,011 10,265,671 10,239,288 9,758,191 9,472,204 (7.73%)<br />
Position Summary<br />
FY 2009<br />
Actual<br />
FY 2010<br />
Actual<br />
FY 2011<br />
Adopted<br />
FY 2012<br />
Proposed<br />
FY 2012<br />
Change<br />
Utility Accounts Program 92.00 92.00 91.00 90.00 (1.10%)<br />
Parking Enforcement Program 14.00 15.00 15.00 15.00 0.00%<br />
Total Full-Time FTE 106.00 107.00 106.00 105.00 (0.94%)<br />
Utility Accounts Program 0.50 0.50 0.50 0.50 0.00%<br />
Total Part-Time FTE 0.50 0.50 0.50 0.50 0.00%<br />
Total FTE 106.50 107.50 106.50 105.50 (0.94%)<br />
- In FY12 the Billing and Collections Department's <strong>budget</strong> decreased 8.41% due to a Special Assessment Supervisor was eliminated ($72,616).<br />
Also for FY12, the credit card settlement expense increased ($97,000).<br />
- The Billing and Collections base <strong>budget</strong> also decreased from FY11 due to the change in the way the ICS charges were allocated.<br />
- The Parking Enforcement Program's <strong>budget</strong> will decrease 1.93% due to changes in the following services and commodities - contract<br />
employees, other special services - external, and r/m other equipment maintenance.<br />
- Revenue changes include the following: increase parking meter rates from $0.75 to $1.00 per hour, increase the price <<strong>st</strong>rong>of</<strong>st</strong>rong> parking tickets by<br />
$5.00 for red zone parking tickets and add additional parking meters in the downtown area.<br />
The Billing & Collections Department's fir<strong>st</strong> two performance measure address the Mayor's goal <<strong>st</strong>rong>of</<strong>st</strong>rong> Service while the la<strong>st</strong> performance measure<br />
is linked to the goals <<strong>st</strong>rong>of</<strong>st</strong>rong> Su<strong>st</strong>ainability and Small Business.<br />
Objective and Performance Measure<br />
Unit Of<br />
Measure<br />
FY 2009<br />
Actual<br />
FY 2010<br />
Actual<br />
FY 2011<br />
Target<br />
FY2011<br />
E<strong>st</strong>imate<br />
FY 2012<br />
Proposed<br />
Improving City Operations<br />
To minimize cu<strong>st</strong>omer wait time and assi<strong>st</strong> cu<strong>st</strong>omers with utility issues<br />
Cu<strong>st</strong>omer Service Call Center - Daily Delay Time seconds 62 69 90 75 90<br />
Cu<strong>st</strong>omer Service Call Center-Abandoned Calls (Hang ups) % 2.50 2.72 10.00 2.7 10<br />
Improving City Operations<br />
To reduce the number <<strong>st</strong>rong>of</<strong>st</strong>rong> uncollectible accounts and keep utility rates as low as possible.<br />
Percent Utility Account Write-Offs % 0.35 0.35 0.50 0.35 0.5<br />
Promoting Economic Opportunity<br />
To coordinate and collect all revenue for the City.<br />
Businesses, Number Paying Tax # 15,768 15,054 16,000 15,000 15,000<br />
192
Department Mission Statement<br />
City <<strong>st</strong>rong>of</<strong>st</strong>rong> St. Petersburg, Florida - FY 2012 Proposed Fiscal Plan<br />
Budget & Management Department<br />
The mission <<strong>st</strong>rong>of</<strong>st</strong>rong> the Budget & Management Department is to facilitate the responsible use <<strong>st</strong>rong>of</<strong>st</strong>rong> City resources, which support services that meet community goals.<br />
Services Provided<br />
The Budget & Management Department provides the following services:<br />
• Citywide <strong>operating</strong> <strong>budget</strong> preparation.<br />
• Citywide Capital Improvement Program (CIP) <strong>budget</strong> preparation.<br />
• Budget monitoring.<br />
• Departmental <strong>budget</strong> support.<br />
• Position control.<br />
• Budget analysis and planning.<br />
Budgetary Co<strong>st</strong> Summary<br />
FY 2009<br />
Actual<br />
FY 2010<br />
Actual<br />
FY 2011<br />
Adopted<br />
FY 2011<br />
Amended<br />
FY 2011<br />
E<strong>st</strong>imated<br />
FY 2012<br />
Proposed<br />
FY 2012<br />
Change<br />
Wages And Benefits 704,147 707,797 701,045 701,045 645,635 (1,762,758) (351.45%)<br />
Services And Commodities 906,090 1,140,367 221,104 221,182 504,994 179,772 (18.69%)<br />
Transfers Out 5,367,000 4,662,700 4,214,335 4,214,335 4,224,335 3,993,000 (5.25%)<br />
Contingencies 0 0 362,953 262,953 0 1,224,968 237.50%<br />
Total Budget 6,977,237 6,510,864 5,499,437 5,399,515 5,374,964 3,634,982 (33.90%)<br />
Appropriations By Fund/Program<br />
FY 2009<br />
Actual<br />
FY 2010<br />
Actual<br />
FY 2011<br />
Adopted<br />
FY 2011<br />
Amended<br />
FY 2011<br />
E<strong>st</strong>imated<br />
FY 2012<br />
Proposed<br />
FY 2012<br />
Change<br />
General Operating Fund<br />
Budget & Management Support Program 462,455 426,805 449,614 449,692 440,215 451,804 0.49%<br />
Budget Admini<strong>st</strong>ration Program 1,147,783 1,421,359 458,535 458,535 705,746 293,024 (36.10%)<br />
Subsidies & Contingency Program 5,367,000 4,662,700 4,577,288 4,477,288 4,224,335 2,876,154 (37.16%)<br />
Totals for General Operating Fund 6,977,237 6,510,864 5,485,437 5,385,515 5,370,296 3,620,982 (33.99%)<br />
Technology & Infra<strong>st</strong>ructure Fund<br />
Budget & Management Support Program 0 0 14,000 14,000 4,668 14,000 0.00%<br />
Total Budget 6,977,237 6,510,864 5,499,437 5,399,515 5,374,964 3,634,982 (33.90%)<br />
Revenue Sources<br />
FY 2009<br />
Actual<br />
FY 2010<br />
Actual<br />
FY 2011<br />
Adopted<br />
FY 2011<br />
Amended<br />
FY 2011<br />
E<strong>st</strong>imated<br />
FY 2012<br />
Proposed<br />
FY 2012<br />
Change<br />
Federal Grants 632,340 867,660 0 0 0 0 0.00%<br />
Intere<strong>st</strong> Earnings 0 0 0 0 40,028 0 0.00%<br />
Misc Revenue 104 106 0 0 0 0 0.00%<br />
General & Admini<strong>st</strong>rative 262,260 412,092 424,452 424,452 424,452 447,492 5.43%<br />
Transfer From Jame<strong>st</strong>own Complex 0 0 35,000 35,000 35,000 35,000 0.00%<br />
General Fund 6,082,533 5,231,007 5,025,985 4,926,063 4,910,844 3,138,490 (37.55%)<br />
Technology & Infra<strong>st</strong>ructure<br />
Fund<br />
0 0 14,000 14,000 (35,360) 14,000 0.00%<br />
Total Revenue 6,977,237 6,510,864 5,499,437 5,399,515 5,374,964 3,634,982 (33.90%)<br />
193
City <<strong>st</strong>rong>of</<strong>st</strong>rong> St. Petersburg, Florida - FY 2012 Proposed Fiscal Plan<br />
Position Summary<br />
FY 2009<br />
Actual<br />
FY 2010<br />
Actual<br />
FY 2011<br />
Adopted<br />
FY 2012<br />
Proposed<br />
FY 2012<br />
Change<br />
Budget Admini<strong>st</strong>ration Program 3.00 2.50 2.50 1.00 (60.00%)<br />
Budget & Management Support Program 5.00 5.00 5.00 5.00 0.00%<br />
Total Full-Time FTE 8.00 7.50 7.50 6.00 (20.00%)<br />
Total FTE 8.00 7.50 7.50 6.00 (20.00%)<br />
- The Budget & Management Department is faced with developing and managing an efficient <strong>budget</strong> in a time <<strong>st</strong>rong>of</<strong>st</strong>rong> economic uncertainty.<br />
- In FY12, about $2.3 million <<strong>st</strong>rong>of</<strong>st</strong>rong> <strong>budget</strong>ed salary savings will be shown in the Budget Department's <strong>budget</strong> in<strong>st</strong>ead <<strong>st</strong>rong>of</<strong>st</strong>rong> the individual departments'<br />
<strong>budget</strong>s. For this reason and other reductions the Department's General Fund <strong>budget</strong> will decrease by 33.90%.<br />
- About $221,300 <<strong>st</strong>rong>of</<strong>st</strong>rong> the change is due to lower subsidies transferred out.<br />
- The Department will also eliminate the full-time Executive Secretary that is currently shared with another department ($33,260) and reduce<br />
other various line items by $5,560 for additional savings.<br />
- The Contracts/Grants Officer will be moved to the new Education & Government Services program in the Mayor's Office reducing the<br />
Department's <strong>budget</strong> by $90,642.<br />
- Technology internal charges were also reduced by about $37,000.<br />
The Budget and Management Department's fir<strong>st</strong> performance measure addresses the Mayor's goal <<strong>st</strong>rong>of</<strong>st</strong>rong> Su<strong>st</strong>ainability. The second performance<br />
measure is linked to the Mayor's goal <<strong>st</strong>rong>of</<strong>st</strong>rong> Service.<br />
Objective and Performance Measure<br />
Unit Of<br />
Measure<br />
FY 2009<br />
Actual<br />
FY 2010<br />
Actual<br />
FY 2011<br />
Target<br />
FY2011<br />
E<strong>st</strong>imate<br />
FY 2012<br />
Proposed<br />
Budget Effectiveness<br />
The objective <<strong>st</strong>rong>of</<strong>st</strong>rong> Budget Admini<strong>st</strong>ration is to develop a balanced annual <strong>budget</strong> and have e<strong>st</strong>ablished processes in place to effectively monitor and<br />
control the <strong>budget</strong> so that both revenues and expenditures are within<br />
2% at fiscal year end.<br />
Actual vs. Adopted Routine General Fund Expenditures % -0.04 -1 2 -0.28 2<br />
Budget Effectiveness<br />
The objective <<strong>st</strong>rong>of</<strong>st</strong>rong> Budget Admini<strong>st</strong>ration is to develop a balanced annual <strong>budget</strong> and have e<strong>st</strong>ablished processes in place to effectively monitor and<br />
control the <strong>budget</strong> so that both revenues and expenditures are within +-2% at fiscal year end.<br />
Actual vs. Adopted Routine General Fund Revenues % -2.59 0.46 2 1.25 2<br />
Efficient Operation <<strong>st</strong>rong>of</<strong>st</strong>rong> City<br />
Ensure the efficient operation <<strong>st</strong>rong>of</<strong>st</strong>rong> <<strong>st</strong>rong>city</<strong>st</strong>rong> government to provide community services at a reduced co<strong>st</strong> as measured by the City's millage rate.<br />
Millage Rate # 5.9125 5.9125 5.9125 5.9125 5.9125<br />
194
Department Mission Statement<br />
City <<strong>st</strong>rong>of</<strong>st</strong>rong> St. Petersburg, Florida - FY 2012 Proposed Fiscal Plan<br />
City Clerk<br />
The mission <<strong>st</strong>rong>of</<strong>st</strong>rong> the City Clerk's Office is to preserve the City's hi<strong>st</strong>ory through maintenance <<strong>st</strong>rong>of</<strong>st</strong>rong> its legal documents and proceedings <<strong>st</strong>rong>of</<strong>st</strong>rong> City Council, conduct City<br />
elections, and safeguard City <strong>st</strong>aff, <<strong>st</strong>rong>of</<strong>st</strong>rong>ficials, residents, and property.<br />
Services Provided<br />
The City Clerk's Office provides the following services:<br />
• Provides overall admini<strong>st</strong>rative and support services for all the programs <<strong>st</strong>rong>of</<strong>st</strong>rong> this department.<br />
• Preserves the City's hi<strong>st</strong>ory through maintenance <<strong>st</strong>rong>of</<strong>st</strong>rong> its books, records, legal documents, and journals <<strong>st</strong>rong>of</<strong>st</strong>rong> the proceeds <<strong>st</strong>rong>of</<strong>st</strong>rong> the City Council.<br />
• Organizes, manages, and coordinates City elections and provides assi<strong>st</strong>ance to candidates.<br />
• Responds to public records reque<strong>st</strong>s by coordinating with departments and providing records on a timely basis per Florida Statute Chapter 119.<br />
• Performs research for <strong>st</strong>aff, elected <<strong>st</strong>rong>of</<strong>st</strong>rong>ficials, other governmental entities, and residents.<br />
• Video <strong>st</strong>reams all City Council meetings.<br />
• E<strong>st</strong>ablishes and admini<strong>st</strong>ers, with the assi<strong>st</strong>ance <<strong>st</strong>rong>of</<strong>st</strong>rong> departmental records coordinators, a records management program directed to the application <<strong>st</strong>rong>of</<strong>st</strong>rong> efficient<br />
and economical management methods relating to the creation, utilization, maintenance, retention, preservation, and disposal <<strong>st</strong>rong>of</<strong>st</strong>rong> records per the Florida Department<br />
<<strong>st</strong>rong>of</<strong>st</strong>rong> State Division <<strong>st</strong>rong>of</<strong>st</strong>rong> Library & Archives <<strong>st</strong>rong>of</<strong>st</strong>rong> Florida.<br />
• Provides efficient and timely sorting, delivery, and pickup <<strong>st</strong>rong>of</<strong>st</strong>rong> mail.<br />
• Safeguards City <strong>st</strong>aff, <<strong>st</strong>rong>of</<strong>st</strong>rong>ficials, and residents.<br />
• Safeguards City property.<br />
Budgetary Co<strong>st</strong> Summary<br />
FY 2009<br />
Actual<br />
FY 2010<br />
Actual<br />
FY 2011<br />
Adopted<br />
FY 2011<br />
Amended<br />
FY 2011<br />
E<strong>st</strong>imated<br />
FY 2012<br />
Proposed<br />
FY 2012<br />
Change<br />
Wages And Benefits 960,377 932,684 931,316 931,316 928,760 964,653 3.58%<br />
Services And Commodities 605,480 536,799 571,246 571,246 332,095 571,242 (0.00%)<br />
Capital 5,148 0 0 0 0 0 0.00%<br />
Total Budget 1,571,005 1,469,483 1,502,562 1,502,562 1,260,855 1,535,895 2.22%<br />
Appropriations By Fund/Program<br />
FY 2009<br />
Actual<br />
FY 2010<br />
Actual<br />
FY 2011<br />
Adopted<br />
FY 2011<br />
Amended<br />
FY 2011<br />
E<strong>st</strong>imated<br />
FY 2012<br />
Proposed<br />
FY 2012<br />
Change<br />
General Operating Fund<br />
City Clerk Admini<strong>st</strong>ration Program 606,186 582,563 593,728 593,728 488,380 585,155 (1.44%)<br />
City Clerk Program 259,762 227,707 231,939 231,939 172,525 232,784 0.36%<br />
Mail Room Program 109,763 113,692 108,826 108,826 87,585 110,039 1.11%<br />
Records Retention Program 237,068 240,275 238,085 238,085 215,365 267,226 12.24%<br />
Totals for General Operating Fund 1,212,779 1,164,238 1,172,578 1,172,578 963,855 1,195,204 1.93%<br />
Municipal Office Buildings<br />
Building Security Program 358,226 305,246 329,984 329,984 297,000 340,691 3.24%<br />
Total Budget 1,571,005 1,469,483 1,502,562 1,502,562 1,260,855 1,535,895 2.22%<br />
Revenue Sources<br />
FY 2009<br />
Actual<br />
FY 2010<br />
Actual<br />
FY 2011<br />
Adopted<br />
FY 2011<br />
Amended<br />
FY 2011<br />
E<strong>st</strong>imated<br />
FY 2012<br />
Proposed<br />
FY 2012<br />
Change<br />
General Government 9,895 3,732 5,800 5,800 1,366 5,800 0.00%<br />
Other Charges For Services 84 (30) 0 0 88 0 0.00%<br />
Violation Of Local Ordinances 200 851 0 0 0 0 0.00%<br />
Misc Revenue 0 16 0 0 0 0 0.00%<br />
General & Admini<strong>st</strong>rative 361,668 446,088 459,468 459,468 459,468 459,468 0.00%<br />
Other Charges 2 0 0 0 0 0 0.00%<br />
General Fund 840,930 713,581 707,310 707,310 502,933 729,936 3.20%<br />
Municipal Office Buildings 358,226 305,246 329,984 329,984 297,000 340,691 3.24%<br />
195
Revenue Sources<br />
City <<strong>st</strong>rong>of</<strong>st</strong>rong> St. Petersburg, Florida - FY 2012 Proposed Fiscal Plan<br />
FY 2009<br />
Actual<br />
FY 2010<br />
Actual<br />
FY 2011<br />
Adopted<br />
FY 2011<br />
Amended<br />
FY 2011<br />
E<strong>st</strong>imated<br />
FY 2012<br />
Proposed<br />
FY 2012<br />
Change<br />
Total Revenue 1,571,005 1,469,483 1,502,562 1,502,562 1,260,855 1,535,895 2.22%<br />
Position Summary<br />
FY 2009<br />
Actual<br />
FY 2010<br />
Actual<br />
FY 2011<br />
Adopted<br />
FY 2012<br />
Proposed<br />
FY 2012<br />
Change<br />
City Clerk Admini<strong>st</strong>ration Program 2.00 2.00 2.00 2.00 0.00%<br />
City Clerk Program 2.00 2.00 2.00 2.00 0.00%<br />
Records Retention Program 3.00 3.00 3.00 3.00 0.00%<br />
Mail Room Program 2.00 2.00 2.00 2.00 0.00%<br />
Building Security Program 7.00 7.00 7.00 6.00 (14.29%)<br />
Total Full-Time FTE 16.00 16.00 16.00 15.00 (6.25%)<br />
City Clerk Admini<strong>st</strong>ration Program 0.50 0.50 0.50 0.50 0.00%<br />
Records Retention Program 0.50 0.50 0.50 0.50 0.00%<br />
Building Security Program 0.00 0.00 0.00 0.75 0.00%<br />
Total Part-Time FTE 1.00 1.00 1.00 1.75 75.00%<br />
Total FTE 17.00 17.00 17.00 16.75 (1.47%)<br />
- In FY12, Funding was reduced for a part-time vacant Micrographics Technician ($2,570). Also, various line items were reduced in services<br />
and commodities including legal and fiscal, other special services, and electric.<br />
- Enhancements include increase advertising, increase mileage reimbursement, tuition reimbursement and increase copy machine co<strong>st</strong> - external<br />
($3,905).<br />
- In FY12, for the Municipal <<strong>st</strong>rong>of</<strong>st</strong>rong>fice Buildings (Security) department a filled full-time Security Officer was reduced to part-time 30 hrs/wk<br />
($17,998). Also, data processing charges increased due to the change in the way the ICS charges were allocated $9,360.<br />
The City Clerk Department's performance measures address the Mayor's goal <<strong>st</strong>rong>of</<strong>st</strong>rong> Service.<br />
Objective and Performance Measure<br />
Unit Of<br />
Measure<br />
FY 2009<br />
Actual<br />
FY 2010<br />
Actual<br />
FY 2011<br />
Target<br />
FY2011<br />
E<strong>st</strong>imate<br />
FY 2012<br />
Proposed<br />
Council Support<br />
An objective <<strong>st</strong>rong>of</<strong>st</strong>rong> the City Clerk is to provide support to the City Council by recording meeting and transcribing minutes.<br />
Minutes Recorded # 198 206 180 200 200<br />
Disposition<br />
An objective <<strong>st</strong>rong>of</<strong>st</strong>rong> Records Retention is to dispose <<strong>st</strong>rong>of</<strong>st</strong>rong> 1,200 cubic feet <<strong>st</strong>rong>of</<strong>st</strong>rong> obsolete records per year.<br />
Records Disposed # 2,470 1,475 1,200 1,200 1,200<br />
Filming<br />
An objective <<strong>st</strong>rong>of</<strong>st</strong>rong> Records Retention is to film 800,000 pages <<strong>st</strong>rong>of</<strong>st</strong>rong> <strong>st</strong>andard size documents.<br />
Pages Filmed # 1,076,039 933,685 850,000 800,000 800,000<br />
196
Department Mission Statement<br />
City <<strong>st</strong>rong>of</<strong>st</strong>rong> St. Petersburg, Florida - FY 2012 Proposed Fiscal Plan<br />
City Council<br />
The mission <<strong>st</strong>rong>of</<strong>st</strong>rong> the City Council is to govern the City <<strong>st</strong>rong>of</<strong>st</strong>rong> St. Petersburg in the intere<strong>st</strong> <<strong>st</strong>rong>of</<strong>st</strong>rong> its citizens.<br />
Services Provided<br />
The Mayor's Office provides the following services:<br />
• Provides executive leadership, implementation, and oversight in delivering <<strong>st</strong>rong>city</<strong>st</strong>rong> services.<br />
• Defines <<strong>st</strong>rong>city</<strong>st</strong>rong> initiatives and sets implementation priorities.<br />
• E<strong>st</strong>ablishes organizational <strong>st</strong>ructure and <strong>st</strong>affing.<br />
• Works with City Council, businesses, and residents to ensure the safety, health, and prosperity <<strong>st</strong>rong>of</<strong>st</strong>rong> the City.<br />
• Responds to and tracks citizen and Council complaints and concerns through the <<strong>st</strong>rong>city</<strong>st</strong>rong>'s Action Center.<br />
• Submits the annual Mayor's <strong>budget</strong> recommendation to City Council and reports on the finances <<strong>st</strong>rong>of</<strong>st</strong>rong> the City.<br />
• Confers with the school board, county, <strong>st</strong>ate and local educational agencies to coordinate and enhance services within the City <<strong>st</strong>rong>of</<strong>st</strong>rong> St. Petersburg.<br />
• Solicits private funding for college scholarships for economically disadvantaged youth.<br />
Budgetary Co<strong>st</strong> Summary<br />
FY 2009<br />
Actual<br />
FY 2010<br />
Actual<br />
FY 2011<br />
Adopted<br />
FY 2011<br />
Amended<br />
FY 2011<br />
E<strong>st</strong>imated<br />
FY 2012<br />
Proposed<br />
FY 2012<br />
Change<br />
Wages And Benefits 770,212 762,212 737,034 737,034 720,798 695,645 (5.62%)<br />
Services And Commodities 144,876 124,969 112,983 120,983 116,821 127,811 13.12%<br />
Total Budget 915,088 887,181 850,017 858,017 837,619 823,456 (3.12%)<br />
Appropriations By Fund/Program<br />
FY 2009<br />
Actual<br />
FY 2010<br />
Actual<br />
FY 2011<br />
Adopted<br />
FY 2011<br />
Amended<br />
FY 2011<br />
E<strong>st</strong>imated<br />
FY 2012<br />
Proposed<br />
FY 2012<br />
Change<br />
General Operating Fund<br />
City Council Program 915,088 887,181 850,017 858,017 837,619 823,456 (3.12%)<br />
Total Budget 915,088 887,181 850,017 858,017 837,619 823,456 (3.12%)<br />
Revenue Sources<br />
FY 2009<br />
Actual<br />
FY 2010<br />
Actual<br />
FY 2011<br />
Adopted<br />
FY 2011<br />
Amended<br />
FY 2011<br />
E<strong>st</strong>imated<br />
FY 2012<br />
Proposed<br />
FY 2012<br />
Change<br />
Misc Revenue 48 80 0 0 0 0 0.00%<br />
General & Admini<strong>st</strong>rative 409,104 382,188 393,648 393,648 393,648 393,648 0.00%<br />
General Fund 505,936 504,913 456,369 464,369 443,971 429,808 (5.82%)<br />
Total Revenue 915,088 887,181 850,017 858,017 837,619 823,456 (3.12%)<br />
Position Summary<br />
FY 2009<br />
Actual<br />
FY 2010<br />
Actual<br />
FY 2011<br />
Adopted<br />
FY 2012<br />
Proposed<br />
FY 2012<br />
Change<br />
City Council Program 4.00 4.00 4.00 4.00 0.00%<br />
Total Full-Time FTE 4.00 4.00 4.00 4.00 0.00%<br />
City Council Program 8.00 8.00 8.00 8.00 0.00%<br />
Total Part-Time FTE 8.00 8.00 8.00 8.00 0.00%<br />
Total FTE 12.00 12.00 12.00 12.00 0.00%<br />
197
City <<strong>st</strong>rong>of</<strong>st</strong>rong> St. Petersburg, Florida - FY 2012 Proposed Fiscal Plan<br />
No new reduction packages for FY12. There were two reductions put in place in the la<strong>st</strong> two years that were originally intended to be one year<br />
reductions. These are <strong>proposed</strong> to be continued in the FY12 <strong>budget</strong>. They are:<br />
- 3% reduction in council salaries ($9,600)<br />
- Reduction in monthly allowance ($24,000)<br />
198
Department Mission Statement<br />
City <<strong>st</strong>rong>of</<strong>st</strong>rong> St. Petersburg, Florida - FY 2012 Proposed Fiscal Plan<br />
Finance Department<br />
The mission <<strong>st</strong>rong>of</<strong>st</strong>rong> the Finance Department is to maintain, at the highe<strong>st</strong> level possible, the credibility <<strong>st</strong>rong>of</<strong>st</strong>rong> the financial information flowing from the Finance<br />
Department; to ensure that City employees, cu<strong>st</strong>omers, vendors, contractors, and other firms, following the policies set forth by City Council and e<strong>st</strong>ablished<br />
procedures, are all treated on an equal basis regarding the opportunities to provide services in the financial area and disbursements <<strong>st</strong>rong>of</<strong>st</strong>rong> funds; to consi<strong>st</strong>ently review<br />
the methods used so as to have the mo<strong>st</strong> co<strong>st</strong>-effective means <<strong>st</strong>rong>of</<strong>st</strong>rong> accomplishing the mission <<strong>st</strong>rong>of</<strong>st</strong>rong> the Finance Department with a high level <<strong>st</strong>rong>of</<strong>st</strong>rong> performance by<br />
departmental <strong>st</strong>aff.<br />
Services Provided<br />
The Finance Department provides the following services:<br />
• Assures that all City accounting transactions are processed correctly and report financial information concerning the City in conformance with federal, <strong>st</strong>ate,<br />
and local <strong>st</strong>atutes, and generally accepted accounting principles.<br />
• Delivers service the City employees, retirees, and vendors with correct and on-time issuance <<strong>st</strong>rong>of</<strong>st</strong>rong> payroll, retirement and vendor payments, as well as to answer<br />
all que<strong>st</strong>ions relating to these functions.<br />
• Provides a pr<<strong>st</strong>rong>of</<strong>st</strong>rong>essional level <<strong>st</strong>rong>of</<strong>st</strong>rong> inve<strong>st</strong>ment activities which achieve and maintain confidence in the Treasury Division.<br />
• Provides admini<strong>st</strong>ration and support services for all <<strong>st</strong>rong>of</<strong>st</strong>rong> the programs within this department.<br />
Budgetary Co<strong>st</strong> Summary<br />
FY 2009<br />
Actual<br />
FY 2010<br />
Actual<br />
FY 2011<br />
Adopted<br />
FY 2011<br />
Amended<br />
FY 2011<br />
E<strong>st</strong>imated<br />
FY 2012<br />
Proposed<br />
FY 2012<br />
Change<br />
Wages And Benefits 1,364,651 1,381,929 1,312,422 1,312,422 1,238,839 1,298,559 (1.06%)<br />
Services And Commodities 2,325,259 2,122,343 2,037,048 2,045,722 1,944,902 1,278,661 (37.23%)<br />
Capital 0 0 0 0 11,250 0 0.00%<br />
Debt 61,472,012 38,187,894 36,963,739 37,034,739 35,851,250 40,620,040 9.89%<br />
Transfers Out 149,391,643 172,670,491 28,139,209 35,078,865 33,182,186 27,900,952 (0.85%)<br />
Total Budget 214,553,564 214,362,656 68,452,418 75,471,748 72,228,427 71,098,212 3.87%<br />
Appropriations By Fund/Program<br />
FY 2009<br />
Actual<br />
FY 2010<br />
Actual<br />
FY 2011<br />
Adopted<br />
FY 2011<br />
Amended<br />
FY 2011<br />
E<strong>st</strong>imated<br />
FY 2012<br />
Proposed<br />
FY 2012<br />
Change<br />
General Operating Fund<br />
Debt, Reserves & CIP Transfers 7,859,553 2,989,711 7,256,231 7,724,231 7,615,531 7,127,249 (1.78%)<br />
Disbursements, Cash & Debt Management<br />
7,984,880 7,275,013 2,345,427 2,353,951 2,568,919 1,982,484 (15.47%)<br />
Program<br />
General Accounting & Reporting Program 905,226 782,098 763,917 764,067 509,937 402,605 (47.30%)<br />
Totals for General Operating Fund 16,749,659 11,046,822 10,365,575 10,842,249 10,694,387 9,512,338 (8.23%)<br />
Indu<strong>st</strong>rial Development<br />
Non-Department Program 0 123,710 0 0 0 0 0.00%<br />
Economic Stability<br />
Debt, Reserves & CIP Transfers 1,047,643 0 0 0 0 0 0.00%<br />
Health Facilities Authority<br />
Debt, Reserves & CIP Transfers 175 175 14,000 14,000 175 14,000 0.00%<br />
Utility Tax Revenue<br />
Debt, Reserves & CIP Transfers 36,462,221 41,661,849 0 0 0 0 0.00%<br />
Local Option Tax Revenue<br />
Debt, Reserves & CIP Transfers 27,224,846 25,908,004 0 0 0 0 0.00%<br />
Franchise Tax Revenue<br />
Debt, Reserves & CIP Transfers 24,066,443 21,018,607 0 0 0 0 0.00%<br />
Excise Tax Revenue<br />
Debt, Reserves & CIP Transfers 22,032,872 19,765,678 831,495 831,495 831,495 1,431,495 72.16%<br />
Emergency Medical Services<br />
Non-Department Program 0 0 0 6,950 0 0 0.00%<br />
Parking Revenue<br />
Parking Revenue Program 106,251 250,000 205,000 205,000 205,000 404,580 97.36%<br />
199
City <<strong>st</strong>rong>of</<strong>st</strong>rong> St. Petersburg, Florida - FY 2012 Proposed Fiscal Plan<br />
Appropriations By Fund/Program<br />
FY 2009<br />
Actual<br />
FY 2010<br />
Actual<br />
FY 2011<br />
Adopted<br />
FY 2011<br />
Amended<br />
FY 2011<br />
E<strong>st</strong>imated<br />
FY 2012<br />
Proposed<br />
FY 2012<br />
Change<br />
School Crossing Guard Tru<strong>st</strong><br />
School Crossing Guards Program 658,542 355,437 300,000 300,000 300,000 300,000 0.00%<br />
Weeki Wachee<br />
Weeki Wachee Program 106,707 75,871 60,000 1,742,000 1,742,084 100,000 66.67%<br />
Pro Sports Facility<br />
Debt, Reserves & CIP Transfers 2,000,004 2,000,004 2,000,004 2,000,004 2,000,004 2,000,004 0.00%<br />
Economic Development<br />
Non-Department Program 0 12,636 0 0 0 0 0.00%<br />
Downtown Redevelopment Di<strong>st</strong>rict<br />
Debt, Reserves & CIP Transfers<br />
Non-Department Program<br />
5,645,697<br />
0<br />
10,528,854<br />
0<br />
7,533,729<br />
0<br />
12,083,435<br />
0<br />
12,041,435<br />
36,126<br />
8,169,124<br />
0<br />
8.43%<br />
0.00%<br />
Totals for Downtown Redevelopment<br />
Di<strong>st</strong>rict<br />
5,645,697 10,528,854 7,533,729 12,083,435 12,077,561 8,169,124 8.43%<br />
Assessments Revenue<br />
Debt, Reserves & CIP Transfers 256,900 177,156 166,126 166,126 55,376 98,131 (40.93%)<br />
Community Redevelopment Di<strong>st</strong>rict<br />
Debt, Reserves & CIP Transfers 9,259,610 11,347,559 6,712,750 6,712,750 6,712,750 6,703,500 (0.14%)<br />
Ffgfc Loan<br />
Debt, Reserves & CIP Transfers 1,714,760 2,697,021 2,696,760 2,696,760 2,696,760 2,706,550 0.36%<br />
Banc Of America Notes Debt Service<br />
Fund<br />
Debt, Reserves & CIP Transfers 1,172,215 1,173,020 1,178,269 1,178,269 1,178,269 1,181,512 0.28%<br />
Bb&T Notes<br />
Non-Department Program 0 0 0 29,000 29,000 642,396 0.00%<br />
Capital Improvement Variable Rate<br />
Debt<br />
Debt, Reserves & CIP Transfers 2,494,893 0 0 0 0 0 0.00%<br />
Utility Tax Debt Service<br />
Debt, Reserves & CIP Transfers 2,822,500 2,824,064 0 0 0 0 0.00%<br />
Stadium Debt Service<br />
Debt, Reserves & CIP Transfers 8,957,385 8,639,905 8,686,282 8,686,282 8,686,282 8,620,019 (0.76%)<br />
Sports Facility Sales Tax Debt<br />
Debt, Reserves & CIP Transfers 1,921,206 1,912,244 1,913,950 1,913,950 1,913,950 1,911,587 (0.12%)<br />
Redevelopment Debt Service<br />
Debt, Reserves & CIP Transfers 6,463,250 6,680,875 6,712,750 6,712,750 6,712,750 6,703,500 (0.14%)<br />
Water Resources<br />
Admini<strong>st</strong>rative Support Services (1,405,978) (5,648) 0 0 500 0 0.00%<br />
Water Resources Debt<br />
Debt, Reserves & CIP Transfers 35,673,855 13,450,561 15,020,476 15,020,476 13,842,861 18,046,144 20.14%<br />
Water Co<strong>st</strong> Stabilization<br />
Water Co<strong>st</strong> Stabilization Program 5,767,058 2,994,316 3,000,000 3,000,000 1,493,971 1,500,000 (50.00%)<br />
Stormwater Utility Operating<br />
SW Utility Collection & Marine Infra<strong>st</strong>r<br />
Program<br />
699,861 137,856 0 0 0 0 0.00%<br />
Stormwater Debt Service<br />
Debt, Reserves & CIP Transfers 1,052,737 1,053,076 1,055,252 1,055,252 1,055,252 1,053,332 (0.18%)<br />
Sanitation Operating<br />
Non-Department Program 0 342,731 0 0 0 0 0.00%<br />
Fleet Management<br />
Non-Department Program 0 721,716 0 0 0 0 0.00%<br />
Equipment Replacement<br />
Non-Department Program 0 1,757,828 0 0 0 0 0.00%<br />
Municipal Office Buildings<br />
Non-Department Program 0 0 0 275,000 0 0 0.00%<br />
Information & Communication Services<br />
200
Appropriations By Fund/Program<br />
City <<strong>st</strong>rong>of</<strong>st</strong>rong> St. Petersburg, Florida - FY 2012 Proposed Fiscal Plan<br />
FY 2009<br />
Actual<br />
FY 2010<br />
Actual<br />
FY 2011<br />
Adopted<br />
FY 2011<br />
Amended<br />
FY 2011<br />
E<strong>st</strong>imated<br />
FY 2012<br />
Proposed<br />
FY 2012<br />
Change<br />
Non-Department Program 0 1,057,837 0 0 0 0 0.00%<br />
Pc Replacement<br />
Non-Department Program 0 3,638,761 0 0 0 0 0.00%<br />
Radio Replacement<br />
Non-Department Program 0 1,162,851 0 0 0 0 0.00%<br />
Supply Management<br />
Materials Management Program<br />
Non-Department Program<br />
(19,409)<br />
0<br />
(11,395)<br />
249,523<br />
0<br />
0<br />
0<br />
0<br />
0<br />
0<br />
0<br />
0<br />
0.00%<br />
0.00%<br />
Totals for Supply Management (19,409) 238,128 0 0 0 0 0.00%<br />
Life Insurance<br />
Non-Department Program 0 216,035 0 0 0 0 0.00%<br />
General Liabilities Claims<br />
Non-Department Program 0 12,111,560 0 0 0 0 0.00%<br />
Commercial Insurance<br />
Non-Department Program 0 1,533,744 0 0 0 0 0.00%<br />
Billing & Collections<br />
Non-Department Program 0 1,466,197 0 0 0 0 0.00%<br />
Deferred Compensation - Icma<br />
Non-Department Program 1,621,663 4,285,615 0 0 0 0 0.00%<br />
Total Budget 214,553,564 214,362,656 68,452,418 75,471,748 72,228,427 71,098,212 3.87%<br />
Revenue Sources<br />
FY 2009<br />
Actual<br />
FY 2010<br />
Actual<br />
FY 2011<br />
Adopted<br />
FY 2011<br />
Amended<br />
FY 2011<br />
E<strong>st</strong>imated<br />
FY 2012<br />
Proposed<br />
FY 2012<br />
Change<br />
Property Taxes 95,140,129 83,484,249 74,922,762 74,922,762 74,922,762 70,116,254 (6.42%)<br />
Franchise Tax 21,014,619 22,159,989 20,814,460 20,814,460 21,280,487 20,724,720 (0.43%)<br />
Utility Tax 38,633,875 39,711,520 39,234,858 39,234,858 39,208,670 39,331,930 0.25%<br />
Business Taxes 2,596,245 2,405,903 2,500,000 2,500,000 2,391,080 2,500,000 0.00%<br />
Contractors Permits 4,750 4,370 500 500 49,769 0 (100.00%)<br />
Other License And Permits 4,250 13,750 5,100 5,100 0 5,100 0.00%<br />
State Shared Revenue 21,695,936 21,522,551 22,398,873 22,398,873 21,199,278 21,147,223 (5.59%)<br />
Shared Revenue 39,047,572 35,467,727 15,556,179 15,556,179 18,448,680 16,919,381 8.76%<br />
General Government 28,423 24,507 34,000 34,000 10,476 34,000 0.00%<br />
Other Charges For Services 361 10 48,600 48,600 48,000 48,600 0.00%<br />
Violation Of Local Ordinances 2,500 0 0 0 0 0 0.00%<br />
Intere<strong>st</strong> Earnings 9,393,064 12,131,670 5,512,629 5,512,629 2,877,528 2,626,712 (52.35%)<br />
Rents And Royalties 94,957 98,718 23,000 23,000 46,027 23,000 0.00%<br />
Special Assessment 104,642 184,011 140,000 140,000 50,000 140,000 0.00%<br />
Sale Of Fixed Assets 0 0 10,000 10,000 0 10,000 0.00%<br />
Contributions And Donations 3,251,744 43,347,793 0 0 0 0 0.00%<br />
Misc Revenue 25,048 67,088 102,695 102,695 880,999 102,695 0.00%<br />
General & Admini<strong>st</strong>rative 829,812 1,084,772 1,438,752 1,438,752 1,438,752 1,461,792 1.60%<br />
Payment In Lieu Of Taxes 13,707,907 14,185,748 14,572,836 14,572,836 14,572,836 14,553,396 (0.13%)<br />
Debt Proceeds 28,286,131 0 0 0 9,968,080 1,188,752 0.00%<br />
Department Charges 501,746 495,448 0 0 0 0 0.00%<br />
Other Charges 0 (123) 0 0 0 0 0.00%<br />
Transfer From General Fund 7,218,918 2,625,421 2,618,006 2,618,006 2,978,006 2,635,316 0.66%<br />
Transfer From Economic Stability 38,048 0 0 0 0 0 0.00%<br />
Transfer From Utility Tax<br />
Revenue<br />
36,462,221 41,659,725 0 0 0 0 0.00%<br />
Transfer From Local Option<br />
Tax Revenue<br />
3,520,087 3,517,996 0 0 0 0 0.00%<br />
Transfer From Franchise Tax<br />
Revenue<br />
23,235,658 21,018,607 0 0 0 0 0.00%<br />
Transfer From Excise Tax Revenue 20,109,732 19,765,678 831,495 831,495 831,495 1,431,495 72.16%<br />
Transfer From Emergency Medical<br />
Services<br />
0 0 0 6,950 6,950 0 0.00%<br />
201
Revenue Sources<br />
City <<strong>st</strong>rong>of</<strong>st</strong>rong> St. Petersburg, Florida - FY 2012 Proposed Fiscal Plan<br />
FY 2009<br />
Actual<br />
FY 2010<br />
Actual<br />
FY 2011<br />
Adopted<br />
FY 2011<br />
Amended<br />
FY 2011<br />
E<strong>st</strong>imated<br />
FY 2012<br />
Proposed<br />
FY 2012<br />
Change<br />
Transfer From Parking Revenue 0 0 100,000 100,000 100,000 404,580 304.58%<br />
Transfer From School Crossing<br />
Guard Tru<strong>st</strong><br />
658,542 355,437 300,000 300,000 300,000 300,000 0.00%<br />
Transfer From Weeki Wachee 0 0 0 0 0 20,000 0.00%<br />
Transfer From Pro Sports Facility 2,000,004 2,000,004 2,000,004 2,000,004 2,000,004 2,000,004 0.00%<br />
Transfer From Downtown Redevelopment<br />
Di<strong>st</strong>rict<br />
5,645,697 7,501,854 7,533,729 7,562,729 7,562,729 8,169,124 8.43%<br />
Transfer From Community Development<br />
Block Grant<br />
285,605 841,153 828,632 828,632 557,847 780,431 (5.82%)<br />
Transfer From Community Redevelopment<br />
Di<strong>st</strong>rict<br />
9,259,610 8,867,559 6,712,750 6,712,750 6,712,750 6,703,500 (0.14%)<br />
Transfer From Stadium Debt<br />
Service<br />
549,888 242,873 300,000 300,000 300,000 245,000 (18.33%)<br />
Transfer From Weeki Wachee<br />
Capital Improvements<br />
155,000 0 0 0 0 0 0.00%<br />
Transfer From Water Resources 12,485,618 14,922,808 14,923,400 14,923,400 14,923,400 17,130,250 14.79%<br />
Transfer From Stormwater Utility<br />
Operating<br />
1,055,061 1,057,856 1,053,000 1,053,000 1,053,000 1,058,000 0.47%<br />
Transfer From Sanitation Operating 455,076 797,807 455,076 455,076 455,076 455,076 0.00%<br />
Transfer From Airport Operating 0 0 50,000 50,000 50,000 50,000 0.00%<br />
Transfer From Marina Operating 300,000 300,000 300,000 300,000 300,000 310,000 3.33%<br />
Transfer From Fleet Management 0 721,716 0 0 0 0 0.00%<br />
Transfer From Equipment Replacement 0 1,757,828 0 0 0 0 0.00%<br />
Transfer From Information<br />
& Communication Services<br />
0 1,457,833 300,000 300,000 300,000 200,000 (33.33%)<br />
Transfer From Pc Replacement 0 3,638,761 0 0 0 0 0.00%<br />
Transfer From Radio Replacement 0 1,162,851 0 0 0 0 0.00%<br />
Transfer From Supply Management 0 249,523 0 0 0 0 0.00%<br />
Transfer From Life Insurance 0 216,035 0 0 0 0 0.00%<br />
Transfer From General Liabilities<br />
Claims<br />
0 12,111,560 0 0 0 0 0.00%<br />
Transfer From Commercial Insurance 0 1,533,744 0 0 0 0 0.00%<br />
Transfer From Billing & Collections 0 1,466,197 0 0 0 0 0.00%<br />
General Fund (172,267,470) (178,053,764) (166,662,654) (166,192,930) (168,636,964) (162,947,908) (2.23%)<br />
Utility Tax Revenue (2,171,642) 9,373,356 0 0 0 0 0.00%<br />
Franchise Tax Revenue 3,847,252 (797,992) 0 0 0 0 0.00%<br />
Water Resources (1,885,245) (544,263) (51,532) (51,532) (26,077) (20,469) (60.28%)<br />
Economic Development 0 12,636 0 0 0 0 0.00%<br />
Preservation Reserve (3,918) (855) (5,000) (5,000) (500) 0 (100.00%)<br />
Excise Tax Revenue 2,165,866 266,975 560,710 560,710 831,495 1,431,495 155.30%<br />
Stadium Debt Service (133,918) (148,375) (160,875) (160,875) 46,757 (172,861) 7.45%<br />
Billing & Collections 5,342 1,466,445 0 0 0 0 0.00%<br />
Pro Sports Facility (1,305) (44) (9,996) (9,996) 2 (3,968) (60.30%)<br />
Local Option Tax Revenue 2,871,901 3,782,900 0 0 0 0 0.00%<br />
Bayboro Harbor Tax Increment<br />
Di<strong>st</strong>rict<br />
0 (151,662) (95,458) (95,458) (95,487) (37,419) (60.80%)<br />
Community Redevelopment Di<strong>st</strong>rict (765,920) 2,501,388 (894,525) (894,525) (884,525) (1,251,399) 39.90%<br />
Intown We<strong>st</strong> Tax Increment<br />
Di<strong>st</strong>rict<br />
0 (502,419) (326,389) (326,389) (326,490) (209,747) (35.74%)<br />
Indu<strong>st</strong>rial Development (482) 123,605 0 0 0 0 0.00%<br />
Health Facilities Authority (9,912) (4,853) 0 0 (4,833) 0 0.00%<br />
Weeki Wachee (1,165,055) (577,728) (240,000) 1,442,000 1,562,084 (19,160) (92.02%)<br />
Marina Operating 0 (286,930) 0 0 0 0 0.00%<br />
Assessments Revenue 114,723 (45,100) (13,874) (13,874) (3,418) (57,757) 316.30%<br />
Sanitation Operating 0 342,731 0 0 0 0 0.00%<br />
Water Resources Debt (5,174,780) (1,623,133) (52,782) (52,782) (6,588,654) (423,969) 703.25%<br />
General Liabilities Claims 0 12,111,560 0 0 0 0 0.00%<br />
Deferred Compensation - Icma (1,821,471) (44,363,568) 0 0 0 0 0.00%<br />
Municipal Office Buildings (25,774) (7,910) 0 275,000 (81) 0 0.00%<br />
Economic Stability (5,260,011) (1,230,749) (500,000) (500,000) (499,846) (198,600) (60.28%)<br />
Water Co<strong>st</strong> Stabilization 0 (793,921) 0 0 0 0 0.00%<br />
Workers' Compensation 0 (5,989,836) 0 0 0 0 0.00%<br />
Technology & Infra<strong>st</strong>ructure<br />
Fund<br />
0 (10,357,139) (98,500) (98,500) (765) (39,124) (60.28%)<br />
Utility Tax Debt Service (667) 941,500 0 0 0 0 0.00%<br />
Downtown Redevelopment Di<strong>st</strong>rict (3,702,888) 2,313,237 820,979 5,370,685 844,308 1,465,624 78.52%<br />
Building Permit Special Revenue (31,064) (2,839) 0 0 (106) 0 0.00%<br />
Equipment Replacement 333 1,696,898 0 0 159 0 0.00%<br />
Commercial Insurance 0 1,533,744 0 0 0 0 0.00%<br />
202
Revenue Sources<br />
City <<strong>st</strong>rong>of</<strong>st</strong>rong> St. Petersburg, Florida - FY 2012 Proposed Fiscal Plan<br />
FY 2009<br />
Actual<br />
FY 2010<br />
Actual<br />
FY 2011<br />
Adopted<br />
FY 2011<br />
Amended<br />
FY 2011<br />
E<strong>st</strong>imated<br />
FY 2012<br />
Proposed<br />
FY 2012<br />
Change<br />
Redevelopment Debt Service 1,633,000 0 0 0 0 0 0.00%<br />
Information & Communication<br />
Services<br />
0 1,057,837 0 0 0 0 0.00%<br />
Fleet Management (3,669) 721,716 0 0 0 0 0.00%<br />
Parking Revenue 106,197 249,992 205,000 205,000 205,000 404,580 97.36%<br />
Ffgfc Loan 517,252 0 0 0 0 0 0.00%<br />
Stormwater Utility Operating 545,577 118,442 0 0 (16,130) 0 0.00%<br />
Pc Replacement 0 3,638,761 0 0 0 0 0.00%<br />
Community Housing Tru<strong>st</strong> (44,527) (89,614) 0 0 (8,588) 0 0.00%<br />
Health Insurance 0 (9,094,985) 0 0 0 0 0.00%<br />
Sanitation Equipment Replacement (19) (342,731) 0 0 0 0 0.00%<br />
Emergency Medical Services 0 0 0 6,950 0 0 0.00%<br />
Stormwater Debt Service (3,243) (5,096) (780) (780) 2,193 (5,000) 541.03%<br />
Bb&T Notes 0 0 0 0 0 0 0.00%<br />
School Crossing Guard Tru<strong>st</strong> 657,203 355,398 300,000 300,000 299,995 300,000 0.00%<br />
Coliseum Operating 0 (77) 0 0 (16) 0 0.00%<br />
Sunken Gardens 0 (46) 0 0 (6) 0 0.00%<br />
Banc Of America Notes Debt<br />
Service Fund<br />
(610,027) 68,384 71,458 71,458 71,949 75,501 5.66%<br />
Community Development Block<br />
Grant<br />
(74) 0 0 0 0 0 0.00%<br />
Arts And Cultural Programs (100,049) (87) 0 0 (19) 0 0.00%<br />
Sports Facility Sales Tax<br />
Debt<br />
(4,031) (17,006) (14,700) (14,700) (7,442) (17,938) 22.03%<br />
Print Shop 0 (58,436) 0 0 0 0 0.00%<br />
Airport Operating 0 (51,469) 0 0 0 0 0.00%<br />
Law Enforcement Tru<strong>st</strong> (1,240) (25) 0 0 0 0 0.00%<br />
Police Grant Tru<strong>st</strong> Funds 0 (11,930) 0 0 (249) 0 0.00%<br />
Golf Course Operating 0 (462,357) 0 0 0 0 0.00%<br />
Supply Management (521,156) (257,322) 0 0 0 0 0.00%<br />
Neighborhood Stabilization<br />
Program<br />
0 0 0 0 (360,000) 0 0.00%<br />
Radio Replacement 0 1,162,851 0 0 0 0 0.00%<br />
Life Insurance 0 216,035 0 0 0 0 0.00%<br />
Total Revenue 214,553,564 214,362,656 68,452,418 75,471,748 72,228,427 71,098,212 3.87%<br />
Position Summary<br />
FY 2009<br />
Actual<br />
FY 2010<br />
Actual<br />
FY 2011<br />
Adopted<br />
FY 2012<br />
Proposed<br />
FY 2012<br />
Change<br />
Disbursements, Cash & Debt Management Program 14.00 14.00 14.00 13.00 (7.14%)<br />
General Accounting & Reporting Program 5.00 5.00 5.00 5.00 0.00%<br />
Total Full-Time FTE 19.00 19.00 19.00 18.00 (5.26%)<br />
Total FTE 19.00 19.00 19.00 18.00 (5.26%)<br />
- The downturn in the United States economy has created a number <<strong>st</strong>rong>of</<strong>st</strong>rong> challenges for the Finance Department, including credit risks to the City's<br />
inve<strong>st</strong>ment portfolio, downgrades in the monoline insurance indu<strong>st</strong>ry, and a debt market that has seen considerable volatility. The Finance<br />
Department continues to work with experts in these fields to minimize the effect on the City's financial condition. To date the Finance<br />
Department has been successful in all these areas.<br />
- In FY12, the Finance Department's General Fund <strong>budget</strong> decreased by 8.23%.<br />
- The Department eliminated an Accountant III and upgraded the Accountant I who will be taking over additional work to an Accountant II for a<br />
$51,176 savings.<br />
- Finance will also po<strong>st</strong>pone a planned inve<strong>st</strong>ment <strong>st</strong>udy reducing its consulting <strong>budget</strong> by $35,000.<br />
- About $129,000 <<strong>st</strong>rong>of</<strong>st</strong>rong> the change can be attributed to decreasing debt payments and other transfers.<br />
- Additionally, the Department's internal service charges (e.g. technology and billing and collections) decreased by about $674,000.<br />
- These reductions were partially <<strong>st</strong>rong>of</<strong>st</strong>rong>fset by an increase <<strong>st</strong>rong>of</<strong>st</strong>rong> $30,000 resulting from <strong>budget</strong>ed salary savings being shown in the Budget<br />
Department's <strong>budget</strong> in<strong>st</strong>ead <<strong>st</strong>rong>of</<strong>st</strong>rong> the individual departments' <strong>budget</strong>s.<br />
- In FY12, Excise Tax Revenue Fund appropriations increase $600,000 over the FY11 Adopted reflecting a onetime use <<strong>st</strong>rong>of</<strong>st</strong>rong> fund balance for<br />
203
City <<strong>st</strong>rong>of</<strong>st</strong>rong> St. Petersburg, Florida - FY 2012 Proposed Fiscal Plan<br />
General Fund balancing.<br />
- Please also note that as a result <<strong>st</strong>rong>of</<strong>st</strong>rong> a new <strong>budget</strong> sy<strong>st</strong>em many funds that are not associated with a single department will appear in the Finance<br />
Department's tables.<br />
The Finance Department's fir<strong>st</strong> performance measure addresses the Mayor's goal <<strong>st</strong>rong>of</<strong>st</strong>rong> Service. While the la<strong>st</strong> two performance measures are<br />
linked to the Mayor's goal <<strong>st</strong>rong>of</<strong>st</strong>rong> Su<strong>st</strong>ainability.<br />
Objective and Performance Measure<br />
Unit Of<br />
Measure<br />
FY 2009<br />
Actual<br />
FY 2010<br />
Actual<br />
FY 2011<br />
Target<br />
FY2011<br />
E<strong>st</strong>imate<br />
FY 2012<br />
Proposed<br />
Direct Check Deposits<br />
The objective <<strong>st</strong>rong>of</<strong>st</strong>rong> Direct Check Deposits is to continue to increase participation in direct depositing <<strong>st</strong>rong>of</<strong>st</strong>rong> all payroll and pension checks in order to<br />
reduce processing and handling co<strong>st</strong>.<br />
Payroll Disbursements Processed by Automated Clearing % 82 85 88 85 88<br />
House<br />
Pension Disbursements Processed by ACH % 81 82 83 82 83<br />
Inve<strong>st</strong>ment Activity<br />
The objective <<strong>st</strong>rong>of</<strong>st</strong>rong> Inve<strong>st</strong>ment Activity is to inve<strong>st</strong> the City’s excess cash in a safe and liquid manner and <strong>st</strong>ill earn intere<strong>st</strong> in excess <<strong>st</strong>rong>of</<strong>st</strong>rong> an overnight<br />
passive inve<strong>st</strong>ment like a regi<strong>st</strong>ered money market inve<strong>st</strong>ment.<br />
Excess/(Deficit) Rate <<strong>st</strong>rong>of</<strong>st</strong>rong> Return % 3.40 2.58 3.00 2.00 2.00<br />
Intere<strong>st</strong> Earning Rate - City's Inve<strong>st</strong>ment Pool % 3.87 2.68 3.25 2.15 2.25<br />
Intere<strong>st</strong> Earning Rate - Money Markets (benchmark) % 0.47 0.10 0.25 0.15 0.25<br />
Pension Funds<br />
The objective <<strong>st</strong>rong>of</<strong>st</strong>rong> Pension Funds is to choose a diversified inve<strong>st</strong>ment portfolio in all three pension plans using inve<strong>st</strong>ment managers to earn a rate <<strong>st</strong>rong>of</<strong>st</strong>rong><br />
return in excess <<strong>st</strong>rong>of</<strong>st</strong>rong> the actuarial assumed rate <<strong>st</strong>rong>of</<strong>st</strong>rong> 8% on a consi<strong>st</strong>ent basis.<br />
Employee Retirement Sy<strong>st</strong>em (ERS) Pension Fund Earning % 4.0 8.5 8.5 7.8 7.8<br />
Rate<br />
Fire Pension Fund Earning Rate % 3.5 9.1 8.5 8.0 8.0<br />
Police Pension Fund Earning Rate % 2.5 8.5 8.5 8.0 8.0<br />
204
Department Mission Statement<br />
City <<strong>st</strong>rong>of</<strong>st</strong>rong> St. Petersburg, Florida - FY 2012 Proposed Fiscal Plan<br />
Human Resources Department<br />
The mission <<strong>st</strong>rong>of</<strong>st</strong>rong> the Human Resources Department is to serve as a positive resource to both employees and departments, whereby the needs <<strong>st</strong>rong>of</<strong>st</strong>rong> both are satisfied to<br />
the fulle<strong>st</strong> extent possible given the City's financial and legal con<strong>st</strong>raints. We mu<strong>st</strong> be accessible, responsive, and committed to presenting the City organization as<br />
a business-like, caring employer to the community. To accomplish this, we mu<strong>st</strong> emphasize communication, a quality cu<strong>st</strong>omer service, equity and objectivity,<br />
and a genuine concern for the individual.<br />
Services Provided<br />
The Human Resources Department provides the following services:<br />
• Provides admini<strong>st</strong>ration and support services for all aspects <<strong>st</strong>rong>of</<strong>st</strong>rong> human resources and risk management to all <<strong>st</strong>rong>of</<strong>st</strong>rong> the programs <<strong>st</strong>rong>of</<strong>st</strong>rong> the City.<br />
Budgetary Co<strong>st</strong> Summary<br />
FY 2009<br />
Actual<br />
FY 2010<br />
Actual<br />
FY 2011<br />
Adopted<br />
FY 2011<br />
Amended<br />
FY 2011<br />
E<strong>st</strong>imated<br />
FY 2012<br />
Proposed<br />
FY 2012<br />
Change<br />
Wages And Benefits 3,608,272 3,491,600 3,610,308 3,659,221 3,414,620 3,792,667 5.05%<br />
Services And Commodities 46,607,524 51,153,677 48,481,850 48,492,913 46,905,160 48,817,860 0.69%<br />
Capital 0 19,363 0 1,875 504,000 0 0.00%<br />
Grants And Aid 163,688 300,582 280,000 468,694 11,387 250,000 (10.71%)<br />
Transfers Out 17,456 15,000 22,896 22,896 22,896 22,896 0.00%<br />
Total Budget 50,396,940 54,980,222 52,395,054 52,645,599 50,858,063 52,883,423 0.93%<br />
Appropriations By Fund/Program<br />
FY 2009<br />
Actual<br />
FY 2010<br />
Actual<br />
FY 2011<br />
Adopted<br />
FY 2011<br />
Amended<br />
FY 2011<br />
E<strong>st</strong>imated<br />
FY 2012<br />
Proposed<br />
FY 2012<br />
Change<br />
General Operating Fund<br />
Civilian Police Review Committee<br />
82,942 79,372 80,140 80,140 73,587 80,851 0.89%<br />
Program<br />
Community Advocacy Program 4,034 0 0 0 0 0 0.00%<br />
Community Affairs Admini<strong>st</strong>ration<br />
482,858 517,282 166,780 166,780 188,727 169,239 1.47%<br />
Program<br />
Employee Development Program 150,200 143,916 190,114 190,114 119,519 182,346 (4.09%)<br />
Employment Program 1,140,769 967,465 1,024,899 1,025,625 825,249 1,019,665 (0.51%)<br />
Group Benefits Program 357,491 206,728 105,293 161,156 157,409 140,773 33.70%<br />
Human Resources Program 970,741 838,208 914,185 914,447 1,704,323 610,287 (33.24%)<br />
Labor Relations Program 315,883 322,553 323,090 323,090 296,312 325,894 0.87%<br />
Non-Department Program 0 111 280,000 468,694 11,474 250,000 (10.71%)<br />
Pension Support Program 746,271 620,457 663,959 663,959 402,762 600,915 (9.50%)<br />
Totals for General Operating Fund 4,251,188 3,696,092 3,748,460 3,994,005 3,779,362 3,379,970 (9.83%)<br />
Parking Revenue<br />
CAPI Program<br />
Non-Department Program<br />
38,935<br />
0<br />
56,362<br />
671<br />
110,342<br />
0<br />
115,342<br />
0<br />
66,563<br />
623<br />
109,610<br />
0<br />
(0.66%)<br />
0.00%<br />
Totals for Parking Revenue 38,935 57,033 110,342 115,342 67,186 109,610 (0.66%)<br />
Health Insurance<br />
Health Insurance Program 33,050,027 32,953,551 33,218,970 33,218,970 31,907,360 34,019,506 2.41%<br />
Life Insurance<br />
Life Insurance Program 820,977 874,930 941,783 941,783 891,183 946,496 0.50%<br />
General Liabilities Claims<br />
Non-Department Program<br />
Self Insurance Program<br />
0<br />
457,956<br />
(22)<br />
1,418,156<br />
0<br />
2,267,799<br />
0<br />
2,267,799<br />
0<br />
2,336,604<br />
0<br />
2,265,672<br />
0.00%<br />
(0.09%)<br />
Totals for General Liabilities Claims 457,956 1,418,134 2,267,799 2,267,799 2,336,604 2,265,672 (0.09%)<br />
Commercial Insurance<br />
Commercial Insurance Program 5,101,762 5,087,356 4,943,843 4,943,843 4,906,315 4,881,431 (1.26%)<br />
205
Appropriations By Fund/Program<br />
City <<strong>st</strong>rong>of</<strong>st</strong>rong> St. Petersburg, Florida - FY 2012 Proposed Fiscal Plan<br />
FY 2009<br />
Actual<br />
FY 2010<br />
Actual<br />
FY 2011<br />
Adopted<br />
FY 2011<br />
Amended<br />
FY 2011<br />
E<strong>st</strong>imated<br />
FY 2012<br />
Proposed<br />
FY 2012<br />
Change<br />
Workers' Compensation<br />
Workers' Compensation Program 6,676,094 10,862,030 7,126,639 7,126,639 6,928,684 7,247,940 1.70%<br />
Deferred Compensation - Icma<br />
Pension Support Program 0 31,097 37,218 37,218 41,369 32,798 (11.88%)<br />
Total Budget 50,396,940 54,980,222 52,395,054 52,645,599 50,858,063 52,883,423 0.93%<br />
Revenue Sources<br />
FY 2009<br />
Actual<br />
FY 2010<br />
Actual<br />
FY 2011<br />
Adopted<br />
FY 2011<br />
Amended<br />
FY 2011<br />
E<strong>st</strong>imated<br />
FY 2012<br />
Proposed<br />
FY 2012<br />
Change<br />
Federal Grants 177,567 300,227 0 244,512 11,387 0 0.00%<br />
General Government (38,319) 36,402 0 0 20,266 0 0.00%<br />
Other Charges For Services 80,184 59,926 0 0 30,734 0 0.00%<br />
Intere<strong>st</strong> Earnings 2,399,319 1,645,567 746,593 746,593 325,484 569,435 (23.73%)<br />
Contributions And Donations 46,754,512 47,702,688 46,826,289 46,826,289 47,115,673 46,717,144 (0.23%)<br />
Misc Revenue 416,828 499,052 846,746 846,746 640,945 846,746 0.00%<br />
General & Admini<strong>st</strong>rative 2,096,712 1,867,104 1,923,156 1,923,156 1,923,156 1,923,156 0.00%<br />
General Fund 1,976,661 1,527,575 1,478,299 1,479,332 1,504,398 1,109,809 (24.93%)<br />
Parking Revenue 38,935 57,033 110,342 115,342 67,186 109,610 (0.66%)<br />
General Liabilities Claims (3,082,359) (1,867,984) 12,799 12,799 180,900 15,637 22.17%<br />
Workers' Compensation 422,494 3,738,884 (3,261) (3,261) (347,121) 189,849 (5921.80%)<br />
Billing & Collections 76 (310) 0 0 (9) 0 0.00%<br />
Commercial Insurance (97,560) (257,298) (157) (157) (39,344) 1,968 (1353.50%)<br />
Health Insurance (796,533) (435,467) 483,010 483,010 (496,682) 1,368,347 183.30%<br />
Municipal Office Buildings (34) 0 0 0 0 0 0.00%<br />
Life Insurance 48,458 75,725 134,020 134,020 79,721 198,924 48.43%<br />
Deferred Compensation - Icma 0 31,097 (162,782) (162,782) (158,631) (167,202) 2.72%<br />
Total Revenue 50,396,940 54,980,222 52,395,054 52,645,599 50,858,063 52,883,423 0.93%<br />
Position Summary<br />
FY 2009<br />
Actual<br />
FY 2010<br />
Actual<br />
FY 2011<br />
Adopted<br />
FY 2012<br />
Proposed<br />
FY 2012<br />
Change<br />
Community Affairs Admini<strong>st</strong>ration Program 2.00 2.00 2.00 1.80 (10.00%)<br />
Civilian Police Review Committee Program 1.00 1.00 1.00 1.00 0.00%<br />
Employment Program 10.00 10.00 10.00 10.00 0.00%<br />
Group Benefits Program 5.00 2.00 3.00 2.00 (33.33%)<br />
Employee Development Program 2.00 2.00 2.00 2.00 0.00%<br />
Human Resources Program 1.50 1.70 1.70 1.70 0.00%<br />
Labor Relations Program 4.00 3.00 3.00 3.00 0.00%<br />
Pension Support Program 5.70 5.50 5.50 5.50 0.00%<br />
Workers' Compensation Program 5.65 5.65 5.65 6.80 20.35%<br />
Self Insurance Program 4.45 5.30 5.30 5.30 0.00%<br />
Commercial Insurance Program 1.10 0.25 0.25 0.25 0.00%<br />
Health Insurance Program 0.50 3.20 3.20 4.05 26.56%<br />
Life Insurance Program 0.10 0.40 0.40 0.55 37.50%<br />
Total Full-Time FTE 43.00 42.00 43.00 43.95 2.21%<br />
Employment Program 0.50 0.50 0.50 0.50 0.00%<br />
Group Benefits Program 0.50 0.00 0.00 0.00 0.00%<br />
Total Part-Time FTE 1.00 0.50 0.50 0.50 0.00%<br />
Total FTE 44.00 42.50 43.50 44.45 2.18%<br />
206
City <<strong>st</strong>rong>of</<strong>st</strong>rong> St. Petersburg, Florida - FY 2012 Proposed Fiscal Plan<br />
- In FY12, the Human Resources General Fund <strong>budget</strong> decreased 9.83%. Reductions include reducing various line items in services and<br />
commodities including training and conference travel and insurance charges - internal. Also, reallocation <<strong>st</strong>rong>of</<strong>st</strong>rong> funding for a Personnel Analy<strong>st</strong> I<br />
from the Group Benefits General Fund to the Health Insurance Fund and the Life Insurance Fund ($58,256). The base <strong>budget</strong> decreased from<br />
FY11 primarily due to the change in the way the ICS charges were allocated. The data processing - internal charges decreased ($335,388).<br />
- In the insurance funds: Health Insurance - based upon our consultant's recommendations we are assuming a 15% increase in the Humana<br />
Medicare Supplemental Plans and a 7% increase in the United Health Plans, effective April 2012. Life - reduction in our group life insurance<br />
rates bid this year results in an approximate 14.3% decrease in this fund for FY12; however, the decrease in revenue is only 4.4%, as the amount<br />
<strong>budget</strong>ed for City contribution in FY11 was erroneously po<strong>st</strong>ed and needed to be adju<strong>st</strong>ed this year as a correction; Self - adju<strong>st</strong>ments to services<br />
and commodities line items ($55,950). Commercial Insurance - We are submitting an FY12 <strong>budget</strong> with net zero changes from FY11. While we<br />
were able to realize an 8% reduction in property insurance premiums for FY11/FY12, we feel it prudent to build in an anticipated increase for<br />
next year, as there is (1) some expectation that current regulations and subsidies <<strong>st</strong>rong>of</<strong>st</strong>rong> insurance rates will be relaxed, and (2) that the effects <<strong>st</strong>rong>of</<strong>st</strong>rong><br />
several large scale disa<strong>st</strong>ers around the world will cause an increase in the upcoming year due to claims payments; Workers Compensation -<br />
adju<strong>st</strong>ments to other special services line item ($1,000).<br />
The Human Resources Department's performance measures address the Mayor's goal <<strong>st</strong>rong>of</<strong>st</strong>rong> Service. Additionally, the second, third, fourth, and<br />
fifth performance measures are linked to the Mayor's goal <<strong>st</strong>rong>of</<strong>st</strong>rong> Su<strong>st</strong>ainability.<br />
Objective and Performance Measure<br />
Unit Of<br />
Measure<br />
FY 2009<br />
Actual<br />
FY 2010<br />
Actual<br />
FY 2011<br />
Target<br />
FY2011<br />
E<strong>st</strong>imate<br />
FY 2012<br />
Proposed<br />
Advocate for Program Access for Persons with Disabilities<br />
To di<strong>st</strong>ribute an accessibility checkli<strong>st</strong> and application to each co-sponsored event planner, and to ensure that 90% <<strong>st</strong>rong>of</<strong>st</strong>rong> the applications are returned<br />
and approved prior to the event.<br />
Cosponsored Events Accessibility Checkli<strong>st</strong> & App. % 70 80 90 80 80<br />
Control <<strong>st</strong>rong>of</<strong>st</strong>rong> Insurance Co<strong>st</strong>s<br />
To utilize loss control, risk retention, risk transfer, and loss prevention methods to minimize co<strong>st</strong>s.<br />
Property Insurance Co<strong>st</strong>s per Insured Value $ 624 541 537 540 550<br />
Control <<strong>st</strong>rong>of</<strong>st</strong>rong> Workers' Compensation Claims<br />
To reduce the frequency <<strong>st</strong>rong>of</<strong>st</strong>rong> Workers' Compensation claims and claim co<strong>st</strong>s through loss control, safety, loss prevention, light duty programs, and<br />
Drug Free Workplace program.<br />
Workers' Compensation Claims per 100 FTE # 13 15 16 16 16<br />
Employee Benefits - Health Insurance<br />
To provide a co<strong>st</strong>-effective funding mechanism for the health care, dental care, and vision coverage provided to City employees and retirees.<br />
Dental Insurance Coverage / Active Employees # 1,800 1,851 1,855 1,879 1,906<br />
Dental Insurance Coverage / Retirees # 270 279 305 294 328<br />
Flexible Spending Accounts / Active Employees # 250 250 262 262 406<br />
Health Care Coverage / Active employee # 2,400 2,465 2,379 2,425 2,361<br />
Health Care Coverage / Retirees # 1,000 1,097 1,125 1,113 1,173<br />
Routine Vision Coverage / Active Employees # 1,300 1,495 1,523 1,540 1,622<br />
Routine Vision Coverage / Retirees # 145 194 223 211 259<br />
Employee Benefits - Life Insurance<br />
To provide a co<strong>st</strong>-effective funding mechanism for life insurance coverage, AD&D, PAI and Long Term Disability benefits provided to City<br />
207
Objective and Performance Measure<br />
employees and/or retirees.<br />
City <<strong>st</strong>rong>of</<strong>st</strong>rong> St. Petersburg, Florida - FY 2012 Proposed Fiscal Plan<br />
Unit Of<br />
Measure<br />
FY 2009<br />
Actual<br />
FY 2010<br />
Actual<br />
FY 2011<br />
Target<br />
FY2011<br />
E<strong>st</strong>imate<br />
FY 2012<br />
Proposed<br />
Life Insurance - Active Employees Dependents # 225 244 247 248 296<br />
Life Insurance - Active Employees' Spouses # 245 268 258 261 483<br />
Life Insurance Coverage - Active Employees # 4,500 4,688 4,609 4,648 4,705<br />
Life Insurance Coverage - Retirees # 1,100 1,132 1,151 1,130 1,150<br />
Long Term Disability Coverage - Active Employees # 155 160 154 155 181<br />
Employee Development - Training Courses<br />
To provide employees with needed training courses to help them and their departments be more effective and productive.<br />
Training Courses Offered # 105 70 72 72 70<br />
Employment Division Candidate Processing<br />
To provide a high quality pool <<strong>st</strong>rong>of</<strong>st</strong>rong> candidates made up <<strong>st</strong>rong>of</<strong>st</strong>rong> qualified, skilled and motivated individuals for consideration by hiring departments, and to<br />
facilitate the quick and efficient filling <<strong>st</strong>rong>of</<strong>st</strong>rong> vacancies.<br />
Full Time Employees # 2,723 2,693 2,650 2,650 2,650<br />
Employment Division New Hire Processing<br />
To conduct the necessary pre-employment and new hire processes quickly and efficiently while complying with all applicable regulations, <strong>st</strong>atutes,<br />
laws and rules.<br />
Number <<strong>st</strong>rong>of</<strong>st</strong>rong> New Hires # 473 475 400 400 400<br />
Labor Relations<br />
To provide a <strong>st</strong>ructured process for interacting with certified employee groups and resolving employee grievances.<br />
Contracts/Agreements Negotiated # 7 13 12 15 11<br />
Hearings/Consultations Conducted & Facilitated # 40 66 65 65 65<br />
Monitor Diversity <<strong>st</strong>rong>of</<strong>st</strong>rong> City Employees<br />
Prepare reports on ethnic and gender makeup <<strong>st</strong>rong>of</<strong>st</strong>rong> employees<br />
Prepare Reports on ethnic and gender makeup <<strong>st</strong>rong>of</<strong>st</strong>rong> employees # 0 4 4 4 4<br />
Policy and Operational Recommendations to Police<br />
An Objective <<strong>st</strong>rong>of</<strong>st</strong>rong> the Community Affairs Citizen Review Board is to provide adequate tools to the Police Department to reduce the number <<strong>st</strong>rong>of</<strong>st</strong>rong><br />
complaints being filed again<strong>st</strong> police <<strong>st</strong>rong>of</<strong>st</strong>rong>ficers.<br />
Civilian Police Review Recommendations # 1 2 1 1 1<br />
Public Safety Recruitment Applications Logged and Managed<br />
To process an adequate number <<strong>st</strong>rong>of</<strong>st</strong>rong> public safety candidates through the intricate pre-employment screening <strong>st</strong>andards in order to provide a high<br />
quality candidate pool for consideration by the Fire and Police Department hiring managers.<br />
Number <<strong>st</strong>rong>of</<strong>st</strong>rong> Public Safety Applications Processed # 337 599 350 400 350<br />
208
Objective and Performance Measure<br />
City <<strong>st</strong>rong>of</<strong>st</strong>rong> St. Petersburg, Florida - FY 2012 Proposed Fiscal Plan<br />
Unit Of<br />
Measure<br />
FY 2009<br />
Actual<br />
FY 2010<br />
Actual<br />
FY 2011<br />
Target<br />
FY2011<br />
E<strong>st</strong>imate<br />
FY 2012<br />
Proposed<br />
Responsiveness to Disability Service Inquires & Complaints<br />
To provide prompt and effective responses to the concerns <<strong>st</strong>rong>of</<strong>st</strong>rong> persons with disabilities who live, work and visit the City <<strong>st</strong>rong>of</<strong>st</strong>rong> St. Petersburg, including<br />
City employees.<br />
Timely Response to Disability Inquiries # 41 39 30 35 35<br />
Review <<strong>st</strong>rong>of</<strong>st</strong>rong> Internal Affairs Inve<strong>st</strong>igations - informal (Bureau<br />
Inve<strong>st</strong>igations)<br />
To process the review <<strong>st</strong>rong>of</<strong>st</strong>rong> complaints again<strong>st</strong> police <<strong>st</strong>rong>of</<strong>st</strong>rong>ficers in a timely fashion.<br />
Civilian Police Review Internal Affairs Cases Reviewed # 32 36 24 24 24<br />
Review <<strong>st</strong>rong>of</<strong>st</strong>rong> Internal Affairs Inve<strong>st</strong>igations -formal (Internal<br />
Affairs Inve<strong>st</strong>igations)<br />
To process the review <<strong>st</strong>rong>of</<strong>st</strong>rong> complaints again<strong>st</strong> police <<strong>st</strong>rong>of</<strong>st</strong>rong>ficers in a timely fashion.<br />
Civilian Police Review Internal Affairs Cases Reviewed # 22 15 24 24 24<br />
Risk Management<br />
To control claims frequency and severity by loss control, safety and loss prevention and minimize the number <<strong>st</strong>rong>of</<strong>st</strong>rong> claims filed.<br />
Claims Filed - General/Automotive Liability # 1,629 1457 1,625 1600 1600<br />
General/Auto Liability Co<strong>st</strong>s Percentage % 0.14 0.19 0.21 0.21 0.21<br />
Summer Jobs for Youth<br />
To provide summer work opportunities for youth ages 16 - 21.<br />
No. <<strong>st</strong>rong>of</<strong>st</strong>rong> Placements # 118 163 155 120 120<br />
Summer Workforce Training for Youth<br />
To provide workforce readiness training for youth age 14 -16<br />
No. <<strong>st</strong>rong>of</<strong>st</strong>rong> Participants trained # 56 56 50 48 48<br />
Training<br />
The Committee to Advocate for Persons with Impairments will <strong>st</strong>rive to provide training and educational opportunities to City employees and/or<br />
persons who provide services in the community.<br />
CAPI-Training and Education Seminars # 2 3 1 3 2<br />
209
Department Mission Statement<br />
City <<strong>st</strong>rong>of</<strong>st</strong>rong> St. Petersburg, Florida - FY 2012 Proposed Fiscal Plan<br />
Information & Communication Services Department<br />
The mission <<strong>st</strong>rong>of</<strong>st</strong>rong> the ICS Department is to pursue, implement and manage information sy<strong>st</strong>ems and technologies that mo<strong>st</strong> effectively and efficiently support the<br />
City departments in accomplishing the goals and objectives <<strong>st</strong>rong>of</<strong>st</strong>rong> the City. All ICS employees will provide exceptional service to both our internal cu<strong>st</strong>omers and the<br />
public. ICS management recognizes ICS team members as our mo<strong>st</strong> important asset and will provide the opportunity for development and will create a working<br />
environment that fo<strong>st</strong>ers innovative solutions and cooperative problem-solving in a fiscally responsible manner.<br />
Services Provided<br />
The following services are provided by the ICS, Print Shop and the Technology and Infra<strong>st</strong>ructure Funds.<br />
• ICS provides access, delivery, <strong>st</strong>orage, retrieval and support services for all City voice and data processing sy<strong>st</strong>ems to support City departments and the public<br />
in accomplishing the goals and objectives <<strong>st</strong>rong>of</<strong>st</strong>rong> the City.<br />
• Print Shop provides printed materials and related services in a co<strong>st</strong> effective and efficient manner to all City departments.<br />
• The Technology and Infra<strong>st</strong>ructure Fund is an Internal Service Fund that was e<strong>st</strong>ablished in FY 2010 to centrally locate all technology/infra<strong>st</strong>ructure<br />
resources. The fund balances <<strong>st</strong>rong>of</<strong>st</strong>rong> the former PC and Radio Replacement Funds, and the amount above the target fund balance <<strong>st</strong>rong>of</<strong>st</strong>rong> the ICS fund were transferred here.<br />
In addition, reserves for television equipment contributed by the Marketing and Communications Department were transferred to this fund from the Equipment<br />
Replacement Fund.<br />
Budgetary Co<strong>st</strong> Summary<br />
FY 2009<br />
Actual<br />
FY 2010<br />
Actual<br />
FY 2011<br />
Adopted<br />
FY 2011<br />
Amended<br />
FY 2011<br />
E<strong>st</strong>imated<br />
FY 2012<br />
Proposed<br />
FY 2012<br />
Change<br />
Wages And Benefits 6,018,594 5,989,321 5,866,490 5,990,712 5,991,190 6,060,354 3.30%<br />
Services And Commodities 4,381,847 4,466,909 4,023,322 4,363,252 4,164,777 3,910,785 (2.80%)<br />
Capital 380,856 760,778 870,532 3,269,120 1,757,187 739,800 (15.02%)<br />
Transfers Out 19,000 399,996 300,000 300,000 300,000 200,000 (33.33%)<br />
Total Budget 10,800,297 11,617,005 11,060,344 13,923,084 12,213,154 10,910,939 (1.35%)<br />
Appropriations By Fund/Program<br />
FY 2009<br />
Actual<br />
FY 2010<br />
Actual<br />
FY 2011<br />
Adopted<br />
FY 2011<br />
Amended<br />
FY 2011<br />
E<strong>st</strong>imated<br />
FY 2012<br />
Proposed<br />
FY 2012<br />
Change<br />
Stormwater Utility Operating<br />
SW Utility Collection & Marine Infra<strong>st</strong>r<br />
Program<br />
525 0 0 0 0 0 0.00%<br />
Information & Communication Services<br />
Information & Communication Services<br />
10,250,665 10,940,120 10,071,242 10,590,594 10,369,905 9,788,675 (2.81%)<br />
Program<br />
Print Shop Program 0 19,212 283,570 333,064 251,712 401,464 41.57%<br />
Totals for Information &<br />
Communication Services<br />
10,250,665 10,959,332 10,354,812 10,923,658 10,621,617 10,190,139 (1.59%)<br />
Pc Replacement<br />
PC Replacement Program 121,782 224,269 0 36,106 36,106 0 0.00%<br />
Radio Replacement<br />
Radio Replacement Program 6,433 45,753 0 16,050 16,050 0 0.00%<br />
Technology & Infra<strong>st</strong>ructure Fund<br />
Non-Department Program 0 0 0 0 0 47,000 0.00%<br />
PC Replacement Program 0 0 229,240 2,470,121 1,063,089 673,800 193.93%<br />
Radio Replacement Program 0 0 476,292 476,292 476,292 0 (100.00%)<br />
Totals for Technology & Infra<strong>st</strong>ructure<br />
Fund<br />
0 0 705,532 2,946,413 1,539,381 720,800 2.16%<br />
Print Shop<br />
Print Shop Program 420,892 387,651 0 857 0 0 0.00%<br />
Total Budget 10,800,297 11,617,005 11,060,344 13,923,084 12,213,154 10,910,939 (1.35%)<br />
210
Revenue Sources<br />
City <<strong>st</strong>rong>of</<strong>st</strong>rong> St. Petersburg, Florida - FY 2012 Proposed Fiscal Plan<br />
FY 2009<br />
Actual<br />
FY 2010<br />
Actual<br />
FY 2011<br />
Adopted<br />
FY 2011<br />
Amended<br />
FY 2011<br />
E<strong>st</strong>imated<br />
FY 2012<br />
Proposed<br />
FY 2012<br />
Change<br />
Other Charges For Services 0 9,324 0 0 9,756 0 0.00%<br />
Intere<strong>st</strong> Earnings 39,746 47,554 62,110 62,110 8,306 24,670 (60.28%)<br />
Sale Of Fixed Assets 27,475 7,664 0 0 0 0 0.00%<br />
Misc Revenue 29,755 817 0 0 221 0 0.00%<br />
Department Charges 12,676,621 11,302,792 10,602,390 10,602,390 10,948,752 10,343,624 (2.44%)<br />
Transfer From Information<br />
& Communication Services<br />
19,000 0 0 0 0 0 0.00%<br />
Information & Communication<br />
Services<br />
(895,987) 836,688 670,812 1,239,658 693,116 560,517 (16.44%)<br />
Technology & Infra<strong>st</strong>ructure<br />
Fund<br />
0 0 (274,968) 1,965,913 500,847 (17,872) (93.50%)<br />
Pc Replacement (630,169) (246,624) 0 36,106 36,106 0 0.00%<br />
Print Shop 5,004 33,262 0 857 0 0 0.00%<br />
Radio Replacement (471,672) (374,471) 0 16,050 16,050 0 0.00%<br />
Stormwater Utility Operating 525 0 0 0 0 0 0.00%<br />
Total Revenue 10,800,297 11,617,005 11,060,344 13,923,084 12,213,154 10,910,939 (1.35%)<br />
Position Summary<br />
FY 2009<br />
Actual<br />
FY 2010<br />
Actual<br />
FY 2011<br />
Adopted<br />
FY 2012<br />
Proposed<br />
FY 2012<br />
Change<br />
Information & Communication Services Program 64.00 65.00 68.00 65.00 (4.41%)<br />
Print Shop Program 3.00 0.00 0.00 3.00 0.00%<br />
Total Full-Time FTE 67.00 65.00 68.00 68.00 0.00%<br />
Information & Communication Services Program 3.00 3.00 3.00 3.00 0.00%<br />
Total Part-Time FTE 3.00 3.00 3.00 3.00 0.00%<br />
Total FTE 70.00 68.00 71.00 71.00 0.00%<br />
- In FY12, the ICS Department's <strong>budget</strong> will decrease 1.59% due to reduction in various services and commodities including other specialized<br />
services - external, telephone - external and r/m materials - equipments - external in addition to a reduction in funding for a filled full-time Data<br />
Processing Media Librarian and filled full-time Computer Operator II position ($106,000).<br />
- The transfer to the General Fund to <<strong>st</strong>rong>of</<strong>st</strong>rong>fset the co<strong>st</strong> <<strong>st</strong>rong>of</<strong>st</strong>rong> the library collection was reduced from $300,000 to $200,000 in FY12.<br />
- Capital outlay includes $654,300 <<strong>st</strong>rong>of</<strong>st</strong>rong> reque<strong>st</strong> which will be funded out <<strong>st</strong>rong>of</<strong>st</strong>rong> the Technology Fund.<br />
- Enhancements ($66,030) include <strong>operating</strong> supplies, r/m materials - equipment - external and equipment - small - external.<br />
- The City has initiated a Virtual Desktop PC program that requires each virtual machine to have its own XP Pr<<strong>st</strong>rong>of</<strong>st</strong>rong>essional license loaded. These<br />
VECD (virtual enterprise centralized desktop) licenses are $100 per year, per machine and are recurring co<strong>st</strong>s. The Virtual Desktop initiative is<br />
directly tied to sub<strong>st</strong>antial co<strong>st</strong> savings. By virtualizing desktop PCs, the City benefits by reducing the number <<strong>st</strong>rong>of</<strong>st</strong>rong> PC replacements for each year<br />
the equipment is in use. In<strong>st</strong>ead <<strong>st</strong>rong>of</<strong>st</strong>rong> a 4 year replacement cycle, the City may see a 6 or 7 year cycle, while <strong>st</strong>ill providing the late<strong>st</strong> desktop<br />
s<<strong>st</strong>rong>of</<strong>st</strong>rong>tware experience to the users ($277,800).<br />
- The PC and Radio Replacement programs have been consolidated into the Technology and Infra<strong>st</strong>ructure Fund.<br />
The Information & Communication Services Department's performance measures address the Mayor's goal <<strong>st</strong>rong>of</<strong>st</strong>rong> Service.<br />
Objective and Performance Measure<br />
Unit Of<br />
Measure<br />
FY 2009<br />
Actual<br />
FY 2010<br />
Actual<br />
FY 2011<br />
Target<br />
FY2011<br />
E<strong>st</strong>imate<br />
FY 2012<br />
Proposed<br />
Network Support<br />
211
City <<strong>st</strong>rong>of</<strong>st</strong>rong> St. Petersburg, Florida - FY 2012 Proposed Fiscal Plan<br />
Objective and Performance Measure<br />
Unit Of<br />
FY 2009 FY 2010 FY 2011 FY2011 FY 2012<br />
Measure<br />
Actual Actual Target E<strong>st</strong>imate Proposed<br />
Provide continuing support for all City network devices, infra<strong>st</strong>ructure and City business s<<strong>st</strong>rong>of</<strong>st</strong>rong>tware including: Desktop PCs, Laptops, PDAs, printers,<br />
wireless devices, fiber optic transport technologies, video camera surveillance products and a wide array <<strong>st</strong>rong>of</<strong>st</strong>rong> <<strong>st</strong>rong>city</<strong>st</strong>rong> business s<<strong>st</strong>rong>of</<strong>st</strong>rong>tware application<br />
support.<br />
Network Performance % 100 100 100 100 100<br />
PC Replacement<br />
City-wide PC and Laptop Replacement. (Includes 200 Virtual Computers)<br />
PC & Laptop Replacements # 69 253 382 382 13<br />
Printing Services<br />
Print quality materials.<br />
Bindery Jobs # 693 505 850 517 500<br />
High Speed Printer # 3,500,000 3,522,000 3,500,000 3,522,000 3,522,000<br />
Number <<strong>st</strong>rong>of</<strong>st</strong>rong> inserts # 1,850,000 1,900,000 1,900,000 1,900,000 1,900,000<br />
Total Color Jobs # 888 636 1,000 448 450<br />
Total Printed Impressions # 4,690,492 3,023,676 5,500,000 2,464,744 2,475,000<br />
Work Reque<strong>st</strong> for Service # 982 722 1,050 741 750<br />
Service Reque<strong>st</strong>s for Radio and Electronics Devices<br />
Count <<strong>st</strong>rong>of</<strong>st</strong>rong> services completed per database items, i.e. radios, vehicle computers, pagers, tv devices and some sewer equipment.<br />
Radio In<strong>st</strong>allation & Service Completions # 3,400 1450 2,100 1500 1500<br />
212
Department Mission Statement<br />
City <<strong>st</strong>rong>of</<strong>st</strong>rong> St. Petersburg, Florida - FY 2012 Proposed Fiscal Plan<br />
Internal Services Admini<strong>st</strong>ration Department<br />
The mission <<strong>st</strong>rong>of</<strong>st</strong>rong> the Internal Services Admini<strong>st</strong>ration Department is to include the procurement <<strong>st</strong>rong>of</<strong>st</strong>rong> quality supplies, services and materials; preservation <<strong>st</strong>rong>of</<strong>st</strong>rong> hi<strong>st</strong>ory<br />
through the pr<<strong>st</strong>rong>of</<strong>st</strong>rong>essional management <<strong>st</strong>rong>of</<strong>st</strong>rong> its legal documents and proceedings <<strong>st</strong>rong>of</<strong>st</strong>rong> City Council; the management <<strong>st</strong>rong>of</<strong>st</strong>rong> the organization through human resources and<br />
risk management; the collection <<strong>st</strong>rong>of</<strong>st</strong>rong> revenues and the advancement <<strong>st</strong>rong>of</<strong>st</strong>rong> the legislative priorities and initiatives that are important to our community.<br />
Services Provided<br />
The Internal Services Admini<strong>st</strong>ration department provides the following services:<br />
• Provides admini<strong>st</strong>rative and support services for the City's internal departments, which include Billing and Collections, City Clerk, Government Services,<br />
Human Resources, Information and Communication Services and Purchasing and Materials Management.<br />
Budgetary Co<strong>st</strong> Summary<br />
FY 2009<br />
Actual<br />
FY 2010<br />
Actual<br />
FY 2011<br />
Adopted<br />
FY 2011<br />
Amended<br />
FY 2011<br />
E<strong>st</strong>imated<br />
FY 2012<br />
Proposed<br />
FY 2012<br />
Change<br />
Wages And Benefits 607,112 524,063 352,939 351,703 272,157 0 (100.00%)<br />
Services And Commodities 233,880 137,651 164,028 163,762 97,193 0 (100.00%)<br />
Grants And Aid 697,000 571,000 0 2,475 831 0 0.00%<br />
Total Budget 1,537,992 1,232,714 516,967 517,940 370,181 0 (100.00%)<br />
Appropriations By Fund/Program<br />
FY 2009<br />
Actual<br />
FY 2010<br />
Actual<br />
FY 2011<br />
Adopted<br />
FY 2011<br />
Amended<br />
FY 2011<br />
E<strong>st</strong>imated<br />
FY 2012<br />
Proposed<br />
FY 2012<br />
Change<br />
General Operating Fund<br />
Codes Compliance Assi<strong>st</strong>ance Program (144) (266) 0 (266) 0 0 0.00%<br />
Government Services Admini<strong>st</strong>ration<br />
277,079 230,155 193,670 73,017 47,950 0 (100.00%)<br />
Program<br />
Government Services Program 0 0 0 119,417 53,698 0 0.00%<br />
Internal Services Admini<strong>st</strong>ration Program 1,261,057 1,001,146 323,297 325,772 268,533 0 (100.00%)<br />
Non-Department Program 0 1,680 0 0 0 0 0.00%<br />
Totals for General Operating Fund 1,537,992 1,232,714 516,967 517,940 370,181 0 (100.00%)<br />
Total Budget 1,537,992 1,232,714 516,967 517,940 370,181 0 (100.00%)<br />
Revenue Sources<br />
FY 2009<br />
Actual<br />
FY 2010<br />
Actual<br />
FY 2011<br />
Adopted<br />
FY 2011<br />
Amended<br />
FY 2011<br />
E<strong>st</strong>imated<br />
FY 2012<br />
Proposed<br />
FY 2012<br />
Change<br />
Contractors Permits 0 (132) 0 0 0 0 0.00%<br />
Rents And Royalties 0 0 1,000 1,000 0 0 (100.00%)<br />
Misc Revenue 22,953 51 0 0 0 0 0.00%<br />
General & Admini<strong>st</strong>rative 406,032 364,572 375,516 375,516 375,516 0 (100.00%)<br />
General Fund 1,109,007 868,223 140,451 141,424 (5,335) 0 (100.00%)<br />
Total Revenue 1,537,992 1,232,714 516,967 517,940 370,181 0 (100.00%)<br />
Position Summary<br />
FY 2009<br />
Actual<br />
FY 2010<br />
Actual<br />
FY 2011<br />
Adopted<br />
FY 2012<br />
Proposed<br />
FY 2012<br />
Change<br />
Internal Services Admini<strong>st</strong>ration Program 4.00 2.00 2.00 0.00 (100.00%)<br />
Government Services Admini<strong>st</strong>ration Program 2.00 2.00 1.00 0.00 (100.00%)<br />
Total Full-Time FTE 6.00 4.00 3.00 0.00 (100.00%)<br />
213
City <<strong>st</strong>rong>of</<strong>st</strong>rong> St. Petersburg, Florida - FY 2012 Proposed Fiscal Plan<br />
Position Summary<br />
FY 2009<br />
Actual<br />
FY 2010<br />
Actual<br />
FY 2011<br />
Adopted<br />
FY 2012<br />
Proposed<br />
FY 2012<br />
Change<br />
Total FTE 6.00 4.00 3.00 0.00 (100.00%)<br />
- A reorganization was completed in FY12; the Government Services Department will be eliminated. The Government Services, Grants Special<br />
Project Manager position ($107,564) was eliminated. Also, due to the elimination <<strong>st</strong>rong>of</<strong>st</strong>rong> this Manager position, $62,240 was transferred to the<br />
Mayor's Office to continue duties relating to this position as well as General & Admini<strong>st</strong>ration charges ($375,516).<br />
- The Internal Services Admini<strong>st</strong>ration Department was also reorganized and eliminated for FY12. A Senior Admini<strong>st</strong>rator position ($164,067)<br />
and a Admini<strong>st</strong>rative Coordinator ($90,374) was transferred to the Downtown Enterprise Facilities Department. Also due to the reorganization,<br />
various internal charges and services and commodities were eliminated ($9,880).<br />
214
Department Mission Statement<br />
City <<strong>st</strong>rong>of</<strong>st</strong>rong> St. Petersburg, Florida - FY 2012 Proposed Fiscal Plan<br />
Legal Department<br />
The mission <<strong>st</strong>rong>of</<strong>st</strong>rong> the Legal Department is to provide legal counsel and litigation services to City Council, the Mayor, and all City departments, boards, and<br />
commissions.<br />
Services Provided<br />
The Legal Department provides the following services:<br />
• Provides legal counsel to City Council, the Mayor, and all City departments, boards, and commissions.<br />
• Prosecutes and defends all lawsuits for and on behalf <<strong>st</strong>rong>of</<strong>st</strong>rong> the City.<br />
Budgetary Co<strong>st</strong> Summary<br />
FY 2009<br />
Actual<br />
FY 2010<br />
Actual<br />
FY 2011<br />
Adopted<br />
FY 2011<br />
Amended<br />
FY 2011<br />
E<strong>st</strong>imated<br />
FY 2012<br />
Proposed<br />
FY 2012<br />
Change<br />
Wages And Benefits 2,206,421 2,316,281 1,934,664 1,934,664 1,756,958 1,798,160 (7.06%)<br />
Services And Commodities 563,839 612,233 522,684 1,023,033 786,187 485,652 (7.08%)<br />
Capital 11,235 8,442 9,000 9,718 10,000 4,000 (55.56%)<br />
Total Budget 2,781,496 2,936,957 2,466,348 2,967,415 2,553,145 2,287,812 (7.24%)<br />
Appropriations By Fund/Program<br />
FY 2009<br />
Actual<br />
FY 2010<br />
Actual<br />
FY 2011<br />
Adopted<br />
FY 2011<br />
Amended<br />
FY 2011<br />
E<strong>st</strong>imated<br />
FY 2012<br />
Proposed<br />
FY 2012<br />
Change<br />
General Operating Fund<br />
General Counsel Program<br />
Tort Litigation Program<br />
1,920,608<br />
860,888<br />
2,056,367<br />
880,590<br />
1,891,029<br />
575,319<br />
1,892,096<br />
1,075,319<br />
1,916,240<br />
636,905<br />
1,713,294<br />
574,518<br />
(9.40%)<br />
(0.14%)<br />
Totals for General Operating Fund 2,781,496 2,936,957 2,466,348 2,967,415 2,553,145 2,287,812 (7.24%)<br />
Total Budget 2,781,496 2,936,957 2,466,348 2,967,415 2,553,145 2,287,812 (7.24%)<br />
Revenue Sources<br />
FY 2009<br />
Actual<br />
FY 2010<br />
Actual<br />
FY 2011<br />
Adopted<br />
FY 2011<br />
Amended<br />
FY 2011<br />
E<strong>st</strong>imated<br />
FY 2012<br />
Proposed<br />
FY 2012<br />
Change<br />
General Government 0 0 0 0 271 0 0.00%<br />
Other Charges For Services 1,097 1,000 2,000 2,000 200 2,000 0.00%<br />
Misc Revenue 5,631 6,089 0 0 1,695 0 0.00%<br />
General & Admini<strong>st</strong>rative 1,286,580 1,309,188 1,348,464 1,348,464 1,348,464 1,348,464 0.00%<br />
Other Charges 0 2 0 0 0 0 0.00%<br />
General Fund 1,488,188 1,620,678 1,115,884 1,616,951 1,202,515 937,348 (16.00%)<br />
Total Revenue 2,781,496 2,936,957 2,466,348 2,967,415 2,553,145 2,287,812 (7.24%)<br />
Position Summary<br />
FY 2009<br />
Actual<br />
FY 2010<br />
Actual<br />
FY 2011<br />
Adopted<br />
FY 2012<br />
Proposed<br />
FY 2012<br />
Change<br />
General Counsel Program 15.00 15.84 15.84 14.69 (7.26%)<br />
Tort Litigation Program 6.00 5.00 5.00 5.00 0.00%<br />
Total Full-Time FTE 21.00 20.84 20.84 19.69 (5.52%)<br />
General Counsel Program 0.50 0.00 0.00 0.00 0.00%<br />
Tort Litigation Program 1.25 1.75 1.00 1.00 0.00%<br />
215
City <<strong>st</strong>rong>of</<strong>st</strong>rong> St. Petersburg, Florida - FY 2012 Proposed Fiscal Plan<br />
Position Summary<br />
FY 2009<br />
Actual<br />
FY 2010<br />
Actual<br />
FY 2011<br />
Adopted<br />
FY 2012<br />
Proposed<br />
FY 2012<br />
Change<br />
Total Part-Time FTE 1.75 1.75 1.00 1.00 0.00%<br />
Total FTE 22.75 22.59 21.84 20.69 (5.27%)<br />
- In FY12, the Legal Department's <strong>budget</strong> decreased 7.24% due to allocation <<strong>st</strong>rong>of</<strong>st</strong>rong> attorney's <strong>st</strong>aff time to the Workers Compensation Fund<br />
($108,540). In addition, various line items were reduced in services and commodities including data processing - internal and claims - self<br />
internal charges ($32,832). The change in personnel count from the FY2011 adopted to the FY12 <strong>proposed</strong> is due to labor di<strong>st</strong>ribution for two<br />
employees.<br />
- Capital Outlay includes $4,000 for the Legal Department Library.<br />
The Legal Department's fir<strong>st</strong> performance measure addresses the Mayor's goal <<strong>st</strong>rong>of</<strong>st</strong>rong> Service and the la<strong>st</strong> performance measure is linked to the<br />
Mayor's goal <<strong>st</strong>rong>of</<strong>st</strong>rong> Su<strong>st</strong>ainability.<br />
Objective and Performance Measure<br />
Unit Of<br />
Measure<br />
FY 2009<br />
Actual<br />
FY 2010<br />
Actual<br />
FY 2011<br />
Target<br />
FY2011<br />
E<strong>st</strong>imate<br />
FY 2012<br />
Proposed<br />
New Civil Cases by Calendar Year<br />
An objective <<strong>st</strong>rong>of</<strong>st</strong>rong> the Legal Department is to track the number <<strong>st</strong>rong>of</<strong>st</strong>rong> new civil cases by calendar year.<br />
New Civil Cases by Calendar Year # 412 411 450 450 400<br />
Reducing Outside Counsel Co<strong>st</strong>s<br />
An objective <<strong>st</strong>rong>of</<strong>st</strong>rong> the Legal Department is to reduce the need for outside attorneys.<br />
Reduction <<strong>st</strong>rong>of</<strong>st</strong>rong> Outside Counsel Co<strong>st</strong>s $ 25,455 79,476 48,000 100,000 50,000<br />
216
Department Mission Statement<br />
City <<strong>st</strong>rong>of</<strong>st</strong>rong> St. Petersburg, Florida - FY 2012 Proposed Fiscal Plan<br />
Mayor's Office<br />
The mission <<strong>st</strong>rong>of</<strong>st</strong>rong> the Office <<strong>st</strong>rong>of</<strong>st</strong>rong> the Mayor is to provide executive leadership and direction and to admini<strong>st</strong>er all City business in the intere<strong>st</strong> <<strong>st</strong>rong>of</<strong>st</strong>rong> its citizens and the<br />
corporate entity as a whole.<br />
Services Provided<br />
The Mayor's Office provides the following services:<br />
• Provides executive leadership, implementation, and oversight in delivering City services.<br />
• Defines City initiatives and sets implementation priorities.<br />
• E<strong>st</strong>ablishes organizational <strong>st</strong>ructure and <strong>st</strong>affing.<br />
• Works with City Council, businesses, and residents to ensure the safety, health, and prosperity <<strong>st</strong>rong>of</<strong>st</strong>rong> the City.<br />
• Responds to and tracks citizen and Council complaints and concerns through the <<strong>st</strong>rong>city</<strong>st</strong>rong>'s Action Center.<br />
• Submits the annual Mayor's <strong>budget</strong> recommendation to City Council and reports on the finances <<strong>st</strong>rong>of</<strong>st</strong>rong> the City.<br />
• Confers with the school board, county, <strong>st</strong>ate, and local educational agencies to coordinate and enhance services within the City <<strong>st</strong>rong>of</<strong>st</strong>rong> St. Petersburg.<br />
• Solicits private funding for college scholarships for economically disadvantaged youth.<br />
Budgetary Co<strong>st</strong> Summary<br />
FY 2009<br />
Actual<br />
FY 2010<br />
Actual<br />
FY 2011<br />
Adopted<br />
FY 2011<br />
Amended<br />
FY 2011<br />
E<strong>st</strong>imated<br />
FY 2012<br />
Proposed<br />
FY 2012<br />
Change<br />
Wages And Benefits 798,166 806,758 855,577 855,577 988,636 1,025,184 19.82%<br />
Services And Commodities 166,088 139,027 135,272 135,598 145,467 247,627 83.06%<br />
Grants And Aid 0 0 721,000 821,000 820,974 721,000 0.00%<br />
Total Budget 964,254 945,786 1,711,849 1,812,175 1,955,077 1,993,811 16.47%<br />
Appropriations By Fund/Program<br />
FY 2009<br />
Actual<br />
FY 2010<br />
Actual<br />
FY 2011<br />
Adopted<br />
FY 2011<br />
Amended<br />
FY 2011<br />
E<strong>st</strong>imated<br />
FY 2012<br />
Proposed<br />
FY 2012<br />
Change<br />
General Operating Fund<br />
Action Center Program 180,790 118,771 23,925 23,925 85,566 87,483 265.66%<br />
Education & Government Services 203,678 193,096 194,696 194,696 187,526 391,143 100.90%<br />
Mayor's Office Program 579,786 571,482 669,753 670,079 707,701 686,772 2.54%<br />
Veterans, Homeless, & Social Services 0 62,437 823,475 923,475 974,284 828,413 0.60%<br />
Totals for General Operating Fund 964,254 945,786 1,711,849 1,812,175 1,955,077 1,993,811 16.47%<br />
Total Budget 964,254 945,786 1,711,849 1,812,175 1,955,077 1,993,811 16.47%<br />
Revenue Sources<br />
FY 2009<br />
Actual<br />
FY 2010<br />
Actual<br />
FY 2011<br />
Adopted<br />
FY 2011<br />
Amended<br />
FY 2011<br />
E<strong>st</strong>imated<br />
FY 2012<br />
Proposed<br />
FY 2012<br />
Change<br />
Federal Grants 0 0 150,000 150,000 0 0 (100.00%)<br />
Other Charges For Services 58,623 55,955 55,800 55,800 70,069 53,105 (4.83%)<br />
Rents And Royalties 0 0 0 0 0 1,000 0.00%<br />
Contributions And Donations 0 0 420 420 0 0 (100.00%)<br />
Misc Revenue 3,589 593 0 0 282 540 0.00%<br />
General & Admini<strong>st</strong>rative 430,692 382,608 394,068 394,068 394,068 769,584 95.29%<br />
General Fund 471,351 506,629 1,111,561 1,211,887 1,490,658 1,169,582 5.22%<br />
Total Revenue 964,254 945,786 1,711,849 1,812,175 1,955,077 1,993,811 16.47%<br />
217
City <<strong>st</strong>rong>of</<strong>st</strong>rong> St. Petersburg, Florida - FY 2012 Proposed Fiscal Plan<br />
Position Summary<br />
FY 2009<br />
Actual<br />
FY 2010<br />
Actual<br />
FY 2011<br />
Adopted<br />
FY 2012<br />
Proposed<br />
FY 2012<br />
Change<br />
Mayor's Office Program 4.00 5.00 5.00 5.00 0.00%<br />
Action Center Program 3.00 1.00 1.00 1.00 0.00%<br />
Education & Government Services 1.00 2.00 2.00 3.00 50.00%<br />
Veterans, Homeless, & Social Services 0.00 1.00 1.00 1.00 0.00%<br />
Total Full-Time FTE 8.00 9.00 9.00 10.00 11.11%<br />
Action Center Program 0.00 1.00 1.00 0.80 (20.00%)<br />
Total Part-Time FTE 0.00 1.00 1.00 0.80 (20.00%)<br />
Total FTE 8.00 10.00 10.00 10.80 8.00%<br />
- The FY12 <strong>budget</strong> reflects the transfer <<strong>st</strong>rong>of</<strong>st</strong>rong> a grants and contracts position from the Budget & Management Department to the Mayor's Office's<br />
new Education & Government Services program. This new program will also absorb $376,000 in revenues and $102,896 in expenses from the<br />
former Internal Services Admini<strong>st</strong>ration Department's <strong>budget</strong> since it will be assuming a portion <<strong>st</strong>rong>of</<strong>st</strong>rong> its responsibilities. Additionally, Budgeted<br />
Salary Savings will be shown in the Budget Department's <strong>budget</strong> in<strong>st</strong>ead <<strong>st</strong>rong>of</<strong>st</strong>rong> the individual departments' <strong>budget</strong>s. As a result <<strong>st</strong>rong>of</<strong>st</strong>rong> these<br />
reorganizations, the Department's General Fund <strong>budget</strong> will increase by 16.47%.<br />
- One full-time Social Services Manager position and the Veteran's, Homeless, & Social Services function are transferred into the Mayor's<br />
Office <strong>budget</strong> from the Leisure & Community Services Admini<strong>st</strong>ration. The amount <<strong>st</strong>rong>of</<strong>st</strong>rong> social services funding remains unchanged at $721,000<br />
in FY12.<br />
- The Mayor's Office will take an <<strong>st</strong>rong>of</<strong>st</strong>rong>fsetting reduction eliminating a part-time Information Sy<strong>st</strong>ems Associate position resulting in an $18,267<br />
decrease.<br />
The Mayor's Office fir<strong>st</strong> performance measure addresses the Mayor's goals <<strong>st</strong>rong>of</<strong>st</strong>rong> Seamlessness. The second performance measure is linked to the<br />
Mayor's goal <<strong>st</strong>rong>of</<strong>st</strong>rong> Schools.<br />
Objective and Performance Measure<br />
Unit Of<br />
Measure<br />
FY 2009<br />
Actual<br />
FY 2010<br />
Actual<br />
FY 2011<br />
Target<br />
FY2011<br />
E<strong>st</strong>imate<br />
FY 2012<br />
Proposed<br />
Accessible Point <<strong>st</strong>rong>of</<strong>st</strong>rong> Contact for Citizens Reque<strong>st</strong>s/Info<br />
Mayor's Action Center is an accessible point <<strong>st</strong>rong>of</<strong>st</strong>rong> contact for citizens to reque<strong>st</strong> service or information. Inquiries are informational in nature and do<br />
not result in the generation <<strong>st</strong>rong>of</<strong>st</strong>rong> work orders. Work orders are reque<strong>st</strong>s for departmental action in response to a citizen. (Note: As a result <<strong>st</strong>rong>of</<strong>st</strong>rong> the<br />
anticipated reduction in <strong>st</strong>aff hours for the Mayor's Action Center in FY12, remaining <strong>st</strong>aff will no longer produce work orders. Phone calls<br />
requiring work orders will be redirected to departments, which will then produce work orders. Additionally, citizen inquiries will not be e<strong>st</strong>imated<br />
for FY12.)<br />
Citizen Inquiries - Action Center # 125,119 120,495 133,510 116,200 -<br />
Work Orders Generated # 20,504 26,866 22,525 19,476 -<br />
School Programs Objectives<br />
The objective <<strong>st</strong>rong>of</<strong>st</strong>rong> School Programs is to provide support to the public schools in the City <<strong>st</strong>rong>of</<strong>st</strong>rong> St. Petersburg by training volunteers and fundraising for<br />
our schools. (Note: The A+ Housing Teacher Housing program funding will end after FY10 and Corporate Partners have been capped at 100.)<br />
A+ Teacher Housing Loans Closed # 80 10 0 0 0<br />
Corporate Partners With City Public Schools # 100 100 100 100 100<br />
Funds Raised For St. Petersburg Schools $ 1,855,387 1,400,000 1,250,000 1,000,000 800,000<br />
Number <<strong>st</strong>rong>of</<strong>st</strong>rong> Doorways Scholarships # 125 125 100 50 50<br />
Number <<strong>st</strong>rong>of</<strong>st</strong>rong> Mentors Trained # 140 118 175 120 120<br />
218
City <<strong>st</strong>rong>of</<strong>st</strong>rong> St. Petersburg, Florida - FY 2012 Proposed Fiscal Plan<br />
Leisure & Community Services Admini<strong>st</strong>ration<br />
Leisure & Community Services Admini<strong>st</strong>ration<br />
Total Full Time Equivalents (FTE) = 642.52<br />
Golf Course Department<br />
Total Full Time Equivalents (FTE) = 49.50<br />
Housing Department<br />
Total Full Time Equivalents (FTE) = 18.00<br />
Leisure & Community Services Admini<strong>st</strong>ration Department<br />
Total Full Time Equivalents (FTE) = 2.00<br />
Library Department<br />
Total Full Time Equivalents (FTE) = 73.50<br />
Neighborhood Partnership Department<br />
Total Full Time Equivalents (FTE) = 3.00<br />
Parks & Recreation Department<br />
Total Full Time Equivalents (FTE) = 496.52<br />
219
City <<strong>st</strong>rong>of</<strong>st</strong>rong> St. Petersburg, Florida - FY 2012 Proposed Fiscal Plan<br />
Leisure & Community Services Admini<strong>st</strong>ration<br />
Budgetary Co<strong>st</strong> Summary<br />
FY 2009<br />
Actual<br />
FY 2010<br />
Actual<br />
FY 2011<br />
Adopted<br />
FY 2011<br />
Amended<br />
FY 2011<br />
E<strong>st</strong>imated<br />
FY 2012<br />
Proposed<br />
FY 2012<br />
Change<br />
Wages And Benefits 29,115,611 29,361,318 29,884,883 30,411,231 29,729,694 28,758,770 (3.77%)<br />
Services And Commodities 19,595,570 24,083,996 14,750,022 25,138,851 24,181,884 14,426,202 (2.20%)<br />
Capital 1,588,411 2,882,760 850,083 6,813,644 865,230 736,021 (13.42%)<br />
Debt 52,888 4,407 38,000 38,000 0 49,500 30.26%<br />
Grants And Aid 330,078 8,258 20,700 20,700 2,184 510,700 2367.15%<br />
Transfers Out 285,605 841,153 828,632 828,632 233,583 780,431 (5.82%)<br />
Total Budget 50,968,163 57,181,892 46,372,320 63,251,058 55,012,575 45,261,624 (2.40%)<br />
Appropriations By<br />
Fund/Department<br />
FY 2009<br />
Actual<br />
FY 2010<br />
Actual<br />
FY 2011<br />
Adopted<br />
FY 2011<br />
Amended<br />
FY 2011<br />
E<strong>st</strong>imated<br />
FY 2012<br />
Proposed<br />
FY 2012<br />
Change<br />
General Operating Fund<br />
Golf Course Department 72 24 0 0 0 0 0.00%<br />
Housing Department 346,061 353,059 345,868 345,868 416,012 328,575 (5.00%)<br />
Leisure & Community Services<br />
Admini<strong>st</strong>ration Department<br />
347,854 306,075 285,431 285,974 246,174 279,032 (2.24%)<br />
Library Department 6,016,993 6,114,425 5,972,889 5,975,581 5,750,107 5,940,541 (0.54%)<br />
Neighborhood Partnership Department 449,652 425,128 361,947 361,947 405,919 333,533 (7.85%)<br />
Parks & Recreation Department 31,165,697 31,476,650 31,051,275 32,161,340 32,110,426 30,502,161 (1.77%)<br />
Total General Operating Fund 38,326,329 38,675,362 38,017,410 39,130,710 38,928,638 37,383,842 (1.67%)<br />
Non-General Funds<br />
American Recovery & Reinve<strong>st</strong>ment<br />
Act<br />
3,895 481,345 0 0 51,168 0 0.00%<br />
Community Development Block<br />
Grant<br />
1,818,143 2,393,219 2,515,745 5,199,931 2,993,012 2,092,593 (16.82%)<br />
Community Housing Tru<strong>st</strong> 1,361,566 1,587,977 0 1,347,818 1,335,077 0 0.00%<br />
Emergency Shelter Grant Fund 0 0 97,573 97,573 99,156 97,039 (0.55%)<br />
Golf Course Operating 3,959,603 3,580,062 3,801,889 3,826,106 3,645,356 3,759,127 (1.12%)<br />
Home Program 2,002,528 2,392,248 1,539,703 1,540,060 1,548,239 1,429,023 (7.19%)<br />
Local Housing Assi<strong>st</strong>ance 2,656,732 3,310,412 400,000 3,306,187 3,031,602 500,000 25.00%<br />
Neighborhood Stabilization<br />
Program<br />
839,249 4,761,266 0 8,802,673 3,380,327 0 0.00%<br />
Parking Revenue 120 0 0 0 0 0 0.00%<br />
Total Non-General Funds 12,641,835 18,506,530 8,354,910 24,120,348 16,083,937 7,877,782 (5.71%)<br />
Total Budget 50,968,163 57,181,892 46,372,320 63,251,058 55,012,575 45,261,624 (2.40%)<br />
Revenue Sources<br />
FY 2009<br />
Actual<br />
FY 2010<br />
Actual<br />
FY 2011<br />
Adopted<br />
FY 2011<br />
Amended<br />
FY 2011<br />
E<strong>st</strong>imated<br />
FY 2012<br />
Proposed<br />
FY 2012<br />
Change<br />
Federal Grants 6,304,623 9,896,100 3,755,448 7,689,915 8,246,027 3,318,655 (11.63%)<br />
State Grants 167,509 89,765 0 0 0 0 0.00%<br />
State Shared Revenue 2,113,444 0 0 0 0 0 0.00%<br />
Grants From Other Local Units 2,263,437 1,098,865 838,807 1,277,478 838,807 838,807 0.00%<br />
General Government 8,761 39,431 39,350 39,350 41,990 56,600 43.84%<br />
Transportation Charges 103,802 103,178 85,000 85,000 20,621 155,000 82.35%<br />
Culture And Recreation Charges 9,485,950 8,636,643 10,083,584 10,096,804 10,394,869 10,543,199 4.56%<br />
Other Charges For Services 333,923 284,601 628,167 628,167 657,930 465,069 (25.96%)<br />
220
Revenue Sources<br />
City <<strong>st</strong>rong>of</<strong>st</strong>rong> St. Petersburg, Florida - FY 2012 Proposed Fiscal Plan<br />
FY 2009<br />
Actual<br />
FY 2010<br />
Actual<br />
FY 2011<br />
Adopted<br />
FY 2011<br />
Amended<br />
FY 2011<br />
E<strong>st</strong>imated<br />
FY 2012<br />
Proposed<br />
FY 2012<br />
Change<br />
Library Fines 128,463 132,161 142,810 142,810 47,827 137,520 (3.70%)<br />
Violation Of Local Ordinances 1,739 3,113 0 0 1,271 0 0.00%<br />
Intere<strong>st</strong> Earnings 617,370 428,903 22,030 22,030 106,718 8,750 (60.28%)<br />
Rents And Royalties 24,031 22,983 0 0 4,417 0 0.00%<br />
Sale Of Fixed Assets 14,176 82,996 0 0 0 0 0.00%<br />
Contributions And Donations 151,554 48,768 11,050 11,050 14,040 11,450 3.62%<br />
Misc Revenue 748,520 612,222 796,637 796,637 596,824 811,120 1.82%<br />
General & Admini<strong>st</strong>rative 167,364 140,508 144,720 144,720 144,720 144,720 0.00%<br />
Other Charges (142) 27 0 0 (40) 0 0.00%<br />
Transfer From General Fund 0 0 0 360,000 0 0 0.00%<br />
Transfer From Parking Revenue 2,556 0 0 0 0 0 0.00%<br />
Transfer From Weeki Wachee 47,766 0 0 0 0 0 0.00%<br />
General Fund 29,899,115 30,927,744 29,806,168 30,242,243 30,290,130 28,769,593 (3.48%)<br />
Neighborhood Stabilization<br />
(100,211) 424,934 0 4,733,540 (328,806) 0 0.00%<br />
Program<br />
American Recovery & Reinve<strong>st</strong>ment<br />
(2,076) (126,522) 0 0 (669,375) 0 0.00%<br />
Act<br />
Golf Course Operating 54,588 297,511 18,549 42,766 74,974 1,141 (93.85%)<br />
Community Development Block<br />
(1,377,367) (16,410) 0 2,684,186 613,145 0 0.00%<br />
Grant<br />
Home Program (24,964) (50,115) 0 357 0 0 0.00%<br />
Emergency Shelter Grant Fund 0 0 0 0 0 0 0.00%<br />
Local Housing Assi<strong>st</strong>ance (476,919) 2,635,147 0 2,906,187 2,631,041 0 0.00%<br />
Community Housing Tru<strong>st</strong> 361,895 1,587,977 0 1,347,818 1,335,077 0 0.00%<br />
Emergency Medical Services (260) (3,059) 0 0 (101) 0 0.00%<br />
Local Option Tax Revenue 0 (443) 0 0 0 0 0.00%<br />
Billing & Collections (338) 0 0 0 0 0 0.00%<br />
Downtown Redevelopment Di<strong>st</strong>rict (49,368) (114,562) 0 0 (49,315) 0 0.00%<br />
Jame<strong>st</strong>own Complex (799) (177) 0 0 (86) 0 0.00%<br />
Parking Revenue 21 (398) 0 0 (130) 0 0.00%<br />
Total Revenue 50,968,163 57,181,892 46,372,320 63,251,058 55,012,575 45,261,624 (2.40%)<br />
Position Summary By Department<br />
FY 2009<br />
Actual<br />
FY 2010<br />
Actual<br />
FY 2011<br />
Adopted<br />
FY 2012<br />
Proposed<br />
FY 2012<br />
Change<br />
Golf Course Department 28.00 26.00 26.00 24.00 (7.69%)<br />
Housing Department 21.00 21.00 20.00 18.00 (10.00%)<br />
Leisure & Community Services Admini<strong>st</strong>ration Department 2.00 3.00 2.00 2.00 0.00%<br />
Library Department 69.00 68.00 68.00 65.00 (4.41%)<br />
Neighborhood Partnership Department 4.00 4.00 4.00 3.00 (25.00%)<br />
Parks & Recreation Department 270.00 265.00 264.00 252.75 (4.26%)<br />
Total Full-Time FTE 394.00 387.00 384.00 364.75 (5.01%)<br />
Golf Course Department 25.65 24.00 24.00 25.50 6.25%<br />
Library Department 11.00 11.00 11.00 8.50 (22.73%)<br />
Parks & Recreation Department 273.34 259.00 256.80 243.77 (5.08%)<br />
Total Part-Time FTE 309.99 294.00 291.80 277.77 (4.81%)<br />
Total FTE 703.99 681.00 675.80 642.52 (4.93%)<br />
221
City <<strong>st</strong>rong>of</<strong>st</strong>rong> St. Petersburg, Florida - FY 2012 Proposed Fiscal Plan<br />
Department Mission Statement<br />
Golf Course Department<br />
The mission <<strong>st</strong>rong>of</<strong>st</strong>rong> the City <<strong>st</strong>rong>of</<strong>st</strong>rong> St. Petersburg's Golf Courses Department is to provide out<strong>st</strong>anding golf courses, programs, and practice facilities to the residents and<br />
visitors <<strong>st</strong>rong>of</<strong>st</strong>rong> St. Petersburg. Our excellent golf courses, programs, and practice facilities are provided at a tremendous value that covers 100% <<strong>st</strong>rong>of</<strong>st</strong>rong> all operational and<br />
<strong>capital</strong> expenditures by a courteous and pr<<strong>st</strong>rong>of</<strong>st</strong>rong>essional <strong>st</strong>aff.<br />
Services Provided<br />
• Golf Courses Admini<strong>st</strong>ration: Direction and leadership for the management and operation <<strong>st</strong>rong>of</<strong>st</strong>rong> three municipal golf facilities, including golf turf grass<br />
maintenance and facility maintenance; food and beverage operations; pro shop retail operations; player development through adult in<strong>st</strong>ructional programs,<br />
marketing programs for all three golf courses, and support and assi<strong>st</strong>ance for Fir<strong>st</strong> Tee program along with management <<strong>st</strong>rong>of</<strong>st</strong>rong> the agreement with The Fir<strong>st</strong> Tee youth<br />
golf program; personnel management, development and training; fiscal management; driving range operations; tournament, league and special event programs for<br />
the golfing public; and cu<strong>st</strong>omer services to residents and visitors. Works with Mayor's Golf Courses Advisory Committee.<br />
• Mangrove Bay Business: Sells green fees, merchandise, books reservations for more than 70,000 residents and visitors annually, and collects more than<br />
$2,500,000 annually, while providing excellent cu<strong>st</strong>omer service. Offers pro shop merchandise for resale and admini<strong>st</strong>ers events, tournaments, leagues and<br />
outings, while providing exceptional cu<strong>st</strong>omer service.<br />
• Mangrove Bay Concessions: Food and beverage for resale and cu<strong>st</strong>omer service at Mangrove Bay Golf Course, through three locations: the clubhouse, the<br />
<strong>st</strong>arters building, and the on course beverage cart.<br />
• Mangrove Bay Golf Carts: Maintain fleet <<strong>st</strong>rong>of</<strong>st</strong>rong> 84 golf carts; present and <strong>st</strong>age clean and operationally safe golf carts for cu<strong>st</strong>omers; provide routine<br />
maintenance on entire fleet <<strong>st</strong>rong>of</<strong>st</strong>rong> 84 golf carts; retrieve and wash golf driving range balls.<br />
• Mangrove Bay Starter/Driving Range: Sells range balls to more than 40,000 golfing cu<strong>st</strong>omers annually, <strong>st</strong>art and assi<strong>st</strong> more than 70,000 golfers annually<br />
during their round, manage pace <<strong>st</strong>rong>of</<strong>st</strong>rong> play programs to help ensure good play times, and provide exceptional cu<strong>st</strong>omer service to enhance the cu<strong>st</strong>omers golfing<br />
experience.<br />
• Cypress Links Business: Sells green fees, merchandise, books reservations and provides <strong>st</strong>arting and course ranging services for more than 37,000 residents<br />
and visitors annually; collects more than $400,000 annually; admini<strong>st</strong>ers tournaments, leagues and outings, manages a fleet <<strong>st</strong>rong>of</<strong>st</strong>rong> 12 golf carts; provides excellent<br />
cu<strong>st</strong>omer service.<br />
• Twin Brooks Business: Sells green fees, merchandise, books reservations for more than 20,000 residents and visitors annually, and collects more than<br />
$460,000 annually; sells driving range balls to more than 24,000 cu<strong>st</strong>omers annually; admini<strong>st</strong>ers events, tournaments, leagues and outings; provides out<strong>st</strong>anding<br />
cu<strong>st</strong>omer service.<br />
• Golf Courses Vehicle Maintenance: Provides preventative, routine maintenance and repairs <<strong>st</strong>rong>of</<strong>st</strong>rong> turf equipment utilized at Mangrove Bay, Cypress Links, and<br />
Twin Brooks Golf Courses.<br />
• Mangrove Bay/Cypress Links Maintenance: Promote, manicure and maintain healthy turf grass on 180 acre, 18 hole championship Mangrove Bay Golf<br />
Course and driving range, and 17 acre, 9 hole Cypress Links Golf Course, by utilizing be<strong>st</strong> management and cultural practices. Putting surfaces are mowed<br />
everyday and the golf course is set-up for play every day but Chri<strong>st</strong>mas. Mowing <<strong>st</strong>rong>of</<strong>st</strong>rong> all turf areas on a daily basis, bunker maintenance, chemical and fertilizer<br />
management, water management, irrigation maintenance <<strong>st</strong>rong>of</<strong>st</strong>rong> more than 1,000 irrigation heads and one pump <strong>st</strong>ation, repairs and maintenance to bridges and course<br />
shelters/re<strong>st</strong>rooms, general maintenance <<strong>st</strong>rong>of</<strong>st</strong>rong> all outside areas on the property, and tree and plant maintenance and management.<br />
• Twin Brooks Maintenance: Promote, manicure and maintain healthy turf grass on 29 acre, 18 hole, par three Twin Brooks Golf Course and driving range, by<br />
utilizing be<strong>st</strong> management and cultural practices. Mowing <<strong>st</strong>rong>of</<strong>st</strong>rong> all turf areas on a daily basis, chemical and fertilizer management, water management, irrigation<br />
maintenance <<strong>st</strong>rong>of</<strong>st</strong>rong> more than 300 irrigation heads, one pump <strong>st</strong>ation, repairs and maintenance to on course bridges, general maintenance <<strong>st</strong>rong>of</<strong>st</strong>rong> all outside areas on the<br />
property, and tree/plant maintenance and management.<br />
Budgetary Co<strong>st</strong> Summary<br />
FY 2009<br />
Actual<br />
FY 2010<br />
Actual<br />
FY 2011<br />
Adopted<br />
FY 2011<br />
Amended<br />
FY 2011<br />
E<strong>st</strong>imated<br />
FY 2012<br />
Proposed<br />
FY 2012<br />
Change<br />
Wages And Benefits 2,267,385 2,157,385 2,190,731 2,190,731 2,124,522 2,171,521 (0.88%)<br />
Services And Commodities 1,608,722 1,350,023 1,484,058 1,508,275 1,515,422 1,458,106 (1.75%)<br />
Capital 30,681 68,272 89,100 89,100 5,412 80,000 (10.21%)<br />
Debt 52,888 4,407 38,000 38,000 0 49,500 30.26%<br />
Total Budget 3,959,675 3,580,086 3,801,889 3,826,106 3,645,356 3,759,127 (1.12%)<br />
Appropriations By Fund/Program<br />
FY 2009<br />
Actual<br />
FY 2010<br />
Actual<br />
FY 2011<br />
Adopted<br />
FY 2011<br />
Amended<br />
FY 2011<br />
E<strong>st</strong>imated<br />
FY 2012<br />
Proposed<br />
FY 2012<br />
Change<br />
General Operating Fund<br />
Leisure & Community Services<br />
Admini<strong>st</strong>ration Program<br />
72 24 0 0 0 0 0.00%<br />
Golf Course Operating<br />
Golf Courses Maintenance Program 1,238,956 1,261,411 1,318,620 1,339,106 1,155,361 1,338,756 1.53%<br />
222
Appropriations By Fund/Program<br />
City <<strong>st</strong>rong>of</<strong>st</strong>rong> St. Petersburg, Florida - FY 2012 Proposed Fiscal Plan<br />
FY 2009<br />
Actual<br />
FY 2010<br />
Actual<br />
FY 2011<br />
Adopted<br />
FY 2011<br />
Amended<br />
FY 2011<br />
E<strong>st</strong>imated<br />
FY 2012<br />
Proposed<br />
FY 2012<br />
Change<br />
Golf Courses Operations Program 1,824,581 1,643,194 1,795,037 1,798,477 1,648,703 1,767,921 (1.51%)<br />
Golf Courses Program 663,273 668,766 688,232 688,523 841,292 652,450 (5.20%)<br />
The Fir<strong>st</strong> Tee Program 232,794 6,691 0 0 0 0 0.00%<br />
Totals for Golf Course Operating 3,959,603 3,580,062 3,801,889 3,826,106 3,645,356 3,759,127 (1.12%)<br />
Total Budget 3,959,675 3,580,086 3,801,889 3,826,106 3,645,356 3,759,127 (1.12%)<br />
Revenue Sources<br />
FY 2009<br />
Actual<br />
FY 2010<br />
Actual<br />
FY 2011<br />
Adopted<br />
FY 2011<br />
Amended<br />
FY 2011<br />
E<strong>st</strong>imated<br />
FY 2012<br />
Proposed<br />
FY 2012<br />
Change<br />
State Grants 35,000 0 0 0 0 0 0.00%<br />
Culture And Recreation Charges 3,719,831 3,272,489 3,780,250 3,780,250 3,567,296 3,756,120 (0.64%)<br />
Other Charges For Services 1,056 2,819 1,060 1,060 2,867 1,060 0.00%<br />
Intere<strong>st</strong> Earnings 2,028 269 2,030 2,030 27 806 (60.30%)<br />
Sale Of Fixed Assets 5,550 0 0 0 0 0 0.00%<br />
Contributions And Donations 140,907 4,480 0 0 0 0 0.00%<br />
Misc Revenue 1,434 2,083 0 0 232 0 0.00%<br />
Other Charges (790) 410 0 0 (40) 0 0.00%<br />
Golf Course Operating 54,588 297,511 18,549 42,766 74,974 1,141 (93.85%)<br />
General Fund 72 24 0 0 0 0 0.00%<br />
Total Revenue 3,959,675 3,580,086 3,801,889 3,826,106 3,645,356 3,759,127 (1.12%)<br />
Position Summary<br />
FY 2009<br />
Actual<br />
FY 2010<br />
Actual<br />
FY 2011<br />
Adopted<br />
FY 2012<br />
Proposed<br />
FY 2012<br />
Change<br />
Golf Courses Program 2.00 2.00 2.00 2.00 0.00%<br />
Golf Courses Operations Program 14.00 12.00 12.00 10.00 (16.67%)<br />
Golf Courses Maintenance Program 12.00 12.00 12.00 12.00 0.00%<br />
Total Full-Time FTE 28.00 26.00 26.00 24.00 (7.69%)<br />
Golf Courses Operations Program 20.85 19.50 19.00 19.25 1.32%<br />
Golf Courses Maintenance Program 4.80 4.50 5.00 6.25 25.00%<br />
Total Part-Time FTE 25.65 24.00 24.00 25.50 6.25%<br />
Total FTE 53.65 50.00 50.00 49.50 (1.00%)<br />
The Golf Courses Department has made several changes due to the downturn in the economy to remain pr<<strong>st</strong>rong>of</<strong>st</strong>rong>itable. The total reque<strong>st</strong> <<strong>st</strong>rong>of</<strong>st</strong>rong> $3.759<br />
million is 1.1% less than the adopted FY 2011.<br />
- The decrease is due to the reduction <<strong>st</strong>rong>of</<strong>st</strong>rong> a full-time Golf Course Attendant III position at Twin Brooks to a part-time Golf Course Attendant II, a<br />
full-time Golf Course Attendant III position at Cypress Links to a part-time Golf Course Attendant II, and miscellaneous line item reductions.<br />
- A $1.00 increase in 18-hole greens fees is scheduled to take effect at Mangrove Bay, Twin Brooks and Cypress Links for the winter and<br />
summer seasons. A $.50 increase in electric golf cart fees is scheduled to take effect at Cypress Links for the winter and summer seasons.<br />
- Funding is scheduled for turf equipment replacement as replacement <<strong>st</strong>rong>of</<strong>st</strong>rong> turf equipment has been limited due to <strong>budget</strong> reductions over the pa<strong>st</strong><br />
three years. The Golf Courses Department pays General & Admini<strong>st</strong>rative charges and Payment in Lieu <<strong>st</strong>rong>of</<strong>st</strong>rong> Taxes to the General Fund <<strong>st</strong>rong>of</<strong>st</strong>rong><br />
$402,132, and the ROI payment <<strong>st</strong>rong>of</<strong>st</strong>rong> $100,000 is temporarily put on hold until the Golf Courses fund balance is increased to a higher level.<br />
- The Golf Courses Department's performance measures address the Mayor's goals <<strong>st</strong>rong>of</<strong>st</strong>rong> Seamlessness, Service, and Sports, Arts, & Culture.<br />
223
Objective and Performance Measure<br />
City <<strong>st</strong>rong>of</<strong>st</strong>rong> St. Petersburg, Florida - FY 2012 Proposed Fiscal Plan<br />
Unit Of<br />
Measure<br />
FY 2009<br />
Actual<br />
FY 2010<br />
Actual<br />
FY 2011<br />
Target<br />
FY2011<br />
E<strong>st</strong>imate<br />
FY 2012<br />
Proposed<br />
Buckets <<strong>st</strong>rong>of</<strong>st</strong>rong> Range Balls Sold<br />
One objective <<strong>st</strong>rong>of</<strong>st</strong>rong> the Golf Courses Department is to maximize availability <<strong>st</strong>rong>of</<strong>st</strong>rong> range balls for sale to cu<strong>st</strong>omers.<br />
Mangrove Bay Buckets <<strong>st</strong>rong>of</<strong>st</strong>rong> Balls Sold # 45,209 33,297 47,518 44,146 44,151<br />
Twin Brooks Buckets <<strong>st</strong>rong>of</<strong>st</strong>rong> Balls Sold # 27,346 24,073 26,662 26,285 25,951<br />
Golf Course Maintenance<br />
One objective <<strong>st</strong>rong>of</<strong>st</strong>rong> the Golf Courses Department is to maximize be<strong>st</strong> management and cultural practices to maintain healthy turf conditions at optimal<br />
levels.<br />
Golf Courses Acres Maintained - Cypress Links # 17 17 17 17 17<br />
Golf Courses Acres Maintained - Mangrove Bay # 180 180 180 180 180<br />
Golf Courses Acres Maintained - Twin Brooks # 29 29 29 29 29<br />
Rounds <<strong>st</strong>rong>of</<strong>st</strong>rong> Golf Played<br />
One objective <<strong>st</strong>rong>of</<strong>st</strong>rong> the Golf Courses Department is to provide all golfers with a quality golf experience.<br />
Cypress Links Rounds <<strong>st</strong>rong>of</<strong>st</strong>rong> Golf Played # 38,244 32,050 38,902 36,570 36,345<br />
Mangrove Bay Rounds <<strong>st</strong>rong>of</<strong>st</strong>rong> Golf Played # 71,267 65,939 71,365 69,788 70,410<br />
Twin Brooks Rounds <<strong>st</strong>rong>of</<strong>st</strong>rong> Golf Played # 23,545 18,856 22,583 21,113 22,020<br />
224
Department Mission Statement<br />
City <<strong>st</strong>rong>of</<strong>st</strong>rong> St. Petersburg, Florida - FY 2012 Proposed Fiscal Plan<br />
Housing Department<br />
The mission <<strong>st</strong>rong>of</<strong>st</strong>rong> the Housing and Community Development Department is to utilize federal, <strong>st</strong>ate, and local funding to provide decent affordable housing, a<br />
suitable living environment, and to expand economic opportunities principally for persons with low and moderate incomes.<br />
Services Provided<br />
The department has three divisions: Admini<strong>st</strong>ration, Community Development Programs, and Housing Programs, and provides the following services:<br />
Community Development and Public Service:<br />
• Infra<strong>st</strong>ructure improvement projects<br />
• Capital projects (public facilities and improvements).<br />
• Funding to the Planning and Economic Development Department to provide job creation activities.<br />
• Funding for the provision <<strong>st</strong>rong>of</<strong>st</strong>rong> public services (homeless and special needs services, assi<strong>st</strong> agencies that help battered and abused spouses, and rental assi<strong>st</strong>ance<br />
to tenants).<br />
• Community Development Block Grant<br />
• Recovery Housing Programs:<br />
• Housing Rehabilitation, Emergency Repair, Lead Abatement, and Barrier Free Programs.<br />
• Purchase Assi<strong>st</strong>ance, Teacher Purchase Assi<strong>st</strong>ance, and Police in Neighborhoods (on hold) Programs.<br />
• Rental Rehabilitation, Hurricane Hardening and Housing Replacement Programs.<br />
• Developer/Inve<strong>st</strong>or Loan and Multi-Family Home Development Programs.<br />
• Community Housing Development Organizations, Home Ownership Counseling, and Predatory Lending Foreclosure Prevention.<br />
• Foreclosure Prevention Program.<br />
• Neighborhood Stabilization Program.<br />
• Homeless Prevention and Rapid Re-Housing. Dwight Jones Community Center:<br />
• Neighborhood Community Center, Boys & Girls Club, and Pinellas Opportunity Council. During the course <<strong>st</strong>rong>of</<strong>st</strong>rong> FY 2008-2009, the Housing and Community<br />
Development Department reque<strong>st</strong>ed that City Council amend the Annual Action Plan on three different occasions to include three additional programs to the<br />
City's initiatives to address Housing and Community concerns. The three new programs were:<br />
• Neighborhood Stabilization Program (NSP)-HUD allocated to the City $9,489,622 in funding to positively address the City's high incidence <<strong>st</strong>rong>of</<strong>st</strong>rong> foreclosures<br />
and to <strong>st</strong>abilize the neighborhoods.<br />
• Homeless Prevention and Rapid Re-Housing Program (HPRP)<br />
• HUD allocated to the City $914,999 in funding to rapidly re-house and to prevent homelessness to households who are at risk <<strong>st</strong>rong>of</<strong>st</strong>rong> becoming homeless.<br />
• Community Development Block Grant Recovery (CDBG-R) Program HUD allocated to the City $598,343 in funding for projects that can be quickly<br />
implemented to assi<strong>st</strong> with putting people back to work while making improvements to the City's infra<strong>st</strong>ructure.<br />
Budgetary Co<strong>st</strong> Summary<br />
FY 2009<br />
Actual<br />
FY 2010<br />
Actual<br />
FY 2011<br />
Adopted<br />
FY 2011<br />
Amended<br />
FY 2011<br />
E<strong>st</strong>imated<br />
FY 2012<br />
Proposed<br />
FY 2012<br />
Change<br />
Wages And Benefits 1,579,657 1,601,310 1,245,458 1,616,371 953,962 1,098,593 (11.79%)<br />
Services And Commodities 6,277,331 11,110,282 2,804,099 12,446,031 11,666,520 2,557,506 (8.79%)<br />
Capital 594,445 1,712,524 0 5,728,376 0 0 0.00%<br />
Grants And Aid 291,134 8,258 20,700 20,700 528 10,700 (48.31%)<br />
Transfers Out 285,605 841,153 828,632 828,632 233,583 780,431 (5.82%)<br />
Total Budget 9,028,172 15,273,527 4,898,889 20,640,110 12,854,593 4,447,230 (9.22%)<br />
Appropriations By Fund/Program<br />
FY 2009<br />
Actual<br />
FY 2010<br />
Actual<br />
FY 2011<br />
Adopted<br />
FY 2011<br />
Amended<br />
FY 2011<br />
E<strong>st</strong>imated<br />
FY 2012<br />
Proposed<br />
FY 2012<br />
Change<br />
General Operating Fund<br />
Housing Admini<strong>st</strong>ration Program 167,311 141,733 194,390 194,390 243,179 186,185 (4.22%)<br />
Housing Finance & Rehabilitation Program 119,344 157,844 109,406 109,406 152,003 100,262 (8.36%)<br />
Housing Program 59,406 53,482 42,072 42,072 20,830 42,128 0.13%<br />
Totals for General Operating Fund 346,061 353,059 345,868 345,868 416,012 328,575 (5.00%)<br />
American Recovery & Reinve<strong>st</strong>ment Act<br />
Housing Tru<strong>st</strong> Funds Program 3,895 481,345 0 0 51,168 0 0.00%<br />
Local Housing Assi<strong>st</strong>ance<br />
Local Housing Assi<strong>st</strong>ance (SHIP) Program 2,656,732 3,310,412 400,000 3,306,187 3,031,602 500,000 25.00%<br />
225
Appropriations By Fund/Program<br />
City <<strong>st</strong>rong>of</<strong>st</strong>rong> St. Petersburg, Florida - FY 2012 Proposed Fiscal Plan<br />
FY 2009<br />
Actual<br />
FY 2010<br />
Actual<br />
FY 2011<br />
Adopted<br />
FY 2011<br />
Amended<br />
FY 2011<br />
E<strong>st</strong>imated<br />
FY 2012<br />
Proposed<br />
FY 2012<br />
Change<br />
Community Development Block Grant<br />
Housing Tru<strong>st</strong> Funds Program 1,818,143 2,393,219 2,515,745 5,199,931 2,993,012 2,092,593 (16.82%)<br />
Emergency Shelter Grant Fund<br />
Housing Tru<strong>st</strong> Funds Program 0 0 97,573 97,573 99,156 97,039 (0.55%)<br />
Home Program<br />
Housing Tru<strong>st</strong> Funds Program 2,002,528 2,392,248 1,539,703 1,540,060 1,548,239 1,429,023 (7.19%)<br />
Neighborhood Stabilization Program<br />
Housing Tru<strong>st</strong> Funds Program 839,249 4,755,266 0 8,802,673 3,380,327 0 0.00%<br />
Community Housing Tru<strong>st</strong><br />
Housing Tru<strong>st</strong> Funds Program 1,361,566 1,587,977 0 1,347,818 1,335,077 0 0.00%<br />
Total Budget 9,028,172 15,273,527 4,898,889 20,640,110 12,854,593 4,447,230 (9.22%)<br />
Revenue Sources<br />
FY 2009<br />
Actual<br />
FY 2010<br />
Actual<br />
FY 2011<br />
Adopted<br />
FY 2011<br />
Amended<br />
FY 2011<br />
E<strong>st</strong>imated<br />
FY 2012<br />
Proposed<br />
FY 2012<br />
Change<br />
Federal Grants 5,806,496 9,342,817 3,755,448 7,464,581 8,187,280 3,318,655 (11.63%)<br />
State Grants 132,145 89,765 0 0 0 0 0.00%<br />
State Shared Revenue 2,113,444 0 0 0 0 0 0.00%<br />
Grants From Other Local Units 911,579 0 0 0 0 0 0.00%<br />
Other Charges For Services 0 0 0 0 126 0 0.00%<br />
Violation Of Local Ordinances 1,739 3,126 0 0 1,271 0 0.00%<br />
Intere<strong>st</strong> Earnings 615,341 428,634 20,000 20,000 106,691 7,944 (60.28%)<br />
Rents And Royalties 24,031 22,983 0 0 4,417 0 0.00%<br />
Sale Of Fixed Assets 0 79,287 0 0 0 0 0.00%<br />
Misc Revenue 747,584 620,707 777,573 777,573 607,472 792,056 1.86%<br />
Transfer From General Fund 0 0 0 360,000 0 0 0.00%<br />
Neighborhood Stabilization<br />
Program<br />
(100,211) 418,934 0 4,733,540 (328,806) 0 0.00%<br />
Emergency Shelter Grant Fund 0 0 0 0 0 0 0.00%<br />
American Recovery & Reinve<strong>st</strong>ment<br />
Act<br />
(2,076) (126,522) 0 0 (669,375) 0 0.00%<br />
Home Program (24,964) (50,115) 0 357 0 0 0.00%<br />
Community Development Block<br />
Grant<br />
(1,377,367) (16,410) 0 2,684,186 613,145 0 0.00%<br />
Local Housing Assi<strong>st</strong>ance (476,919) 2,635,147 0 2,906,187 2,631,041 0 0.00%<br />
Community Housing Tru<strong>st</strong> 361,895 1,587,977 0 1,347,818 1,335,077 0 0.00%<br />
General Fund 345,951 353,034 345,868 345,868 415,886 328,575 (5.00%)<br />
Downtown Redevelopment Di<strong>st</strong>rict (49,368) (114,562) 0 0 (49,315) 0 0.00%<br />
Parking Revenue (99) (398) 0 0 (130) 0 0.00%<br />
Emergency Medical Services (260) (699) 0 0 (101) 0 0.00%<br />
Jame<strong>st</strong>own Complex (799) (177) 0 0 (86) 0 0.00%<br />
Billing & Collections 30 0 0 0 0 0 0.00%<br />
Total Revenue 9,028,172 15,273,527 4,898,889 20,640,110 12,854,593 4,447,230 (9.22%)<br />
Position Summary<br />
FY 2009<br />
Actual<br />
FY 2010<br />
Actual<br />
FY 2011<br />
Adopted<br />
FY 2012<br />
Proposed<br />
FY 2012<br />
Change<br />
Housing Admini<strong>st</strong>ration Program 4.00 0.65 0.79 0.97 22.78%<br />
Housing Program 6.00 0.26 1.16 0.16 (86.21%)<br />
Housing Finance & Rehabilitation Program 11.00 1.70 3.99 2.81 (29.57%)<br />
Housing Tru<strong>st</strong> Funds Program 0.00 18.39 14.06 14.06 0.00%<br />
Total Full-Time FTE 21.00 21.00 20.00 18.00 (10.00%)<br />
226
City <<strong>st</strong>rong>of</<strong>st</strong>rong> St. Petersburg, Florida - FY 2012 Proposed Fiscal Plan<br />
Position Summary<br />
FY 2009<br />
Actual<br />
FY 2010<br />
Actual<br />
FY 2011<br />
Adopted<br />
FY 2012<br />
Proposed<br />
FY 2012<br />
Change<br />
Total FTE 21.00 21.00 20.00 18.00 (10.00%)<br />
Housing & Community Development charges about 20% <<strong>st</strong>rong>of</<strong>st</strong>rong> its <strong>operating</strong> <strong>budget</strong> to the General Fund, with the remaining 80% coming from the<br />
department's grant resources.<br />
- 5% reduction <<strong>st</strong>rong>of</<strong>st</strong>rong> $17,293 would be achieved by transferring salary and benefits co<strong>st</strong>s out <<strong>st</strong>rong>of</<strong>st</strong>rong> the General Fund to the department's grant<br />
resources.<br />
- The Housing Department's performance measures address the Mayor's goals <<strong>st</strong>rong>of</<strong>st</strong>rong> Seamlessness and Su<strong>st</strong>ainability.<br />
Objective and Performance Measure<br />
Unit Of<br />
Measure<br />
FY 2009<br />
Actual<br />
FY 2010<br />
Actual<br />
FY 2011<br />
Target<br />
FY2011<br />
E<strong>st</strong>imate<br />
FY 2012<br />
Proposed<br />
Neighborhood Stabilization Program 1 (NSP-1) Production<br />
To determine the number <<strong>st</strong>rong>of</<strong>st</strong>rong> homes acquired, con<strong>st</strong>ructed and/or rehabilitated. Loan production includes units generated under various <strong>st</strong>rategies<br />
such as units purchased, con<strong>st</strong>ructed and/or rehabilitated by the City, units acquired and rehabilitated by a non-pr<<strong>st</strong>rong>of</<strong>st</strong>rong>it, redevelopment <<strong>st</strong>rong>of</<strong>st</strong>rong> vacant<br />
properties, demolition <<strong>st</strong>rong>of</<strong>st</strong>rong> acquired properties, and placement <<strong>st</strong>rong>of</<strong>st</strong>rong> properties in a land bank.<br />
NSP-1 Housing Production by Amount $ 0 5,016,569 4,482,393 3,982,393 500,000<br />
NSP-1 Housing Production by Units # 0 72 SFH, 2<br />
N/A N/A N/A<br />
Multi<br />
Neighborhood Stabilization Program 3 (NSP-3) Production<br />
To determine the number <<strong>st</strong>rong>of</<strong>st</strong>rong> homes acquired, con<strong>st</strong>ructed and/or rehabilitated. Loan production includes units generated under various <strong>st</strong>rategies<br />
such as units purchased, con<strong>st</strong>ructed and/or rehabilitated by the City, units acquired and rehabilitated by a non-pr<<strong>st</strong>rong>of</<strong>st</strong>rong>it, redevelopment <<strong>st</strong>rong>of</<strong>st</strong>rong> vacant<br />
properties, demolition <<strong>st</strong>rong>of</<strong>st</strong>rong> acquired properties, and placement <<strong>st</strong>rong>of</<strong>st</strong>rong> properties in a land bank.<br />
NSP-3 Housing Production by Units # 0 0 0 18 17<br />
Neighborhood Stabilization Program 3 (NSP-3) Production<br />
To determine the number <<strong>st</strong>rong>of</<strong>st</strong>rong> homes acquired, rehabilitated and sold. Loan production includes units generated under various <strong>st</strong>rategies such as units<br />
purchased, rehabilitated/con<strong>st</strong>ructed and sold by the City, units acquired rehabilitated and sold by a non-pr<<strong>st</strong>rong>of</<strong>st</strong>rong>it, redevelopment <<strong>st</strong>rong>of</<strong>st</strong>rong> vacant properties,<br />
demolition <<strong>st</strong>rong>of</<strong>st</strong>rong> acquired properties, and placement <<strong>st</strong>rong>of</<strong>st</strong>rong> properties in a land bank.<br />
NSP-3 Housing Production by Amount $ 0 0 0 1,854,566 1,854,567<br />
Working In Neighborhoods (W.I.N.) Loan Production<br />
To determine the number <<strong>st</strong>rong>of</<strong>st</strong>rong> loans closed from the W.I.N. Loan Production. Loan production includes units generated under various programs such<br />
as emergency repair, rehabilitation, hurricane hardening, and purchase assi<strong>st</strong>ance loans.<br />
W.I.N. Loan Production by Amount in Midtown $ 520,950 512,890 519,983 215,000 300,000<br />
W.I.N. Loan Production by Units # 172 137 98 50 75<br />
W.I.N. Unit Production in Midtown # 27 34 27 14 20<br />
227
City <<strong>st</strong>rong>of</<strong>st</strong>rong> St. Petersburg, Florida - FY 2012 Proposed Fiscal Plan<br />
Leisure & Community Services Admini<strong>st</strong>ration Department<br />
Department Mission Statement<br />
The mission <<strong>st</strong>rong>of</<strong>st</strong>rong> the Neighborhood Partnership Department is to be responsive to resident and neighborhood issues by coordinating City services to implement<br />
neighborhood improvement projects and to facilitate residents' active participation in community enhancements and neighborhood engagement.<br />
Services Provided<br />
The Leisure & Community Services Admini<strong>st</strong>ration Department provides the following services:<br />
• Admini<strong>st</strong>rative oversight and management <<strong>st</strong>rong>of</<strong>st</strong>rong> the Parks & Recreation, Golf Courses, Libraries, and Neighborhood Partnership Departments, and<br />
• Serves as the City's liaison to citizens, community groups, pr<<strong>st</strong>rong>of</<strong>st</strong>rong>essional organizations, elected <<strong>st</strong>rong>of</<strong>st</strong>rong>ficials, and other governmental organizations. the Veterans,<br />
Homeless & Social Services Program.<br />
Budgetary Co<strong>st</strong> Summary<br />
FY 2009<br />
Actual<br />
FY 2010<br />
Actual<br />
FY 2011<br />
Adopted<br />
FY 2011<br />
Amended<br />
FY 2011<br />
E<strong>st</strong>imated<br />
FY 2012<br />
Proposed<br />
FY 2012<br />
Change<br />
Wages And Benefits 240,413 245,506 228,442 228,442 226,625 230,383 0.85%<br />
Services And Commodities 72,440 60,569 56,989 57,532 19,549 48,649 (14.63%)<br />
Grants And Aid 35,000 0 0 0 0 0 0.00%<br />
Total Budget 347,854 306,075 285,431 285,974 246,174 279,032 (2.24%)<br />
Appropriations By Fund/Program<br />
FY 2009<br />
Actual<br />
FY 2010<br />
Actual<br />
FY 2011<br />
Adopted<br />
FY 2011<br />
Amended<br />
FY 2011<br />
E<strong>st</strong>imated<br />
FY 2012<br />
Proposed<br />
FY 2012<br />
Change<br />
General Operating Fund<br />
Leisure & Community Services<br />
347,854 304,225 285,431 285,431 246,174 279,032 (2.24%)<br />
Admini<strong>st</strong>ration Program<br />
Non-Department Program 0 1,850 0 543 0 0 0.00%<br />
Totals for General Operating Fund 347,854 306,075 285,431 285,974 246,174 279,032 (2.24%)<br />
Total Budget 347,854 306,075 285,431 285,974 246,174 279,032 (2.24%)<br />
Revenue Sources<br />
FY 2009<br />
Actual<br />
FY 2010<br />
Actual<br />
FY 2011<br />
Adopted<br />
FY 2011<br />
Amended<br />
FY 2011<br />
E<strong>st</strong>imated<br />
FY 2012<br />
Proposed<br />
FY 2012<br />
Change<br />
Other Charges For Services 30,623 9,148 0 0 0 0 0.00%<br />
Misc Revenue 0 0 0 0 0 0 0.00%<br />
General & Admini<strong>st</strong>rative 167,364 140,508 144,720 144,720 144,720 144,720 0.00%<br />
General Fund 149,867 156,419 140,711 141,254 101,454 134,312 (4.55%)<br />
Total Revenue 347,854 306,075 285,431 285,974 246,174 279,032 (2.24%)<br />
Position Summary<br />
FY 2009<br />
Actual<br />
FY 2010<br />
Actual<br />
FY 2011<br />
Adopted<br />
FY 2012<br />
Proposed<br />
FY 2012<br />
Change<br />
Leisure & Community Services Admini<strong>st</strong>ration Program 2.00 3.00 2.00 2.00 0.00%<br />
Total Full-Time FTE 2.00 3.00 2.00 2.00 0.00%<br />
Total FTE 2.00 3.00 2.00 2.00 0.00%<br />
228
City <<strong>st</strong>rong>of</<strong>st</strong>rong> St. Petersburg, Florida - FY 2012 Proposed Fiscal Plan<br />
- There are miscellaneous line item reductions totaling $2,880. This is less than 1% and will not affect service levels. Reductions made in other<br />
departments within this admini<strong>st</strong>ration, such as in Neighborhood Partnership, make the total reductions for the admini<strong>st</strong>ration exceed 5%.<br />
- During FY11, the Veteran's, Homeless, and Social Services Program was moved to the Mayor's Office. There was no net change to the<br />
General Fund.<br />
- The Leisure & Community Services Admini<strong>st</strong>ration Department's performance measures address the Mayor's goals <<strong>st</strong>rong>of</<strong>st</strong>rong> Seamlessness, Services,<br />
and Su<strong>st</strong>ainability.<br />
Objective and Performance Measure<br />
Unit Of<br />
Measure<br />
FY 2009<br />
Actual<br />
FY 2010<br />
Actual<br />
FY 2011<br />
Target<br />
FY2011<br />
E<strong>st</strong>imate<br />
FY 2012<br />
Proposed<br />
Social Services<br />
Assi<strong>st</strong>s in <strong>st</strong>rengthening communication with and involvement from local faith based organizations.<br />
Represent the City at policy, committee, and board<br />
# 0 18 20 20 20<br />
meetings<br />
Work with churches # 0 25 25 25 25<br />
Work with other funding entities # 0 24 24 24 24<br />
Social Services<br />
Identifies and prioritizes human service needs and advocates for addressing those needs.<br />
Meet with social service agencies # 0 35 35 35 35<br />
229
Department Mission Statement<br />
City <<strong>st</strong>rong>of</<strong>st</strong>rong> St. Petersburg, Florida - FY 2012 Proposed Fiscal Plan<br />
Library Department<br />
The mission <<strong>st</strong>rong>of</<strong>st</strong>rong> the St. Petersburg Public Library Sy<strong>st</strong>em is to provide library resources to meet the educational, recreational, cultural, intellectual, and social needs<br />
<<strong>st</strong>rong>of</<strong>st</strong>rong> our diverse community.<br />
Services Provided<br />
The St. Petersburg Public Library Sy<strong>st</strong>em, consi<strong>st</strong>ing <<strong>st</strong>rong>of</<strong>st</strong>rong> a Main Library and six branches, provides the following services:<br />
• Free access to a collection <<strong>st</strong>rong>of</<strong>st</strong>rong> print and non-print materials exceeding one half million items.<br />
• Free access to computers, the Internet, and a wide variety <<strong>st</strong>rong>of</<strong>st</strong>rong> online resources.<br />
• Pr<<strong>st</strong>rong>of</<strong>st</strong>rong>essional reference service in person, by telephone, text and via the Internet.<br />
• Access to databases, which include but are not limited to: Reference USA; World Book Online; Facts for Learning; LitFinder; Biography Resource Center;<br />
Infotrac; and LearnATe<strong>st</strong>.<br />
• Interlibrary loans.<br />
• Reciprocal borrowing.<br />
• Literacy programs for adults and children.<br />
• Outreach programming.<br />
• Children's programming.<br />
• Teen programming.<br />
• Adult programming.<br />
• Training and technology in<strong>st</strong>ruction.<br />
• Coin-operated public copiers and printers.<br />
• Real-time online regi<strong>st</strong>ration.<br />
• Reque<strong>st</strong> notification via phone, email and text.<br />
• Downloadable e-books and audio books.<br />
• Wireless access for laptop users.<br />
• Community room meeting space.<br />
• Books-to-Go Homebound Service.<br />
• Book discussion groups.<br />
• Federal, <strong>st</strong>ate, and local government documents.<br />
• Convenient 24-hour book returns at all libraries.<br />
• Mirror Lake Branch Library features a convenient drive-up window.<br />
• Log on @Your Library www.splibraries.org.<br />
Budgetary Co<strong>st</strong> Summary<br />
FY 2009<br />
Actual<br />
FY 2010<br />
Actual<br />
FY 2011<br />
Adopted<br />
FY 2011<br />
Amended<br />
FY 2011<br />
E<strong>st</strong>imated<br />
FY 2012<br />
Proposed<br />
FY 2012<br />
Change<br />
Wages And Benefits 4,065,814 4,163,601 4,163,770 4,163,770 4,267,193 4,138,390 (0.61%)<br />
Services And Commodities 1,304,470 1,297,226 1,206,776 1,209,387 880,523 1,241,065 2.84%<br />
Capital 646,708 653,598 602,343 602,424 602,391 561,086 (6.85%)<br />
Total Budget 6,016,993 6,114,425 5,972,889 5,975,581 5,750,107 5,940,541 (0.54%)<br />
Appropriations By Fund/Program<br />
FY 2009<br />
Actual<br />
FY 2010<br />
Actual<br />
FY 2011<br />
Adopted<br />
FY 2011<br />
Amended<br />
FY 2011<br />
E<strong>st</strong>imated<br />
FY 2012<br />
Proposed<br />
FY 2012<br />
Change<br />
General Operating Fund<br />
Libraries Admini<strong>st</strong>ration Program<br />
Library Branches Program<br />
2,148,745<br />
3,868,248<br />
2,165,001<br />
3,949,424<br />
1,978,234<br />
3,994,655<br />
1,978,315<br />
3,997,266<br />
2,132,364<br />
3,617,743<br />
1,951,794<br />
3,988,747<br />
(1.34%)<br />
(0.15%)<br />
Totals for General Operating Fund 6,016,993 6,114,425 5,972,889 5,975,581 5,750,107 5,940,541 (0.54%)<br />
Total Budget 6,016,993 6,114,425 5,972,889 5,975,581 5,750,107 5,940,541 (0.54%)<br />
230
Revenue Sources<br />
City <<strong>st</strong>rong>of</<strong>st</strong>rong> St. Petersburg, Florida - FY 2012 Proposed Fiscal Plan<br />
FY 2009<br />
Actual<br />
FY 2010<br />
Actual<br />
FY 2011<br />
Adopted<br />
FY 2011<br />
Amended<br />
FY 2011<br />
E<strong>st</strong>imated<br />
FY 2012<br />
Proposed<br />
FY 2012<br />
Change<br />
Federal Grants 2,375 0 0 0 0 0 0.00%<br />
State Grants 364 0 0 0 0 0 0.00%<br />
General Government 8,554 39,356 38,750 38,750 41,990 56,000 44.52%<br />
Culture And Recreation Charges 908,188 832,437 890,159 890,159 698,162 787,519 (11.53%)<br />
Library Fines 128,463 132,161 142,810 142,810 47,827 137,520 (3.70%)<br />
Sale Of Fixed Assets 7,205 2,030 0 0 0 0 0.00%<br />
Contributions And Donations 1,007 734 1,050 1,050 446 1,450 38.10%<br />
Misc Revenue (255) (34) 0 0 (18) 0 0.00%<br />
Other Charges (75) 10 0 0 0 0 0.00%<br />
General Fund 4,961,167 5,107,732 4,900,120 4,902,812 4,961,700 4,958,052 1.18%<br />
Total Revenue 6,016,993 6,114,425 5,972,889 5,975,581 5,750,107 5,940,541 (0.54%)<br />
Position Summary<br />
FY 2009<br />
Actual<br />
FY 2010<br />
Actual<br />
FY 2011<br />
Adopted<br />
FY 2012<br />
Proposed<br />
FY 2012<br />
Change<br />
Libraries Admini<strong>st</strong>ration Program 12.00 14.00 14.00 14.00 0.00%<br />
Library Branches Program 57.00 54.00 54.00 51.00 (5.56%)<br />
Total Full-Time FTE 69.00 68.00 68.00 65.00 (4.41%)<br />
Libraries Admini<strong>st</strong>ration Program 0.00 1.00 1.50 0.50 (66.67%)<br />
Library Branches Program 11.00 10.00 9.50 8.00 (15.79%)<br />
Total Part-Time FTE 11.00 11.00 11.00 8.50 (22.73%)<br />
Total FTE 80.00 79.00 79.00 73.50 (6.96%)<br />
- The Library Department <strong>budget</strong> will be reduced by less than 1% from the FY11 <strong>budget</strong>, but a total <<strong>st</strong>rong>of</<strong>st</strong>rong> 4.7% from the preliminary FY12 <strong>budget</strong>.<br />
The difference is due to greater accuracy in the personnel salary and benefits projections.<br />
- Total reductions for the Library Department are $285,680. This will be achieved from reductions in various line items ($48,049), <strong>st</strong>aff<br />
reorganizations ($35,781), eliminating three full-time positions and five part-time positions ($155,593), and reducing purchases for the Library<br />
collections ($41,257).<br />
- Full time position reductions are three Library Assi<strong>st</strong>ant I positions. Part-time position reductions are three Library Aide positions, one<br />
Library Assi<strong>st</strong>ant I positions, and one Security Officer position.<br />
- This would result in a reduction <<strong>st</strong>rong>of</<strong>st</strong>rong> 36 <strong>operating</strong> hours sy<strong>st</strong>em-wide, or approximately 5 hours per branch per week.<br />
- The Library Department's performance measures address the Mayor's goals <<strong>st</strong>rong>of</<strong>st</strong>rong> Seamlessness, Service, Schools, and Sports, Arts & Culture.<br />
Objective and Performance Measure<br />
Unit Of<br />
Measure<br />
FY 2009<br />
Actual<br />
FY 2010<br />
Actual<br />
FY 2011<br />
Target<br />
FY2011<br />
E<strong>st</strong>imate<br />
FY 2012<br />
Proposed<br />
Circulation<br />
The objective <<strong>st</strong>rong>of</<strong>st</strong>rong> the Library Department is to provide patrons with a relevant and up-to-date library collection.<br />
Library Sy<strong>st</strong>em Circulation # 1,391,681 1,514,469 1,483,563 1,521,060 1,500,000<br />
Facility Use<br />
Increase the number <<strong>st</strong>rong>of</<strong>st</strong>rong> people using the St. Petersburg Public Library Sy<strong>st</strong>em. Increased facility use will increase circulation (amount <<strong>st</strong>rong>of</<strong>st</strong>rong> materials<br />
checked out) and internet/computer uses.<br />
231
City <<strong>st</strong>rong>of</<strong>st</strong>rong> St. Petersburg, Florida - FY 2012 Proposed Fiscal Plan<br />
Objective and Performance Measure<br />
Unit Of<br />
FY 2009 FY 2010 FY 2011 FY2011 FY 2012<br />
Measure<br />
Actual Actual Target E<strong>st</strong>imate Proposed<br />
Library Sy<strong>st</strong>em Facility Use # 1,413,098 1,442,069 1,485,593 1,413,696 1,490,000<br />
Internet/Computer Use<br />
To provide patrons with the means to access and use up-to-date technology.<br />
Library Sy<strong>st</strong>em Internet/Computer Uses # 379,666 470,709 429,099 420,621 430,000<br />
232
Department Mission Statement<br />
City <<strong>st</strong>rong>of</<strong>st</strong>rong> St. Petersburg, Florida - FY 2012 Proposed Fiscal Plan<br />
Neighborhood Partnership Department<br />
The mission <<strong>st</strong>rong>of</<strong>st</strong>rong> the Neighborhood Partnership Department is to be responsive to resident and neighborhood issues by coordinating City services to implement<br />
neighborhood improvement projects and to facilitate residents' active participation in community enhancements and neighborhood engagement.<br />
Services Provided<br />
The Neighborhood Partnership Department provides the following services:<br />
• Assi<strong>st</strong>ing residents reorganize exi<strong>st</strong>ing and creating new neighborhood and business associations.<br />
• Develop neighborhood plans.<br />
• Implement neighborhood plans.<br />
• Provide funding for improvements through the Neighborhood Partnership Matching Grant program.<br />
• Serve as liaison between neighborhood and the City Admini<strong>st</strong>ration to address quality <<strong>st</strong>rong>of</<strong>st</strong>rong> life issues.<br />
• Coordinate City's volunteer initiative, I CAN (Involved Citizens Active in Neighborhood) and two annual volunteer events - Scrubbin' da 'Burg and Carefe<strong>st</strong>.<br />
• Facilitate efforts between faith-based organizations and neighborhoods.<br />
Budgetary Co<strong>st</strong> Summary<br />
FY 2009<br />
Actual<br />
FY 2010<br />
Actual<br />
FY 2011<br />
Adopted<br />
FY 2011<br />
Amended<br />
FY 2011<br />
E<strong>st</strong>imated<br />
FY 2012<br />
Proposed<br />
FY 2012<br />
Change<br />
Wages And Benefits 321,849 337,622 290,023 290,023 332,332 271,605 (6.35%)<br />
Services And Commodities 127,803 87,507 71,924 71,924 73,587 61,928 (13.90%)<br />
Total Budget 449,652 425,128 361,947 361,947 405,919 333,533 (7.85%)<br />
Appropriations By Fund/Program<br />
FY 2009<br />
Actual<br />
FY 2010<br />
Actual<br />
FY 2011<br />
Adopted<br />
FY 2011<br />
Amended<br />
FY 2011<br />
E<strong>st</strong>imated<br />
FY 2012<br />
Proposed<br />
FY 2012<br />
Change<br />
General Operating Fund<br />
Neighborhood Partnership Program 449,652 425,128 361,947 361,947 405,919 333,533 (7.85%)<br />
Total Budget 449,652 425,128 361,947 361,947 405,919 333,533 (7.85%)<br />
Revenue Sources<br />
FY 2009<br />
Actual<br />
FY 2010<br />
Actual<br />
FY 2011<br />
Adopted<br />
FY 2011<br />
Amended<br />
FY 2011<br />
E<strong>st</strong>imated<br />
FY 2012<br />
Proposed<br />
FY 2012<br />
Change<br />
Contributions And Donations 1,320 20 0 0 0 0 0.00%<br />
Misc Revenue 26,550 (550) 19,064 19,064 0 19,064 0.00%<br />
General Fund 421,782 425,658 342,883 342,883 405,919 314,469 (8.29%)<br />
Total Revenue 449,652 425,128 361,947 361,947 405,919 333,533 (7.85%)<br />
Position Summary<br />
FY 2009<br />
Actual<br />
FY 2010<br />
Actual<br />
FY 2011<br />
Adopted<br />
FY 2012<br />
Proposed<br />
FY 2012<br />
Change<br />
Neighborhood Partnership Program 4.00 4.00 4.00 3.00 (25.00%)<br />
Total Full-Time FTE 4.00 4.00 4.00 3.00 (25.00%)<br />
Total FTE 4.00 4.00 4.00 3.00 (25.00%)<br />
- A 7.8% reduction is <strong>proposed</strong> by eliminating the Admini<strong>st</strong>rative Secretary position ($71,475) and using secretarial help from within the<br />
Leisure & Community Services Admini<strong>st</strong>ration Department.<br />
233
City <<strong>st</strong>rong>of</<strong>st</strong>rong> St. Petersburg, Florida - FY 2012 Proposed Fiscal Plan<br />
- The Neighborhood Partnership Department's performance measure addresses the Mayor's goal <<strong>st</strong>rong>of</<strong>st</strong>rong> Seamlessness.<br />
Objective and Performance Measure<br />
Unit Of<br />
Measure<br />
FY 2009<br />
Actual<br />
FY 2010<br />
Actual<br />
FY 2011<br />
Target<br />
FY2011<br />
E<strong>st</strong>imate<br />
FY 2012<br />
Proposed<br />
I CAN (Involved Citizens Active in Neighborhoods)<br />
Market and encourage citizen volunteer efforts through <<strong>st</strong>rong>city</<strong>st</strong>rong> collaborative partnerships with neighborhoods, non-pr<<strong>st</strong>rong>of</<strong>st</strong>rong>its, and public and private<br />
sector entities.<br />
# <<strong>st</strong>rong>of</<strong>st</strong>rong> Volunteers in City sponsored events # N/A N/A 3,000 3,000 3,500<br />
Neighborhood Partnership Grants<br />
Admini<strong>st</strong>er and implement annual Neighborhood Partnership Matching Grants Program to provide residents an opportunity to enhance the public<br />
rights-<<strong>st</strong>rong>of</<strong>st</strong>rong>-ways in their neighborhoods.<br />
# <<strong>st</strong>rong>of</<strong>st</strong>rong> Grants Awarded through Neighborhood Partnership<br />
Prog.<br />
# 9 6 9 6 9<br />
234
Department Mission Statement<br />
City <<strong>st</strong>rong>of</<strong>st</strong>rong> St. Petersburg, Florida - FY 2012 Proposed Fiscal Plan<br />
Parks & Recreation Department<br />
The St. Petersburg Parks & Recreation Department mission is to preserve, protect, maintain, and enhance the <<strong>st</strong>rong>city</<strong>st</strong>rong>'s parklands and recreational facilities and engage<br />
people in leisure activities that contribute to their quality <<strong>st</strong>rong>of</<strong>st</strong>rong> life.<br />
Services Provided<br />
The Parks & Recreation Department provides the following services:<br />
Recreation Section:<br />
• Programming, maintenance, and operation <<strong>st</strong>rong>of</<strong>st</strong>rong> 13 recreation centers.<br />
• Programming, maintenance, and operation <<strong>st</strong>rong>of</<strong>st</strong>rong> nine swimming pools and Treasure Island Beach.<br />
• Programming, maintenance, and operation <<strong>st</strong>rong>of</<strong>st</strong>rong> two community service centers and <<strong>st</strong>rong>city</<strong>st</strong>rong>wide advocacy for aging issues.<br />
• Planning and coordination <<strong>st</strong>rong>of</<strong>st</strong>rong> <<strong>st</strong>rong>city</<strong>st</strong>rong>wide services in therapeutic recreation, teen programs, special events, and <<strong>st</strong>rong>city</<strong>st</strong>rong>wide co-sponsored events.<br />
• Maintenance and operation <<strong>st</strong>rong>of</<strong>st</strong>rong> two skate parks and 66 hard surface tennis courts.<br />
Parks Section:<br />
• Admini<strong>st</strong>ration Division: Responsible for the overall admini<strong>st</strong>ration, support, marketing, leadership, planning, <strong>budget</strong> preparation, and fiscal management <<strong>st</strong>rong>of</<strong>st</strong>rong><br />
the Parks Section. Also admini<strong>st</strong>ers policies and procedures as directed by the Mayor and admini<strong>st</strong>ration. This division serves as a communication network for<br />
citizens and employees.<br />
• Facilities Maintenance Division: Plans, directs, implements, and coordinates facility repairs and contractor provided services in order to provide safe, clean,<br />
and attractive facilities <<strong>st</strong>rong>of</<strong>st</strong>rong> the highe<strong>st</strong> quality for the residents and visitors <<strong>st</strong>rong>of</<strong>st</strong>rong> St. Petersburg to enjoy their leisure pursuits.<br />
• Parks Programs and Maintenance, Horticulture Operations, and Boyd Hill and Clam Bayou Nature Preserves Division: Responsible for the development and<br />
maintenance <<strong>st</strong>rong>of</<strong>st</strong>rong> parks, grounds, and related equipment, including playgrounds, beaches, and facilities located within Park Di<strong>st</strong>ricts I & III. Provides <strong>st</strong>aff support<br />
for the Green Thumb Committee and City Beautiful Commission (CBC); coordinates the Annual CBC Awards Program, Gift Tree Program, and Paving the<br />
Future Brick Program; and provides grounds maintenance and necessary services at the Gizella Kopsick Palm Arboretum.<br />
• Park Maintenance, Equipment Coordination, Fore<strong>st</strong>ry, Large Mowing, and Tree Removal Division: Responsible for the development and maintenance <<strong>st</strong>rong>of</<strong>st</strong>rong><br />
parks, grounds, and related equipment; including playgrounds, beaches, and facilities located within Park Di<strong>st</strong>ricts II, IV and V. This division provides equipment<br />
coordination for the entire Leisure & Community Services Admini<strong>st</strong>ration, which involves providing fuel and equipment pick up for outlying areas. Also provides<br />
fore<strong>st</strong>ry functions <<strong>st</strong>rong>of</<strong>st</strong>rong> trimming, pruning, and removing <<strong>st</strong>rong>of</<strong>st</strong>rong> hazardous trees <<strong>st</strong>rong>city</<strong>st</strong>rong>wide. This division is also responsible for tree removals, large equipment mowing<br />
for all large, open areas within the parks sy<strong>st</strong>em and airport properties. Provides support to the City's Disa<strong>st</strong>er Operations Plan by <strong>operating</strong> as the primary agency<br />
for debris clearance.<br />
• Athletic Operations, Field Con<strong>st</strong>ruction and Maintenance, Inter<strong>st</strong>ate Maintenance, and Safety and Training Division: Responsible for the development and<br />
maintenance <<strong>st</strong>rong>of</<strong>st</strong>rong> athletic facilities, grounds, and related equipment. This division coordinates the admini<strong>st</strong>ration <<strong>st</strong>rong>of</<strong>st</strong>rong> adult athletic leagues and tournaments in<br />
s<<strong>st</strong>rong>of</<strong>st</strong>rong>tball, football, and basketball and the scheduling and rental use <<strong>st</strong>rong>of</<strong>st</strong>rong> athletic fields for adult and youth sports. Also oversees beautification grants and contract<br />
maintenance for City landscaping projects in<strong>st</strong>alled on <strong>st</strong>ate highways and the inter<strong>st</strong>ate sy<strong>st</strong>em. Performs routine con<strong>st</strong>ruction activities related to park<br />
maintenance and frequently assi<strong>st</strong>s with <strong>capital</strong> improvement projects involving parks and recreation facility development and/or renovation. Also responsible for<br />
safety and training <<strong>st</strong>rong>of</<strong>st</strong>rong> parks <strong>st</strong>aff and other related department projects.<br />
Budgetary Co<strong>st</strong> Summary<br />
FY 2009<br />
Actual<br />
FY 2010<br />
Actual<br />
FY 2011<br />
Adopted<br />
FY 2011<br />
Amended<br />
FY 2011<br />
E<strong>st</strong>imated<br />
FY 2012<br />
Proposed<br />
FY 2012<br />
Change<br />
Wages And Benefits 20,640,493 20,855,894 21,766,459 21,921,894 21,825,060 20,848,278 (4.22%)<br />
Services And Commodities 10,204,803 10,178,388 9,126,176 9,845,702 10,026,283 9,058,948 (0.74%)<br />
Capital 316,577 448,367 158,640 393,745 257,427 94,935 (40.16%)<br />
Grants And Aid 3,944 0 0 0 1,656 500,000 0.00%<br />
Total Budget 31,165,817 31,482,650 31,051,275 32,161,340 32,110,426 30,502,161 (1.77%)<br />
Appropriations By Fund/Program<br />
FY 2009<br />
Actual<br />
FY 2010<br />
Actual<br />
FY 2011<br />
Adopted<br />
FY 2011<br />
Amended<br />
FY 2011<br />
E<strong>st</strong>imated<br />
FY 2012<br />
Proposed<br />
FY 2012<br />
Change<br />
General Operating Fund<br />
Aquatics & Pools Program<br />
Athletics Operations<br />
2,640,174<br />
4,586,369<br />
2,778,905<br />
4,262,142<br />
2,936,807<br />
5,194,943<br />
3,020,945<br />
5,212,144<br />
2,535,237<br />
3,921,535<br />
2,695,691<br />
4,407,872<br />
(8.21%)<br />
(15.15%)<br />
Boyd Hill/Clam Bayou Nature Preserve<br />
1,222,038 1,156,350 943,190 969,447 642,187 933,682 (1.01%)<br />
Program<br />
Facilities Maintenance 1,579,774 1,669,416 517,737 536,002 443,143 623,220 20.37%<br />
Non-Department Program 0 1,173 34,520 34,520 42,642 27,572 (20.13%)<br />
Office on Aging Program 1,363,565 1,371,544 1,327,413 1,339,349 1,007,054 1,270,534 (4.28%)<br />
Park Maint & Equipment Coordination<br />
Program<br />
3,968,583 3,943,335 4,588,697 4,662,182 3,637,766 4,524,213 (1.41%)<br />
235
Appropriations By Fund/Program<br />
City <<strong>st</strong>rong>of</<strong>st</strong>rong> St. Petersburg, Florida - FY 2012 Proposed Fiscal Plan<br />
FY 2009<br />
Actual<br />
FY 2010<br />
Actual<br />
FY 2011<br />
Adopted<br />
FY 2011<br />
Amended<br />
FY 2011<br />
E<strong>st</strong>imated<br />
FY 2012<br />
Proposed<br />
FY 2012<br />
Change<br />
Parks Admini<strong>st</strong>ration/Support Program 655,482 786,810 948,325 959,233 480,365 688,174 (27.43%)<br />
Parks Maintenance & Horticulture Program 3,305,554 3,136,126 3,186,281 3,269,303 2,275,372 3,076,451 (3.45%)<br />
Recreation Admini<strong>st</strong>ration Program 3,928,354 4,323,236 2,560,545 3,262,882 2,168,431 3,088,141 20.60%<br />
Recreation Centers Program 6,350,163 6,365,186 7,413,102 7,452,355 12,624,839 7,563,223 2.03%<br />
Special Programs & Therapeutic Rec<br />
1,565,641 1,682,428 1,399,715 1,442,977 2,331,855 1,603,388 14.55%<br />
Program<br />
Totals for General Operating Fund 31,165,697 31,476,650 31,051,275 32,161,340 32,110,426 30,502,161 (1.77%)<br />
Parking Revenue<br />
Parking Revenue Program 120 0 0 0 0 0 0.00%<br />
Neighborhood Stabilization Program<br />
Housing Tru<strong>st</strong> Funds Program 0 6,000 0 0 0 0 0.00%<br />
Total Budget 31,165,817 31,482,650 31,051,275 32,161,340 32,110,426 30,502,161 (1.77%)<br />
Revenue Sources<br />
FY 2009<br />
Actual<br />
FY 2010<br />
Actual<br />
FY 2011<br />
Adopted<br />
FY 2011<br />
Amended<br />
FY 2011<br />
E<strong>st</strong>imated<br />
FY 2012<br />
Proposed<br />
FY 2012<br />
Change<br />
Federal Grants 495,753 553,282 0 225,334 58,747 0 0.00%<br />
Grants From Other Local Units 1,351,858 1,098,865 838,807 1,277,478 838,807 838,807 0.00%<br />
General Government 208 76 600 600 0 600 0.00%<br />
Transportation Charges 103,802 103,178 85,000 85,000 20,621 155,000 82.35%<br />
Culture And Recreation Charges 4,857,931 4,531,717 5,413,175 5,426,395 6,129,411 5,999,560 10.83%<br />
Other Charges For Services 302,245 272,634 627,107 627,107 654,937 464,009 (26.01%)<br />
Violation Of Local Ordinances 0 (13) 0 0 0 0 0.00%<br />
Sale Of Fixed Assets 1,421 1,680 0 0 0 0 0.00%<br />
Contributions And Donations 8,321 43,534 10,000 10,000 13,594 10,000 0.00%<br />
Misc Revenue (26,793) (9,983) 0 0 (10,862) 0 0.00%<br />
Other Charges 723 (393) 0 0 0 0 0.00%<br />
Transfer From Parking Revenue 2,556 0 0 0 0 0 0.00%<br />
Transfer From Weeki Wachee 47,766 0 0 0 0 0 0.00%<br />
General Fund 24,020,276 24,884,877 24,076,586 24,509,426 24,405,171 23,034,185 (4.33%)<br />
Emergency Medical Services 0 (2,360) 0 0 0 0 0.00%<br />
Local Option Tax Revenue 0 (443) 0 0 0 0 0.00%<br />
Billing & Collections (368) 0 0 0 0 0 0.00%<br />
Parking Revenue 120 0 0 0 0 0 0.00%<br />
Neighborhood Stabilization<br />
Program<br />
0 6,000 0 0 0 0 0.00%<br />
Total Revenue 31,165,817 31,482,650 31,051,275 32,161,340 32,110,426 30,502,161 (1.77%)<br />
Position Summary<br />
FY 2009<br />
Actual<br />
FY 2010<br />
Actual<br />
FY 2011<br />
Adopted<br />
FY 2012<br />
Proposed<br />
FY 2012<br />
Change<br />
Recreation Centers Program 50.00 49.00 47.00 48.00 2.13%<br />
Office on Aging Program 12.00 12.00 12.00 11.00 (8.33%)<br />
Aquatics & Pools Program 8.00 8.00 8.00 8.00 0.00%<br />
Recreation Admini<strong>st</strong>ration Program 14.00 22.00 22.00 21.00 (4.55%)<br />
Special Programs & Therapeutic Rec Program 8.00 9.00 9.00 9.00 0.00%<br />
Parks Admini<strong>st</strong>ration/Support Program 3.00 2.00 5.00 5.00 0.00%<br />
Parks Maintenance & Horticulture Program 34.00 34.00 34.00 34.00 0.00%<br />
Athletics Operations 75.00 55.50 56.00 47.75 (14.73%)<br />
Park Maint & Equipment Coordination Program 53.00 52.50 53.00 52.00 (1.89%)<br />
Boyd Hill/Clam Bayou Nature Preserve Program 13.00 13.00 9.00 9.00 0.00%<br />
Facilities Maintenance 0.00 8.00 9.00 8.00 (11.11%)<br />
Total Full-Time FTE 270.00 265.00 264.00 252.75 (4.26%)<br />
236
City <<strong>st</strong>rong>of</<strong>st</strong>rong> St. Petersburg, Florida - FY 2012 Proposed Fiscal Plan<br />
Position Summary<br />
FY 2009<br />
Actual<br />
FY 2010<br />
Actual<br />
FY 2011<br />
Adopted<br />
FY 2012<br />
Proposed<br />
FY 2012<br />
Change<br />
Recreation Centers Program 138.50 129.00 126.50 125.50 (0.79%)<br />
Office on Aging Program 6.00 4.50 4.50 4.50 0.00%<br />
Aquatics & Pools Program 81.00 82.00 75.80 68.47 (9.67%)<br />
Recreation Admini<strong>st</strong>ration Program 3.00 3.50 3.50 3.30 (5.71%)<br />
Special Programs & Therapeutic Rec Program 29.00 28.00 28.00 28.00 0.00%<br />
Parks Maintenance & Horticulture Program 1.00 1.00 5.00 4.00 (20.00%)<br />
Athletics Operations 12.84 7.00 8.50 6.50 (23.53%)<br />
Park Maint & Equipment Coordination Program 0.00 0.00 2.00 0.50 (75.00%)<br />
Boyd Hill/Clam Bayou Nature Preserve Program 2.00 4.00 3.00 3.00 0.00%<br />
Total Part-Time FTE 273.34 259.00 256.80 243.77 (5.08%)<br />
Total FTE 543.34 524.00 520.80 496.52 (4.66%)<br />
Revenue increases <<strong>st</strong>rong>of</<strong>st</strong>rong> $312,599 and includes FY11 revenue increases <<strong>st</strong>rong>of</<strong>st</strong>rong> $103,276 and new FY12 revenue <<strong>st</strong>rong>of</<strong>st</strong>rong> $209,323. The following are the<br />
changes <strong>proposed</strong> at this level:<br />
- Charge for CDL te<strong>st</strong>ing ($7,500)<br />
- Additional FDOT contract maintenance services, FY11 revenue <<strong>st</strong>rong>of</<strong>st</strong>rong> $54,657 and FY12 revenue <<strong>st</strong>rong>of</<strong>st</strong>rong> $91,751.<br />
- Additional fitness center fees at the Sunshine Center would raise additional revenue <<strong>st</strong>rong>of</<strong>st</strong>rong> $5,000 in FY11 and $5,000 in FY12.<br />
- Additional rental revenue at Office on Aging facilities would raise $2,500 in FY11 and $8,254 in FY12.<br />
- Increased revenue from Water Resources for landscaping. FY11 revenue <<strong>st</strong>rong>of</<strong>st</strong>rong> $21,119 and FY12 revenue <<strong>st</strong>rong>of</<strong>st</strong>rong> $36,643.<br />
- Execute contract with vendor for giant slides at Northwe<strong>st</strong> and Lake Vi<strong>st</strong>a Pools. Vendor will maintain insurances and licenses. Revenue <<strong>st</strong>rong>of</<strong>st</strong>rong><br />
$20,000 in both FY11 and FY12.<br />
- Facility maintenance <strong>st</strong>aff time for co-sponsored events ($5,652).<br />
- Charge adult sports participants resident fees ($10,000).<br />
- Increase recreation center facility rental rates by 10% ($11,664).<br />
- Increase park permit <strong>st</strong>aff co<strong>st</strong>s from $15 to $20 per hour ($4,939).<br />
- Transportation surcharge for van field trips ($7,920).<br />
Staffing at this level would be reduced by seven part-time and four full-time positions. The following are the changes <strong>proposed</strong> at this level:<br />
-In<strong>st</strong>all parking meters at Albert Whitted Park. FY11 revenue <<strong>st</strong>rong>of</<strong>st</strong>rong> $10,000 and FY12 revenue <<strong>st</strong>rong>of</<strong>st</strong>rong> $20,000.<br />
-Increase resident card fee from $10 to $15. There has been no increase since 2008 ($61,309).<br />
-Savings in electric from HVAC replacement at Gladden, Lake Vi<strong>st</strong>a, and Childs Park Centers. FY11 savings <<strong>st</strong>rong>of</<strong>st</strong>rong> $16,137 and FY12 savings <<strong>st</strong>rong>of</<strong>st</strong>rong><br />
$32,274.<br />
-Consolidation <<strong>st</strong>rong>of</<strong>st</strong>rong> Library IT functions ($40,000).<br />
-Reduction in part-time <strong>st</strong>aff hours at Walter Fuller pool ($10,335).<br />
-Reduce <strong>st</strong>affing by two vacant part-time seasonal cu<strong>st</strong>odian positions. Savings <<strong>st</strong>rong>of</<strong>st</strong>rong> $21,630 in both FY11 and FY12.<br />
- The Parks & Recreation Department's performance measures address the Mayor's goals <<strong>st</strong>rong>of</<strong>st</strong>rong> Seamlessness, Service, and Sports, Arts & Culture.<br />
Objective and Performance Measure<br />
Unit Of<br />
Measure<br />
FY 2009<br />
Actual<br />
FY 2010<br />
Actual<br />
FY 2011<br />
Target<br />
FY2011<br />
E<strong>st</strong>imate<br />
FY 2012<br />
Proposed<br />
Before and After School Playcamp Patron Satisfaction<br />
Survey<br />
The objective <<strong>st</strong>rong>of</<strong>st</strong>rong> the Before and After School Playcamp Program is to achieve at lea<strong>st</strong> an 85% average combined score <<strong>st</strong>rong>of</<strong>st</strong>rong> 'Good' (4) and 'Excellent'<br />
(5) ratings.<br />
Before and After School Playcamp Patron Satisfaction<br />
Survey<br />
% 91.92 95.07 85.00 85.00 85.00<br />
Boyd Hill Nature Preserve Attendance<br />
The objective <<strong>st</strong>rong>of</<strong>st</strong>rong> the Boyd Hill Nature Preserve Attendance measure is to quantify the number <<strong>st</strong>rong>of</<strong>st</strong>rong> patrons utilizing Boyd Hill Nature Preserve on an<br />
annual basis.<br />
Boyd Hill Nature Preserve - Attendance # 46,504 47,002 47,000 47,000 47,000<br />
237
Objective and Performance Measure<br />
City <<strong>st</strong>rong>of</<strong>st</strong>rong> St. Petersburg, Florida - FY 2012 Proposed Fiscal Plan<br />
Boyd Hill Nature Preserve Expenditure<br />
Unit Of<br />
Measure<br />
FY 2009<br />
Actual<br />
FY 2010<br />
Actual<br />
FY 2011<br />
Target<br />
FY2011<br />
E<strong>st</strong>imate<br />
The objective <<strong>st</strong>rong>of</<strong>st</strong>rong> the Boyd Hill Nature Preserve Expenditure measure is to quantify the expenditures associated with Boyd Hill Nature Preserve on<br />
an annual basis.<br />
FY 2012<br />
Proposed<br />
Boyd Hill Nature Preserve - Expenditure $ 1,172,170 1,159,523 1,000,000 1,000,000 1,000,000<br />
Boyd Hill Nature Preserve Revenue<br />
The objective <<strong>st</strong>rong>of</<strong>st</strong>rong> the Boyd Hill Nature Preserve Revenue measure is to quantify the revenue associated with Boyd Hill Nature Preserve on an annual<br />
basis.<br />
Boyd Hill Nature Preserve - Revenue $ 173,482 178,132 175,000 175,000 175,000<br />
Fee Class Programs Patron Satisfaction Survey<br />
The objective <<strong>st</strong>rong>of</<strong>st</strong>rong> Fee Class Programs is to achieve at lea<strong>st</strong> an 85% average combined score <<strong>st</strong>rong>of</<strong>st</strong>rong> 'Good' (4) and 'Excellent' (5) ratings.<br />
Fee Class Programs Patron Satisfaction Survey % 94.05 94.88 85.00 85.00 85.00<br />
Fore<strong>st</strong>ry Operations Emergency Service Reque<strong>st</strong> Response<br />
Time<br />
The objective <<strong>st</strong>rong>of</<strong>st</strong>rong> the Emergency Service Reque<strong>st</strong> Response Time measure is to quantify, in days, the response time by Fore<strong>st</strong>ry Operations for<br />
emergency service reque<strong>st</strong>s.<br />
Tree Removal/Trimming - Response Time in<br />
Days/Emergency<br />
# 0.61 0.64 1 1 1<br />
Fore<strong>st</strong>ry Operations Non-Emergency Service Reque<strong>st</strong><br />
Response Time<br />
The objective <<strong>st</strong>rong>of</<strong>st</strong>rong> the Non-Emergency Service Reque<strong>st</strong> Response Time measure is to quantify, in days, the response time by Fore<strong>st</strong>ry Operations for<br />
non-emergency service reque<strong>st</strong>ed.<br />
Tree Removal/Trimming - Response Time in Days/Non-<br />
Emergency<br />
# 5.04 8.42 12 12 12<br />
Fore<strong>st</strong>ry Operations Reque<strong>st</strong>s For Emergency Service<br />
The objective <<strong>st</strong>rong>of</<strong>st</strong>rong> the Reque<strong>st</strong>s for Emergency Service measure is to quantify the number <<strong>st</strong>rong>of</<strong>st</strong>rong> emergency service reque<strong>st</strong>s received by Fore<strong>st</strong>ry<br />
Operations.<br />
Tree Removal/Trimming - Reque<strong>st</strong> for Service/Emergency # 405 182 300 300 300<br />
Fore<strong>st</strong>ry Operations Reque<strong>st</strong>s For Non-Emergency Service<br />
The objective <<strong>st</strong>rong>of</<strong>st</strong>rong> the Reque<strong>st</strong>s for Non-Emergency Service measure is to quantify the number <<strong>st</strong>rong>of</<strong>st</strong>rong> non-emergency service reque<strong>st</strong>s received by<br />
Fore<strong>st</strong>ry Operations.<br />
Tree Removal/Trimming - Reque<strong>st</strong> for Service/Non-<br />
Emergency<br />
# 5,936 2,695 2,700 2,700 2,700<br />
Gift Tree Program - Contributions<br />
The objective <<strong>st</strong>rong>of</<strong>st</strong>rong> the Gift Tree Program - Contributions measure is to quantify the contributions received for the Gift Tree Program.<br />
238
Objective and Performance Measure<br />
City <<strong>st</strong>rong>of</<strong>st</strong>rong> St. Petersburg, Florida - FY 2012 Proposed Fiscal Plan<br />
Unit Of<br />
Measure<br />
FY 2009<br />
Actual<br />
FY 2010<br />
Actual<br />
FY 2011<br />
Target<br />
FY2011<br />
E<strong>st</strong>imate<br />
FY 2012<br />
Proposed<br />
Gift Tree Program Contributions $ 2,275 861 2,000 2,000 1,250<br />
Gift Tree Program - Trees<br />
The objective <<strong>st</strong>rong>of</<strong>st</strong>rong> the Gift Tree Program - Trees measure is to quantify the number <<strong>st</strong>rong>of</<strong>st</strong>rong> trees purchased through the Gift Tree Program.<br />
Gift Tree Program # 7 4 6 6 5<br />
Man Hours Assigned To Work Orders Completed By<br />
Con<strong>st</strong>ruction Division<br />
The objective <<strong>st</strong>rong>of</<strong>st</strong>rong> the Man Hours Assigned To Work Orders measure is to quantify the man hours utilized for the services performed by the<br />
Con<strong>st</strong>ruction Division.<br />
Con<strong>st</strong>ruction Division Total Work Order Staff Hours # 1,163.5 2,907 1,560 5,100 5,100<br />
Man Hours Assigned To Work Orders Completed By Facility<br />
Sy<strong>st</strong>ems<br />
The objective <<strong>st</strong>rong>of</<strong>st</strong>rong> the Man Hours Assigned To Work Orders measure is to quantify the man hours utilized for the services performed by the<br />
Con<strong>st</strong>ruction Division.<br />
Facility Sy<strong>st</strong>ems Total Work Order Staff Hours # 12,816 16,384 16,074 16,200 16,200<br />
Nature Preserves and Wilderness Area Maintenance Co<strong>st</strong> Per<br />
Acres<br />
The objective <<strong>st</strong>rong>of</<strong>st</strong>rong> the Nature Preserves and Wilderness Areas Maintenance Co<strong>st</strong> Per Acre measure is to quantify yearly co<strong>st</strong> per acre for maintenance<br />
operations in nature preserves and wilderness areas.<br />
Co<strong>st</strong> per Acre for Nature Preserves and Wilderness Areas $ 375 395 400 400 400<br />
Parkland Maintenance Co<strong>st</strong> Per Acre<br />
The objective <<strong>st</strong>rong>of</<strong>st</strong>rong> the Parkland Maintenance Co<strong>st</strong> Per Acre measure is to quantify yearly co<strong>st</strong> per acre <<strong>st</strong>rong>of</<strong>st</strong>rong> all parks maintenance di<strong>st</strong>ricts and other<br />
parkland.<br />
Co<strong>st</strong> per Acre for Parkland $ 5,696 5,586 5,600 5,600 5,600<br />
Parkland Mowing Man Hours<br />
The objective <<strong>st</strong>rong>of</<strong>st</strong>rong> the Parkland Mowing Man Hours measure is to quantify the man hours utilized for large mowing operations.<br />
Parkland Mowing Man Hours # 3,015 3,315 3,200 3,200 3,200<br />
Paving The Future Brick Program<br />
The objective <<strong>st</strong>rong>of</<strong>st</strong>rong> the Paving The Future Brick Program measure is to quantify the number <<strong>st</strong>rong>of</<strong>st</strong>rong> bricks purchased through the Paving The Future Brick<br />
Program.<br />
Paving the Future Brick Program # 11 23 12 12 10<br />
239
Objective and Performance Measure<br />
City <<strong>st</strong>rong>of</<strong>st</strong>rong> St. Petersburg, Florida - FY 2012 Proposed Fiscal Plan<br />
Summer Playcamp Patron Satisfaction Survey Results<br />
Unit Of<br />
Measure<br />
FY 2009<br />
Actual<br />
FY 2010<br />
Actual<br />
FY 2011<br />
Target<br />
FY2011<br />
E<strong>st</strong>imate<br />
The objective <<strong>st</strong>rong>of</<strong>st</strong>rong> the Summer Playcamp Program is to achieve at lea<strong>st</strong> an 85% average combined score <<strong>st</strong>rong>of</<strong>st</strong>rong> 'Good' (4) and 'Excellent' (5) ratings.<br />
FY 2012<br />
Proposed<br />
Summer Playcamp Patron Satisfaction Survey % 92.19 91.41 85.00 85.00 85.00<br />
Swim Lesson Patron Satisfaction Survey Results<br />
The objective <<strong>st</strong>rong>of</<strong>st</strong>rong> the Swim Lesson Program is to achieve at lea<strong>st</strong> an 85% average combined score <<strong>st</strong>rong>of</<strong>st</strong>rong> 'Good' (4) and 'Excellent' (5) ratings.<br />
Swim Lesson Patron Satisfaction Survey % 88.81 92.41 85.00 85.00 85.00<br />
Teen Programs Patron Satisfaction Survey Results<br />
The objective <<strong>st</strong>rong>of</<strong>st</strong>rong> Teen Programs is to achieve at lea<strong>st</strong> an 85% average combined score <<strong>st</strong>rong>of</<strong>st</strong>rong> 'Good' (4) and 'Excellent' (5) ratings.<br />
Teen Programs Patron Satisfaction Survey % 85.34 88.64 85.00 87.43 85.00<br />
Therapeutic Recreation Patron Satisfaction Survey Results<br />
The objective <<strong>st</strong>rong>of</<strong>st</strong>rong> the Therapeutic Recreation Program is to achieve at lea<strong>st</strong> an 85% average combined score <<strong>st</strong>rong>of</<strong>st</strong>rong> 'Good' (4) and 'Excellent' (5) ratings.<br />
Therapeutic Recreation Patron Satisfaction Survey % 93.38 93.41 85.00 90.47 85.00<br />
Work Orders Completed By Con<strong>st</strong>ruction Division<br />
The objective <<strong>st</strong>rong>of</<strong>st</strong>rong> the Work Orders Completed measure is to quantify services provided by the Con<strong>st</strong>ruction Division.<br />
Con<strong>st</strong>ruction Division Number <<strong>st</strong>rong>of</<strong>st</strong>rong> Work Orders # 157 203 160 260 260<br />
Work Orders Completed By Facility Sy<strong>st</strong>ems Division<br />
The objective <<strong>st</strong>rong>of</<strong>st</strong>rong> the Work Orders Completed measure is to quantify services provided by the Facility Sy<strong>st</strong>ems Division.<br />
Facility Sy<strong>st</strong>ems Number <<strong>st</strong>rong>of</<strong>st</strong>rong> Work Orders # 1,734 1,882 1,969 1,850 1,850<br />
240
City <<strong>st</strong>rong>of</<strong>st</strong>rong> St. Petersburg, Florida - FY 2012 Proposed Fiscal Plan<br />
Public Safety<br />
Public Safety<br />
Total Full Time Equivalents (FTE) = 1,085.00<br />
Fire Department<br />
Total Full Time Equivalents (FTE) = 328.50<br />
Police Department<br />
Total Full Time Equivalents (FTE) = 756.50<br />
241
City <<strong>st</strong>rong>of</<strong>st</strong>rong> St. Petersburg, Florida - FY 2012 Proposed Fiscal Plan<br />
Public Safety<br />
Budgetary Co<strong>st</strong> Summary<br />
FY 2009<br />
Actual<br />
FY 2010<br />
Actual<br />
FY 2011<br />
Adopted<br />
FY 2011<br />
Amended<br />
FY 2011<br />
E<strong>st</strong>imated<br />
FY 2012<br />
Proposed<br />
FY 2012<br />
Change<br />
Wages And Benefits 113,640,256 114,203,685 113,814,478 114,391,007 112,675,722 112,070,454 (1.53%)<br />
Services And Commodities 15,865,488 15,868,187 14,861,979 15,640,106 16,531,767 17,729,379 19.29%<br />
Capital 1,099,328 2,039,684 85,810 1,148,291 1,098,888 45,044 (47.51%)<br />
Grants And Aid 635,132 482,634 125,000 577,169 286,226 125,000 0.00%<br />
Transfers Out 42,809 0 0 0 0 0 0.00%<br />
Total Budget 131,283,013 132,594,189 128,887,267 131,756,573 130,592,603 129,969,877 0.84%<br />
Appropriations By<br />
Fund/Department<br />
FY 2009<br />
Actual<br />
FY 2010<br />
Actual<br />
FY 2011<br />
Adopted<br />
FY 2011<br />
Amended<br />
FY 2011<br />
E<strong>st</strong>imated<br />
FY 2012<br />
Proposed<br />
FY 2012<br />
Change<br />
General Operating Fund<br />
Fire Department 32,673,298 33,788,063 31,253,461 32,229,743 32,778,574 30,687,107 (1.81%)<br />
Police Department 85,514,688 85,099,282 84,442,492 85,033,544 84,280,165 86,197,409 2.08%<br />
Total General Operating Fund 118,187,986 118,887,346 115,695,953 117,263,287 117,058,739 116,884,516 1.03%<br />
Non-General Funds<br />
Emergency Medical Services 12,673,779 12,523,371 12,591,802 12,956,491 12,307,245 12,342,694 (1.98%)<br />
Health Insurance 0 9 0 0 0 0 0.00%<br />
Law Enforcement Tru<strong>st</strong> 421,247 497,407 192,994 616,155 517,341 186,335 (3.45%)<br />
Police Grant Tru<strong>st</strong> Funds 0 686,056 406,518 920,640 709,278 548,042 34.81%<br />
Technology & Infra<strong>st</strong>ructure<br />
Fund<br />
0 0 0 0 0 8,290 0.00%<br />
Total Non-General Funds 13,095,027 13,706,843 13,191,314 14,493,286 13,533,864 13,085,361 (0.80%)<br />
Total Budget 131,283,013 132,594,189 128,887,267 131,756,573 130,592,603 129,969,877 0.84%<br />
Revenue Sources<br />
FY 2009<br />
Actual<br />
FY 2010<br />
Actual<br />
FY 2011<br />
Adopted<br />
FY 2011<br />
Amended<br />
FY 2011<br />
E<strong>st</strong>imated<br />
FY 2012<br />
Proposed<br />
FY 2012<br />
Change<br />
Other License And Permits 249,850 294,508 313,800 313,800 220,028 604,360 92.59%<br />
Federal Grants 548,151 2,259,672 711,378 2,053,834 4,059,865 685,000 (3.71%)<br />
State Grants 14,091 1,385 0 366,145 276,000 0 0.00%<br />
State Shared Revenue 80,879 76,863 72,808 72,808 36,300 87,460 20.12%<br />
Grants From Other Local Units 322,313 298,004 0 351,880 0 0 0.00%<br />
General Government 50,300 102,346 162,800 162,800 29,900 183,200 12.53%<br />
Public Safety 17,066,802 14,034,937 14,356,039 14,356,039 13,577,544 14,688,518 2.32%<br />
Other Charges For Services 308,282 275,893 110,000 110,000 110,005 110,000 0.00%<br />
Traffic And Parking 1,111,807 1,521,443 1,007,576 1,169,576 1,040,963 2,862,015 184.05%<br />
Intere<strong>st</strong> Earnings 5,230 1,180 3,000 3,000 324 0 (100.00%)<br />
Sale Of Fixed Assets 88,943 169,116 145,453 145,453 135,575 145,453 0.00%<br />
Contributions And Donations 747 100 0 0 100 0 0.00%<br />
Misc Revenue 1,669 47,057 105,822 105,822 60,875 113,422 7.18%<br />
Other Charges 0 10 0 0 0 0 0.00%<br />
Transfer From Law Enforcement<br />
42,809 0 0 0 0 0 0.00%<br />
Tru<strong>st</strong><br />
General Fund 111,995,432 113,398,012 110,684,636 110,863,571 111,762,201 109,819,236 (0.78%)<br />
Emergency Medical Services (602,115) 577,165 614,443 659,172 (285,643) (71,454) (111.63%)<br />
Law Enforcement Tru<strong>st</strong> (19,361) (468,707) 192,994 616,155 299,386 186,335 (3.45%)<br />
Police Grant Tru<strong>st</strong> Funds 0 5,320 406,518 406,518 (730,820) 548,042 34.81%<br />
242
Revenue Sources<br />
City <<strong>st</strong>rong>of</<strong>st</strong>rong> St. Petersburg, Florida - FY 2012 Proposed Fiscal Plan<br />
FY 2009<br />
Actual<br />
FY 2010<br />
Actual<br />
FY 2011<br />
Adopted<br />
FY 2011<br />
Amended<br />
FY 2011<br />
E<strong>st</strong>imated<br />
FY 2012<br />
Proposed<br />
FY 2012<br />
Change<br />
Local Option Tax Revenue 0 (124) 0 0 0 0 0.00%<br />
Billing & Collections 17,184 0 0 0 0 0 0.00%<br />
Health Insurance 0 9 0 0 0 0 0.00%<br />
Technology & Infra<strong>st</strong>ructure<br />
0 0 0 0 0 8,290 0.00%<br />
Fund<br />
Total Revenue 131,283,013 132,594,189 128,887,267 131,756,573 130,592,603 129,969,877 0.84%<br />
Position Summary By Department<br />
FY 2009<br />
Actual<br />
FY 2010<br />
Actual<br />
FY 2011<br />
Adopted<br />
FY 2012<br />
Proposed<br />
FY 2012<br />
Change<br />
Fire Department 351.00 334.00 328.00 328.00 0.00%<br />
Police Department 753.00 761.00 752.00 748.00 (0.53%)<br />
Total Full-Time FTE 1,104.00 1,095.00 1,080.00 1,076.00 (0.37%)<br />
Fire Department 0.50 0.50 0.50 0.50 0.00%<br />
Police Department 9.00 8.00 8.00 8.50 6.25%<br />
Total Part-Time FTE 9.50 8.50 8.50 9.00 5.88%<br />
Total FTE 1,113.50 1,103.50 1,088.50 1,085.00 (0.32%)<br />
243
Department Mission Statement<br />
City <<strong>st</strong>rong>of</<strong>st</strong>rong> St. Petersburg, Florida - FY 2012 Proposed Fiscal Plan<br />
Fire Department<br />
St. Petersburg Fire and Rescue is committed to serving the community and each other by protecting and improving health, safety, and quality <<strong>st</strong>rong>of</<strong>st</strong>rong> life through<br />
exceptional emergency service and education.<br />
Services Provided<br />
St. Petersburg Fire & Rescue provides the following services:<br />
• Admini<strong>st</strong>ration provides support to all divisions through the Fire Chief's executive leadership and personnel management including the department's medical<br />
evaluation program.<br />
• Fiscal services, including grants management, provides required documentation for the department's City Council consent agenda items, coordination <<strong>st</strong>rong>of</<strong>st</strong>rong> the<br />
department's <strong>capital</strong> improvement program, <strong>budget</strong>ing, payroll, purchasing, accounts receivable and payable, and fixed assets management.<br />
• Computer services provides admini<strong>st</strong>ration and computer/communications support services for all divisions <<strong>st</strong>rong>of</<strong>st</strong>rong> the department.<br />
• Fire prevention supports education, economic development, public safety, and neighborhoods through public education, arson inve<strong>st</strong>igation, cyclic inspection,<br />
and con<strong>st</strong>ruction plans review.<br />
• Fire operations saves lives and protects property from the ravages <<strong>st</strong>rong>of</<strong>st</strong>rong> fire with the fir<strong>st</strong> line <<strong>st</strong>rong>of</<strong>st</strong>rong> defense being public education and prevention. In the event a<br />
fire does <strong>st</strong>art, the department's mission is to save lives and to extinguish the fire in the mo<strong>st</strong> expeditious manner available with a minimum <<strong>st</strong>rong>of</<strong>st</strong>rong> property damage.<br />
Fire operation facilitates new con<strong>st</strong>ruction and manages the maintenance <<strong>st</strong>rong>of</<strong>st</strong>rong> all department facilities.<br />
• Safety and training develops and manages the safety and training programs for the department. Promotes, enhances, and protects the safety and welfare <<strong>st</strong>rong>of</<strong>st</strong>rong><br />
department personnel. Benchmarks <<strong>st</strong>rong>of</<strong>st</strong>rong> this mission are no firefighter fatalities, decreased injuries, increased effectiveness at emergency operations, decreased fire<br />
loss, and decreased damage to tools and equipment.<br />
• Emergency Medical Services is responsible for the delivery <<strong>st</strong>rong>of</<strong>st</strong>rong> advanced life support services throughout the City <<strong>st</strong>rong>of</<strong>st</strong>rong> St. Petersburg. These services include the<br />
placement <<strong>st</strong>rong>of</<strong>st</strong>rong> advanced airways, monitoring and interpreting cardiac rhythms, cardiac defibrillation, and admini<strong>st</strong>ering intravenous medications. This division also<br />
provides cardiopulmonary resuscitation and fir<strong>st</strong> aid training.<br />
Budgetary Co<strong>st</strong> Summary<br />
FY 2009<br />
Actual<br />
FY 2010<br />
Actual<br />
FY 2011<br />
Adopted<br />
FY 2011<br />
Amended<br />
FY 2011<br />
E<strong>st</strong>imated<br />
FY 2012<br />
Proposed<br />
FY 2012<br />
Change<br />
Wages And Benefits 40,442,121 40,135,959 39,768,210 39,844,725 39,601,608 38,383,098 (3.48%)<br />
Services And Commodities 4,201,341 4,379,516 4,033,563 4,298,180 4,463,211 4,640,703 15.05%<br />
Capital 559,584 1,784,710 43,490 1,043,330 1,021,000 14,290 (67.14%)<br />
Grants And Aid 144,032 11,250 0 0 0 0 0.00%<br />
Total Budget 45,347,077 46,311,435 43,845,263 45,186,234 45,085,819 43,038,091 (1.84%)<br />
Appropriations By Fund/Program<br />
FY 2009<br />
Actual<br />
FY 2010<br />
Actual<br />
FY 2011<br />
Adopted<br />
FY 2011<br />
Amended<br />
FY 2011<br />
E<strong>st</strong>imated<br />
FY 2012<br />
Proposed<br />
FY 2012<br />
Change<br />
General Operating Fund<br />
Fire Admin, Fiscal & Emergency Mgt<br />
1,150,831 1,479,618 1,434,477 1,437,108 766,769 1,200,644 (16.30%)<br />
Program<br />
Fire Computer Services Program 350,215 408,021 363,251 370,600 263,378 376,906 3.76%<br />
Fire Operations Program 28,778,116 29,203,040 26,841,788 27,805,824 29,732,832 26,590,284 (0.94%)<br />
Fire Prevention Program 1,786,153 2,018,857 1,905,350 1,906,676 1,436,253 1,819,898 (4.48%)<br />
Fire Training Program 607,983 678,359 708,595 709,536 579,342 699,375 (1.30%)<br />
Non-Department Program 0 168 0 0 0 0 0.00%<br />
Totals for General Operating Fund 32,673,298 33,788,063 31,253,461 32,229,743 32,778,574 30,687,107 (1.81%)<br />
Emergency Medical Services<br />
Emergency Medical Services Program<br />
Non-Department Program<br />
12,673,779<br />
0<br />
12,523,371<br />
0<br />
12,591,802<br />
0<br />
12,956,491<br />
0<br />
12,306,741<br />
504<br />
12,342,694<br />
0<br />
(1.98%)<br />
0.00%<br />
Totals for Emergency Medical Services 12,673,779 12,523,371 12,591,802 12,956,491 12,307,245 12,342,694 (1.98%)<br />
Technology & Infra<strong>st</strong>ructure Fund<br />
Non-Department Program 0 0 0 0 0 8,290 0.00%<br />
244
Appropriations By Fund/Program<br />
City <<strong>st</strong>rong>of</<strong>st</strong>rong> St. Petersburg, Florida - FY 2012 Proposed Fiscal Plan<br />
FY 2009<br />
Actual<br />
FY 2010<br />
Actual<br />
FY 2011<br />
Adopted<br />
FY 2011<br />
Amended<br />
FY 2011<br />
E<strong>st</strong>imated<br />
FY 2012<br />
Proposed<br />
FY 2012<br />
Change<br />
Total Budget 45,347,077 46,311,435 43,845,263 45,186,234 45,085,819 43,038,091 (1.84%)<br />
Revenue Sources<br />
FY 2009<br />
Actual<br />
FY 2010<br />
Actual<br />
FY 2011<br />
Adopted<br />
FY 2011<br />
Amended<br />
FY 2011<br />
E<strong>st</strong>imated<br />
FY 2012<br />
Proposed<br />
FY 2012<br />
Change<br />
Other License And Permits 9,500 9,150 11,690 11,690 4,400 10,290 (11.98%)<br />
Federal Grants 247,361 716,957 0 1,104,923 623,000 0 0.00%<br />
State Grants 343 0 0 0 0 0 0.00%<br />
State Shared Revenue 80,879 76,863 72,808 72,808 36,300 87,460 20.12%<br />
General Government 49,085 101,740 106,700 106,700 29,900 127,100 19.12%<br />
Public Safety 14,993,585 12,388,610 12,406,939 12,406,939 12,313,823 12,851,018 3.58%<br />
Other Charges For Services 3,128 250 0 0 5 0 0.00%<br />
Intere<strong>st</strong> Earnings 649 0 3,000 3,000 0 0 (100.00%)<br />
Sale Of Fixed Assets (3,390) 8,112 0 0 10,465 0 0.00%<br />
Contributions And Donations 747 100 0 0 100 0 0.00%<br />
Misc Revenue 10,561 (2,081) 0 0 (18,787) 7,600 0.00%<br />
General Fund 30,556,264 32,433,155 30,629,683 30,821,002 32,372,256 30,017,787 (2.00%)<br />
Emergency Medical Services (602,115) 578,580 614,443 659,172 (285,643) (71,454) (111.63%)<br />
Billing & Collections 480 0 0 0 0 0 0.00%<br />
Technology & Infra<strong>st</strong>ructure<br />
Fund<br />
0 0 0 0 0 8,290 0.00%<br />
Total Revenue 45,347,077 46,311,435 43,845,263 45,186,234 45,085,819 43,038,091 (1.84%)<br />
Position Summary<br />
FY 2009<br />
Actual<br />
FY 2010<br />
Actual<br />
FY 2011<br />
Adopted<br />
FY 2012<br />
Proposed<br />
FY 2012<br />
Change<br />
Fire Admin, Fiscal & Emergency Mgt Program 6.00 6.00 6.00 6.00 0.00%<br />
Fire Computer Services Program 2.00 2.00 2.00 2.00 0.00%<br />
Fire Training Program 4.00 4.00 4.00 4.00 0.00%<br />
Fire Prevention Program 16.00 17.00 16.00 16.00 0.00%<br />
Fire Operations Program 231.00 220.00 215.00 215.00 0.00%<br />
Emergency Medical Services Program 92.00 85.00 85.00 85.00 0.00%<br />
Total Full-Time FTE 351.00 334.00 328.00 328.00 0.00%<br />
Fire Admin, Fiscal & Emergency Mgt Program 0.50 0.50 0.50 0.50 0.00%<br />
Total Part-Time FTE 0.50 0.50 0.50 0.50 0.00%<br />
Total FTE 351.50 334.50 328.50 328.50 0.00%<br />
- In FY12, the Fire Department's General Fund <strong>budget</strong> will decrease 1.81%. Various line items were reduced in personal services including<br />
project burden salaries and benefits, and services and commodities including overtime.<br />
- For FY12 the following fee increases in the Fire Department were approved: License & Permit - Other ($2,000), Site Plan Review ($20,400),<br />
Fire Codes Inspections ($15,000) and Training ($10).<br />
- Enhancements include: Consulting $2,000, Medical Services $17,680, Other Special Services -External $15,320, Printing & Binding $1,900,<br />
Internet Services - $6,550, Electric $20,000, R/M Materials - Equipment - External $6,246, Uniforms and Protective Clothing - $14,000 and<br />
Reference Materials ($500).<br />
- In FY12 the EMS Department's <strong>budget</strong> decreased 1.98% due primarily to pension co<strong>st</strong> decreases.<br />
The Fire Department's performance measures address the Mayor's goal <<strong>st</strong>rong>of</<strong>st</strong>rong> Safety. The fourth performance measure addresses the Mayor's goal<br />
245
City <<strong>st</strong>rong>of</<strong>st</strong>rong> St. Petersburg, Florida - FY 2012 Proposed Fiscal Plan<br />
<<strong>st</strong>rong>of</<strong>st</strong>rong> Small Business and the ninth performance measure addresses the Mayor's goal <<strong>st</strong>rong>of</<strong>st</strong>rong> Schools.<br />
Objective and Performance Measure<br />
Unit Of<br />
Measure<br />
FY 2009<br />
Actual<br />
FY 2010<br />
Actual<br />
FY 2011<br />
Target<br />
FY2011<br />
E<strong>st</strong>imate<br />
FY 2012<br />
Proposed<br />
Arson Cases Closed<br />
An objective <<strong>st</strong>rong>of</<strong>st</strong>rong> Fire Prevention is to provide quality and timely fire inve<strong>st</strong>igation services and <strong>st</strong>rive for and improve the arson closure rate.<br />
Arson Cases Closed # 36 27 25 35 35<br />
Commercial Life Safety Inspection<br />
An objective <<strong>st</strong>rong>of</<strong>st</strong>rong> Fire Prevention is to provide a quality, courteous, and timely life safety inspection <<strong>st</strong>rong>of</<strong>st</strong>rong> all businesses in the City once every two<br />
years.<br />
Fire/Life Safety Commercial Buildings Inspected # 8,550 6,000 5,000 4,776 4,800<br />
Emergency Care and Education<br />
An objective <<strong>st</strong>rong>of</<strong>st</strong>rong> Emergency Medical Services is to provide the highe<strong>st</strong> quality comprehensive pre-hospital advanced life support and rescue service<br />
to all persons in our community; and to provide health, safety, and wellness education to the public.<br />
Advanced Life Support Patients # 13,036 13,500 13,040 13,500 13,600<br />
Average Response Time # 4.33 5.19 5 5.15 5<br />
CPR and Fir<strong>st</strong> Aid Class Participants # 3,000 2,089 3,000 3,000 2,100<br />
CPR and Fir<strong>st</strong> Aid Classes # 260 181 170 260 180<br />
Medical Emergency Calls # 39,868 40,155 40,000 40,000 41,000<br />
Patients Treated # 32,092 32,124 32,500 32,500 32,750<br />
Emergency Management Public Education<br />
An objective <<strong>st</strong>rong>of</<strong>st</strong>rong> Emergency Management is to conduct monthly education programs to small businesses ho<strong>st</strong>ed by the St. Petersburg Business<br />
Assi<strong>st</strong>ance Center; conduct neighborhood and business-sponsored education whenever possible and specifically immediately preceding the <strong>st</strong>art <<strong>st</strong>rong>of</<strong>st</strong>rong><br />
hurricane season.<br />
Hurricane Awareness Public Education Seminars<br />
Conducted<br />
# 30 26 40 30 30<br />
Emergency Response<br />
The objective <<strong>st</strong>rong>of</<strong>st</strong>rong> Fire Operations is to provide an efficient, effective, and timely response to reque<strong>st</strong>s for emergency services.<br />
Average Response Time # 4.30 4.88 4.30 4.8 4.8<br />
Cause Indeterminate After Inve<strong>st</strong>igation # 80 130 132 130 130<br />
Emergency Response # 47,000 46,515 47,000 47,000 47,000<br />
Fire Loss - Dollar Value $ 6,000,000 6,627,849 6,000,000 6,000,000 6,000,000<br />
Injury Decrease<br />
An objective <<strong>st</strong>rong>of</<strong>st</strong>rong> the Safety and Training Division is to measure and identify numbers and types <<strong>st</strong>rong>of</<strong>st</strong>rong> injuries to assi<strong>st</strong> in the department's health and<br />
safety program. The Safety and Training Division seeks to decrease injuries by ten percent per year.<br />
Injury Decrease (Incidents) # 32 49 32 30 25<br />
Injury Decrease (Percentage) % 21 49 10 30 25<br />
246
Objective and Performance Measure<br />
City <<strong>st</strong>rong>of</<strong>st</strong>rong> St. Petersburg, Florida - FY 2012 Proposed Fiscal Plan<br />
Unit Of<br />
Measure<br />
FY 2009<br />
Actual<br />
FY 2010<br />
Actual<br />
FY 2011<br />
Target<br />
FY2011<br />
E<strong>st</strong>imate<br />
FY 2012<br />
Proposed<br />
Life Safety Educational Contacts<br />
Provide quality, courteous, informative, and educational public education programs to all age groups and to targeted groups (children, elderly, etc.).<br />
Life Safety Educational Contacts # 60,000 67,570 60,000 67,000 67,000<br />
Plans Review<br />
An objective <<strong>st</strong>rong>of</<strong>st</strong>rong> Fire Prevention is to provide timely plans review services to <strong>st</strong>ay apace <<strong>st</strong>rong>of</<strong>st</strong>rong> the demands <<strong>st</strong>rong>of</<strong>st</strong>rong> local developers and contactors.<br />
Building Plans Reviewed for Code Compliance # 1,600 2,979 2,800 2,541 2,760<br />
Public Education<br />
An objective <<strong>st</strong>rong>of</<strong>st</strong>rong> Fire Prevention is to provide quality, courteous, informative, and educational public education programs to all age groups and to<br />
targeted groups, i.e. children and seniors.<br />
Fire/Life Safety Public Education Programs Presented # 320 364 350 320 320<br />
Training Hours Increase<br />
An objective <<strong>st</strong>rong>of</<strong>st</strong>rong> the Safety and Training Division is to provide 240 hours <<strong>st</strong>rong>of</<strong>st</strong>rong> fire and emergency medical services training per employee per year, or<br />
74,400 hours in total per year. Database entry difficulties prevented capturing accurate training hours input by company <<strong>st</strong>rong>of</<strong>st</strong>rong>ficers and resulted in the<br />
appearance <<strong>st</strong>rong>of</<strong>st</strong>rong> a reduction in training hours.<br />
Training Hours Increase # 65,000 74,000 74,400 74,400 74,400<br />
247
Department Mission Statement<br />
City <<strong>st</strong>rong>of</<strong>st</strong>rong> St. Petersburg, Florida - FY 2012 Proposed Fiscal Plan<br />
Police Department<br />
The mission <<strong>st</strong>rong>of</<strong>st</strong>rong> the Police Department is to provide pr<<strong>st</strong>rong>of</<strong>st</strong>rong>essional police service to the community by adhering to the values <<strong>st</strong>rong>of</<strong>st</strong>rong> respect, accountability, and integrity.<br />
Services Provided<br />
The Police Department provides the following services:<br />
• The department utilizes the Community Policing philosophy to achieve the highe<strong>st</strong> level <<strong>st</strong>rong>of</<strong>st</strong>rong> quality service and citizen satisfaction and works to provide a safe<br />
and secure environment for the citizens <<strong>st</strong>rong>of</<strong>st</strong>rong> and visitors to the City <<strong>st</strong>rong>of</<strong>st</strong>rong> St. Petersburg.<br />
• Employees work to prevent, detect, and inve<strong>st</strong>igate crime and provide the safe movement <<strong>st</strong>rong>of</<strong>st</strong>rong> traffic.<br />
Budgetary Co<strong>st</strong> Summary<br />
FY 2009<br />
Actual<br />
FY 2010<br />
Actual<br />
FY 2011<br />
Adopted<br />
FY 2011<br />
Amended<br />
FY 2011<br />
E<strong>st</strong>imated<br />
FY 2012<br />
Proposed<br />
FY 2012<br />
Change<br />
Wages And Benefits 73,198,134 74,067,726 74,046,268 74,546,282 73,074,114 73,687,356 (0.48%)<br />
Services And Commodities 11,664,147 11,488,671 10,828,416 11,341,926 12,068,556 13,088,676 20.87%<br />
Capital 539,744 254,974 42,320 104,961 77,888 30,754 (27.33%)<br />
Grants And Aid 491,101 471,384 125,000 577,169 286,226 125,000 0.00%<br />
Transfers Out 42,809 0 0 0 0 0 0.00%<br />
Total Budget 85,935,935 86,282,754 85,042,004 86,570,339 85,506,784 86,931,786 2.22%<br />
Appropriations By Fund/Program<br />
FY 2009<br />
Actual<br />
FY 2010<br />
Actual<br />
FY 2011<br />
Adopted<br />
FY 2011<br />
Amended<br />
FY 2011<br />
E<strong>st</strong>imated<br />
FY 2012<br />
Proposed<br />
FY 2012<br />
Change<br />
General Operating Fund<br />
Communications, Records & Info Program 11,187,156 10,467,835 10,574,246 10,582,973 8,885,634 10,386,960 (1.77%)<br />
Community & Youth Resources Program 5,169,210 4,875,646 5,117,964 5,119,217 4,896,044 4,976,839 (2.76%)<br />
Inve<strong>st</strong>igative Services Program 16,674,092 17,750,490 17,056,754 17,070,156 16,071,378 16,597,119 (2.69%)<br />
Non-Department Program 0 1,151 0 0 1,471 0 0.00%<br />
Non-Departmental/Arts/Social Services 0 0 125,000 517,655 103,502 125,000 0.00%<br />
Police Admini<strong>st</strong>ration Program 6,354,280 6,692,928 5,793,699 5,872,497 4,567,451 5,669,325 (2.15%)<br />
Uniform Services Program 46,129,950 45,311,232 45,774,829 45,871,047 49,754,685 48,442,166 5.83%<br />
Totals for General Operating Fund 85,514,688 85,099,282 84,442,492 85,033,544 84,280,165 86,197,409 2.08%<br />
Law Enforcement Tru<strong>st</strong><br />
Law Enforcement Tru<strong>st</strong> Fund Program<br />
Non-Department Program<br />
421,247<br />
0<br />
492,557<br />
4,850<br />
192,994<br />
0<br />
616,155<br />
0<br />
517,341<br />
0<br />
186,335<br />
0<br />
(3.45%)<br />
0.00%<br />
Totals for Law Enforcement Tru<strong>st</strong> 421,247 497,407 192,994 616,155 517,341 186,335 (3.45%)<br />
Police Grant Tru<strong>st</strong> Funds<br />
Communications, Records & Info Program 0 159,062 192,223 192,223 201,923 204,865 6.58%<br />
Inve<strong>st</strong>igative Services Program 0 103,924 58,845 58,845 99,848 117,227 99.21%<br />
Non-Department Program 0 166,199 0 0 73,047 0 0.00%<br />
Police Admini<strong>st</strong>ration Program 0 44,522 0 301,986 87,039 0 0.00%<br />
Uniform Services Program 0 212,349 155,450 367,586 247,421 225,950 45.35%<br />
Totals for Police Grant Tru<strong>st</strong> Funds 0 686,056 406,518 920,640 709,278 548,042 34.81%<br />
Health Insurance<br />
Non-Department Program 0 9 0 0 0 0 0.00%<br />
Total Budget 85,935,935 86,282,754 85,042,004 86,570,339 85,506,784 86,931,786 2.22%<br />
Revenue Sources<br />
FY 2009<br />
Actual<br />
FY 2010<br />
Actual<br />
FY 2011<br />
Adopted<br />
FY 2011<br />
Amended<br />
FY 2011<br />
E<strong>st</strong>imated<br />
FY 2012<br />
Proposed<br />
FY 2012<br />
Change<br />
248
City <<strong>st</strong>rong>of</<strong>st</strong>rong> St. Petersburg, Florida - FY 2012 Proposed Fiscal Plan<br />
Other License And Permits 240,350 285,358 302,110 302,110 215,628 594,070 96.64%<br />
Federal Grants 300,791 1,542,715 711,378 948,911 3,436,865 685,000 (3.71%)<br />
State Grants 13,748 1,385 0 366,145 276,000 0 0.00%<br />
Grants From Other Local Units 322,313 298,004 0 351,880 0 0 0.00%<br />
General Government 1,215 606 56,100 56,100 0 56,100 0.00%<br />
Public Safety 2,073,216 1,646,328 1,949,100 1,949,100 1,263,721 1,837,500 (5.73%)<br />
Other Charges For Services 305,154 275,643 110,000 110,000 110,000 110,000 0.00%<br />
Traffic And Parking 1,111,807 1,521,443 1,007,576 1,169,576 1,040,963 2,862,015 184.05%<br />
Intere<strong>st</strong> Earnings 4,581 1,180 0 0 324 0 0.00%<br />
Sale Of Fixed Assets 92,333 161,004 145,453 145,453 125,110 145,453 0.00%<br />
Misc Revenue (8,892) 49,139 105,822 105,822 79,662 105,822 0.00%<br />
Other Charges 0 10 0 0 0 0 0.00%<br />
Transfer From Law Enforcement<br />
Tru<strong>st</strong><br />
42,809 0 0 0 0 0 0.00%<br />
General Fund 81,439,168 80,964,858 80,054,953 80,042,570 79,389,945 79,801,449 (0.32%)<br />
Law Enforcement Tru<strong>st</strong> (19,361) (468,707) 192,994 616,155 299,386 186,335 (3.45%)<br />
Police Grant Tru<strong>st</strong> Funds 0 5,320 406,518 406,518 (730,820) 548,042 34.81%<br />
Emergency Medical Services 0 (1,415) 0 0 0 0 0.00%<br />
Local Option Tax Revenue 0 (124) 0 0 0 0 0.00%<br />
Billing & Collections 16,704 0 0 0 0 0 0.00%<br />
Health Insurance 0 9 0 0 0 0 0.00%<br />
Total Revenue 85,935,935 86,282,754 85,042,004 86,570,339 85,506,784 86,931,786 2.22%<br />
Position Summary<br />
FY 2009<br />
Actual<br />
FY 2010<br />
Actual<br />
FY 2011<br />
Adopted<br />
FY 2012<br />
Proposed<br />
FY 2012<br />
Change<br />
Community & Youth Resources Program 41.00 47.00 45.00 44.00 (2.22%)<br />
Inve<strong>st</strong>igative Services Program 127.00 147.00 145.00 144.00 (0.69%)<br />
Uniform Services Program 412.00 397.00 397.00 396.00 (0.25%)<br />
Police Admini<strong>st</strong>ration Program 50.00 43.00 42.00 42.00 0.00%<br />
Communications, Records & Info Program 123.00 127.00 123.00 122.00 (0.81%)<br />
Total Full-Time FTE 753.00 761.00 752.00 748.00 (0.53%)<br />
Community & Youth Resources Program 1.00 0.50 0.50 0.50 0.00%<br />
Inve<strong>st</strong>igative Services Program 1.00 0.50 0.50 0.50 0.00%<br />
Uniform Services Program 1.00 2.00 2.00 2.90 45.00%<br />
Police Admini<strong>st</strong>ration Program 0.00 1.50 1.50 1.60 6.67%<br />
Communications, Records & Info Program 6.00 3.50 3.50 3.00 (14.29%)<br />
Total Part-Time FTE 9.00 8.00 8.00 8.50 6.25%<br />
Total FTE 762.00 769.00 760.00 756.50 (0.46%)<br />
- In FY12, the department's General Fund <strong>budget</strong> will increase by 2.08%. The majority <<strong>st</strong>rong>of</<strong>st</strong>rong> the increase is due to expenses associated with the<br />
Intersection Public Safety Program (Red Light Cameras), which are covered by revenues generated from the program.<br />
- A full-time Computer Resource Manager ($107,962), a full-time Police Training Speciali<strong>st</strong> - K-9 Trainer ($52,352) , a full-time Mgmt<br />
Methods Analy<strong>st</strong> II - Fleet Manager , a full-time Polygraph Examiner ($88,020), a part-time Emergency Complaint Writer ($17,913), and a parttime<br />
Maintenance Mechanic II ($29,664) will be eliminated in FY12.<br />
- Also in FY12, one full-time Maintenance Worker II will be downgraded to a Cu<strong>st</strong>odian I ($11,856).<br />
- The three year Edward Byrne Memorial Ju<strong>st</strong>ice Assi<strong>st</strong>ance Grant ($1,303,348) is in its third year and funds one full-time Information Clerk II<br />
($37,474), three full-time Emergency Complaint Writers ($154,801), one full-time Office Sy<strong>st</strong>ems Speciali<strong>st</strong> ($43,215), one full-time Data<br />
Entry Operator I ($42,770), one full-time Police Inve<strong>st</strong>igative Assi<strong>st</strong>ant ($69,515), and one full-time Intelligence Analy<strong>st</strong> ($58,870). Starting in<br />
FY11, this grant and all other Ju<strong>st</strong>ice Assi<strong>st</strong>ance Grants were housed in the new Police Grant Tru<strong>st</strong> Fund. In FY12, these grant funded positions<br />
will be included in the position summary for the fir<strong>st</strong> time.<br />
- The COPS Hiring Recovery Program Grant, $2,053,740, will be used for three years to retain five full-time Police Officer positions ($355,689)<br />
249
City <<strong>st</strong>rong>of</<strong>st</strong>rong> St. Petersburg, Florida - FY 2012 Proposed Fiscal Plan<br />
which would have been eliminated in FY10, and to increase <strong>st</strong>affing by five more full-time Police Officer positions ($355,689). This is the third<br />
year <<strong>st</strong>rong>of</<strong>st</strong>rong> the grant. In FY12, these grant funded positions will also be included in the position summary for the fir<strong>st</strong> time.<br />
- All <<strong>st</strong>rong>of</<strong>st</strong>rong> the Police Department's performance measures address the Mayor's goal <<strong>st</strong>rong>of</<strong>st</strong>rong> Safety. They all also address the Mayor's goal <<strong>st</strong>rong>of</<strong>st</strong>rong> Service,<br />
except for the second and ninth measure.<br />
Objective and Performance Measure<br />
Unit Of<br />
Measure<br />
FY 2009<br />
Actual<br />
FY 2010<br />
Actual<br />
FY 2011<br />
Target<br />
FY2011<br />
E<strong>st</strong>imate<br />
FY 2012<br />
Proposed<br />
Admini<strong>st</strong>rative Services Objectives<br />
The objective <<strong>st</strong>rong>of</<strong>st</strong>rong> the Admini<strong>st</strong>rative Services Bureau (ASB) Division is to:<br />
• Enhance operational efficiencies within Records & Identification, Communications, and Research & Accreditation<br />
• Achieve overall favorability in overtime usage/overall co<strong>st</strong> containment through FY12.<br />
• Achieve sworn and non-sworn goals <<strong>st</strong>rong>of</<strong>st</strong>rong> 100% by end <<strong>st</strong>rong>of</<strong>st</strong>rong> FY12.<br />
ASB Diversity Recruiting Events Attended # 25 19 25 20 20<br />
ASB Minority Officer New Hires # 5 10 6 5 5<br />
ASB Officer New Hires # 18 41 25 20 20<br />
Chief <<strong>st</strong>rong>of</<strong>st</strong>rong> Police Objective<br />
The objective <<strong>st</strong>rong>of</<strong>st</strong>rong> the Chief <<strong>st</strong>rong>of</<strong>st</strong>rong> Police Division is to:<br />
• Reduce grievances and arbitrations.<br />
Grievances # 9 3 7 4 4<br />
Communications Objectives<br />
The objective <<strong>st</strong>rong>of</<strong>st</strong>rong> the Communications Center Division is to:<br />
• Enhance operational efficiencies by increasing percentage <<strong>st</strong>rong>of</<strong>st</strong>rong> calls for service processed by the Telephone Reporting Unit.<br />
Communications Citizens Calls for Service Processed % 11.30 10.70 13.00 12.00 12.00<br />
Communications Priority Calls # 225.70 184.00 250.00 200.00 200.00<br />
Di<strong>st</strong>rict I Objectives<br />
The objective <<strong>st</strong>rong>of</<strong>st</strong>rong> the Patrol Di<strong>st</strong>rict I Division is to:<br />
• Ensure all personnel are properly trained and using the new CAD/RMS s<<strong>st</strong>rong>of</<strong>st</strong>rong>tware.<br />
• Track the Community Service Officer (CSO) calls for continued adherence to policy.<br />
• Provide and track uncommitted time for <<strong>st</strong>rong>of</<strong>st</strong>rong>ficers to conduct self-initiated activities and Directed Patrols (DPs) addressing community<br />
concerns.<br />
• Maintain and develop new partnerships between the police and Midtown community.<br />
Di<strong>st</strong>rict I CSO Calls # 1,327 1,123 1,725 1,725 1,600<br />
Di<strong>st</strong>rict I Directed Patrol # 6,419 5,209 6,600 5,500 5,500<br />
Di<strong>st</strong>rict I Midtown Crimes # 5,059 2,993 4,800 3,000 2,800<br />
Di<strong>st</strong>rict II Objectives<br />
The objective <<strong>st</strong>rong>of</<strong>st</strong>rong> the Patrol Di<strong>st</strong>rict II Division is to:<br />
• Ensure all personnel are properly trained and using the new CAD/RMS s<<strong>st</strong>rong>of</<strong>st</strong>rong>tware.<br />
• Track the CSO calls for continued adherence to policy.<br />
• Provide and track uncommitted time for <<strong>st</strong>rong>of</<strong>st</strong>rong>ficers to conduct self-initiated activities and DPs addressing community concerns.<br />
Di<strong>st</strong>rict II CSO Calls # 2,148 1,671 2,200 2,200 2,200<br />
Di<strong>st</strong>rict II Directed Patrol # 3,309 4,598 3,500 4,500 4,500<br />
250
Objective and Performance Measure<br />
Di<strong>st</strong>rict III Objectives<br />
City <<strong>st</strong>rong>of</<strong>st</strong>rong> St. Petersburg, Florida - FY 2012 Proposed Fiscal Plan<br />
Unit Of<br />
Measure<br />
FY 2009<br />
Actual<br />
FY 2010<br />
Actual<br />
FY 2011<br />
Target<br />
FY2011<br />
E<strong>st</strong>imate<br />
The objective <<strong>st</strong>rong>of</<strong>st</strong>rong> the Patrol Di<strong>st</strong>rict III Division is to:<br />
• Ensure all personnel are properly trained and using the new CAD/RMS s<<strong>st</strong>rong>of</<strong>st</strong>rong>tware.<br />
• Track the CSO calls for continued adherence to policy.<br />
• Provide and track uncommitted time for <<strong>st</strong>rong>of</<strong>st</strong>rong>ficers to conduct self-initiated activities and DPs addressing community concerns.<br />
FY 2012<br />
Proposed<br />
Di<strong>st</strong>rict III CSO Calls # 1,668 1,411 1,600 1,600 1,600<br />
Di<strong>st</strong>rict III Directed Patrol # 3,257 4,778 3,800 4,000 4,000<br />
Internal Affairs Objectives<br />
The objective <<strong>st</strong>rong>of</<strong>st</strong>rong> the Internal Affairs Division is to:<br />
• Reduce citizen complaints.<br />
• Reduce the time <<strong>st</strong>rong>of</<strong>st</strong>rong> completing both Internal Affairs inve<strong>st</strong>igations and Bureau inve<strong>st</strong>igations.<br />
Internal Affairs # <<strong>st</strong>rong>of</<strong>st</strong>rong> Citizen Complaints # 54 47 65 45 45<br />
Internal Affairs # <<strong>st</strong>rong>of</<strong>st</strong>rong> Days to Close Citizen Complaints # 43 47 43 43 43<br />
K-9 Unit Objectives<br />
The objective <<strong>st</strong>rong>of</<strong>st</strong>rong> the K-9 Unit Division is to:<br />
• Increase deployments by 10%.<br />
• Increase catches by 10%.<br />
• Increase community demon<strong>st</strong>rations by 10%.<br />
K-9 Unit Arre<strong>st</strong>s # 206 172 250 200 220<br />
K-9 Unit Community Demon<strong>st</strong>rations # 101 173 155 155 180<br />
K-9 Unit Deployments # 1,286 1,151 1,520 1,520 1,550<br />
Legal Division Objective<br />
The objective <<strong>st</strong>rong>of</<strong>st</strong>rong> the Legal Services Division is to:<br />
• Continue to pursue physical improvements to the division.<br />
• Continue presentations to other divisions.<br />
• Present five cases before the nuisance abatement board in FY11.<br />
Legal Division Nuisance Abatement Cases # 8 7 6 6 6<br />
Traffic & Marine Objectives<br />
The objective <<strong>st</strong>rong>of</<strong>st</strong>rong> the Traffic & Marine Division is to:<br />
• Increase DUI arre<strong>st</strong>s by 5%.<br />
• Increase crash inve<strong>st</strong>igations by 5%.<br />
• Increase moving citations by 5%.<br />
• Increase marine citations by 5%.<br />
Traffic & Marine Crash Inve<strong>st</strong>igations # 439 479 378 378 385<br />
Traffic & Marine DUI Arre<strong>st</strong>s # 500 765 630 630 650<br />
Traffic & Marine Marine Citations # 97 83 100 100 110<br />
Traffic & Marine Moving Citations # 3,381 3,752 3,969 3,800 3,850<br />
Uniform Services Objectives<br />
The objective <<strong>st</strong>rong>of</<strong>st</strong>rong> the Uniform Services Bureau Division is to:<br />
• Increase drug arre<strong>st</strong>s by Street Crimes by 5%.<br />
• Increase the number <<strong>st</strong>rong>of</<strong>st</strong>rong> Off Duty Availability Forms by Special Events by 5%.<br />
251
Objective and Performance Measure<br />
City <<strong>st</strong>rong>of</<strong>st</strong>rong> St. Petersburg, Florida - FY 2012 Proposed Fiscal Plan<br />
Unit Of<br />
Measure<br />
FY 2009<br />
Actual<br />
FY 2010<br />
Actual<br />
FY 2011<br />
Target<br />
FY2011<br />
E<strong>st</strong>imate<br />
FY 2012<br />
Proposed<br />
USB Special Event Availability # 2,421 2,840 2,600 2,900 3,000<br />
USB Street Crimes Drug Arre<strong>st</strong>s # 1,425 1,385 1,496 1,400 1,450<br />
Vice and Narcotics Objective<br />
The objective <<strong>st</strong>rong>of</<strong>st</strong>rong> the Vice and Narcotics Division is to:<br />
• Increase seizure <<strong>st</strong>rong>of</<strong>st</strong>rong> marijuana, powder and crack cocaine, MDMA (Ec<strong>st</strong>asy), and heroin.<br />
Vice and Narcotics<br />
Drug Arre<strong>st</strong>s<br />
# 1,027 917 920 950 1,000<br />
252
City <<strong>st</strong>rong>of</<strong>st</strong>rong> St. Petersburg, Florida - FY 2012 Proposed Fiscal Plan<br />
Public Works Admini<strong>st</strong>ration<br />
Public Works Admini<strong>st</strong>ration<br />
Total Full Time Equivalents (FTE) = 812.46<br />
Engineering and Capital Improvements Department<br />
Total Full Time Equivalents (FTE) = 100.85<br />
Fleet Management Department<br />
Total Full Time Equivalents (FTE) = 69.00<br />
Procurement & Supply Management<br />
Total Full Time Equivalents (FTE) = 18.50<br />
Public Works Admini<strong>st</strong>ration Department<br />
Total Full Time Equivalents (FTE) = 4.75<br />
Sanitation Department<br />
Total Full Time Equivalents (FTE) = 176.76<br />
Stormwater, Pavement & Traffic Operations Department<br />
Total Full Time Equivalents (FTE) = 118.20<br />
Water Resources Department<br />
Total Full Time Equivalents (FTE) = 324.40<br />
253
City <<strong>st</strong>rong>of</<strong>st</strong>rong> St. Petersburg, Florida - FY 2012 Proposed Fiscal Plan<br />
Public Works Admini<strong>st</strong>ration<br />
Budgetary Co<strong>st</strong> Summary<br />
FY 2009<br />
Actual<br />
FY 2010<br />
Actual<br />
FY 2011<br />
Adopted<br />
FY 2011<br />
Amended<br />
FY 2011<br />
E<strong>st</strong>imated<br />
FY 2012<br />
Proposed<br />
FY 2012<br />
Change<br />
Wages And Benefits 48,491,916 49,206,135 49,427,042 49,418,417 47,043,849 49,150,888 (0.56%)<br />
Services And Commodities 103,412,593 104,440,826 104,324,902 105,885,274 108,032,517 105,759,942 1.38%<br />
Capital 5,495,418 6,685,931 8,161,477 12,215,517 10,999,631 9,879,424 21.05%<br />
Transfers Out 22,290,072 23,234,076 22,231,476 22,231,476 22,231,476 24,443,326 9.95%<br />
Total Budget 179,689,999 183,566,968 184,144,897 189,750,684 188,307,473 189,233,580 2.76%<br />
Appropriations By<br />
Fund/Department<br />
FY 2009<br />
Actual<br />
FY 2010<br />
Actual<br />
FY 2011<br />
Adopted<br />
FY 2011<br />
Amended<br />
FY 2011<br />
E<strong>st</strong>imated<br />
FY 2012<br />
Proposed<br />
FY 2012<br />
Change<br />
General Operating Fund<br />
Engineering And Capital Improvements<br />
Department<br />
1,108,619 1,117,325 1,147,625 1,161,587 1,213,764 1,074,693 (6.36%)<br />
Fleet Management Department 116 0 0 0 0 0 0.00%<br />
Procurement & Supply Management 1,209,974 1,179,482 1,224,343 1,227,846 1,169,293 1,134,835 (7.31%)<br />
Public Works Admini<strong>st</strong>ration<br />
Department<br />
5,547,694 5,402,886 5,734,319 5,734,973 5,600,158 5,452,100 (4.92%)<br />
Sanitation Department 725 36,291 0 0 0 0 0.00%<br />
Stormwater, Pavement & Traffic<br />
Operations Department<br />
3,778,829 3,439,436 3,591,146 3,652,664 3,334,996 3,494,395 (2.69%)<br />
Water Resources Department (1,539) 1,347 0 0 0 0 0.00%<br />
Total General Operating Fund 11,644,419 11,176,768 11,697,433 11,777,071 11,318,211 11,156,023 (4.63%)<br />
Non-General Funds<br />
Airport Operating (204) 1,409 0 0 0 0 0.00%<br />
American Recovery & Reinve<strong>st</strong>ment<br />
Act<br />
2,076 528,815 0 1,223,489 266,782 0 0.00%<br />
Community Development Block<br />
Grant<br />
1,273,849 (10,767) 0 (10,689) 0 0 0.00%<br />
Equipment Replacement 3,079,501 2,767,386 7,272,300 8,131,974 8,131,847 8,060,800 10.84%<br />
Fleet Management 14,442,895 15,571,284 15,376,588 16,002,992 16,164,127 16,011,869 4.13%<br />
Information & Communication<br />
Services<br />
0 0 0 0 (102) 0 0.00%<br />
Marina Operating 254 (266) 0 0 0 0 0.00%<br />
Neighborhood Stabilization<br />
Program<br />
68,970 161,320 0 21,233 20,378 0 0.00%<br />
Parking Revenue 368,670 339,264 391,318 394,230 346,111 409,031 4.53%<br />
Port Operating 285 (161) 0 0 0 0 0.00%<br />
Sanitation Equipment Replacement 1,466,228 3,365,804 772,752 2,692,884 2,692,610 2,244,000 190.39%<br />
Sanitation Operating 38,589,504 37,662,092 37,707,142 37,778,145 37,470,152 37,502,402 (0.54%)<br />
Stormwater Utility Operating 10,662,452 11,841,652 10,186,056 10,239,685 11,175,228 10,485,901 2.94%<br />
Sunken Gardens 19,134 10,732 0 0 0 0 0.00%<br />
Supply Management 480,279 522,686 525,764 527,640 544,321 522,665 (0.59%)<br />
Water Resources 97,591,688 99,628,949 100,215,544 100,972,032 100,177,808 102,840,889 2.62%<br />
Total Non-General Funds 168,045,580 172,390,201 172,447,464 177,973,613 176,989,262 178,077,557 3.26%<br />
Total Budget 179,689,999 183,566,968 184,144,897 189,750,684 188,307,473 189,233,580 2.76%<br />
254
City <<strong>st</strong>rong>of</<strong>st</strong>rong> St. Petersburg, Florida - FY 2012 Proposed Fiscal Plan<br />
Revenue Sources<br />
FY 2009<br />
Actual<br />
FY 2010<br />
Actual<br />
FY 2011<br />
Adopted<br />
FY 2011<br />
Amended<br />
FY 2011<br />
E<strong>st</strong>imated<br />
FY 2012<br />
Proposed<br />
FY 2012<br />
Change<br />
Contractors Permits 38,106 31,080 35,000 35,000 10,824 35,000 0.00%<br />
Other License And Permits 22,770 24,660 19,500 19,500 8,638 19,500 0.00%<br />
Federal Grants 60,280 0 0 241,195 0 0 0.00%<br />
State Grants 9,223 0 0 0 0 0 0.00%<br />
State Shared Revenue 198,700 203,650 218,325 218,325 49,255 218,325 0.00%<br />
Grants From Other Local Units 317,353 262,094 310,398 543,441 17,109 290,398 (6.44%)<br />
General Government 48,774 25,298 16,000 16,000 5,462 16,000 0.00%<br />
Physical Environment Charges 142,147,667 142,448,196 146,761,368 146,761,368 147,309,660 152,290,085 3.77%<br />
Transportation Charges (663) 0 0 0 0 0 0.00%<br />
Other Charges For Services 446,305 676,426 319,000 319,000 185,077 319,000 0.00%<br />
Traffic And Parking 6 (20) 0 0 0 0 0.00%<br />
Intere<strong>st</strong> Earnings 1,596,173 1,132,855 1,472,903 1,472,903 471,878 513,268 (65.15%)<br />
Rents And Royalties 24,512 13,244 15,000 15,000 5,520 15,000 0.00%<br />
Special Assessment 242,204 174,032 0 0 0 0 0.00%<br />
Sale Of Fixed Assets 955,044 256,628 215,000 215,000 419,975 195,000 (9.30%)<br />
Sale Of Surplus Material 180,920 311,111 413,500 413,500 159,699 363,500 (12.09%)<br />
Contributions And Donations 867,691 25,002 0 0 0 0 0.00%<br />
Misc Revenue (193,694) (8,526) (272,000) (272,000) 101,326 (132,000) (51.47%)<br />
General & Admini<strong>st</strong>rative 619,536 637,800 656,928 656,928 656,928 656,928 0.00%<br />
Department Charges 19,359,056 17,939,311 19,316,547 19,316,547 19,851,337 20,281,115 4.99%<br />
Other Charges (1) (72) 0 0 0 0 0.00%<br />
Transfer From Water Co<strong>st</strong> Stabilization 5,767,058 2,994,316 3,000,000 3,000,000 1,493,971 1,500,000 (50.00%)<br />
Transfer From Sanitation Operating 3,000,000 2,000,004 2,000,000 2,000,000 2,000,000 2,000,000 0.00%<br />
Utility Tax Revenue 123 230 0 0 0 0 0.00%<br />
General Fund 9,582,798 9,690,329 10,694,180 10,773,818 10,359,636 10,017,770 (6.33%)<br />
Parking Revenue 355,054 323,404 391,318 394,230 343,258 409,031 4.53%<br />
Sanitation Operating (2,584,189) (2,959,918) (2,847,256) (2,776,253) (3,081,603) (2,611,474) (8.28%)<br />
Stormwater Utility Operating (1,441,276) (467,228) (1,899,829) (1,846,200) (1,134,172) (1,563,816) (17.69%)<br />
Supply Management 453,082 484,234 764 2,640 (5,337) (2,335) (405.63%)<br />
Water Resources 949,085 5,539,759 1,422,611 1,946,055 3,747,106 151,689 (89.34%)<br />
Fleet Management (704,653) 431,092 (301,412) 83,797 261,328 (299,772) (0.54%)<br />
Equipment Replacement (2,410,634) (624,180) 3,489,300 4,348,974 4,089,131 4,337,158 24.30%<br />
Information & Communication<br />
0 0 0 0 (102) 0 0.00%<br />
Services<br />
Sanitation Equipment Replacement (1,615,304) 1,276,075 (1,302,248) 617,884 694,365 214,210 (116.45%)<br />
Airport Operating (204) 1,409 0 0 0 0 0.00%<br />
Neighborhood Stabilization<br />
68,970 161,320 0 21,233 20,378 0 0.00%<br />
Program<br />
Community Development Block<br />
1,273,849 (10,767) 0 (10,689) 0 0 0.00%<br />
Grant<br />
Billing & Collections 4,532 0 0 0 0 0 0.00%<br />
School Crossing Guard Tru<strong>st</strong> 30,000 35,000 0 0 0 0 0.00%<br />
General Liabilities Claims 0 0 0 0 44 0 0.00%<br />
American Recovery & Reinve<strong>st</strong>ment<br />
2,076 528,815 0 1,223,489 266,782 0 0.00%<br />
Act<br />
Sunken Gardens 19,134 10,732 0 0 0 0 0.00%<br />
Port Operating 285 (161) 0 0 0 0 0.00%<br />
Marina Operating 254 (266) 0 0 0 0 0.00%<br />
Total Revenue 179,689,999 183,566,968 184,144,897 189,750,684 188,307,473 189,233,580 2.76%<br />
Position Summary By Department<br />
FY 2009<br />
Actual<br />
FY 2010<br />
Actual<br />
FY 2011<br />
Adopted<br />
FY 2012<br />
Proposed<br />
FY 2012<br />
Change<br />
Engineering and Capital Improvements Department 76.00 72.00 71.00 70.00 (1.41%)<br />
Fleet Management Department 76.00 76.00 72.00 69.00 (4.17%)<br />
Procurement & Supply Management 18.00 18.00 18.00 18.00 0.00%<br />
Public Works Admini<strong>st</strong>ration Department 6.00 5.00 5.00 4.00 (20.00%)<br />
Sanitation Department 176.00 176.16 172.16 172.16 0.00%<br />
Stormwater, Pavement & Traffic Operations Department 119.00 114.00 117.00 115.00 (1.71%)<br />
Water Resources Department 334.00 321.00 323.00 323.00 0.00%<br />
Total Full-Time FTE 805.00 782.16 778.16 771.16 (0.90%)<br />
255
City <<strong>st</strong>rong>of</<strong>st</strong>rong> St. Petersburg, Florida - FY 2012 Proposed Fiscal Plan<br />
Position Summary By Department<br />
FY 2009<br />
Actual<br />
FY 2010<br />
Actual<br />
FY 2011<br />
Adopted<br />
FY 2012<br />
Proposed<br />
FY 2012<br />
Change<br />
Engineering and Capital Improvements Department 38.00 38.50 38.50 30.85 (19.87%)<br />
Fleet Management Department 1.00 0.00 0.00 0.00 0.00%<br />
Procurement & Supply Management 0.00 0.00 0.50 0.50 0.00%<br />
Public Works Admini<strong>st</strong>ration Department 0.00 1.00 0.50 0.75 50.00%<br />
Sanitation Department 2.50 5.00 3.50 4.60 31.43%<br />
Stormwater, Pavement & Traffic Operations Department 2.50 2.00 2.00 3.20 60.00%<br />
Water Resources Department 2.75 2.00 1.50 1.40 (6.67%)<br />
Total Part-Time FTE 46.75 48.50 46.50 41.30 (11.18%)<br />
Total FTE 851.75 830.66 824.66 812.46 (1.48%)<br />
256
Department Mission Statement<br />
City <<strong>st</strong>rong>of</<strong>st</strong>rong> St. Petersburg, Florida - FY 2012 Proposed Fiscal Plan<br />
Engineering and Capital Improvements Department<br />
The mission <<strong>st</strong>rong>of</<strong>st</strong>rong> the Engineering and Capital Improvements Department is to provide pr<<strong>st</strong>rong>of</<strong>st</strong>rong>icient survey, mapping, engineering and architectural design, and<br />
con<strong>st</strong>ruction inspection services for <strong>capital</strong> improvement and major maintenance projects; plan, design, and con<strong>st</strong>ruct facilities and improvements <<strong>st</strong>rong>of</<strong>st</strong>rong> the highe<strong>st</strong><br />
quality in the mo<strong>st</strong> co<strong>st</strong> effective manner for the residents and visitors <<strong>st</strong>rong>of</<strong>st</strong>rong> St. Petersburg; and provide courteous and timely processing <<strong>st</strong>rong>of</<strong>st</strong>rong> permit applications.<br />
Services Provided<br />
The Engineering and Capital Improvements Department provides the following services:<br />
• Plans, designs, and manages con<strong>st</strong>ruction projects for City roads, infra<strong>st</strong>ructure, and facilities.<br />
• Admini<strong>st</strong>ers major maintenance programs for roadways, bridges, and sidewalks.<br />
• Maintains and improves the transportation sy<strong>st</strong>em for the safe and efficient movement <<strong>st</strong>rong>of</<strong>st</strong>rong> people, goods, and services.<br />
• Issues permits for work within City right-<<strong>st</strong>rong>of</<strong>st</strong>rong>-way.<br />
• Regulates developments for <strong>st</strong>ormwater run<<strong>st</strong>rong>of</<strong>st</strong>rong>f; admini<strong>st</strong>ers the Stormwater Utility and City's National Pollutant Discharge Elimination Sy<strong>st</strong>em<br />
(NPDES/MS4) Permit.<br />
• Compiles and updates City infra<strong>st</strong>ructure records using GIS computer sy<strong>st</strong>ems.<br />
• Admini<strong>st</strong>ers the school crossing guard program.<br />
• Develops and admini<strong>st</strong>ers a comprehensive <strong>capital</strong> improvements program for selected City facilities.<br />
Budgetary Co<strong>st</strong> Summary<br />
FY 2009<br />
Actual<br />
FY 2010<br />
Actual<br />
FY 2011<br />
Adopted<br />
FY 2011<br />
Amended<br />
FY 2011<br />
E<strong>st</strong>imated<br />
FY 2012<br />
Proposed<br />
FY 2012<br />
Change<br />
Wages And Benefits 1,643,324 1,654,257 1,463,728 1,463,728 1,581,143 1,391,989 (4.90%)<br />
Services And Commodities 164,432 136,096 75,215 101,239 98,054 91,735 21.96%<br />
Capital 1,237,119 537,809 0 1,228,447 276,229 0 0.00%<br />
Total Budget 3,044,874 2,328,162 1,538,943 2,793,415 1,955,426 1,483,724 (3.59%)<br />
Appropriations By Fund/Program<br />
FY 2009<br />
Actual<br />
FY 2010<br />
Actual<br />
FY 2011<br />
Adopted<br />
FY 2011<br />
Amended<br />
FY 2011<br />
E<strong>st</strong>imated<br />
FY 2012<br />
Proposed<br />
FY 2012<br />
Change<br />
General Operating Fund<br />
Engineering Capital Improvements<br />
15,384 (14,312) 0 80 (141,679) 0 0.00%<br />
Program<br />
Engineering Parking Program 0 22,250 0 0 19,832 0 0.00%<br />
Engineering Support Program 263,121 278,114 339,000 352,858 642,101 339,000 0.00%<br />
Non-Department Program 0 0 0 0 17,590 0 0.00%<br />
School Crossing Guards Program 830,115 831,274 808,625 808,649 675,920 735,693 (9.02%)<br />
Totals for General Operating Fund 1,108,619 1,117,325 1,147,625 1,161,587 1,213,764 1,074,693 (6.36%)<br />
American Recovery & Reinve<strong>st</strong>ment Act<br />
Engineering Support Program 0 464,797 0 1,223,489 263,389 0 0.00%<br />
Engineering Te<strong>st</strong>ing Program 0 6,954 0 0 0 0 0.00%<br />
Housing Tru<strong>st</strong> Funds Program 2,076 53,991 0 0 3,393 0 0.00%<br />
Totals for American Recovery &<br />
Reinve<strong>st</strong>ment Act<br />
2,076 525,742 0 1,223,489 266,782 0 0.00%<br />
Parking Revenue<br />
Engineering Parking Program 368,670 339,264 391,318 394,230 346,111 409,031 4.53%<br />
Community Development Block Grant<br />
Housing Tru<strong>st</strong> Funds Program 1,273,849 (10,767) 0 (10,689) 0 0 0.00%<br />
Neighborhood Stabilization Program<br />
Housing Tru<strong>st</strong> Funds Program 68,555 144,253 0 21,233 20,315 0 0.00%<br />
Sunken Gardens<br />
Sunken Gardens Program 19,134 10,732 0 0 0 0 0.00%<br />
Water Resources<br />
Admini<strong>st</strong>rative Support Services<br />
Non-Department Program<br />
1,880<br />
0<br />
19,227<br />
0<br />
0<br />
0<br />
1,790<br />
0<br />
22,098<br />
33,670<br />
0<br />
0<br />
0.00%<br />
0.00%<br />
257
City <<strong>st</strong>rong>of</<strong>st</strong>rong> St. Petersburg, Florida - FY 2012 Proposed Fiscal Plan<br />
Appropriations By Fund/Program<br />
FY 2009<br />
Actual<br />
FY 2010<br />
Actual<br />
FY 2011<br />
Adopted<br />
FY 2011<br />
Amended<br />
FY 2011<br />
E<strong>st</strong>imated<br />
FY 2012<br />
Proposed<br />
FY 2012<br />
Change<br />
Totals for Water Resources 1,880 19,227 0 1,790 55,768 0 0.00%<br />
Stormwater Utility Operating<br />
SW Utility Collection & Marine Infra<strong>st</strong>r<br />
Program<br />
201,757 181,403 0 1,775 52,686 0 0.00%<br />
Airport Operating<br />
Airport Program<br />
Non-Department Program<br />
(204)<br />
0<br />
715<br />
694<br />
0<br />
0<br />
0<br />
0<br />
0<br />
0<br />
0<br />
0<br />
0.00%<br />
0.00%<br />
Totals for Airport Operating (204) 1,409 0 0 0 0 0.00%<br />
Marina Operating<br />
Marina Program 254 (266) 0 0 0 0 0.00%<br />
Port Operating<br />
Port Program 285 (161) 0 0 0 0 0.00%<br />
Total Budget 3,044,874 2,328,162 1,538,943 2,793,415 1,955,426 1,483,724 (3.59%)<br />
Revenue Sources<br />
FY 2009<br />
Actual<br />
FY 2010<br />
Actual<br />
FY 2011<br />
Adopted<br />
FY 2011<br />
Amended<br />
FY 2011<br />
E<strong>st</strong>imated<br />
FY 2012<br />
Proposed<br />
FY 2012<br />
Change<br />
Contractors Permits 38,106 31,080 35,000 35,000 10,824 35,000 0.00%<br />
Other License And Permits 22,770 24,660 19,500 19,500 8,638 19,500 0.00%<br />
General Government 48,287 15,352 16,000 16,000 4,829 16,000 0.00%<br />
Other Charges For Services 33,454 22,873 16,000 16,000 1,003 16,000 0.00%<br />
Traffic And Parking 6 (20) 0 0 0 0 0.00%<br />
Sale Of Fixed Assets 0 3,498 0 0 0 0 0.00%<br />
Misc Revenue (19,737) (33,524) 0 0 409 0 0.00%<br />
Department Charges 803 210 500 500 500 500 0.00%<br />
Other Charges 0 (0) 0 0 0 0 0.00%<br />
General Fund 987,914 1,034,056 1,060,625 1,074,587 1,190,414 987,693 (6.88%)<br />
Parking Revenue 355,054 323,404 391,318 394,230 343,258 409,031 4.53%<br />
Water Resources (17,488) 19,227 0 1,790 55,768 0 0.00%<br />
Stormwater Utility Operating 201,757 181,403 0 1,775 52,686 0 0.00%<br />
Neighborhood Stabilization<br />
Program<br />
68,555 144,253 0 21,233 20,315 0 0.00%<br />
Community Development Block<br />
Grant<br />
1,273,849 (10,767) 0 (10,689) 0 0 0.00%<br />
Airport Operating (204) 1,409 0 0 0 0 0.00%<br />
School Crossing Guard Tru<strong>st</strong> 30,000 35,000 0 0 0 0 0.00%<br />
American Recovery & Reinve<strong>st</strong>ment<br />
Act<br />
2,076 525,742 0 1,223,489 266,782 0 0.00%<br />
Sunken Gardens 19,134 10,732 0 0 0 0 0.00%<br />
Port Operating 285 (161) 0 0 0 0 0.00%<br />
Marina Operating 254 (266) 0 0 0 0 0.00%<br />
Total Revenue 3,044,874 2,328,162 1,538,943 2,793,415 1,955,426 1,483,724 (3.59%)<br />
Position Summary<br />
FY 2009<br />
Actual<br />
FY 2010<br />
Actual<br />
FY 2011<br />
Adopted<br />
FY 2012<br />
Proposed<br />
FY 2012<br />
Change<br />
Engineering Support Program 61.00 59.00 58.00 58.00 0.00%<br />
School Crossing Guards Program 1.00 1.00 1.00 1.00 0.00%<br />
Engineering Capital Improvements Program 8.00 7.00 7.00 6.00 (14.29%)<br />
Engineering Parking Program 6.00 5.00 5.00 5.00 0.00%<br />
258
City <<strong>st</strong>rong>of</<strong>st</strong>rong> St. Petersburg, Florida - FY 2012 Proposed Fiscal Plan<br />
Position Summary<br />
FY 2009<br />
Actual<br />
FY 2010<br />
Actual<br />
FY 2011<br />
Adopted<br />
FY 2012<br />
Proposed<br />
FY 2012<br />
Change<br />
Total Full-Time FTE 76.00 72.00 71.00 70.00 (1.41%)<br />
Engineering Support Program 0.00 1.00 1.00 1.00 0.00%<br />
School Crossing Guards Program 38.00 37.50 37.50 29.85 (20.40%)<br />
Total Part-Time FTE 38.00 38.50 38.50 30.85 (19.87%)<br />
Total FTE 114.00 110.50 109.50 100.85 (7.90%)<br />
- Overall expenses are projected to decrease by 3.59% from FY11 Adopted, which is due to accurately reflecting the exact part-time hours <<strong>st</strong>rong>of</<strong>st</strong>rong><br />
each <<strong>st</strong>rong>of</<strong>st</strong>rong> the 75 school guard positions.<br />
The Engineering and Capital Improvements Department's fir<strong>st</strong> performance measures address the Mayor's goal <<strong>st</strong>rong>of</<strong>st</strong>rong> Service. The second measure<br />
addresses the Mayor's goals <<strong>st</strong>rong>of</<strong>st</strong>rong> Safety and Seamlessness. The next three performance measures address the Mayor's goal <<strong>st</strong>rong>of</<strong>st</strong>rong> Service. The fourth<br />
performance measure also addresses the Mayor's goal <<strong>st</strong>rong>of</<strong>st</strong>rong> Safety. The next four performance measures address the Mayor's goal <<strong>st</strong>rong>of</<strong>st</strong>rong> Safety. The<br />
sixth performance measure also addresses the Mayor's goal <<strong>st</strong>rong>of</<strong>st</strong>rong> Seamlessness and the eighth performance measure addresses the Mayor's goal <<strong>st</strong>rong>of</<strong>st</strong>rong><br />
Schools. The tenth performance measure addresses the Mayor's goal <<strong>st</strong>rong>of</<strong>st</strong>rong> Service. The la<strong>st</strong> performance measure is linked to the Mayor's goals <<strong>st</strong>rong>of</<strong>st</strong>rong><br />
Service.<br />
Objective and Performance Measure<br />
Unit Of<br />
Measure<br />
FY 2009<br />
Actual<br />
FY 2010<br />
Actual<br />
FY 2011<br />
Target<br />
FY2011<br />
E<strong>st</strong>imate<br />
FY 2012<br />
Proposed<br />
Accurate and Up to Date New Contract Information<br />
The objective <<strong>st</strong>rong>of</<strong>st</strong>rong> the Support Services Division is to provide and share accurate and up to date new contract information.<br />
New Engineering Contracts # 171 130 200 130 130<br />
Assi<strong>st</strong> Departments and Public with Code Compliance<br />
The objective <<strong>st</strong>rong>of</<strong>st</strong>rong> the Support Division is to assi<strong>st</strong> other departments and the public with code compliance issues for maintenance and development<br />
work in City right-<<strong>st</strong>rong>of</<strong>st</strong>rong>-way and to assi<strong>st</strong> other departments with non-funded projects.<br />
Engineering Services for Non-Funded Programs # 40 20 35 30 30<br />
CID Active Projects vs. Closed Projects per Fiscal Year<br />
The objective <<strong>st</strong>rong>of</<strong>st</strong>rong> the Capital Improvements Division (CID) is to plan, design, and con<strong>st</strong>ruct facilities and other improvements included in the multiyear<br />
Capital Improvement Program. (Note: The number for CID Number <<strong>st</strong>rong>of</<strong>st</strong>rong> Projects Completed and CID Total Dollar Value <<strong>st</strong>rong>of</<strong>st</strong>rong> Completed Projects<br />
is reported on completed and closed projects.)<br />
CID Number <<strong>st</strong>rong>of</<strong>st</strong>rong> Active CIP Projects # 67 80 79 86 89<br />
CID Number <<strong>st</strong>rong>of</<strong>st</strong>rong> Projects Completed # 24 26 30 62 39<br />
CID Total Dollar Value <<strong>st</strong>rong>of</<strong>st</strong>rong> Active CIP Projects $ 36,830,021 40,726,445 29,000,000 35,549,866 27,729,467<br />
CID Total Dollar Value <<strong>st</strong>rong>of</<strong>st</strong>rong> Completed Projects $ 12,762,498 12,847,843 14,000,000 17,963,929 15,282,466<br />
Complete Permit Reviews<br />
The objective <<strong>st</strong>rong>of</<strong>st</strong>rong> the Stormwater & Permits Division is to assi<strong>st</strong> other departments and the general public in reviewing and issuing various types <<strong>st</strong>rong>of</<strong>st</strong>rong><br />
permits.<br />
Various Permit Reviews # 1,034 980 948 862 948<br />
Creation <<strong>st</strong>rong>of</<strong>st</strong>rong> New Work Orders/Projects<br />
259
City <<strong>st</strong>rong>of</<strong>st</strong>rong> St. Petersburg, Florida - FY 2012 Proposed Fiscal Plan<br />
Objective and Performance Measure<br />
Unit Of<br />
FY 2009 FY 2010 FY 2011 FY2011 FY 2012<br />
Measure<br />
Actual Actual Target E<strong>st</strong>imate Proposed<br />
The objective <<strong>st</strong>rong>of</<strong>st</strong>rong> the Admini<strong>st</strong>ration Division is to plan and direct project implementation through the creation <<strong>st</strong>rong>of</<strong>st</strong>rong> new Engineering work orders.<br />
Engineering Work Orders Initiated # 115 134 130 130 130<br />
Quality Con<strong>st</strong>ruction Inspection Services<br />
The objective <<strong>st</strong>rong>of</<strong>st</strong>rong> the Con<strong>st</strong>ruction Admini<strong>st</strong>ration Division is to provide quality con<strong>st</strong>ruction inspection services for major <strong>capital</strong> improvement<br />
projects.<br />
Engineering Inspection Services # 49 44 35 35 35<br />
Quality Te<strong>st</strong>ing Services<br />
The objective <<strong>st</strong>rong>of</<strong>st</strong>rong> the Te<strong>st</strong>ing Division is to provide pr<<strong>st</strong>rong>of</<strong>st</strong>rong>icient and timely te<strong>st</strong>ing <<strong>st</strong>rong>of</<strong>st</strong>rong> soils, asphalt, and concrete to ensure the quality <<strong>st</strong>rong>of</<strong>st</strong>rong> City<br />
infra<strong>st</strong>ructure.<br />
Con<strong>st</strong>ruction Material Te<strong>st</strong>ing Services # 42 45 40 40 40<br />
Safe School Crossing Zones<br />
The objective <<strong>st</strong>rong>of</<strong>st</strong>rong> the School Guards Division is to assi<strong>st</strong> <strong>st</strong>udents safely across the <strong>st</strong>reets.<br />
School Crossing Zones # 57 57 56 57 57<br />
Safe Vehicular & Pede<strong>st</strong>rian Traffic Control<br />
The objective <<strong>st</strong>rong>of</<strong>st</strong>rong> the Parking Revenue Meter & Lot Maintenance Division is to provide safe vehicular and pede<strong>st</strong>rian traffic control at con<strong>st</strong>ruction<br />
sites and special events.<br />
Traffic Control at Con<strong>st</strong>ruction Sites # 97 98 100 100 100<br />
Traffic Control for Special Events # 72 74 80 80 80<br />
Survey Services<br />
The objective <<strong>st</strong>rong>of</<strong>st</strong>rong> the Survey Division is to support the Design Division by providing survey services for active engineering projects.<br />
Engineering Survey Services # 110 66 120 80 120<br />
Update City Utility Maps<br />
The objective <<strong>st</strong>rong>of</<strong>st</strong>rong> the Design Division is to update City utility maps by utilizing current and enhanced s<<strong>st</strong>rong>of</<strong>st</strong>rong>tware on the City's Geographic Information<br />
Sy<strong>st</strong>em.<br />
Utility Atlas Updating-number published # 164 440 500 178 500<br />
260
Department Mission Statement<br />
City <<strong>st</strong>rong>of</<strong>st</strong>rong> St. Petersburg, Florida - FY 2012 Proposed Fiscal Plan<br />
Fleet Management Department<br />
The mission <<strong>st</strong>rong>of</<strong>st</strong>rong> the Fleet Management Department is to provide timely and co<strong>st</strong> effective services to all user departments to maximize availability, serviceability,<br />
safety, and appearance <<strong>st</strong>rong>of</<strong>st</strong>rong> all the City's vehicles and equipment.<br />
Services Provided<br />
Fleet Management provides the following services:<br />
• Performs scheduled maintenance and repairs, and provides replacement parts as needed to maintain City equipment.<br />
• Provides fuel and emergency road service on a 24 hour a day basis as needed.<br />
• Procures parts, fuels, and lubricants to maintain City equipment.<br />
• Monitors co<strong>st</strong>s <<strong>st</strong>rong>of</<strong>st</strong>rong> fuel, parts, and labor and e<strong>st</strong>ablishes internal service fund charges to other City agencies.<br />
Fleet Equipment Replacement provides the following services:<br />
• Provides tracking and analysis <<strong>st</strong>rong>of</<strong>st</strong>rong> all fleet equipment to determine mo<strong>st</strong> economically useful life.<br />
• Schedules and conducts "retirement" inspections, which support replacing equipment or extending its life.<br />
• Prepares specifications for equipment and participates in the procurement process.<br />
Budgetary Co<strong>st</strong> Summary<br />
FY 2009<br />
Actual<br />
FY 2010<br />
Actual<br />
FY 2011<br />
Adopted<br />
FY 2011<br />
Amended<br />
FY 2011<br />
E<strong>st</strong>imated<br />
FY 2012<br />
Proposed<br />
FY 2012<br />
Change<br />
Wages And Benefits 4,928,376 5,130,087 5,347,801 5,347,801 4,622,471 5,060,831 (5.37%)<br />
Services And Commodities 9,637,065 10,611,415 10,198,587 10,824,991 11,696,765 11,120,838 9.04%<br />
Capital 2,623,074 2,597,168 7,102,500 7,962,174 7,976,636 7,891,000 11.10%<br />
Transfers Out 333,996 0 0 0 0 0 0.00%<br />
Total Budget 17,522,512 18,338,671 22,648,888 24,134,965 24,295,872 24,072,669 6.29%<br />
Appropriations By Fund/Program<br />
FY 2009<br />
Actual<br />
FY 2010<br />
Actual<br />
FY 2011<br />
Adopted<br />
FY 2011<br />
Amended<br />
FY 2011<br />
E<strong>st</strong>imated<br />
FY 2012<br />
Proposed<br />
FY 2012<br />
Change<br />
General Operating Fund<br />
Finance Admini<strong>st</strong>ration Program 116 0 0 0 0 0 0.00%<br />
Fleet Management<br />
Fleet Program 14,442,895 15,571,284 15,376,588 16,002,992 16,164,127 16,011,869 4.13%<br />
Equipment Replacement<br />
Equipment Replacement Program<br />
Non-Department Program<br />
3,079,501<br />
0<br />
2,767,185<br />
201<br />
7,272,300<br />
0<br />
8,131,974<br />
0<br />
8,131,847<br />
0<br />
8,060,800<br />
0<br />
10.84%<br />
0.00%<br />
Totals for Equipment Replacement 3,079,501 2,767,386 7,272,300 8,131,974 8,131,847 8,060,800 10.84%<br />
Information & Communication Services<br />
Non-Department Program 0 0 0 0 (102) 0 0.00%<br />
Total Budget 17,522,512 18,338,671 22,648,888 24,134,965 24,295,872 24,072,669 6.29%<br />
Revenue Sources<br />
FY 2009<br />
Actual<br />
FY 2010<br />
Actual<br />
FY 2011<br />
Adopted<br />
FY 2011<br />
Amended<br />
FY 2011<br />
E<strong>st</strong>imated<br />
FY 2012<br />
Proposed<br />
FY 2012<br />
Change<br />
Federal Grants 140 0 0 241,195 0 0 0.00%<br />
Intere<strong>st</strong> Earnings 960,226 510,995 647,453 647,453 410,120 257,168 (60.28%)<br />
Sale Of Fixed Assets 572,180 51,067 0 0 180,381 0 0.00%<br />
Sale Of Surplus Material 4,601 5,438 7,500 7,500 3,091 7,500 0.00%<br />
Contributions And Donations 0 25,002 0 0 0 0 0.00%<br />
Misc Revenue (257,718) 155 0 0 86 0 0.00%<br />
Department Charges 19,358,253 17,939,100 18,806,047 18,806,047 19,351,837 19,770,615 5.13%<br />
261
Revenue Sources<br />
City <<strong>st</strong>rong>of</<strong>st</strong>rong> St. Petersburg, Florida - FY 2012 Proposed Fiscal Plan<br />
FY 2009<br />
Actual<br />
FY 2010<br />
Actual<br />
FY 2011<br />
Adopted<br />
FY 2011<br />
Amended<br />
FY 2011<br />
E<strong>st</strong>imated<br />
FY 2012<br />
Proposed<br />
FY 2012<br />
Change<br />
Other Charges (1) 0 0 0 0 0 0.00%<br />
Fleet Management (704,653) 431,092 (301,412) 83,797 261,328 (299,772) (0.54%)<br />
Equipment Replacement (2,410,634) (624,180) 3,489,300 4,348,974 4,089,131 4,337,158 24.30%<br />
General Fund 116 0 0 0 0 0 0.00%<br />
Information & Communication<br />
Services<br />
0 0 0 0 (102) 0 0.00%<br />
Total Revenue 17,522,512 18,338,671 22,648,888 24,134,965 24,295,872 24,072,669 6.29%<br />
Position Summary<br />
FY 2009<br />
Actual<br />
FY 2010<br />
Actual<br />
FY 2011<br />
Adopted<br />
FY 2012<br />
Proposed<br />
FY 2012<br />
Change<br />
Fleet Program 76.00 76.00 72.00 69.00 (4.17%)<br />
Total Full-Time FTE 76.00 76.00 72.00 69.00 (4.17%)<br />
Fleet Program 1.00 0.00 0.00 0.00 0.00%<br />
Total Part-Time FTE 1.00 0.00 0.00 0.00 0.00%<br />
Total FTE 77.00 76.00 72.00 69.00 (4.17%)<br />
- In FY12 overall expenses are projected to increase 6.29%. The majority <<strong>st</strong>rong>of</<strong>st</strong>rong> this increase is attributed to FY12 planned vehicle and equipment<br />
replacements <<strong>st</strong>rong>of</<strong>st</strong>rong> about $7.89 million, an increase <<strong>st</strong>rong>of</<strong>st</strong>rong> about $90,000 over the FY11 Adopted Budget, as well as a projected increase in fuel co<strong>st</strong>s<br />
<<strong>st</strong>rong>of</<strong>st</strong>rong> $1 million. The replacements maintain the City's current level <<strong>st</strong>rong>of</<strong>st</strong>rong> service and result from the cyclical nature <<strong>st</strong>rong>of</<strong>st</strong>rong> the equipment replacement<br />
plan.<br />
- The increase is somewhat <<strong>st</strong>rong>of</<strong>st</strong>rong>fset by department <strong>operating</strong> reductions including the elimination <<strong>st</strong>rong>of</<strong>st</strong>rong> three full-time positions (two full-time<br />
Equipment Mechanic II ($96,845) and one full-time Maintenance Mechanic ($39,579)) and a $30,000 reduction <<strong>st</strong>rong>of</<strong>st</strong>rong> <strong>budget</strong> for facility repairs<br />
and renovations.<br />
All three <<strong>st</strong>rong>of</<strong>st</strong>rong> the Fleet Management Department's performance measures address the Mayor's goal <<strong>st</strong>rong>of</<strong>st</strong>rong> Service.<br />
Objective and Performance Measure<br />
Unit Of<br />
Measure<br />
FY 2009<br />
Actual<br />
FY 2010<br />
Actual<br />
FY 2011<br />
Target<br />
FY2011<br />
E<strong>st</strong>imate<br />
FY 2012<br />
Proposed<br />
Labor rate comparison<br />
An objective <<strong>st</strong>rong>of</<strong>st</strong>rong> Fleet Maintenance is to maintain a competitive labor rate.<br />
Internal vs External Labor Rate % 24.5 10.0 10.0 10.0 10.0<br />
Repeat repair percentage<br />
An objective <<strong>st</strong>rong>of</<strong>st</strong>rong> Fleet Maintenance is to minimize repeat repairs.<br />
Repeat Repair Percentage % 0.02 0.02 0.02 0.02 0.02<br />
Turn Around Time<br />
An objective <<strong>st</strong>rong>of</<strong>st</strong>rong> Fleet Management is to turn around repairs in a timely manner - within 48 hours.<br />
Turn Around Time % 90 90 90 90 90<br />
262
Department Mission Statement<br />
City <<strong>st</strong>rong>of</<strong>st</strong>rong> St. Petersburg, Florida - FY 2012 Proposed Fiscal Plan<br />
Procurement & Supply Management<br />
The mission <<strong>st</strong>rong>of</<strong>st</strong>rong> the Purchasing & Materials Management Department is to procure suppliers and services for our clients at the be<strong>st</strong> value through supplier<br />
collaboration and innovative supply-chain practices and technology.<br />
Services Provided<br />
The Purchasing & Materials Management Department provides the following services:<br />
• Plans, directs, and supervises the procurement <<strong>st</strong>rong>of</<strong>st</strong>rong> supplies and services.<br />
• Controls warehouse and inventory <<strong>st</strong>rong>of</<strong>st</strong>rong> supplies for internal di<strong>st</strong>ribution to reque<strong>st</strong>ing departments.<br />
• Disposes <<strong>st</strong>rong>of</<strong>st</strong>rong> surplus property.<br />
• Maintains procedures for the inspection <<strong>st</strong>rong>of</<strong>st</strong>rong> supplies and services and maintains the procurement and inventory applications in the Oracle E-Business Suite.<br />
Budgetary Co<strong>st</strong> Summary<br />
FY 2009<br />
Actual<br />
FY 2010<br />
Actual<br />
FY 2011<br />
Adopted<br />
FY 2011<br />
Amended<br />
FY 2011<br />
E<strong>st</strong>imated<br />
FY 2012<br />
Proposed<br />
FY 2012<br />
Change<br />
Wages And Benefits 1,228,366 1,291,471 1,336,021 1,339,665 1,268,309 1,310,155 (1.94%)<br />
Services And Commodities 460,579 418,546 414,086 415,821 445,305 347,345 (16.12%)<br />
Capital 1,309 1,346 0 0 0 0 0.00%<br />
Total Budget 1,690,253 1,711,363 1,750,107 1,755,486 1,713,614 1,657,500 (5.29%)<br />
Appropriations By Fund/Program<br />
FY 2009<br />
Actual<br />
FY 2010<br />
Actual<br />
FY 2011<br />
Adopted<br />
FY 2011<br />
Amended<br />
FY 2011<br />
E<strong>st</strong>imated<br />
FY 2012<br />
Proposed<br />
FY 2012<br />
Change<br />
General Operating Fund<br />
Purchasing Program 1,209,974 1,179,482 1,224,343 1,227,846 1,169,293 1,134,835 (7.31%)<br />
Neighborhood Stabilization Program<br />
Non-Department Program 0 9,195 0 0 0 0 0.00%<br />
Supply Management<br />
Materials Management Program 480,279 522,686 525,764 527,640 544,321 522,665 (0.59%)<br />
Total Budget 1,690,253 1,711,363 1,750,107 1,755,486 1,713,614 1,657,500 (5.29%)<br />
Revenue Sources<br />
FY 2009<br />
Actual<br />
FY 2010<br />
Actual<br />
FY 2011<br />
Adopted<br />
FY 2011<br />
Amended<br />
FY 2011<br />
E<strong>st</strong>imated<br />
FY 2012<br />
Proposed<br />
FY 2012<br />
Change<br />
General Government 487 9,946 0 0 224 0 0.00%<br />
Intere<strong>st</strong> Earnings 3,293 722 0 0 121 0 0.00%<br />
Sale Of Fixed Assets 22,796 36,248 15,000 15,000 50,406 15,000 0.00%<br />
Sale Of Surplus Material 3,244 228 2,000 2,000 131 2,000 0.00%<br />
Misc Revenue 68,134 327,105 21,000 21,000 221,538 21,000 0.00%<br />
General & Admini<strong>st</strong>rative 481,008 514,092 529,512 529,512 529,512 529,512 0.00%<br />
Department Charges 0 0 510,000 510,000 499,000 510,000 0.00%<br />
Other Charges 0 (72) 0 0 0 0 0.00%<br />
Supply Management 453,082 484,234 764 2,640 (5,337) (2,335) (405.63%)<br />
General Fund 658,209 329,665 671,831 675,334 418,019 582,323 (13.32%)<br />
Neighborhood Stabilization<br />
Program<br />
0 9,195 0 0 0 0 0.00%<br />
Total Revenue 1,690,253 1,711,363 1,750,107 1,755,486 1,713,614 1,657,500 (5.29%)<br />
263
City <<strong>st</strong>rong>of</<strong>st</strong>rong> St. Petersburg, Florida - FY 2012 Proposed Fiscal Plan<br />
Position Summary<br />
FY 2009<br />
Actual<br />
FY 2010<br />
Actual<br />
FY 2011<br />
Adopted<br />
FY 2012<br />
Proposed<br />
FY 2012<br />
Change<br />
Purchasing Program 11.81 11.81 11.80 11.80 0.00%<br />
Materials Management Program 6.19 6.19 6.20 6.20 0.00%<br />
Total Full-Time FTE 18.00 18.00 18.00 18.00 0.00%<br />
Materials Management Program 0.00 0.00 0.50 0.50 0.00%<br />
Total Part-Time FTE 0.00 0.00 0.50 0.50 0.00%<br />
Total FTE 18.00 18.00 18.50 18.50 0.00%<br />
- In FY12, the Procurement Department's <strong>budget</strong> decreased 7.31% due to a reorganization. One full-time Procurement & Material Management<br />
Coordinator ($68,532) was eliminated and one full-time Procurement Speciali<strong>st</strong> was added $53,967. Also, data processing charges decreased<br />
($62,148) due to the way the ICS charges were allocated.<br />
- There are no service level changes anticipated for FY12 for the Supply Management Department.<br />
The Procurement & Supply Management Department's two performance measures address the Mayor's goal <<strong>st</strong>rong>of</<strong>st</strong>rong> Service.<br />
Objective and Performance Measure<br />
Unit Of<br />
Measure<br />
FY 2009<br />
Actual<br />
FY 2010<br />
Actual<br />
FY 2011<br />
Target<br />
FY2011<br />
E<strong>st</strong>imate<br />
FY 2012<br />
Proposed<br />
Procurement<br />
The objective <<strong>st</strong>rong>of</<strong>st</strong>rong> Procurement is to procure quality supplies and services at the be<strong>st</strong> value and at the lowe<strong>st</strong> total co<strong>st</strong>.<br />
Amount <<strong>st</strong>rong>of</<strong>st</strong>rong> Procurement Card Transactions $ 4,785,508 4,799,798 4,200,000 4,500,372 4,800,000<br />
Bid Solicitations # 133 162 190 123 180<br />
Number <<strong>st</strong>rong>of</<strong>st</strong>rong> Procurement Card Transactions # 26,692 26,845 25,750 26,016 26,000<br />
Orders Issued # 29,509 29,459 34,000 28,053 34,300<br />
Procurement Admini<strong>st</strong>rative Lead Time (PALT) # 4.85 3.04 2.00 4.49 2.00<br />
Requisitions Received # 32,581 32,909 38,600 31,578 38,900<br />
Supply Management<br />
The objective <<strong>st</strong>rong>of</<strong>st</strong>rong> Supply Management is to minimize inventory inve<strong>st</strong>ment and <strong>operating</strong> co<strong>st</strong> while maintaining an adequate supply to meet the<br />
needs <<strong>st</strong>rong>of</<strong>st</strong>rong> reque<strong>st</strong>ing departments.<br />
Inventory $ Value $ 1,740,530 1,703,787 1,800,000 1,400,000 1,400,000<br />
Inventory Accuracy % 94 99 98 98 98<br />
Inventory Line Items Issued # 33,243 33,923 35,000 33,324 35,800<br />
Inventory Line Items Received # 4,354 4,398 4,600 4,560 4600<br />
Inventory Turnover (x:1) Ratio 2.20 1.90 4.00 4.00 4.00<br />
Number <<strong>st</strong>rong>of</<strong>st</strong>rong> Line Items # 3,400 3367 3,400 3400 3,250<br />
Variance (+/-$500) Book Value to Inventory Counts $ -134,477 1,763 500 500 500<br />
264
Department Mission Statement<br />
City <<strong>st</strong>rong>of</<strong>st</strong>rong> St. Petersburg, Florida - FY 2012 Proposed Fiscal Plan<br />
Public Works Admini<strong>st</strong>ration Department<br />
The mission <<strong>st</strong>rong>of</<strong>st</strong>rong> the Public Works Admini<strong>st</strong>ration Department is to admini<strong>st</strong>er the responsible use <<strong>st</strong>rong>of</<strong>st</strong>rong> City resources; implement the Capital Improvement Program;<br />
maintain the City's infra<strong>st</strong>ructure; facilitate the maintenance, repair, and replacement <<strong>st</strong>rong>of</<strong>st</strong>rong> City vehicles; contribute to efficient solid wa<strong>st</strong>e operations; and maintain a<br />
quality water supply.<br />
Services Provided<br />
The Public Works Admini<strong>st</strong>ration Department provides the following services:<br />
• Admini<strong>st</strong>rative and support services for all <<strong>st</strong>rong>of</<strong>st</strong>rong> the programs in this department.<br />
• Advises on policy decisions affecting operations within this admini<strong>st</strong>ration.<br />
Budgetary Co<strong>st</strong> Summary<br />
FY 2009<br />
Actual<br />
FY 2010<br />
Actual<br />
FY 2011<br />
Adopted<br />
FY 2011<br />
Amended<br />
FY 2011<br />
E<strong>st</strong>imated<br />
FY 2012<br />
Proposed<br />
FY 2012<br />
Change<br />
Wages And Benefits 548,564 556,102 502,002 502,002 443,673 296,755 (40.89%)<br />
Services And Commodities 4,999,130 4,846,784 5,232,317 5,232,971 5,156,485 5,155,345 (1.47%)<br />
Total Budget 5,547,694 5,402,886 5,734,319 5,734,973 5,600,158 5,452,100 (4.92%)<br />
Appropriations By Fund/Program<br />
FY 2009<br />
Actual<br />
FY 2010<br />
Actual<br />
FY 2011<br />
Adopted<br />
FY 2011<br />
Amended<br />
FY 2011<br />
E<strong>st</strong>imated<br />
FY 2012<br />
Proposed<br />
FY 2012<br />
Change<br />
General Operating Fund<br />
Public Service Representatives Program<br />
Public Works Program<br />
393,242<br />
267,193<br />
383,012<br />
266,025<br />
345,764<br />
253,055<br />
345,764<br />
253,055<br />
297,505<br />
177,063<br />
189,644<br />
192,426<br />
(45.15%)<br />
(23.96%)<br />
Street Lighting & Lighting Maintenance<br />
Program<br />
4,887,259 4,753,849 5,135,500 5,136,154 5,125,590 5,070,030 (1.27%)<br />
Totals for General Operating Fund 5,547,694 5,402,886 5,734,319 5,734,973 5,600,158 5,452,100 (4.92%)<br />
Total Budget 5,547,694 5,402,886 5,734,319 5,734,973 5,600,158 5,452,100 (4.92%)<br />
Revenue Sources<br />
FY 2009<br />
Actual<br />
FY 2010<br />
Actual<br />
FY 2011<br />
Adopted<br />
FY 2011<br />
Amended<br />
FY 2011<br />
E<strong>st</strong>imated<br />
FY 2012<br />
Proposed<br />
FY 2012<br />
Change<br />
Misc Revenue 262,657 292 10,000 10,000 (25) 145,000 1350.00%<br />
General & Admini<strong>st</strong>rative 138,528 123,708 127,416 127,416 127,416 127,416 0.00%<br />
General Fund 5,146,509 5,278,886 5,596,903 5,597,557 5,472,767 5,179,684 (7.45%)<br />
Total Revenue 5,547,694 5,402,886 5,734,319 5,734,973 5,600,158 5,452,100 (4.92%)<br />
Position Summary<br />
FY 2009<br />
Actual<br />
FY 2010<br />
Actual<br />
FY 2011<br />
Adopted<br />
FY 2012<br />
Proposed<br />
FY 2012<br />
Change<br />
Public Works Program 2.00 2.00 2.00 1.00 (50.00%)<br />
Public Service Representatives Program 4.00 3.00 3.00 3.00 0.00%<br />
Total Full-Time FTE 6.00 5.00 5.00 4.00 (20.00%)<br />
Public Service Representatives Program 0.00 1.00 0.50 0.75 50.00%<br />
Total Part-Time FTE 0.00 1.00 0.50 0.75 50.00%<br />
265
City <<strong>st</strong>rong>of</<strong>st</strong>rong> St. Petersburg, Florida - FY 2012 Proposed Fiscal Plan<br />
Position Summary<br />
FY 2009<br />
Actual<br />
FY 2010<br />
Actual<br />
FY 2011<br />
Adopted<br />
FY 2012<br />
Proposed<br />
FY 2012<br />
Change<br />
Total FTE 6.00 6.00 5.50 4.75 (13.64%)<br />
- In FY12, the Public Works Admini<strong>st</strong>ration Department's <strong>budget</strong> will decrease by 4.92%.<br />
- The majority <<strong>st</strong>rong>of</<strong>st</strong>rong> this reduction is a result <<strong>st</strong>rong>of</<strong>st</strong>rong> a portion <<strong>st</strong>rong>of</<strong>st</strong>rong> the salary and benefits for the three Public Service Representatives being <<strong>st</strong>rong>of</<strong>st</strong>rong>fset by<br />
funding from the three major utilities (Water Resources, Stormwater, Pavement, & Traffic Operations, and Sanitation) for the utility cu<strong>st</strong>omer<br />
service support they give. This funding is accomplished through intergovernmental payments (burden payments) and amounts to $50,000 per<br />
utility for a total <<strong>st</strong>rong>of</<strong>st</strong>rong> $150,000 <<strong>st</strong>rong>of</<strong>st</strong>rong> General Fund savings.<br />
- The expense reduction also includes about $65,000 in savings in <strong>st</strong>reet lighting. These savings will not result in a service change, but are<br />
attributed to recent co<strong>st</strong> trends.<br />
- The Department is also reducing other various line items by about $40,000.<br />
- The <strong>budget</strong> also includes $135,000 <<strong>st</strong>rong>of</<strong>st</strong>rong> anticipated revenue for repair and maintenance <<strong>st</strong>rong>of</<strong>st</strong>rong> State-owned <strong>st</strong>reet lighting, which is reimbursed by<br />
the Florida Department <<strong>st</strong>rong>of</<strong>st</strong>rong> Transportation (FDOT).<br />
The Public Works Admini<strong>st</strong>ration Department's fir<strong>st</strong> performance measure addresses the Mayor's goals <<strong>st</strong>rong>of</<strong>st</strong>rong> Safety and Seamlessness and Service.<br />
While the second performance measure is linked to the Mayor's goal <<strong>st</strong>rong>of</<strong>st</strong>rong> safety.<br />
Objective and Performance Measure<br />
Unit Of<br />
Measure<br />
FY 2009<br />
Actual<br />
FY 2010<br />
Actual<br />
FY 2011<br />
Target<br />
FY2011<br />
E<strong>st</strong>imate<br />
FY 2012<br />
Proposed<br />
Public Service Representatives<br />
The objective <<strong>st</strong>rong>of</<strong>st</strong>rong> the Public Service Representatives Division is to help maintain the City's infra<strong>st</strong>ructure through the development <<strong>st</strong>rong>of</<strong>st</strong>rong> work orders<br />
based on receipt <<strong>st</strong>rong>of</<strong>st</strong>rong> citizen reports and <strong>st</strong>aff inspections.<br />
Infra<strong>st</strong>ructure Issues Reported # 13,584 12,960 13,500 13,500 13,500<br />
Street Lighting & Support<br />
The objective <<strong>st</strong>rong>of</<strong>st</strong>rong> the Street Lighting & Support Division is to provide <strong>st</strong>reet lighting to the citizens <<strong>st</strong>rong>of</<strong>st</strong>rong> St. Petersburg to ensure safety and security.<br />
Number <<strong>st</strong>rong>of</<strong>st</strong>rong> Leased Street Lights Reque<strong>st</strong>ed # 191 140 120 100 100<br />
Number <<strong>st</strong>rong>of</<strong>st</strong>rong> Street Lights Purchased # 25 24 20 20 20<br />
Street Light Expenses $ 4,673,823 4,731,292 5,135,500 5,019,000 5,204,400<br />
266
Department Mission Statement<br />
City <<strong>st</strong>rong>of</<strong>st</strong>rong> St. Petersburg, Florida - FY 2012 Proposed Fiscal Plan<br />
Sanitation Department<br />
The mission <<strong>st</strong>rong>of</<strong>st</strong>rong> the Sanitation Department is to collect solid wa<strong>st</strong>e within the City's boundaries and to ensure that it is disposed <<strong>st</strong>rong>of</<strong>st</strong>rong> in the mo<strong>st</strong> co<strong>st</strong> effective and<br />
efficient manner and to operate brush sites and rodent control programs. The Department's mission is also to process yard wa<strong>st</strong>e into mulch for farming and<br />
landscaping, deliver recyclables to recycling businesses and transport the remaining wa<strong>st</strong>e to the Pinellas County Recovery Plant where it is converted into<br />
electri<<strong>st</strong>rong>city</<strong>st</strong>rong>.<br />
Services Provided<br />
The Sanitation Department provides the following services:<br />
• Residential Services: provides for the collection <<strong>st</strong>rong>of</<strong>st</strong>rong> residential refuse.<br />
• Commercial Services: provides for the collection <<strong>st</strong>rong>of</<strong>st</strong>rong> commercial refuse.<br />
• Special Services: provides for sanitation services outside <<strong>st</strong>rong>of</<strong>st</strong>rong> the ordinary such as rodent control, special pick-up, Mr.Sparkle Program, brush sites, and mulch<br />
production from yard wa<strong>st</strong>e.<br />
• Maintenance: washes the fleet and delivers and maintains the refuse containers.<br />
• Admini<strong>st</strong>rative Services: provides for the management and supervision <<strong>st</strong>rong>of</<strong>st</strong>rong> the various operations.<br />
• Community Services: collects snipe signs, removes graffiti and clears overgrown lots. Sanitation fees also pay for the Codes demolition and NTeam<br />
programs.<br />
Budgetary Co<strong>st</strong> Summary<br />
FY 2009<br />
Actual<br />
FY 2010<br />
Actual<br />
FY 2011<br />
Adopted<br />
FY 2011<br />
Amended<br />
FY 2011<br />
E<strong>st</strong>imated<br />
FY 2012<br />
Proposed<br />
FY 2012<br />
Change<br />
Wages And Benefits 12,264,466 12,468,526 12,802,317 12,802,317 11,240,341 12,881,321 0.62%<br />
Services And Commodities 22,857,025 22,766,934 22,451,449 22,522,422 24,004,924 22,666,005 0.96%<br />
Capital 1,479,890 3,373,783 771,052 2,691,214 2,462,421 1,744,000 126.18%<br />
Transfers Out 3,455,076 2,455,080 2,455,076 2,455,076 2,455,076 2,455,076 0.00%<br />
Total Budget 40,056,457 41,064,324 38,479,894 40,471,029 40,162,762 39,746,402 3.29%<br />
Appropriations By Fund/Program<br />
FY 2009<br />
Actual<br />
FY 2010<br />
Actual<br />
FY 2011<br />
Adopted<br />
FY 2011<br />
Amended<br />
FY 2011<br />
E<strong>st</strong>imated<br />
FY 2012<br />
Proposed<br />
FY 2012<br />
Change<br />
General Operating Fund<br />
Finance Admini<strong>st</strong>ration Program 0 1,611 0 0 0 0 0.00%<br />
Non-Department Program 725 13,441 0 0 0 0 0.00%<br />
Public Works Program 0 626 0 0 0 0 0.00%<br />
Recreation Admini<strong>st</strong>ration Program 0 20,504 0 0 0 0 0.00%<br />
SW, Pavement & Traffic Ops Admin<br />
0 109 0 0 0 0 0.00%<br />
Program<br />
Totals for General Operating Fund 725 36,291 0 0 0 0 0.00%<br />
Neighborhood Stabilization Program<br />
Housing Tru<strong>st</strong> Funds Program 0 136 0 0 0 0 0.00%<br />
Sanitation Operating<br />
Community Appearance Program 615,336 767,295 521,230 523,550 367,680 554,038 6.29%<br />
Sanitation Admini<strong>st</strong>ration Program 37,909,892 36,894,269 37,179,116 37,247,770 37,102,472 36,947,842 (0.62%)<br />
Sanitation Maintenance Shop Program 64,276 527 6,796 6,826 0 522 (92.32%)<br />
Totals for Sanitation Operating 38,589,504 37,662,092 37,707,142 37,778,145 37,470,152 37,502,402 (0.54%)<br />
Sanitation Equipment Replacement<br />
Non-Department Program 0 6,634 0 0 40,497 0 0.00%<br />
Sanitation Equipment Replacement<br />
Program<br />
1,466,228 3,359,171 772,752 2,692,884 2,652,113 2,244,000 190.39%<br />
Totals for Sanitation Equipment<br />
Replacement<br />
1,466,228 3,365,804 772,752 2,692,884 2,692,610 2,244,000 190.39%<br />
267
Appropriations By Fund/Program<br />
City <<strong>st</strong>rong>of</<strong>st</strong>rong> St. Petersburg, Florida - FY 2012 Proposed Fiscal Plan<br />
FY 2009<br />
Actual<br />
FY 2010<br />
Actual<br />
FY 2011<br />
Adopted<br />
FY 2011<br />
Amended<br />
FY 2011<br />
E<strong>st</strong>imated<br />
FY 2012<br />
Proposed<br />
FY 2012<br />
Change<br />
Total Budget 40,056,457 41,064,324 38,479,894 40,471,029 40,162,762 39,746,402 3.29%<br />
Revenue Sources<br />
FY 2009<br />
Actual<br />
FY 2010<br />
Actual<br />
FY 2011<br />
Adopted<br />
FY 2011<br />
Amended<br />
FY 2011<br />
E<strong>st</strong>imated<br />
FY 2012<br />
Proposed<br />
FY 2012<br />
Change<br />
Federal Grants 14,777 0 0 0 0 0 0.00%<br />
State Grants 2,266 0 0 0 0 0 0.00%<br />
Grants From Other Local Units 190,686 189,581 190,398 190,398 0 190,398 0.00%<br />
Physical Environment Charges 40,025,836 39,791,955 39,691,000 39,691,000 40,240,323 39,406,000 (0.72%)<br />
Other Charges For Services 1,625 511 0 0 0 0 0.00%<br />
Intere<strong>st</strong> Earnings 478,933 359,887 333,000 333,000 59,029 132,268 (60.28%)<br />
Special Assessment 242,204 174,032 0 0 0 0 0.00%<br />
Sale Of Fixed Assets 235,205 17,546 108,000 108,000 147,861 108,000 0.00%<br />
Sale Of Surplus Material 26,776 217,293 304,000 304,000 130,503 304,000 0.00%<br />
Misc Revenue 36,918 (8,216) 3,000 3,000 (27,716) 3,000 0.00%<br />
Transfer From Sanitation Operating 3,000,000 2,000,004 2,000,000 2,000,000 2,000,000 2,000,000 0.00%<br />
Sanitation Operating (2,584,189) (2,959,918) (2,847,256) (2,776,253) (3,081,603) (2,611,474) (8.28%)<br />
General Fund 725 5,436 0 0 0 0 0.00%<br />
Sanitation Equipment Replacement (1,615,304) 1,276,075 (1,302,248) 617,884 694,365 214,210 (116.45%)<br />
Neighborhood Stabilization<br />
Program<br />
0 136 0 0 0 0 0.00%<br />
Total Revenue 40,056,457 41,064,324 38,479,894 40,471,029 40,162,762 39,746,402 3.29%<br />
Position Summary<br />
FY 2009<br />
Actual<br />
FY 2010<br />
Actual<br />
FY 2011<br />
Adopted<br />
FY 2012<br />
Proposed<br />
FY 2012<br />
Change<br />
Sanitation Admini<strong>st</strong>ration Program 167.00 168.16 168.16 168.16 0.00%<br />
Community Appearance Program 8.00 8.00 4.00 4.00 0.00%<br />
Sanitation Maintenance Shop Program 1.00 0.00 0.00 0.00 0.00%<br />
Total Full-Time FTE 176.00 176.16 172.16 172.16 0.00%<br />
Sanitation Admini<strong>st</strong>ration Program 2.00 5.00 3.50 4.60 31.43%<br />
Sanitation Maintenance Shop Program 0.50 0.00 0.00 0.00 0.00%<br />
Total Part-Time FTE 2.50 5.00 3.50 4.60 31.43%<br />
Total FTE 178.50 181.16 175.66 176.76 0.63%<br />
- In FY12, Sanitation's <strong>operating</strong> expenses increased by 3.29%.<br />
- The Department adju<strong>st</strong>ed appropriations in the Operating Fund to reflect updates to intergovernmental funding agreements including the<br />
addition <<strong>st</strong>rong>of</<strong>st</strong>rong> $50,000 <<strong>st</strong>rong>of</<strong>st</strong>rong> support for the Public Service Representatives in the Public Works Admini<strong>st</strong>ration.<br />
- The Department is <strong>budget</strong>ing about $2.2 million for planned equipment replacements, which includes, but is not limited to, the purchases <<strong>st</strong>rong>of</<strong>st</strong>rong><br />
four residential side loaders, three roll-<<strong>st</strong>rong>of</<strong>st</strong>rong>f trucks, as well as container replacements.<br />
The Sanitation Department's fir<strong>st</strong> performance measure addresses the Mayor's goal <<strong>st</strong>rong>of</<strong>st</strong>rong> Safety. The next two performance measures are linked to<br />
the Mayor's goal <<strong>st</strong>rong>of</<strong>st</strong>rong> Service. The fourth performance measure addresses the Mayor's goal <<strong>st</strong>rong>of</<strong>st</strong>rong> Seamlessness. While the la<strong>st</strong> two performance<br />
measures are linked to the Mayor's goal <<strong>st</strong>rong>of</<strong>st</strong>rong> Service.<br />
Objective and Performance Measure<br />
Unit Of<br />
Measure<br />
FY 2009<br />
Actual<br />
FY 2010<br />
Actual<br />
FY 2011<br />
Target<br />
FY2011<br />
E<strong>st</strong>imate<br />
FY 2012<br />
Proposed<br />
Accidents per 100,000 miles<br />
An objective <<strong>st</strong>rong>of</<strong>st</strong>rong> Sanitation is to minimize the number <<strong>st</strong>rong>of</<strong>st</strong>rong> vehicular accidents.<br />
268
Objective and Performance Measure<br />
City <<strong>st</strong>rong>of</<strong>st</strong>rong> St. Petersburg, Florida - FY 2012 Proposed Fiscal Plan<br />
Unit Of<br />
Measure<br />
FY 2009<br />
Actual<br />
FY 2010<br />
Actual<br />
FY 2011<br />
Target<br />
FY2011<br />
E<strong>st</strong>imate<br />
FY 2012<br />
Proposed<br />
Vehicular accidents per 100,000 miles # 3.0 3.0 3.0 3.0 3.0<br />
Commercial Productivity<br />
An objective <<strong>st</strong>rong>of</<strong>st</strong>rong> Sanitation is to optimize the tons <<strong>st</strong>rong>of</<strong>st</strong>rong> solid wa<strong>st</strong>e collected per man day.<br />
Commercial productivity - tons collected/man day # 14 14 14 13 13<br />
Commercial average route completion time<br />
An objective <<strong>st</strong>rong>of</<strong>st</strong>rong> Sanitation is to optimize the completion times <<strong>st</strong>rong>of</<strong>st</strong>rong> the commercial routes.<br />
Commercial average route completion time Hrs. 8.3 7.8 8.0 8.0 8.0<br />
Midtown illegal dumping<br />
An objective <<strong>st</strong>rong>of</<strong>st</strong>rong> Sanitation is to reduce the amount <<strong>st</strong>rong>of</<strong>st</strong>rong> illegal dumping and to make the <<strong>st</strong>rong>city</<strong>st</strong>rong> seamless.<br />
Midtown illegal dumping - illegal dumping on City<br />
property<br />
# 11 11 9 9 9<br />
Residential Productivity<br />
An objective <<strong>st</strong>rong>of</<strong>st</strong>rong> Sanitation is to optimize the number <<strong>st</strong>rong>of</<strong>st</strong>rong> tons <<strong>st</strong>rong>of</<strong>st</strong>rong> residential solid wa<strong>st</strong>e collected per man day.<br />
Residential productivity - tons collected/man day # 18 18 18 17 18<br />
Residential collection co<strong>st</strong> per ton<br />
An objective <<strong>st</strong>rong>of</<strong>st</strong>rong> Sanitation is to control the average co<strong>st</strong> to collect residential garbage.<br />
Residential collection co<strong>st</strong> per ton $ 54.16 55.86 58.00 62.00 62.00<br />
269
Department Mission Statement<br />
City <<strong>st</strong>rong>of</<strong>st</strong>rong> St. Petersburg, Florida - FY 2012 Proposed Fiscal Plan<br />
Stormwater, Pavement & Traffic Operations Department<br />
The mission <<strong>st</strong>rong>of</<strong>st</strong>rong> the Stormwater, Pavement & Traffic Operations Department is to provide superlative service to citizens in the operations, repair, and maintenance<br />
<<strong>st</strong>rong>of</<strong>st</strong>rong> the City's drainage, sidewalks, roadways, and traffic signal sy<strong>st</strong>em.<br />
Services Provided<br />
The Stormwater, Pavement & Traffic Operations Department provides the following services:<br />
• Street sign in<strong>st</strong>allation and maintenance.<br />
• Pavement marking.<br />
• Traffic signal in<strong>st</strong>allation and maintenance.<br />
• Admini<strong>st</strong>ration/Support services.<br />
• Pavement maintenance.<br />
• Stormwater collection and marine facilities infra<strong>st</strong>ructure maintenance.<br />
• Streets sweeping and slope mowing.<br />
Budgetary Co<strong>st</strong> Summary<br />
FY 2009<br />
Actual<br />
FY 2010<br />
Actual<br />
FY 2011<br />
Adopted<br />
FY 2011<br />
Amended<br />
FY 2011<br />
E<strong>st</strong>imated<br />
FY 2012<br />
Proposed<br />
FY 2012<br />
Change<br />
Wages And Benefits 6,129,564 6,185,529 5,791,798 5,743,378 6,502,272 5,881,002 1.54%<br />
Services And Commodities 6,258,149 6,045,053 6,132,404 6,265,116 6,092,247 6,241,294 1.78%<br />
Capital 2,698 30,423 0 29,080 10,243 0 0.00%<br />
Transfers Out 1,850,004 2,850,000 1,853,000 1,853,000 1,853,000 1,858,000 0.27%<br />
Total Budget 14,240,414 15,111,005 13,777,202 13,890,574 14,457,762 13,980,296 1.47%<br />
Appropriations By Fund/Program<br />
FY 2009<br />
Actual<br />
FY 2010<br />
Actual<br />
FY 2011<br />
Adopted<br />
FY 2011<br />
Amended<br />
FY 2011<br />
E<strong>st</strong>imated<br />
FY 2012<br />
Proposed<br />
FY 2012<br />
Change<br />
General Operating Fund<br />
Non-Department Program 0 1,872 0 0 16,527 0 0.00%<br />
Pavement Maintenance Program 1,287,222 1,049,824 1,181,355 1,220,987 1,601,817 1,165,446 (1.35%)<br />
Pavement Marking Program 264,689 275,894 349,464 355,356 286,712 335,492 (4.00%)<br />
SW, Pavement & Traffic Ops Admin<br />
283,051 196,616 182,946 186,354 124,211 185,706 1.51%<br />
Program<br />
Sign In<strong>st</strong>allation & Maintenance Program 498,713 413,858 441,541 442,897 343,616 352,998 (20.05%)<br />
Traffic Signals Program 1,445,154 1,501,373 1,435,840 1,447,069 962,113 1,454,753 1.32%<br />
Totals for General Operating Fund 3,778,829 3,439,436 3,591,146 3,652,664 3,334,996 3,494,395 (2.69%)<br />
American Recovery & Reinve<strong>st</strong>ment Act<br />
Non-Department Program 0 250 0 0 0 0 0.00%<br />
Neighborhood Stabilization Program<br />
Housing Tru<strong>st</strong> Funds Program 415 7,736 0 0 63 0 0.00%<br />
Water Resources<br />
Admini<strong>st</strong>rative Support Services<br />
Non-Department Program<br />
(587)<br />
0<br />
2,980<br />
388<br />
0<br />
0<br />
0<br />
0<br />
0<br />
243<br />
0<br />
0<br />
0.00%<br />
0.00%<br />
Potable & Reclaimed Water Di<strong>st</strong>ribution<br />
Sy<strong>st</strong>ems<br />
1,145 (35) 0 0 (82) 0 0.00%<br />
Totals for Water Resources 558 3,334 0 0 161 0 0.00%<br />
Stormwater Utility Operating<br />
Non-Department Program 0 24 0 0 0 0 0.00%<br />
SW Utility Collection & Marine Infra<strong>st</strong>r<br />
Program<br />
8,110,773 9,303,121 7,770,700 7,822,554 9,384,031 7,937,788 2.15%<br />
Streets Sweeping & Slope Mowing<br />
Program<br />
2,349,838 2,357,104 2,415,356 2,415,356 1,738,511 2,548,113 5.50%<br />
270
Appropriations By Fund/Program<br />
City <<strong>st</strong>rong>of</<strong>st</strong>rong> St. Petersburg, Florida - FY 2012 Proposed Fiscal Plan<br />
FY 2009<br />
Actual<br />
FY 2010<br />
Actual<br />
FY 2011<br />
Adopted<br />
FY 2011<br />
Amended<br />
FY 2011<br />
E<strong>st</strong>imated<br />
FY 2012<br />
Proposed<br />
FY 2012<br />
Change<br />
Totals for Stormwater Utility Operating 10,460,611 11,660,249 10,186,056 10,237,910 11,122,542 10,485,901 2.94%<br />
Total Budget 14,240,414 15,111,005 13,777,202 13,890,574 14,457,762 13,980,296 1.47%<br />
Revenue Sources<br />
FY 2009<br />
Actual<br />
FY 2010<br />
Actual<br />
FY 2011<br />
Adopted<br />
FY 2011<br />
Amended<br />
FY 2011<br />
E<strong>st</strong>imated<br />
FY 2012<br />
Proposed<br />
FY 2012<br />
Change<br />
Federal Grants 45,363 0 0 0 0 0 0.00%<br />
State Grants 6,957 0 0 0 0 0 0.00%<br />
State Shared Revenue 198,700 203,650 218,325 218,325 49,255 218,325 0.00%<br />
Physical Environment Charges 11,783,898 11,828,564 11,769,885 11,769,885 12,122,023 11,769,885 0.00%<br />
Transportation Charges (663) 0 0 0 0 0 0.00%<br />
Other Charges For Services 411,226 646,742 303,000 303,000 184,074 303,000 0.00%<br />
Intere<strong>st</strong> Earnings 3,841 1,638 60,000 60,000 14 23,832 (60.28%)<br />
Sale Of Fixed Assets 48,013 57,922 12,000 12,000 22,188 12,000 0.00%<br />
Sale Of Surplus Material 7,641 21,173 0 0 4,539 0 0.00%<br />
Contributions And Donations 617,691 0 0 0 0 0 0.00%<br />
Misc Revenue (30,974) (27,302) (51,000) (51,000) (16,133) (51,000) 0.00%<br />
General Fund 2,790,864 3,040,938 3,364,821 3,426,339 3,278,436 3,268,070 (2.88%)<br />
Stormwater Utility Operating (1,643,117) (648,632) (1,899,829) (1,847,975) (1,186,858) (1,563,816) (17.69%)<br />
Water Resources 558 (21,674) 0 0 161 0 0.00%<br />
American Recovery & Reinve<strong>st</strong>ment<br />
Act<br />
0 250 0 0 0 0 0.00%<br />
Neighborhood Stabilization<br />
Program<br />
415 7,736 0 0 63 0 0.00%<br />
Total Revenue 14,240,414 15,111,005 13,777,202 13,890,574 14,457,762 13,980,296 1.47%<br />
Position Summary<br />
FY 2009<br />
Actual<br />
FY 2010<br />
Actual<br />
FY 2011<br />
Adopted<br />
FY 2012<br />
Proposed<br />
FY 2012<br />
Change<br />
Sign In<strong>st</strong>allation & Maintenance Program 6.00 5.00 5.00 4.00 (20.00%)<br />
Pavement Marking Program 4.00 3.00 4.00 4.00 0.00%<br />
Traffic Signals Program 10.00 11.00 11.00 11.00 0.00%<br />
SW, Pavement & Traffic Ops Admin Program 2.00 2.00 2.00 2.00 0.00%<br />
Pavement Maintenance Program 33.00 32.00 32.00 31.00 (3.12%)<br />
SW Utility Collection & Marine Infra<strong>st</strong>r Program 44.00 39.00 42.00 42.00 0.00%<br />
Streets Sweeping & Slope Mowing Program 20.00 22.00 21.00 21.00 0.00%<br />
Total Full-Time FTE 119.00 114.00 117.00 115.00 (1.71%)<br />
Pavement Maintenance Program 2.00 2.00 2.00 3.20 60.00%<br />
Streets Sweeping & Slope Mowing Program 0.50 0.00 0.00 0.00 0.00%<br />
Total Part-Time FTE 2.50 2.00 2.00 3.20 60.00%<br />
Total FTE 121.50 116.00 119.00 118.20 (0.67%)<br />
- In FY12, the Stormwater, Pavement & Traffic Operations Department's (SPTO) <strong>budget</strong> will decreased by 2.69% in the General Fund (GF) and<br />
increased by 2.94% in the Stormwater Utility Operating Fund.<br />
- The Department's GF <strong>budget</strong> will be reduced by $300,000 as a result <<strong>st</strong>rong>of</<strong>st</strong>rong> anticipated equipment usage, which is charged when other departments<br />
or <strong>capital</strong> projects make use <<strong>st</strong>rong>of</<strong>st</strong>rong> the SPTO's equipment. These charges are <strong>st</strong>andardized <<strong>st</strong>rong>city</<strong>st</strong>rong>wide to correspond to FEMA rates.<br />
- The Department also eliminated a full-time Sign Shop Supervisor position and a full-time Laborer position reducing the GF <strong>budget</strong> by<br />
$108,119 and made other line item reductions in its GF <strong>budget</strong> totaling approximately $34,000. These other reductions include decreased<br />
vehicle and equipment rental co<strong>st</strong>s and other reductions.<br />
271
City <<strong>st</strong>rong>of</<strong>st</strong>rong> St. Petersburg, Florida - FY 2012 Proposed Fiscal Plan<br />
- The FY12 GF <strong>budget</strong> reductions are somewhat <<strong>st</strong>rong>of</<strong>st</strong>rong>fset by the elimination <<strong>st</strong>rong>of</<strong>st</strong>rong> planned salary savings in the SPTO's <strong>budget</strong>. Anticipated salary<br />
savings will now be tracked <<strong>st</strong>rong>city</<strong>st</strong>rong>wide and will not appear in individual department <strong>budget</strong>s.<br />
- The Department adju<strong>st</strong>ed appropriations in the Stormwater Utility Operating Fund to reflect updates to intergovernmental funding agreements<br />
including the addition <<strong>st</strong>rong>of</<strong>st</strong>rong> $50,000 <<strong>st</strong>rong>of</<strong>st</strong>rong> support for the Public Service Representatives in the Public Works Admini<strong>st</strong>ration.<br />
All seven <<strong>st</strong>rong>of</<strong>st</strong>rong> the Stormwater, Pavement & Traffic Operations Department's performance measures address the Mayor's goal <<strong>st</strong>rong>of</<strong>st</strong>rong> Safety. The<br />
second and third performance measures are also linked to the Mayor's goal <<strong>st</strong>rong>of</<strong>st</strong>rong> Seamlessness.<br />
Objective and Performance Measure<br />
Unit Of<br />
Measure<br />
FY 2009<br />
Actual<br />
FY 2010<br />
Actual<br />
FY 2011<br />
Target<br />
FY2011<br />
E<strong>st</strong>imate<br />
FY 2012<br />
Proposed<br />
Compliance with NPDES Permit<br />
An objective <<strong>st</strong>rong>of</<strong>st</strong>rong> the Stormwater, Pavement & Traffic Operations Department is to comply with our National Pollutant Discharge Elimination<br />
Sy<strong>st</strong>em (NPDES) permit.<br />
Control Aquatic Weed Growth Acres 1,050 1,050 1,050 1,050 1,050<br />
Growth, Debris & Sediment Control Miles 125 125 125 125 125<br />
Line Cleaning - Stormwater Infra<strong>st</strong>ructure Miles 142 142 142 142 142<br />
Roadway Miles Swept - Stormwater Miles 22,428 37,380 37,380 37,380 37,380<br />
Seawalls & Culverts Maintenance Miles 197 197 197 197 197<br />
Shallow Infra<strong>st</strong>ructure Failures-Stormwater Feet 1,535 1,535 1,535 1,535 1,535<br />
Stormwater Infra<strong>st</strong>ructure Replaced Feet 1,535 1,535 1,535 1,535 1,535<br />
FDOT Roadway Sweeping<br />
The objective <<strong>st</strong>rong>of</<strong>st</strong>rong> the FDOT Sweeping Division is to reduce the amount <<strong>st</strong>rong>of</<strong>st</strong>rong> contaminates that enter the Stormwater removal sy<strong>st</strong>em and to maintain<br />
the ae<strong>st</strong>hetics <<strong>st</strong>rong>of</<strong>st</strong>rong> the roadways.<br />
Roadway Miles Swept - Stormwater Miles 14,952 14,952 14,952 14,952 14,952<br />
Mowing Maintenance<br />
The objective <<strong>st</strong>rong>of</<strong>st</strong>rong> the Mowing Operations Division is to maintain ditch banks, lake perimeters, and slopes to improve hydraulic performance as well<br />
as reduce erosion and potential health hazards in order to comply with our NPDES permit.<br />
Erosion Control <<strong>st</strong>rong>of</<strong>st</strong>rong> Lakes & Slopes Miles 1,136 1,136 1,136 1,136 1,136<br />
Pavement Maintenance<br />
The objective <<strong>st</strong>rong>of</<strong>st</strong>rong> the Traffic Support Division is to maintain the City’s paved and unpaved <strong>st</strong>reets and alleys in a condition conducive to safe<br />
drivability and proper drainage flow.<br />
Pavement Repair Backlog Locations 6 6 6 6 6<br />
Pavement Repair Response Time Days 5 5 5 5 5<br />
Sidewalk Repair Backlog Miles 2 2 2 2 2<br />
Sidewalk Repair Response Time Month 2 2 2 2 2<br />
Pavement Marking<br />
The objective <<strong>st</strong>rong>of</<strong>st</strong>rong> the Traffic Marking Division is to provide a properly marked pavement sy<strong>st</strong>em for the safe and efficient flow <<strong>st</strong>rong>of</<strong>st</strong>rong> traffic.<br />
Lines In Thermopla<strong>st</strong>ic Feet 140,000 140,000 140,000 140,000 140,000<br />
Lines Painted Feet 140,000 140,000 140,000 140,000 140,000<br />
Number <<strong>st</strong>rong>of</<strong>st</strong>rong> Symbols # 3,500 3,500 3,500 3,500 3,500<br />
Sign Fabrication, In<strong>st</strong>allation, and Maintenance<br />
The objective <<strong>st</strong>rong>of</<strong>st</strong>rong> the Traffic Sign Fabrication and Traffic Sign In<strong>st</strong>allation Divisions is to inform motori<strong>st</strong>s and pede<strong>st</strong>rians <<strong>st</strong>rong>of</<strong>st</strong>rong> traffic regulations or<br />
information by sign in<strong>st</strong>allation and maintenance.<br />
272
Objective and Performance Measure<br />
City <<strong>st</strong>rong>of</<strong>st</strong>rong> St. Petersburg, Florida - FY 2012 Proposed Fiscal Plan<br />
Unit Of<br />
Measure<br />
FY 2009<br />
Actual<br />
FY 2010<br />
Actual<br />
FY 2011<br />
Target<br />
FY2011<br />
E<strong>st</strong>imate<br />
FY 2012<br />
Proposed<br />
Damaged Signs Replaced # 899 825 1,293 900 900<br />
Signs Fabricated # 15,989 7,682 17,627 8,450 8,450<br />
Signs In<strong>st</strong>alled/Replaced # 4,567 7,627 6,576 8,450 8,450<br />
Traffic Signals<br />
The objective <<strong>st</strong>rong>of</<strong>st</strong>rong> the Traffic Signals Division is to promote public safety through the in<strong>st</strong>allation and maintenance <<strong>st</strong>rong>of</<strong>st</strong>rong> a traffic signal sy<strong>st</strong>em.<br />
Number <<strong>st</strong>rong>of</<strong>st</strong>rong> Calls for Service # 1,100 894 1,100 1,100 1,100<br />
Number <<strong>st</strong>rong>of</<strong>st</strong>rong> Signals Maintained # 300 304 300 304 304<br />
Traffic Signal Calls Responded to in 30 Minutes # 1,000 894 1,012 1,000 1,000<br />
Work Order, En-Route & Trouble Calls # 4,000 3,492 4,000 4,000 4,000<br />
273
Department Mission Statement<br />
City <<strong>st</strong>rong>of</<strong>st</strong>rong> St. Petersburg, Florida<br />
2012 thru 2016 Capital Improvement Plan<br />
Water Resources Department<br />
The mission <<strong>st</strong>rong>of</<strong>st</strong>rong> the Water Resources Department is to effectively and efficiently manage the water resources for the benefit <<strong>st</strong>rong>of</<strong>st</strong>rong> the public pursuant to applicable public<br />
health and environmental regulations.<br />
Services Provided<br />
The Water Resources Department provides the following services:<br />
• Potable water treatment and delivery; wa<strong>st</strong>ewater collection, treatment, and disposal; and reclaimed water delivery for irrigation purposes.<br />
• Raw water is purchased from Tampa Bay Water and delivered to the City's Cosme Water Treatment and Di<strong>st</strong>ribution Plant. It is then pumped via two 26-mile<br />
pipelines to St. Petersburg, Gulfport, South Pasadena, and Lealman residents.<br />
• Wa<strong>st</strong>ewater is collected through a network <<strong>st</strong>rong>of</<strong>st</strong>rong> sanitary sewers and delivered to one <<strong>st</strong>rong>of</<strong>st</strong>rong> four treatment plants for treatment, disposal, and reclaimed water (effluent)<br />
production, which is the final product <<strong>st</strong>rong>of</<strong>st</strong>rong> the wa<strong>st</strong>ewater treatment process.<br />
Budgetary Co<strong>st</strong> Summary<br />
FY 2009<br />
Actual<br />
FY 2010<br />
Actual<br />
FY 2011<br />
Adopted<br />
FY 2011<br />
Amended<br />
FY 2011<br />
E<strong>st</strong>imated<br />
FY 2012<br />
Proposed<br />
FY 2012<br />
Change<br />
Wages And Benefits 21,749,257 21,920,163 22,183,375 22,219,526 21,385,640 22,328,835 0.66%<br />
Services And Commodities 59,036,214 59,615,997 59,820,844 60,522,714 60,538,737 60,137,380 0.53%<br />
Capital 151,329 145,402 287,925 304,602 274,102 244,424 (15.11%)<br />
Transfers Out 16,650,996 17,928,996 17,923,400 17,923,400 17,923,400 20,130,250 12.31%<br />
Total Budget 97,587,796 99,610,559 100,215,544 100,970,242 100,121,879 102,840,889 2.62%<br />
Appropriations By Fund/Program<br />
FY 2009<br />
Actual<br />
FY 2010<br />
Actual<br />
FY 2011<br />
Adopted<br />
FY 2011<br />
Amended<br />
FY 2011<br />
E<strong>st</strong>imated<br />
FY 2012<br />
Proposed<br />
FY 2012<br />
Change<br />
General Operating Fund<br />
Finance Admini<strong>st</strong>ration Program (1,539) 1,347 0 0 0 0 0.00%<br />
American Recovery & Reinve<strong>st</strong>ment Act<br />
Non-Department Program 0 2,823 0 0 0 0 0.00%<br />
Water Resources<br />
Admini<strong>st</strong>rative Support Services 40,014,778 41,224,810 42,349,351 42,643,631 40,732,424 44,097,841 4.13%<br />
Potable & Reclaimed Water Di<strong>st</strong>ribution<br />
5,272,501 5,088,473 5,157,151 5,157,878 5,985,936 5,425,508 5.20%<br />
Sy<strong>st</strong>ems<br />
Wa<strong>st</strong>ewater Collection Sy<strong>st</strong>em 6,962,973 6,650,823 6,188,207 6,331,743 5,581,319 6,459,434 4.38%<br />
Wa<strong>st</strong>ewater Treatment & Reclamation 16,957,626 16,906,135 16,505,725 16,800,671 12,979,014 16,299,394 (1.25%)<br />
Water Treatment & Di<strong>st</strong>ribution 28,381,373 29,736,147 30,015,110 30,036,320 34,843,186 30,558,712 1.81%<br />
Totals for Water Resources 97,589,250 99,606,389 100,215,544 100,970,242 100,121,879 102,840,889 2.62%<br />
Stormwater Utility Operating<br />
SW Utility Collection & Marine Infra<strong>st</strong>r<br />
Program<br />
84 0 0 0 0 0 0.00%<br />
Total Budget 97,587,796 99,610,559 100,215,544 100,970,242 100,121,879 102,840,889 2.62%<br />
Revenue Sources<br />
FY 2009<br />
Actual<br />
FY 2010<br />
Actual<br />
FY 2011<br />
Adopted<br />
FY 2011<br />
Amended<br />
FY 2011<br />
E<strong>st</strong>imated<br />
FY 2012<br />
Proposed<br />
FY 2012<br />
Change<br />
Grants From Other Local Units 126,667 72,513 120,000 353,043 17,109 100,000 (16.67%)<br />
General Government 0 0 0 0 409 0 0.00%<br />
Physical Environment Charges 90,337,933 90,827,677 95,300,483 95,300,483 94,947,314 101,114,200 6.10%<br />
Other Charges For Services 0 6,300 0 0 0 0 0.00%<br />
Intere<strong>st</strong> Earnings 149,880 259,611 432,450 432,450 2,594 100,000 (76.88%)<br />
Rents And Royalties 24,512 13,244 15,000 15,000 5,520 15,000 0.00%<br />
274
City <<strong>st</strong>rong>of</<strong>st</strong>rong> St. Petersburg, Florida<br />
2012 thru 2016 Capital Improvement Plan<br />
Revenue Sources<br />
FY 2009<br />
Actual<br />
FY 2010<br />
Actual<br />
FY 2011<br />
Adopted<br />
FY 2011<br />
Amended<br />
FY 2011<br />
E<strong>st</strong>imated<br />
FY 2012<br />
Proposed<br />
FY 2012<br />
Change<br />
Sale Of Fixed Assets 76,849 90,347 80,000 80,000 19,139 60,000 (25.00%)<br />
Sale Of Surplus Material 138,657 66,979 100,000 100,000 21,435 50,000 (50.00%)<br />
Contributions And Donations 250,000 0 0 0 0 0 0.00%<br />
Misc Revenue (252,975) (267,035) (255,000) (255,000) (76,833) (250,000) (1.96%)<br />
Transfer From Water Co<strong>st</strong> Stabilization 5,767,058 2,994,316 3,000,000 3,000,000 1,493,971 1,500,000 (50.00%)<br />
Water Resources 966,014 5,542,206 1,422,611 1,944,266 3,691,177 151,689 (89.34%)<br />
Utility Tax Revenue 123 230 0 0 0 0 0.00%<br />
Stormwater Utility Operating 84 0 0 0 0 0 0.00%<br />
General Fund (1,539) 1,347 0 0 0 0 0.00%<br />
Billing & Collections 4,532 0 0 0 0 0 0.00%<br />
General Liabilities Claims 0 0 0 0 44 0 0.00%<br />
American Recovery & Reinve<strong>st</strong>ment<br />
Act<br />
0 2,823 0 0 0 0 0.00%<br />
Total Revenue 97,587,796 99,610,559 100,215,544 100,970,242 100,121,879 102,840,889 2.62%<br />
Position Summary<br />
FY 2009<br />
Actual<br />
FY 2010<br />
Actual<br />
FY 2011<br />
Adopted<br />
FY 2012<br />
Proposed<br />
FY 2012<br />
Change<br />
Water Treatment & Di<strong>st</strong>ribution 37.00 35.00 35.00 35.00 0.00%<br />
Wa<strong>st</strong>ewater Treatment & Reclamation 86.00 85.00 85.00 85.00 0.00%<br />
Wa<strong>st</strong>ewater Collection Sy<strong>st</strong>em 51.00 50.00 52.00 52.00 0.00%<br />
Potable & Reclaimed Water Di<strong>st</strong>ribution Sy<strong>st</strong>ems 88.00 83.00 85.00 85.00 0.00%<br />
Admini<strong>st</strong>rative Support Services 72.00 68.00 66.00 66.00 0.00%<br />
Total Full-Time FTE 334.00 321.00 323.00 323.00 0.00%<br />
Admini<strong>st</strong>rative Support Services 2.75 2.00 1.50 1.40 (6.67%)<br />
Total Part-Time FTE 2.75 2.00 1.50 1.40 (6.67%)<br />
Total FTE 336.75 323.00 324.50 324.40 (0.03%)<br />
- Overall expenses are projected to increase by 2.62% from the FY11 Adopted Budget. Several <<strong>st</strong>rong>of</<strong>st</strong>rong>fsetting factors contribute to this increase.<br />
- The Water Resources Department used the FY12 <strong>budget</strong> process to reallocate exi<strong>st</strong>ing funding within its <strong>budget</strong> line items resulting in a reduction<br />
<<strong>st</strong>rong>of</<strong>st</strong>rong> about $467,000. This net reduction includes reductions in electri<<strong>st</strong>rong>city</<strong>st</strong>rong> and engineering services as well as the addition <<strong>st</strong>rong>of</<strong>st</strong>rong> $50,000 <<strong>st</strong>rong>of</<strong>st</strong>rong> support for<br />
the Public Service Representatives in the Public Works Admini<strong>st</strong>ration.<br />
- This reduction is <<strong>st</strong>rong>of</<strong>st</strong>rong>fset by $2.2 million <<strong>st</strong>rong>of</<strong>st</strong>rong> increased debt service as a result <<strong>st</strong>rong>of</<strong>st</strong>rong> the new debt issued in FY11 and the recalculation <<strong>st</strong>rong>of</<strong>st</strong>rong> payments for<br />
older debt. Additionally, e<strong>st</strong>imated charges for Tampa Bay Water have been <strong>budget</strong>ed to increase by about $716,000.<br />
- The Department decreased its appropriations in <strong>capital</strong> outlay for equipment purchase and replacement by about $40,000 compared to FY11.<br />
- The Department is reducing the amount <<strong>st</strong>rong>of</<strong>st</strong>rong> intere<strong>st</strong> earnings transferred from the Water Co<strong>st</strong> Stabilization Fund to the Water Resources Operating<br />
Fund from $3.0 million to $1.5 million.<br />
- Part-time FTE calculations reflect actual hours worked.<br />
The Water Resources Department's fir<strong>st</strong> performance measure addresses the Mayor's goal <<strong>st</strong>rong>of</<strong>st</strong>rong> Safety. The fir<strong>st</strong> two performance measures address the<br />
Mayor's goal <<strong>st</strong>rong>of</<strong>st</strong>rong> Service. The la<strong>st</strong> six performance measures (the third through the eighth) address the Mayor's goal <<strong>st</strong>rong>of</<strong>st</strong>rong> Safety.<br />
Objective and Performance Measure<br />
Unit Of<br />
Measure<br />
FY 2009<br />
Actual<br />
FY 2010<br />
Actual<br />
FY 2011<br />
Target<br />
FY2011<br />
E<strong>st</strong>imate<br />
FY 2012<br />
Proposed<br />
Environmental Compliance Lab Samples<br />
The objective <<strong>st</strong>rong>of</<strong>st</strong>rong> the Environmental Compliance Division Laboratory is to perform all <<strong>st</strong>rong>of</<strong>st</strong>rong> the analyses required by the laboratory's clients. The goal<br />
<<strong>st</strong>rong>of</<strong>st</strong>rong> the laboratory is to process all samples within 10 business days to insure that reports are submitted on time. As a full service environmental<br />
laboratory for the City <<strong>st</strong>rong>of</<strong>st</strong>rong> St. Petersburg, it mu<strong>st</strong> comply with all aspects <<strong>st</strong>rong>of</<strong>st</strong>rong> the National Environmental Laboratory Accreditation Program and<br />
maintain Florida Department <<strong>st</strong>rong>of</<strong>st</strong>rong> Health accreditation. Strict control <<strong>st</strong>rong>of</<strong>st</strong>rong> analytic quality is maintained to reduce the risk <<strong>st</strong>rong>of</<strong>st</strong>rong> liability to the City and to<br />
conform to applicable regulations that promote public safety and environmental protection; therefore, that data reported mu<strong>st</strong> meet all quality<br />
275
City <<strong>st</strong>rong>of</<strong>st</strong>rong> St. Petersburg, Florida<br />
2012 thru 2016 Capital Improvement Plan<br />
Objective and Performance Measure<br />
control acceptance criteria.<br />
Unit Of<br />
Measure<br />
FY 2009<br />
Actual<br />
FY 2010<br />
Actual<br />
FY 2011<br />
Target<br />
FY2011<br />
E<strong>st</strong>imate<br />
FY 2012<br />
Proposed<br />
Environmental Compliance Lab Samples # 14,686 15,474 14,500 15,000 15,000<br />
Number <<strong>st</strong>rong>of</<strong>st</strong>rong> Watering Warnings and Citations Issued<br />
The objective <<strong>st</strong>rong>of</<strong>st</strong>rong> the Water Conservation Admini<strong>st</strong>ration is to enforce watering re<strong>st</strong>rictions and other ordinances enacted by St. Petersburg and<br />
federal and <strong>st</strong>ate authorities, and also to create and di<strong>st</strong>ribute educational messages that promote awareness and educate cu<strong>st</strong>omers on water<br />
conservation practices, technologies, and programs. (Note: The 2009 Actual numbers have been updated from what was published in the previous<br />
<strong>budget</strong> document.)<br />
Number <<strong>st</strong>rong>of</<strong>st</strong>rong> Watering Warnings and Citations Sent # 769 273 550 55 330<br />
Reclaimed Water<br />
The objective <<strong>st</strong>rong>of</<strong>st</strong>rong> the Water Reclamation Admini<strong>st</strong>ration Division is to optimize the wa<strong>st</strong>ewater treatment processes so that there is reliable<br />
availability <<strong>st</strong>rong>of</<strong>st</strong>rong> reclaimed water.<br />
Average Reclaimed Water Use Per Day<br />
Million<br />
20 15.3 22 20 20<br />
Gallons<br />
Reclaimed Plant Flow % 58.0 44.0 54.0 50.0 50.0<br />
Reclaimed Water Cu<strong>st</strong>omers # 10,915 10,817 11,000 11,000 11,000<br />
Sewer Replacement/Rehabilitation<br />
The objective <<strong>st</strong>rong>of</<strong>st</strong>rong> the Technical Support Division is to provide assi<strong>st</strong>ance to all WRD Operating Divisions in the form <<strong>st</strong>rong>of</<strong>st</strong>rong> project design, project<br />
management, development review, and compliance with federal, <strong>st</strong>ate, and local regulations. This group implements Sewer<br />
Replacement/Rehabilitation for wa<strong>st</strong>ewater.<br />
Sewer Replacement/Rehabilitation $ 1,473,000 2,348,135 2,000,000 2,000,000 2,000,000<br />
Wa<strong>st</strong>ewater - Citywide Maint Op - chemically treat roots<br />
The objective <<strong>st</strong>rong>of</<strong>st</strong>rong> the Wa<strong>st</strong>ewater Operations Section is to provide safe, efficient sanitary sewer service to the public through maintenance operations<br />
performed in accordance with State and Federal regulations.<br />
Wa<strong>st</strong>ewater - Citywide Maint Op - chemically treat roots Linear Feet 177,113 207,717 250,000 250,000 250,000<br />
Wa<strong>st</strong>ewater PMO (Preventive Maintenance Operation)<br />
The objective <<strong>st</strong>rong>of</<strong>st</strong>rong> the Wa<strong>st</strong>ewater Operations Section is to provide safe, efficient sanitary sewer service to the public through preventative<br />
maintenance operations performed in accordance with <strong>st</strong>ate and federal regulations.<br />
Wa<strong>st</strong>ewater PMO - Line cleaning Linear Feet 843,312 908,922 1,000,000 1,000,000 1,000,000<br />
Wa<strong>st</strong>ewater PMO - QTV scanning # 204,240 129,070 400,000 200,000 200,000<br />
Wa<strong>st</strong>ewater PMO - closed circuit inspection # 607,569 777,244 600,000 600,000 600,000<br />
Water Sy<strong>st</strong>ems Maintenance<br />
The objective <<strong>st</strong>rong>of</<strong>st</strong>rong> the Water Sy<strong>st</strong>ems Maintenance Division is to promote the health, safety, and welfare <<strong>st</strong>rong>of</<strong>st</strong>rong> the public served by the City <<strong>st</strong>rong>of</<strong>st</strong>rong> St.<br />
Petersburg Public Drinking Water Sy<strong>st</strong>em and the City's Reclaimed Water Sy<strong>st</strong>em and to effectively maintain the integrity <<strong>st</strong>rong>of</<strong>st</strong>rong> the potable and<br />
Reclaimed Water Di<strong>st</strong>ribution Sy<strong>st</strong>em through the effective utilization <<strong>st</strong>rong>of</<strong>st</strong>rong> employees, equipment, and materials.<br />
Cross Connection Control (Service Connections) # 14,004 11,448 19,000 19,000 19,000<br />
276
City <<strong>st</strong>rong>of</<strong>st</strong>rong> St. Petersburg, Florida<br />
2012 thru 2016 Capital Improvement Plan<br />
Objective and Performance Measure<br />
Unit Of<br />
FY 2009 FY 2010 FY 2011 FY2011 FY 2012<br />
Measure<br />
Actual Actual Target E<strong>st</strong>imate Proposed<br />
Pipe Replacement Linear Feet 64,600 56,702 60,000 58,000 60,000<br />
Reclaimed Water Compliance Inspections # 6,951 6,583 9,000 7,000 9,000<br />
Repair & Maintain Fire Hydrants & Valves # 7,684 6,078 8,900 8,300 8,900<br />
Water Usage<br />
The objective <<strong>st</strong>rong>of</<strong>st</strong>rong> the Cosme Water Treatment Plant Operations & Maintenance Division is to purchase potable water from Tampa Bay Water.<br />
Tampa Bay Water is directed by a nine member board <<strong>st</strong>rong>of</<strong>st</strong>rong> directors comprised <<strong>st</strong>rong>of</<strong>st</strong>rong> representatives from the six member governments. St. Petersburg,<br />
Tampa, and New Port Richey each have one representative; and Pinellas, Hillsborough, and Pasco Counties each have two members. Member<br />
governments pay the same wholesale water rate, share the co<strong>st</strong> <<strong>st</strong>rong>of</<strong>st</strong>rong> developing new supplies, share in environmental <strong>st</strong>ewardship, and share voting<br />
rights equitably.<br />
Amount <<strong>st</strong>rong>of</<strong>st</strong>rong> Water Usage Per Day Gallons 27,880,000 27,100,000 28,500,000 28,000,000 27,700,000<br />
Annual Average <<strong>st</strong>rong>of</<strong>st</strong>rong> Unaccounted for Water % 3.6% 5.5% 4.0% 3.8% 4.0%<br />
Co<strong>st</strong> <<strong>st</strong>rong>of</<strong>st</strong>rong> Tampa Bay Water $ 22,884,560 24,577,079 24,200,000 24,000,000 24,600,000<br />
Per Capita Usage Per Day Gallons 81 82 81 82 82<br />
277