UK Climate Change Programme 2006 - JNCC - Defra
UK Climate Change Programme 2006 - JNCC - Defra
UK Climate Change Programme 2006 - JNCC - Defra

Create successful ePaper yourself
Turn your PDF publications into a flip-book with our unique Google optimized e-Paper software.
<strong>Climate</strong> <strong>Change</strong><br />
The <strong>UK</strong> <strong>Programme</strong> <strong>2006</strong>
<strong>Climate</strong> <strong>Change</strong><br />
The <strong>UK</strong> <strong>Programme</strong> <strong>2006</strong><br />
Presented to Parliament by the<br />
Secretary of State for the Environment,<br />
Food and Rural Affairs<br />
by Command of Her Majesty<br />
Presented to the Scottish Parliament by the Scottish Ministers:<br />
Presented to the Northern Ireland Assembly:<br />
Placed with the Welsh Assembly library<br />
March <strong>2006</strong><br />
CM6764<br />
SE/<strong>2006</strong>/43 £23.00
©Crown Copyright <strong>2006</strong><br />
The text in this document (excluding the Royal Arms and departmental logos) may be reproduced<br />
free of charge in any format or medium providing that it is reproduced accurately and not used in<br />
a misleading context. The material must be acknowledged as Crown copyright and the title of the<br />
document specified.<br />
Any enquiries relating to the copyright in this document should be addressed to the Licensing<br />
Division, HMSO, St Clements House, 2-16 Colegate, Norwich, NR3 1BQ, Fax 01603 723000<br />
or e-mail: licencing@cabinet-office.x.gsi.gov.uk
Section Number – CHAPTER NUMBER<br />
Title<br />
Prime Minister’s Foreword<br />
iii<br />
<strong>Climate</strong> change is probably the greatest long-term<br />
challenge facing the human race. That is why I have<br />
made it a top priority for this government, at home<br />
and internationally.<br />
The scientific evidence is now overwhelming. Since<br />
1990, global temperatures have risen by 0.2C and<br />
atmospheric carbon dioxide concentrations have<br />
increased from 354 parts per million to over 380 parts<br />
per million and are still rising. If the anticipated growth<br />
in emissions is left unchecked, global average<br />
temperatures could be as much as 5.8C higher by the<br />
end of this century, with a devastating impact on our<br />
economy and natural world, in the <strong>UK</strong> and, above all, in<br />
the most vulnerable developing countries.<br />
We have to accept that some climate change is now<br />
inevitable. We must adapt to this and provide greater<br />
support for the poorest nations. We can, however, avert<br />
the worst global scenarios if the world acts decisively,<br />
but there can be no delay. The longer we put off action,<br />
the more dramatic and costlier the changes we will have<br />
to make.<br />
Our 2000 <strong>Climate</strong> <strong>Change</strong> <strong>Programme</strong> has already<br />
helped put us on track to meet our Kyoto greenhouse<br />
gas reduction commitment. Indeed, we are projected<br />
to go significantly beyond our Kyoto commitment and<br />
reduce our greenhouse gas emissions by 23-25 per cent<br />
by 2010, one of the best records of any Kyoto signatory.<br />
Without the measures introduced since 1997 and the<br />
package of new measures being announced today, we<br />
estimate that carbon dioxide emissions in 2010 might<br />
only be about 1 per cent lower than in 1990, rather<br />
than 15 to 18 per cent lower. But we are not<br />
complacent. This programme contains further<br />
commitments to help achieve our national goal of<br />
reducing carbon dioxide by 20 per cent below 1990<br />
levels by 2010 and, in the long-term, reduce emissions<br />
by 60 per cent by 2050.<br />
Domestic action is essential, not least to underline the<br />
fact that emissions reductions and prosperity can go<br />
hand-in-hand. But national action can only be part<br />
of a much bigger strategy. The <strong>UK</strong> is responsible for<br />
2 per cent of global emissions, and this figure is falling.<br />
<strong>Climate</strong> change is a global problem that requires a global<br />
solution. That is why our new programme sets out our<br />
strategy for both international and national action.<br />
The <strong>UK</strong> has already taken a strong lead internationally<br />
on climate change. We played a major role in<br />
negotiating the Kyoto Treaty. In the Hadley Centre, we<br />
have one of the world’s leading climate change research<br />
centres. We have also taken a policy lead, through the<br />
climate change levy and <strong>UK</strong> emissions trading scheme.<br />
In 2005 we took this to a new level, through our<br />
Presidencies of the G8 and EU. We made important<br />
progress. Crucially, the G8 countries agreed to a new<br />
Dialogue with the Leaders of China, India, Brazil and<br />
other emerging economies that will hold meetings<br />
annually and culminate in 2008 when it reports to the<br />
Japanese G8 Presidency. The progress made at the G8<br />
and in our EU Presidency helped to secure a positive<br />
outcome to the UN <strong>Climate</strong> <strong>Change</strong> Conference<br />
in Montreal.<br />
But the progress made last year has, in truth, simply got<br />
the world to the starting blocks for the real race – to<br />
secure agreement to the long-term goal of global action<br />
on climate change and on the action needed to deliver<br />
that goal.<br />
This document sets out our plans for working, with other<br />
countries, to secure agreement on the scale needed.<br />
They include a strong focus on a stabilisation goal to<br />
frame future international action, progress through the<br />
UN Framework on <strong>Climate</strong> <strong>Change</strong> and the G8 Dialogue,<br />
and a much greater role for the European Union.
iv<br />
Foreword<br />
We will work with our EU partners to take further action<br />
both internally and internationally. The <strong>UK</strong> will push<br />
hard for greater certainty on European plans for<br />
implementation of the EU Emissions Trading Scheme<br />
beyond 2012. The scheme remains the most important<br />
mechanism for stimulating international investment in<br />
low-carbon technology. We will also seek agreement<br />
for much more ambitious collaboration with emerging<br />
economies. Our EU Summits with China and India in<br />
2005 were a useful step forward. But again we need<br />
to go much further, to scale up these actions to make<br />
a real difference.<br />
We will also work with the G8 and developing countries<br />
through the Dialogue to accelerate the deployment of<br />
clean technologies and provide incentives for investment<br />
in low carbon technologies. We will co-operate closely<br />
with the World Bank and other multilateral development<br />
banks to deliver an effective framework for investment in<br />
clean energy, and with the International Energy Agency.<br />
Targets matter, at home and abroad. But recent events<br />
have shown that no government can control emissions<br />
in any one year, due to factors such as changes in<br />
international fuel and energy prices that are outside our<br />
control. Our approach seeks to secure steady emissions<br />
reductions over time, through a framework that<br />
recognises the importance of maintaining our economic<br />
competitiveness and our responsibilities to all members<br />
of society – particularly those experiencing fuel poverty.<br />
decision this summer. We will also be considering other<br />
future policy options through the Energy Review and the<br />
annual Budget process. We will report to Parliament<br />
annually on emissions, future projections, the impact<br />
of these measures and forward plans.<br />
Government will play its part and give the necessary<br />
lead. But we won’t succeed without the support and<br />
active participation of all sectors of society.<br />
If every household and business took measures to reduce<br />
its carbon dioxide emissions, by reducing energy used in<br />
the home, in buildings, and by changing how journeys<br />
are made, we could achieve our 20 per cent target.<br />
We can and will help make this happen. We are putting<br />
more funding into a new initiative to raise consumer<br />
demand for energy efficiency. The Carbon Trust and the<br />
Energy Saving Trust will this year run awareness<br />
campaigns on what companies and individuals can do to<br />
help. Our <strong>Climate</strong> <strong>Change</strong> Communications Initiative will<br />
do more to inform the public of the threat and how we<br />
can together overcome it.<br />
Our emissions goals require leadership and action, by<br />
government and by us all. This programme will move us<br />
closer, and we will go further. But the solution is in the<br />
hands of us all – as businesses, citizens and consumers.<br />
Let’s achieve this together.<br />
This programme will take us close to our domestic target.<br />
But it is by no means the last word. We are launching<br />
the consultation today on the <strong>UK</strong>’s approach to the next<br />
phase of the EU emissions trading scheme, which will<br />
provide a vital signal to business of the parameters from<br />
2008–12. I am a strong supporter of the scheme. We<br />
look forward to hearing people’s views prior to our final<br />
Tony Blair<br />
Prime Minister<br />
March <strong>2006</strong>
Section Number – CHAPTER NUMBER 1<br />
Title<br />
Contents<br />
Executive Summary 3<br />
Section 1 – The international challenge 7<br />
1. What is climate change and why does it matter? 8<br />
2. International framework for action 15<br />
Section 2 – Delivering emissions reductions 23<br />
1. <strong>UK</strong> emissions inventory and projections 24<br />
2. Strategy to reduce <strong>UK</strong> emissions 30<br />
3. Energy supply 32<br />
4. Business 44<br />
5. Transport 61<br />
6. Domestic 74<br />
7. Agriculture, forestry and land use management 90<br />
8. Public sector 104<br />
9. Stimulating action by individuals 117<br />
10. Bringing it all together 124<br />
11. Monitoring and review 126<br />
Section 3 – Adapting to the impacts of climate change 129<br />
1. Adaptation 130<br />
Section 4 – Action by the devolved administrations 143<br />
1. Scotland 144<br />
2. Northern Ireland 153<br />
3. Wales 163
2<br />
Contents<br />
Section 5 – Annexes 00<br />
Section 5 – Annexes 169<br />
Annex A – Emissions projections 170<br />
Annex B – Carbon dioxide 174<br />
Annex C – Methane 176<br />
Annex D – Nitrous oxide 178<br />
Annex E – HFCs, PFCs and SF 6 180<br />
Annex F – Carbon sequestration 183<br />
Annex G – Carbon capture and geological storage 187<br />
Annex H – List of greenhouse gases 188<br />
Annex I – Review of the 2000 <strong>Climate</strong> <strong>Change</strong> <strong>Programme</strong> 190<br />
Glossary of terms 191
Executive Summary Executive Summary<br />
3<br />
This Government believes that climate change is the<br />
greatest long-term challenge facing the world today.<br />
There is strong and indisputable evidence that climate<br />
change is happening and that man-made emissions are<br />
its main cause. The ten warmest years globally since<br />
formal records began in 1861 have all occurred since<br />
1994. If left unchecked, climate change will have<br />
profound impacts on our societies and way of life,<br />
affecting agriculture and food security, leading to water<br />
shortages, triggering population movements and<br />
impacting on our economies, and our security. So action<br />
is needed now.<br />
The <strong>UK</strong> has already taken significant steps to meet this<br />
challenge. The Government has led the way with<br />
innovative policies, such as the <strong>Climate</strong> <strong>Change</strong> Levy and<br />
agreements, Renewables Obligation and Energy<br />
Efficiency Commitment. Equally, we have built on our<br />
experience of domestic policy to foster greater action at<br />
the international level – most notably with the successful<br />
introduction of the EU Emissions Trading Scheme which<br />
draws many elements from our domestic emissions<br />
trading scheme. The combination of these measures has<br />
had a substantial impact on greenhouse gas reduction in<br />
the <strong>UK</strong>. It is for this reason that the <strong>UK</strong> is one of very<br />
few countries on track to meet our commitment under<br />
the Kyoto Protocol to reduce emissions of greenhouse<br />
gases by 12.5 per cent below 1990 levels by 2008-12.<br />
And we have made progress beyond this commitment,<br />
with our greenhouse gas emissions projected to be<br />
almost 20 per cent below 1990 levels in 2010 even<br />
without the new measures in this programme.<br />
We want to go further. This <strong>Climate</strong> <strong>Change</strong> <strong>Programme</strong><br />
sets out our policies and priorities for action in the <strong>UK</strong><br />
and internationally. <strong>Climate</strong> change is a global problem,<br />
so we will strive to secure global action on the scale<br />
needed to tackle it. But we will also take further action<br />
at home, to meet our commitments and demonstrate<br />
that climate change can be tackled without damaging<br />
our economy.<br />
The <strong>UK</strong> is already at the forefront of the fight against<br />
climate change. Our Presidencies of the G8 and the EU<br />
in 2005 and this made a powerful impact. At the<br />
Gleneagles Summit in July 2005, the G8 leaders agreed<br />
that climate change was a serious and long-term<br />
challenge caused by human activity, and that urgent<br />
action was needed. The Gleneagles Action Plan and the<br />
commitment by G8 leaders and leaders of other<br />
countries to launch a Dialogue on “climate change,<br />
clean energy and sustainable development” were a<br />
major signal of renewed political will. The Montreal UN<br />
Conference in December 2005 was an important step<br />
forward for the whole international community.<br />
But there is a long way to go. So we will continue to<br />
play a leadership role in <strong>2006</strong> and beyond through the<br />
European Union, G8 and UN Framework Convention<br />
processes, and find ways to reach global agreement<br />
to action on the scale needed to avert dangerous<br />
climate change.<br />
We have also set ourselves a more challenging domestic<br />
target to reduce carbon dioxide emissions by 20 per cent<br />
below 1990 levels by 2010. Although we have made<br />
significant progress, higher than anticipated levels of<br />
economic growth and the recent rise in global energy<br />
prices, which has altered the relative prices of coal and<br />
gas, have led to increases in our carbon dioxide<br />
emissions in recent years. As a result, achieving our<br />
domestic target has become more challenging since our<br />
last <strong>Climate</strong> <strong>Change</strong> <strong>Programme</strong> in 2000. We have<br />
therefore used this Review to assess both the impact of<br />
existing policies and the potential contribution of new<br />
policy options.<br />
This new <strong>Climate</strong> <strong>Change</strong> <strong>Programme</strong> will take us close<br />
to our domestic target, and ensure that the <strong>UK</strong> can<br />
make the real progress by 2020 towards the long-term<br />
goal to reduce carbon dioxide emissions by some 60 per<br />
cent by about 2050 that we committed to in the 2003<br />
Energy White Paper. The package of existing and new<br />
policy measures in the <strong>Programme</strong> are projected to<br />
reduce carbon dioxide emissions to 15-18 per cent<br />
below 1990 levels – the new measures saving 12 million<br />
tonnes of carbon by 2010. This is very good progress.<br />
Our overall emissions of greenhouse gas emissions are<br />
now projected to be 23-25 per cent below 1990 levels<br />
in 2010 – around double our Kyoto target.<br />
This <strong>Programme</strong> is not the final word. The projections<br />
and policies set out in this <strong>Programme</strong> will change over<br />
time. There is more that government will do both to<br />
influence emissions directly and to encourage action by<br />
others. The 2010 carbon target is still within reach.<br />
Further contributions could be made by the Energy<br />
Review, the ODPM review of buildings and other<br />
government policy processes over the coming years.
4<br />
Executive Summary<br />
Recent experience has proven the need to assess<br />
progress towards our medium and long-term goals on<br />
a more frequent and regular basis. We will therefore in<br />
future report annually to Parliament on our progress at<br />
reducing the <strong>UK</strong>’s greenhouse gas emissions. Building<br />
on this, the Review of the Economics of <strong>Climate</strong><br />
<strong>Change</strong>, led by Sir Nick Stern, will consider other aspects<br />
of recent proposals for the introduction of “carbon<br />
budgeting”. This analysis will inform the Energy Review.<br />
So this <strong>Climate</strong> <strong>Change</strong> <strong>Programme</strong> sets out the<br />
Government’s commitments both at international and<br />
domestic levels to meet the challenge of climate change.<br />
It also sets out our approach to strengthening the role<br />
that individuals can play. We will encourage individuals<br />
as citizens, consumers, motorists and business people to<br />
take the action needed to help meet our goals. There is<br />
no choice to be made between action at international,<br />
national and personal levels. We regard all as essential.<br />
The primary elements of our programme at all levels are<br />
summarised below.<br />
Internationally we will:<br />
• work to build consensus on the scale of action<br />
needed to stabilise the climate and avoid dangerous<br />
climate change, and build on the progress made at<br />
the G8 Summit in Gleneagles and the Montreal<br />
climate change conference to strengthen the<br />
international regime;<br />
• work with EU partners to secure agreement to<br />
further action in the EU, in particular by extending<br />
and strengthening the Emissions Trading Scheme and<br />
the Clean Development Mechanism to make them<br />
key regional and global tools for emissions<br />
reductions beyond 2012;<br />
• in partnership with the EU, enhance our efforts to<br />
help India, China, Brazil and other large emerging<br />
countries evolve as low-carbon economies;<br />
• work with the World Bank and the multilateral<br />
development banks to ensure that the proposed<br />
Clean Energy Investment Framework delivers<br />
significant new investment in low carbon energy<br />
sources, energy efficiency and adaptation to climate<br />
change in developing countries;<br />
• support international collaboration and coordination<br />
to ensure the successful expansion of new<br />
technologies, through action in key areas such as<br />
product standards and research and development;<br />
and<br />
• help poorer developing countries to adapt to<br />
changes in climate already occurring and to make<br />
their economies more resilient to future changes.<br />
Domestically we will:<br />
• report annually to Parliament on emissions, our<br />
future plans and progress on domestic climate<br />
change; and<br />
• set out our adaptation plan for the <strong>UK</strong>, informed<br />
by additional research on the impacts of climate<br />
change.<br />
In the energy supply sector we will:<br />
• consult now on a National Allocation Plan for the<br />
second phase of the EU Emissions Trading Scheme to<br />
achieve carbon savings of between 3 and 8 MtC;<br />
• spend £80m in the next three years to support<br />
microgeneration technologies, with the aim of<br />
encouraging manufacture at higher scale leading<br />
to lower costs;<br />
• provide £35m over four years for the development of<br />
carbon abatement technologies, and consult on the<br />
barriers to wide-scale commercial development of<br />
carbon capture and storage (CCS) in the <strong>UK</strong> and the<br />
potential role of economic incentives in addressing<br />
those barriers;<br />
• continue to support electricity from renewables<br />
under the Renewables Obligation and address<br />
barriers to take-up; and<br />
• fully consider the treatment of CHP in the <strong>UK</strong>’s<br />
National Allocation Plan for the second phase<br />
of the EU Emissions Trading Scheme.<br />
In the business sector we will:<br />
• continue to use the climate change levy and<br />
associated climate change agreements to encourage<br />
businesses to improve the efficiency with which they<br />
use energy;
Executive Summary<br />
5<br />
• maintain a strong package of support, advice and<br />
information measures to help businesses improve<br />
their energy efficiency;<br />
• continue to make the EU Emissions Trading Scheme a<br />
central element of the business sector’s contribution<br />
to our national goal; and<br />
• keep the current policy mix under review to ensure<br />
that it continues to represent the most effective use<br />
of policy instruments to deliver emissions reductions.<br />
In the transport sector we will:<br />
• introduce the Renewable Transport Fuel Obligation<br />
from 2008 to increase the uptake of biofuels and<br />
ensure a long term framework which promotes<br />
additional investment;<br />
• continue to use fiscal instruments such as Vehicle<br />
Excise Duty and Company Car Tax to give incentives<br />
to purchase less polluting vehicles;<br />
• maintain momentum in the EU to secure agreement<br />
to the inclusion of aviation in the EU Emissions<br />
Trading Scheme from 2008 or as soon as possible<br />
thereafter;<br />
• work strongly to achieve further commitments from<br />
vehicle manufacturers to improve fuel efficiency; and<br />
• continue to promote carbon offsetting and lead by<br />
example to offset emissions arising from central<br />
Government air travel.<br />
In the domestic sector we will:<br />
• continue to take forward significant improvements<br />
already made and update the Building Regulations<br />
in April <strong>2006</strong> to raise energy standards of new build<br />
and refurbished buildings;<br />
• introduce the Code for Sustainable Homes which will<br />
have minimum standards for energy and water<br />
efficiency at every level of the Code, with the lowest<br />
levels raised above the level of mandatory building<br />
regulations;<br />
• building on substantial progress to date, seek to<br />
achieve substantially higher carbon savings from the<br />
Energy Efficiency Commitment in 2008-11, working<br />
with stakeholders to examine the scope to provide<br />
greater flexibility and incentive in the design of the<br />
scheme and to enable it to encourage consumers to<br />
reduce their energy demand;<br />
• achieve 250,000 additional subsidised installations<br />
of home insulation over the next two years over and<br />
above existing commitments;<br />
• launch a major new initiative designed to strengthen<br />
consumer demand for energy efficiency, working<br />
closely with energy suppliers and through local<br />
authorities, with funding of £20m over the next<br />
two years;<br />
• provide more reliable consumer product information<br />
and set effective standards for energy-using products<br />
via voluntary agreements, in particular a new<br />
initiative with major retailers on consumer<br />
electronics, the Eco-design of Energy Using Products<br />
Directive and other national, EU and international<br />
policy measures and initiatives, including public<br />
procurement;<br />
• consider how to enable consumption feedback to<br />
households via improved billing and metering,<br />
including the Budget <strong>2006</strong> announcement of £5m to<br />
help co-finance with energy companies a pilot study<br />
in the use of “smart” meters and associated<br />
feedback devices;<br />
• maintain the Energy Efficiency Commitment, Warm<br />
Front and Decent Homes schemes to deliver energy<br />
efficiency measures in low income households to<br />
help meet our fuel poverty targets; and<br />
• continue to support the activities of the Energy<br />
Saving Trust and the <strong>Climate</strong> <strong>Change</strong><br />
Communications Initiative to raise awareness about<br />
climate change and the action individuals can take<br />
to help tackle it.<br />
In the public sector and local government we will:<br />
• introduce a package of measures to drive additional<br />
action for local authorities to include an appropriate<br />
focus on action on climate change;<br />
• set up a new revolving loan fund of £20m for the<br />
whole of the public sector, to finance investment<br />
in energy efficiency; and<br />
• introduce new strategic targets for the central<br />
government estate in summer <strong>2006</strong>.
6<br />
Executive Summary<br />
In the agriculture, forestry and land management<br />
sector we will:<br />
• promote resource efficient farm management<br />
in order to reduce agriculture's contribution<br />
to greenhouse gas emissions; and<br />
• examine the scope and feasibility of an emissions<br />
trading scheme for the agriculture and forestry<br />
sector.<br />
And to encourage personal action we will:<br />
• introduce further measures and initiatives to<br />
encourage and enable individuals to understand their<br />
role and responsibility in tackling climate change;<br />
• continue to support the essential work of the<br />
Energy Saving Trust and Carbon Trust and other<br />
organisations that provide information and advice<br />
to individuals, businesses and local authorities;<br />
• set out a plan for action on sustainable consumption<br />
by the end of <strong>2006</strong>, in response to the Sustainable<br />
Consumption Round Table report due in Spring <strong>2006</strong>;<br />
• establish a new online information service (working<br />
title: Environment Direct) to provide information on<br />
the environmental impact of a range of everyday<br />
products and services, and practical advice on<br />
sustainable lifestyle choices;<br />
• provide up to £4m over three years to roll out a<br />
new package of measures to help thousands of<br />
community groups across England to take action on<br />
sustainable development, including climate change;<br />
and<br />
• enhance our new <strong>Climate</strong> <strong>Change</strong> Communications<br />
Initiative, to change public attitudes toward climate<br />
change, above all at local, grass roots and regional<br />
level.
SECTION<br />
1<br />
The International Challenge
8<br />
CHAPTER ONE<br />
What is climate change and why does it matter?<br />
The overwhelming majority of scientific<br />
opinion supports the view that human<br />
activities are changing the earth’s climate and<br />
that likely future changes present a serious<br />
threat to human society and the natural<br />
environment.<br />
The ten warmest years globally since<br />
instrumental records began in 1861 have all<br />
occurred since 1994. 1998 was the warmest<br />
year and 2005 was almost as warm.<br />
Without action to reduce greenhouse gas<br />
emissions global temperatures are expected to<br />
rise by between 1.4 and 5.8°C by 2100 and sea<br />
level could also rise by between 0.09 and<br />
0.88 metres compared to 1990 levels.<br />
Such changes will have significant impacts on<br />
human society and on the natural<br />
environment, with increases in drought and<br />
extreme rainfall and greater risks of abrupt<br />
changes in climate.<br />
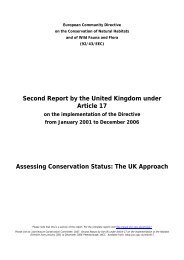
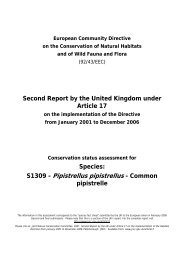
The greenhouse effect and other<br />
influences on climate<br />
2. The temperature of the earth is determined by<br />
the balance between energy from the sun in the<br />
form of visible radiation (sunlight), and energy<br />
constantly re-radiated from the earth to space in<br />
the form of infra-red radiation. Sunlight passes<br />
through the atmosphere with little direct<br />
warming effect but it warms the earth’s surface<br />
which in turn warms the atmosphere by<br />
convection and the emission of infra-red<br />
radiation, which is absorbed by certain trace<br />
gases – the greenhouse gases. These return some<br />
infra-red radiation back to the surface thereby<br />
warming the surface further. An analogy is often<br />
made with the effect of a greenhouse which<br />
allows sunshine in through clear glass or plastic<br />
that in turn stops the heat inside from escaping,<br />
hence the term ‘greenhouse effect’.<br />
Introduction<br />
1) Visible and near-visible<br />
radiation from the Sun<br />
easily passes through the<br />
glass and heats the ground,<br />
plants, etc.<br />
2) The ground, plants,<br />
etc. act as a thermal<br />
black-body radiator<br />
and emit long-wave<br />
infra-red (IR)<br />
wavelengths<br />
1. The earth’s climate has changed frequently over<br />
the long periods of geological time in responses<br />
to changes in the strength of the sun, the shape<br />
and tilt of the earth’s orbit around the sun, the<br />
position and shape of the continents and the<br />
composition of the atmosphere. There is strong<br />
evidence that greenhouse gas emissions from<br />
human activities are now raising the earth’s<br />
temperature and causing other changes in<br />
climate. Emissions are projected to rise<br />
significantly over the next few decades, and quite<br />
likely beyond this, leading to significant increases<br />
in global temperatures with profound risks for<br />
the natural environment and human society<br />
worldwide. This Chapter provides background<br />
material on the nature of human induced climate<br />
change and its likely impacts.<br />
3) Most of the IR<br />
radiation passes<br />
back through the<br />
glass and escapes<br />
to space ...<br />
4) Some IR radiation<br />
is reflected by the<br />
glass and is trapped<br />
inside the<br />
greenhouse causing<br />
internal temperatures<br />
to rise.<br />
3. The greenhouse effect occurs naturally. Without<br />
it the earth would be over 30°C cooler than it is<br />
and largely uninhabitable. The main naturally<br />
occurring greenhouse gases are water-vapour<br />
(H 2<br />
O), carbon dioxide (CO 2<br />
), methane (CH 4<br />
) and<br />
nitrous oxide (N 2<br />
O). Although water vapour<br />
makes the greatest contribution to the<br />
greenhouse effect, it has a short lifetime in the<br />
atmosphere and its concentration is largely<br />
determined by the temperature of the<br />
atmosphere and not simply by emission or loss<br />
rates. By contrast, the other three gases have<br />
relatively long atmospheric lifetimes – about a
What is climate change and why does it matter?<br />
9<br />
century for CO 2<br />
– and so their concentrations are<br />
determined by emission and removal rates. Since<br />
the industrial revolution, man’s use of fossil fuels<br />
and increase in agriculture has increased the<br />
emissions of all the long-lived greenhouse gases.<br />
4. Human activities also affect the climate in other<br />
ways. Airborne aerosol particles emitted by<br />
sources such as industry, power stations and<br />
transport scatter sunlight, which would otherwise<br />
reach the earth’s surface, and have a cooling<br />
effect on the climate system. Their influence can<br />
be important in heavily polluted regions but,<br />
unlike greenhouse gases, they do not accumulate<br />
in the atmosphere because they are washed out<br />
by rain within a few weeks. Aerosols have<br />
partially masked the full effect of increasing<br />
greenhouse gases and have slowed the rate of<br />
temperature increase. Human activities, such as<br />
agriculture and deforestation, have also changed<br />
the nature of the earth’s surface in ways which<br />
affect climate. For example, changing land use<br />
from forests to pasture increases the amount of<br />
sunlight reflected and the availability of moisture<br />
at the surface. Such changes affect the climate<br />
on a regional scale. Deforestation also leads to<br />
significant emissions of CO 2<br />
to the atmosphere<br />
and currently accounts for some 20 per cent<br />
of global emissions.<br />
Greenhouse gases<br />
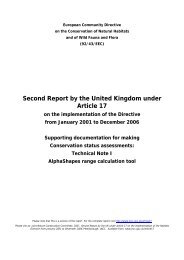
5. In addition to the human induced emissions of<br />
carbon dioxide, methane and nitrous oxide,<br />
industrial activities have generated other<br />
greenhouse gases, namely hydrofluorocarbons,<br />
perfluorocarbons and sulphur hexafluoride 1 .<br />
Each greenhouse gas has a different capacity to<br />
cause global warming, depending on its radiative<br />
properties, its molecular weight and its residence<br />
time in the atmosphere. Global warming<br />
potential (GWP) 2 is a convenient index that can<br />
be used to assess the relative global warming<br />
effect of the emissions of different gases over a<br />
set time period – usually taken to be one<br />
hundred years – relative to the emission of an<br />
equal mass of CO 2<br />
. The following table<br />
summarises the GWPs for the main greenhouse<br />
gases. The overall effect of emissions on the<br />
climate system can be found by multiplying the<br />
emissions by the relevant GWP.<br />
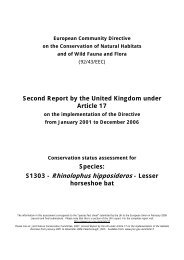
The relative contribution to global warming over the next 100 years<br />
of current emissions of greenhouse gases.<br />
Global Warming Potentials for selected gases from the IPCC Third<br />
Assessment Report<br />
GAS<br />
Methane<br />
24%<br />
Nitrous<br />
oxide<br />
10%<br />
Others<br />
3%<br />
GWP<br />
CO 2<br />
1<br />
CH 4<br />
23<br />
N 2<br />
O 296<br />
HFC-23 12000<br />
HFC-134a 1300<br />
CF 4<br />
5700<br />
SF 6<br />
22200<br />
Carbon<br />
dioxide<br />
63%<br />
6. Atmospheric concentrations of carbon dioxide,<br />
methane and nitrous oxide have been rising for<br />
200 years. Concentrations of most other<br />
greenhouse gases have also been rising in the<br />
past five decades. Evidence from bubbles in<br />
ice cores shows that the pre-industrial level of<br />
carbon dioxide in the atmosphere was about<br />
270ppm (parts per million) which has risen to<br />
377ppm by the end of 2004 and provisional data<br />
for 2005 show a concentration of over 380ppm.<br />
The atmospheric CO 2<br />
concentration is already at<br />
a level not seen on earth for at least 740,000<br />
years, and probably for over 20 million years.<br />
Both ice core and instrumental measurements<br />
have also shown well over a doubling of preindustrial<br />
methane concentrations in the<br />
atmosphere.<br />
1 The UNFCCC and the Kyoto Protocol are concerned with greenhouse gases not covered by the Montreal Protocol. Chlorofluorocarbons (CFCs) and hydrochlorofluorocarbons<br />
(HCFCs) are also greenhouse gases but are being phased out under the Montréal Protocol.<br />
2 GWP is defined as the warming influence of a gas over a set time period relative to that of carbon dioxide. The GWP values used for calculating national<br />
greenhouse gas emissions totals are from IPCC’s Second Assessment Report and differ slightly from the values shown in Table 1 – see Annex H.
10<br />
What is climate change and why does it matter?<br />
Historical CO 2<br />
concentrations<br />
Global average near surface temperatures (1861-2005)<br />
Historic trends and observed changes<br />
7. The global temperature record indicates that the<br />
earth has warmed by about 0.7°C since the<br />
beginning of the last century. All of the ten<br />
warmest years on record since 1861 have<br />
occurred since the beginning of the 1990s and<br />
the last ten years have seen nine of the ten<br />
warmest years on record with only 1996 not<br />
making the top ten. 1998 was the warmest year<br />
on record and 2005 was almost as warm.<br />
8. How much of this change in temperature can be<br />
attributed to human activities is studied using<br />
complex climate models which show a<br />
characteristic fingerprint (spatial and temporal<br />
response) of the pattern of change due to<br />
increasing greenhouse gas concentrations. This<br />
suggests that at least half of the increase since<br />
1900 has been caused by human activities, with<br />
the remainder likely due to natural variations,<br />
including changes in the sun’s output and<br />
volcanic eruptions. Most of the warming over<br />
the past 50 years is likely to have been caused<br />
by human activities.<br />
9. The area of snow cover in the Northern<br />
Hemisphere has decreased by 10 per cent since<br />
the 1960s and there has been a significant retreat<br />
of glaciers in most regions of the world. Large<br />
areas of ice shelves in the Antarctic Peninsula<br />
have broken off in recent years. Arctic sea-ice has<br />
thinned by up to 40 per cent in recent decades in<br />
late-summer and has decreased in extent in latesummer<br />
by 15 per cent since the 1950s. Latest<br />
estimates indicate a decline in Arctic sea ice area<br />
of about 8 per cent in the last decade alone. The<br />
melting of sea-ice does not affect sea levels (as it<br />
already displaces its own weight of water) but the<br />
loss of ice shelves may hasten the flow of land<br />
ice to the ocean and consequently add to sea<br />
level rise.
What is climate change and why does it matter?<br />
11<br />
10. Sea level has risen by 1 to 2 mm per year during<br />
the 20th century, mainly as a result of thermal<br />
expansion of the oceans and melting of glaciers.<br />
Sea levels will continue to rise for several<br />
centuries after greenhouses gas concentrations<br />
in the atmosphere are stabilised because of the<br />
very large thermal inertia of the oceans.<br />
11. The ranges of many plant and animal species<br />
have shifted pole-ward and to higher altitudes<br />
in recent decades. Plant flowering, the arrival of<br />
migrating birds, the onset of some bird breeding<br />
seasons and the emergence of insects have all<br />
been observed to occur earlier across much of<br />
the middle and high latitudes of the Northern<br />
Hemisphere. In several regions insect and pest<br />
species are now over-wintering more easily.<br />
likely to occur due to the presence of<br />
increased levels of greenhouse gases and that<br />
by the middle of this century such a summer<br />
may occur every two or three years.<br />
14. Some exceptional tropical storm activity has been<br />
observed in recent years. In 2005 in the Atlantic<br />
sector there were an unprecedented number of<br />
hurricanes stretching over a very long season,<br />
leading to speculation that global warming is<br />
responsible. Recent studies provide some evidence<br />
that tropical storms are becoming more intense and<br />
that this is related to rising sea surface temperature.<br />
But many factors influence tropical storm formation<br />
and the scientific community is still analysing the<br />
possible linkage with climate change.<br />
Projected European summer temperatures through this century<br />
12. Coral reef bleaching has increased globally.<br />
This is caused by unusually high sea surface<br />
temperatures. We are also beginning to see an<br />
increase in ocean acidity as more CO 2<br />
is absorbed<br />
by the ocean. This could have serious impacts on<br />
marine organisms and reduce the oceans’ ability<br />
to absorb carbon dioxide from the atmosphere.<br />
13. There is strong evidence of increases in storm and<br />
heat-wave frequency in many parts of the world<br />
and, most importantly, a significant decrease in<br />
cold weather snaps in high and mid-latitudes,<br />
including in Britain.<br />
For example:<br />
• in the Arctic, temperatures have risen by up to<br />
twice the global average since the mid-1970s;<br />
• Alaska has warmed especially quickly in the<br />
last two decades, with dramatic impacts on<br />
the environment, plants and animals and<br />
human societies; and<br />
• across Europe, several dramatic floods have<br />
hit the headlines during the last decade.<br />
Possibly the hottest summer in a thousand<br />
years in Europe killed more than 35,000<br />
people in 2003 and set a new <strong>UK</strong> record high<br />
temperature (38.5°C near Faversham in Kent<br />
on 10 August). A study shows that a summer<br />
of such exceptional warmth was twice as
12<br />
What is climate change and why does it matter?<br />
How the climate may change in the<br />
future<br />
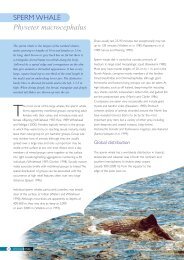
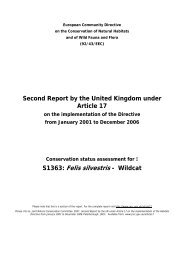
15. Complex computer models are used to simulate<br />
global and regional climates of the past, present<br />
and future. The first graph below shows observed<br />
global temperature change between 1861 and<br />
2000 (black curve) as well as a simulation of global<br />
temperature change back into the 19th century<br />
from the latest climate change model developed by<br />
the Met Office’s Hadley Centre (red curve). The<br />
second graph shows four simulations into the future<br />
using the same model and based on four emissions<br />
scenarios of the Intergovernmental Panel on <strong>Climate</strong><br />
<strong>Change</strong> (IPCC). Each shows a continuing global<br />
temperature rise until the end of this century.<br />
Recent warming can be simulated when man-made factors are included<br />
Intergovernmental Panel on <strong>Climate</strong><br />
<strong>Change</strong> (IPCC)<br />
Recognising the need for a scientific assessment,<br />
the World Meteorological Organisation (WMO)<br />
and the United Nations Environment <strong>Programme</strong><br />
(UNEP) established the Intergovernmental Panel<br />
on <strong>Climate</strong> <strong>Change</strong> in 1988.<br />
The role of the IPCC is to assess on a<br />
comprehensive, objective, open and transparent<br />
basis the scientific, technical and socio-economic<br />
information relevant to understanding the<br />
scientific basis of risk of human-induced climate<br />
change, its potential impacts and options for<br />
adaptation and mitigation.<br />
The IPCC does not carry out research. It bases<br />
its assessments on peer reviewed and published<br />
scientific/technical literature. Since its<br />
establishment the IPCC has produced a series of<br />
publications which have become standard<br />
works of reference.<br />
The main products are Assessment Reports,<br />
Special Reports, Methodology Reports and<br />
Technical Papers. Each assessment includes a<br />
Summary for Policymakers published in all<br />
official UN languages. IPCC’s next major<br />
assessment, the Fourth Assessment Report on<br />
climate change, is currently under preparation<br />
and will be published during 2007.<br />
Predicted warming due to range of IPCC emissions<br />
The <strong>UK</strong> considers that the assessments of the<br />
IPCC provide the most authoritative and<br />
comprehensive picture of all aspects of climate<br />
change. <strong>UK</strong> scientist Professor Martin Parry<br />
co-chairs Working Group II on impacts,<br />
adaptation and vulnerability. The Government<br />
funds a technical unit, which supports him in<br />
this role.<br />
Abrupt and dangerous climate<br />
change<br />
16. As global temperatures continue to increase, the<br />
risks of abrupt and possibly irreversible changes<br />
that would have serious consequences are
What is climate change and why does it matter?<br />
13<br />
increasing. These include substantial melting of<br />
polar ice sheets like those of Greenland and West<br />
Antarctica, which would cause an additional sea<br />
level rise of up to 12 metres, reduction in the<br />
strength of the North Atlantic ocean currents,<br />
which could cause significant cooling in the<br />
North Atlantic and Europe region, and increased<br />
methane emissions following melting of<br />
permafrost or destabilisation of the large<br />
quantities of methane hydrates deposited in<br />
the oceans depths along continental margins.<br />
• emission pathways to climate stabilisation and<br />
technological options available to achieve<br />
them.<br />
20. The conference findings were published by<br />
Cambridge University Press in January <strong>2006</strong> 4 .<br />
The conference concluded that climate change<br />
looks to be worse than expected, that we need<br />
to act urgently to avoid considerable risks and<br />
that the long term costs of mitigation are small<br />
and less than previously stated.<br />
17. Important questions are how the current upward<br />
trend in greenhouse gas emissions can be halted<br />
and how their atmospheric concentrations can<br />
ultimately be stabilised at a level which avoids<br />
these and other potentially dangerous changes;<br />
in the mid-1990s the EU proposed that the aim<br />
should be to limit global temperature rise to no<br />
more than 2ºC to avoid dangerous climate<br />
change.<br />
18. At that time, it was thought that this equated to<br />
atmospheric carbon dioxide levels below<br />
approximately 550 ppm. The more recent work of<br />
the IPCC suggests that a limit closer to 450 ppm<br />
or even lower, might be more appropriate to<br />
meet a 2°C stabilisation limit. Since pre-industrial<br />
times we have already seen a rise from 270 to<br />
about 380 ppm adding urgency to need for<br />
action to reduce emissions sufficiently to avoid<br />
“dangerous levels” of climate change.<br />
19. In order to encourage scientific debate on this<br />
issue, the <strong>UK</strong> Government hosted an<br />
International Symposium on Stabilisation of<br />
Greenhouse Gases, “Avoiding Dangerous <strong>Climate</strong>s<br />
<strong>Change</strong>” 3 in February 2005 at the Met Office,<br />
Exeter. The conference brought together over 200<br />
experts from some 30 countries. Issues including<br />
the long-term implications of different levels of<br />
climate change for different sectors and the<br />
world as a whole were considered. Major themes<br />
included:<br />
• key vulnerabilities of the climate system and<br />
critical thresholds;<br />
How the world might be affected<br />
21. As a result of past and present emissions, some<br />
degree of climate change is now inevitable.<br />
Global temperature is now increasing at 0.17°C<br />
per decade, and is projected by the IPCC to be<br />
between 1.4 and 5.8°C above 1990 levels in<br />
2100. Sea levels could be between 9 and 88<br />
centimetres above 1990 levels by 2100. As<br />
temperature continues to increase the frequency<br />
of droughts and extreme rainfalls are also<br />
expected to increase with a wide range of<br />
impacts on both the natural environment and<br />
human society. The table below summarises some<br />
of the key impacts that are predicted to become<br />
significant at different levels of temperature<br />
change.<br />
Temperature<br />
increase<br />
above preindustrial<br />
1-2ºC<br />
2-3ºC<br />
1-4ºC<br />
2-4.5ºC<br />
Impacts<br />
Major impacts on ecosystems and species;<br />
wide ranging impacts on society<br />
Greenland ice cap starts to melt, major loss<br />
of coral reef ecosystem; considerable<br />
species loss; large impacts on agriculture;<br />
water resources; health; and economies.<br />
Terrestrial carbon sink could become a<br />
source<br />
North Atlantic circulation at increasing risk<br />
of collapse<br />
West Antarctic ice sheet at increasing risk<br />
of collapse<br />
• socio-economic effects, both globally and<br />
regionally; and<br />
3 Further information can be found at: www.stabilisation2005.com<br />
4 “Avoiding Dangerous <strong>Climate</strong> <strong>Change</strong>”, Cambridge University Press, January <strong>2006</strong>.
14<br />
What is climate change and why does it matter?<br />
22. As the table shows, even seemingly small<br />
increases in temperature can have significant<br />
impacts on ecosystems and species, lead to<br />
increasing drought and extreme rainfalls and<br />
imply severe consequences for our society. The<br />
extent to which future climate change will affect<br />
human society and ecosystems across the world<br />
will vary greatly from place to place. The most<br />
vulnerable communities in developing countries<br />
are likely to be affected more severely and will be<br />
least able to cope. <strong>Change</strong>s in rainfall and<br />
drought patterns and storm intensities are likely<br />
to lead to further millions at risk from drought,<br />
famine and disease. Increases in sea level of<br />
almost a metre over the next 100 years bear<br />
potentially devastating consequences for many<br />
coastal areas and low-lying small island states.<br />
Disruption of key components of the climate<br />
system, such as the ice sheets and ocean currents<br />
could have far reaching consequences but it is<br />
very difficult to predict what level of climate<br />
change might trigger such changes.<br />
The economic costs of climate change<br />
damage<br />
23. Increasing attention is being placed on assessing<br />
the economic costs of climate change as it is clear<br />
that extreme weather can have considerable<br />
economic effects. For example, the damage costs<br />
from Hurricane Katrina alone are estimated at<br />
about $135 billion 5 . A measure for assessing<br />
the potential economic damage costs of climate<br />
change is the social cost of carbon (SCC). The<br />
social cost of carbon is the global marginal<br />
damage costs of carbon emissions – in common<br />
language the damage done to the world<br />
economy by every new tonne of emissions<br />
(carbon dioxide or equivalent) added to the<br />
atmosphere. Although estimates differ<br />
considerably, the SCC can provide illustrative<br />
monetary benchmarks for valuing changes in<br />
emissions in cost-benefit analyses.<br />
Social Cost of Carbon<br />
The analytical work in support of the <strong>UK</strong><br />
<strong>Climate</strong> <strong>Change</strong> <strong>Programme</strong> included an<br />
element of cost-benefit analysis that valued<br />
reductions in emissions using estimates from<br />
the Government Economic Service (GES)<br />
Working paper Estimating the Social Cost of<br />
Carbon Emissions, which was published in 2002.<br />
The paper suggested a central value of £70/tC<br />
(within a range of £35 to £140/tC) as an<br />
illustrative estimate for the global damage cost<br />
of carbon emissions. It also suggested that<br />
these estimates should increase by £1/tC per<br />
year in real terms, to reflect the increasing<br />
damage costs of carbon emissions over time.<br />
Finally the GES paper recommended periodic<br />
reviews of the illustrative figures as new<br />
evidence became available.<br />
In 2004, the Inter-departmental Group on the<br />
social cost of carbon (IGSCC) commissioned<br />
further research on the issue. Two research<br />
reports, Social cost of carbon: a closer look at<br />
uncertainty 6 by the Stockholm Environment<br />
Institute, and Methodological Approaches for<br />
Using Social Cost of Carbon Estimates in Policy<br />
Assessment 7 by AEA Technology Environment<br />
have been published by <strong>Defra</strong>.<br />
Both reports will provide relevant input into<br />
the Review of the Economics of <strong>Climate</strong><br />
<strong>Change</strong>, led by Sir Nick Stern, which as part of<br />
its terms of reference is considering evidence<br />
on the economic, social and environmental<br />
consequences of climate change, including<br />
extreme events. Overall, the evidence gathered<br />
by the research reports indicates a comparable<br />
range of estimates to those currently<br />
recommended in the GES paper including the<br />
risk of higher values at the top end of the<br />
range. The Government will consider whether<br />
any revision of the current advice is necessary<br />
once the review has reported in the autumn<br />
<strong>2006</strong>.<br />
5 Swiss Re Sigma Report No 2/<strong>2006</strong> – Natural catastrophes and man-made disasters 2005: high earthquake casualties, new dimension in windstorm losses,<br />
available from: www.swissre.com<br />
6 www.defra.gov.uk/environment/climatechange/carboncost/sei-scc.htm<br />
7 www.defra.gov.uk/environment/climatechange/carboncost/aeat-scc.htm
CHAPTER CHAPTER TWO<br />
International Title framework for action<br />
15<br />
The <strong>UK</strong> Government will:<br />
• build on the progress made at the G8<br />
Summit in Gleneagles and the Montréal<br />
<strong>Climate</strong> <strong>Change</strong> Conference to strengthen<br />
the international regime to tackle climate<br />
change;<br />
• in partnership with the EU enhance our<br />
efforts to help India, China and other<br />
developing countries evolve as low-carbon<br />
economies;<br />
• work to build international consensus on<br />
the scale of global action needed to<br />
stabilise the climate and avoid dangerous<br />
climate change;<br />
• work with EU partners to secure agreement<br />
to further action in the EU, in particular<br />
strenghtening the Emissions Trading<br />
Scheme beyond 2012 and making it the<br />
heart of a global carbon market; and<br />
• support international collaboration and<br />
coordination to ensure the successful<br />
expansion of new technologies, through<br />
action in key areas such as product<br />
standards and research development.<br />
1. <strong>Climate</strong> change is a global problem, with global<br />
causes and effects. Preventing dangerous manmade<br />
climate change and dealing with the impacts<br />
that cannot now be avoided requires efforts by all<br />
countries, consistent with their responsibility for<br />
greenhouse gas emissions, their capacity to take<br />
action, and the effects they will experience. In<br />
2003, the <strong>UK</strong> contributed about 2 per cent of<br />
world greenhouse gas emissions. Our contribution<br />
will fall as we move towards a low-carbon<br />
economy, and as the increasing demand for energy<br />
in developing countries continues to be met. By<br />
2020 our net contribution to world emissions from<br />
fossil fuels will be 1.5 per cent or lower. For that<br />
reason the Government considers it essential that<br />
the <strong>UK</strong> and our EU partners give high priority to<br />
reaching and implementing international<br />
agreements to tackle climate change.<br />
The UNFCCC<br />
2. In recognition of the global nature of the<br />
problem, the United Nations Framework<br />
Convention on <strong>Climate</strong> <strong>Change</strong> (UNFCCC) was<br />
agreed at the Earth Summit in Rio de Janeiro<br />
in 1992. To date 189 countries, including all<br />
major developed and developing countries, have<br />
ratified the Convention. The UNFCCC sets the<br />
overarching objective for multilateral action: to<br />
stabilise greenhouse gas concentrations in the<br />
atmosphere at a level that avoids dangerous<br />
anthropogenic climate change. It also establishes<br />
key principles to guide the international response,<br />
in particular that countries should act consistently<br />
with their responsibility for climate change as well<br />
as their capacity to do so, and that developed<br />
countries should take the lead, given their<br />
historical contribution to greenhouse gas<br />
emissions and the economic development they<br />
have enjoyed as a result. The Convention places a<br />
commitment to act on all countries but whereas<br />
for developing countries this is unquantified and<br />
linked to assistance from developed countries, the<br />
developed countries agreed specifically to aim to<br />
return greenhouse gas emissions to 1990 levels<br />
by 2000. The <strong>UK</strong> was one of relatively few<br />
countries that achieved this, with emissions in<br />
2000 about 13.6 per cent below the1990 level 8 .<br />
The Kyoto Protocol<br />
3. The Parties quickly acknowledged that the<br />
Convention commitments could form only a first<br />
step in the international community’s response to<br />
climate change. The Kyoto Protocol, agreed in<br />
December 1997, sought to address this.<br />
Developed countries agreed to reduce their<br />
overall emissions of a basket of six greenhouse<br />
gases by 5.2 per cent below 1990 levels over the<br />
period 2008-2012, with differentiated, legally<br />
binding targets. The then 15 EU Member States<br />
adopted a collective target to reduce EU<br />
emissions by 8 per cent. Under this ‘bubble’<br />
arrangement the EU’s target is distributed<br />
between Member States to reflect their national<br />
circumstances, requirements for economic<br />
8 13.6 per cent is the fall in all emissions minus all removals between 1990 and 2000. Emissions of Kyoto basket fell by an estimated 13.8 per cent between the<br />
base year and 2000.
16<br />
International framework for action<br />
growth, and scope for further emissions<br />
reductions. Each Member State has a legally<br />
binding target, with the <strong>UK</strong> undertaking to<br />
reduce its emissions by 12.5 per cent.<br />
4. The Protocol also established the innovative flexible<br />
mechanisms to assist in meeting Kyoto targets in<br />
the most efficient and cost-effective manner. This<br />
recognises that as greenhouse gases are emitted<br />
into the atmosphere they will contribute to global<br />
increases in temperature, regardless of the source,<br />
and that equally it does not matter where<br />
reductions are made provided that they are real<br />
reductions. The Kyoto mechanisms are international<br />
emissions trading and two mechanisms, Joint<br />
Implementation (JI) and the Clean Development<br />
Mechanism (CDM), by which credits from emission<br />
reducing projects in one country can be used to<br />
meet the Kyoto target of another country. Under JI,<br />
projects can be hosted in developed countries, and<br />
under CDM, in developing countries.<br />
5. The Kyoto Protocol entered into force in February<br />
2005 and to date has been ratified by 162<br />
countries. Uncertainty about entry into force<br />
of the Kyoto Protocol led to a loss of momentum<br />
in international action and a slow start to the<br />
international carbon market. Crucially, it also<br />
uindermined international political will to address<br />
the increasingly urgent question of what further<br />
action would be taken by countries beyond the<br />
first set of Kyoto targets that expire at the end<br />
of 2012.<br />
Progress in 2005<br />
6. It was against this background that the Prime<br />
Minister put climate change on the international<br />
political agenda in 2005 by making it a priority<br />
for the <strong>UK</strong>’s Presidencies of the G8 and EU. The<br />
effect was to put a strong public and political<br />
spotlight on climate change and encourage<br />
unprecedented international debate by<br />
government ministers, scientists,<br />
parliamentarians, businesses, non-governmental<br />
organisations and other areas of civil society.<br />
7. At their Summit at Gleneagles in July 2005 the<br />
G8 leaders agreed that climate change was a<br />
serious and long-term challenge, that it was<br />
caused by human activity and that urgent action<br />
should be taken to make significant reductions<br />
in greenhouse gas emissions – a significant<br />
statement from countries that had not previously<br />
committed themselves to the case for urgency<br />
so publicly. They also agreed on a package of<br />
actions to combat climate change 9 .<br />
The G8 Gleneagles Plan of Action aims to<br />
increase the speed with which we reduce<br />
greenhouse gas emissions. It includes<br />
improvements to energy efficiency in both<br />
appliances and buildings, cleaner vehicles,<br />
aviation, work on developing cleaner fuels,<br />
renewable energy and promoting research &<br />
development and the financing of future<br />
projects. The World Bank and the International<br />
Energy Agency (IEA) are playing an important<br />
role in supporting the Action Plan. The World<br />
Bank is working to create a framework for<br />
investment in cleaner energy technologies<br />
and in measures necessary for adaptation,<br />
involving the private sector and the regional<br />
development banks. The IEA is analysing<br />
alternative energy strategies and supporting<br />
work on best practice in energy efficiency and<br />
cleaner coal technologies.<br />
8. In addition, G8 leaders agreed, with the leaders<br />
of the other countries invited to attend the<br />
Summit (China, India, Brazil, South Africa and<br />
Mexico), to launch a new Dialogue on “climate<br />
change, clean energy and sustainable<br />
development”.<br />
9 www.fco.gov.uk/Files/kfile/PostG8_Gleneagles_Communique,0.pdf
International framework for action<br />
17<br />
The Gleneagles Dialogue on <strong>Climate</strong> <strong>Change</strong>,<br />
Clean Energy and Sustainable Development<br />
aims to provide a forum for continuing<br />
discussions amongst the G8, China, India, Brazil,<br />
South Africa, Mexico, and other countries with<br />
significant energy needs. It enables participating<br />
countries to work together on the shared<br />
challenges of addressing climate change, energy<br />
security and access to energy.<br />
The Dialogue complements the work of the<br />
UNFCCC and existing organisations, partnerships<br />
and initiatives by providing an informal space to<br />
explore these issues away from the negotiating<br />
room. The Dialogue will also oversee<br />
implementation of the G8 Action Plan. The<br />
Dialogue will report back to G8 leaders under<br />
the Japanese G8 Presidency in 2008.<br />
The first Ministerial meeting of the Dialogue<br />
was held on 1 November 2005 in London. The<br />
Dialogue Partners agreed to work together on:<br />
the deployment of clean technologies;<br />
incentives for investment in low carbon<br />
technologies; co-operation between developed<br />
and developing countries; and action on<br />
adapting to the impacts of climate change. The<br />
next Ministerial meeting will be hosted by the<br />
Government of Mexico in <strong>2006</strong>.<br />
9. Twelve months of intense focus and political<br />
discussion on climate change culminated in<br />
December 2005 at the Montreal UN <strong>Climate</strong><br />
<strong>Change</strong> Conference in a significant set of<br />
important decisions to strengthen international<br />
action. The Parties to the Kyoto Protocol, at their<br />
historic first meeting, adopted the operating rules<br />
and the compliance provisions needed to ensure<br />
that the Protocol and its mechanisms could<br />
function effectively. They also agreed to launch<br />
negotiations on further emissions reductions by<br />
developed country Parties for the period beyond<br />
2012 and to begin preparation for a broader<br />
review of the Protocol at the end of <strong>2006</strong>.<br />
The Convention Parties, including the USA and<br />
Australia, agreed to launch a dialogue on<br />
long term cooperative action to enhance<br />
implementation of the Convention, focusing on<br />
promoting sustainable development, adaptation,<br />
and realising the potential of technology and of<br />
markets, as well as a five-year work programme<br />
on adaptation to the effects of climate change.<br />
The first discussions following up these decisions<br />
will take place in May <strong>2006</strong>.<br />
Next steps<br />
10. The intensive discussions on climate change in<br />
2005 have focused attention on the scale and<br />
urgency of the challenge, based on the<br />
compelling scientific evidence, and the actions<br />
needed to tackle it successfully and meet the<br />
objective of the UN Convention which all<br />
countries are committed to work towards. There<br />
is no longer any real debate over the fact that<br />
climate change is happening and that man-made<br />
emissions are the main cause. The debate has<br />
shifted to how much we need to do to stabilise<br />
the climate, and the economic implications.<br />
11. The IEA projects that $17 trillion of investment is<br />
needed globally by 2030 in energy infrastructure<br />
and that carbon dioxide emissions could increase<br />
by more than 60 per cent over current levels by<br />
2030. It is therefore clear that international<br />
efforts must be urgently directed towards more<br />
effective ways to drive uptake of existing lower<br />
carbon technologies as well as the research,<br />
development and deployment of new ones.<br />
The huge investment in energy systems in the<br />
emerging economies like China and India, and<br />
the long lifetime of such investments, makes it<br />
essential to ensure that these countries have<br />
access to the most efficient, lowest carbon<br />
technologies and that international financial<br />
institutions take full account of climate change in<br />
their investment decisions to enable them to<br />
continue to grow sustainably. The significant role<br />
of the private sector alongside governments<br />
creates a need to incentivise both private and<br />
public choices of lower carbon technologies.<br />
And the fact that a certain degree of climate<br />
change is now inevitable and its consequences<br />
are already being felt means that more urgent<br />
and effective support to poor and vulnerable<br />
countries is needed to cope with the impacts,
18<br />
International framework for action<br />
harnessing the efforts of the many bodies<br />
engaged in development.<br />
12. The Government will therefore continue to show<br />
leadership in <strong>2006</strong> and beyond in maintaining the<br />
high international political profile of climate<br />
change as countries consider the further action<br />
needed. We will be working for speedy progress<br />
in multilateral discussions in the UNFCCC and<br />
also in associated fora such as the Commission<br />
on Sustainable Development (CSD), which is<br />
currently working on climate change and<br />
associated topics 10 . The UNFCCC is the only<br />
forum in which binding international agreements<br />
on emissions reductions can be made, and<br />
binding agreements will be needed to underpin<br />
political and market confidence. But other<br />
organisations, informal discussions and<br />
partnerships will also have an essential<br />
complementary role in exploring how countries<br />
can work together, sharing experience and<br />
building political will and confidence. We will<br />
work with G8 partners, particularly the Russian<br />
G8 Presidency in <strong>2006</strong> and the subsequent<br />
German and Japanese Presidencies, to deliver on<br />
the commitments in the G8 Action Plan and build<br />
on the agreement reached at Gleneagles. The<br />
Government believes that the Gleneagles<br />
Dialogue will be able to make an important<br />
contribution to accelerating international progress<br />
in tackling climate change.<br />
13. The Government also believes that a high priority<br />
for driving action on the scale and with the<br />
urgency needed to deliver a long term shift<br />
towards a global low-carbon economy is for<br />
governments to give an early signal about the<br />
long term direction of policy that is sufficiently<br />
clear to drive investment decisions. Without that<br />
there will be insufficient confidence among<br />
business and in the fledgling carbon market.<br />
The Government therefore believes that the<br />
political debate in <strong>2006</strong> should focus in particular<br />
on building consensus on the scale of action<br />
needed to stabilise the climate and avoid<br />
dangerous climate change, the costs and benefits<br />
of taking such action and the long term signals<br />
that are needed to drive it.<br />
14. A key element of the international debate will be<br />
how countries can develop sound, effective and<br />
timely responses to climate change whilst<br />
maintaining the health of their economies and<br />
their competitiveness. It will be important to<br />
engage economic policymakers and institutions<br />
in this. The Review of the Economics of <strong>Climate</strong><br />
<strong>Change</strong>, within the context of existing national<br />
and international climate change policy, will help<br />
the Government to understand more<br />
comprehensively the nature of the economic<br />
challenges and how they can be met, in the <strong>UK</strong><br />
and globally.<br />
<strong>UK</strong> bilateral co-operation on climate<br />
change<br />
15. The <strong>UK</strong> works bilaterally in partnership with<br />
a number of countries on both mitigation<br />
and adaptation measures in order to build<br />
understanding of the urgency of tackling climate<br />
change and possible solutions. In 2004, the <strong>UK</strong><br />
and China agreed to establish a bilateral working<br />
group on climate change. <strong>Defra</strong> has been<br />
working with the Chinese Ministry of Science<br />
and Technology since 2001 on the impacts on<br />
agriculture in China. The first phase was a<br />
research project on the impacts of climate change<br />
on four key agricultural crops – cotton, rice,<br />
wheat and maize. The second phase, launched<br />
in September 2005, consists of national and<br />
regional components taking forward the earlier<br />
work and will explore the effect of climate<br />
change on water availability and the impact of<br />
this on projected crop yields. The <strong>UK</strong> also<br />
supports activities to accelerate the deployment<br />
of renewable energy and improve energy<br />
efficiency in China, primarily through the<br />
Renewable Energy and Energy Efficiency<br />
Partnership (REEEP).<br />
10CSD’s second implementation cycle focuses on climate change, energy for sustainable development, industrial development, and air pollution/atmosphere.
International framework for action<br />
19<br />
REEEP is a public-private partnership that was<br />
launched by the United Kingdom along with<br />
other partners at the Johannesburg World<br />
Summit on Sustainable Development in August<br />
2002. It has been developed via an intensive<br />
consultation process in 2003 covering a wide<br />
range of stakeholders at the national and<br />
regional levels.<br />
In June 2004, REEEP was formally established as<br />
a legal entity in Austria with the status of an<br />
International NGO. The partnership actively<br />
structures policy initiatives for clean energy<br />
markets and facilitates financing mechanisms<br />
for sustainable energy projects.<br />
16. In 2005 the <strong>UK</strong> and India announced the<br />
intention for a structured dialogue on climate<br />
change. A number of activities have since been<br />
taken forward. In November 2005, the <strong>UK</strong> and<br />
India announced the launch of a joint study on<br />
how to reinforce co-operation on energy<br />
technology between developed and developing<br />
countries. The study will look to address concerns<br />
over barriers to technology transfer and in<br />
particular the issue of Intellectual Property Rights<br />
(IPR). <strong>Defra</strong> also funded a collaborative project<br />
with the Indian Ministry of Environment and<br />
Forests involving eight Indian research institutions<br />
that looked into the effects of climate change in<br />
India. The results were reported in September<br />
2005, and a second phase of the project is under<br />
development. India hosts the South Asia Regional<br />
Secretariat for REEEP, and through REEEP the <strong>UK</strong><br />
is funding initiatives to promote the acceleration<br />
of renewable energy and improvement of energy<br />
efficiency in India.<br />
17. March <strong>2006</strong> saw the launch of the <strong>UK</strong>-Brazil<br />
working group on climate change, which focuses<br />
on the promotion of low-carbon technology<br />
globally, improved scientific collaboration on<br />
assessing the impacts of climate change and the<br />
further development of Brazil’s leading role in the<br />
emerging Latin American carbon market. The<br />
working group will also examine the links<br />
between climate change, poverty eradication<br />
and social development.<br />
18. At the G8 Environment and Development<br />
Ministers’ meeting in March 2005, the <strong>UK</strong><br />
announced funding of £100k towards regional<br />
predictions of climate change for Africa and<br />
£400k over the next three years towards a new<br />
multi-country initiative on advancing knowledge,<br />
capacity and networks in support of climate<br />
change in Africa.<br />
European Union<br />
19. Both the European Community and the individual<br />
Member States are Parties to the UN Convention<br />
and the Kyoto Protocol. The European Union has<br />
always taken a strong lead in pushing for global<br />
action to tackle climate change: the EU<br />
negotiates as a bloc, which gives it a powerful<br />
voice in the UN discussions, and the Commission<br />
and Member States work together to promote<br />
effective international action. In recent years the<br />
EU, as a major signatory of the Kyoto Protocol,<br />
has played a key role in keeping the UN climate<br />
change process on track through its<br />
determination to put in place measures to meet<br />
Kyoto targets, and in particular its pioneering<br />
activity on emissions trading. This commitment<br />
underpins the EU’s influential position in formal<br />
and informal international discussions – including<br />
at the recent Montreal Conference, where the<br />
European Union, under the <strong>UK</strong> Presidency, played<br />
a leading role in securing agreement from all<br />
parties to discuss further international action.<br />
European <strong>Climate</strong> <strong>Change</strong> <strong>Programme</strong><br />
20. Member States have agreed that European-level<br />
policies and measures are essential to help them<br />
deliver their Kyoto targets. Some measures can be<br />
delivered most effectively at Community level. In<br />
some sectors, for example, there is a strong, single<br />
market case for European action. Other measures<br />
could have little impact if taken at a national level<br />
or could harm the competitiveness of the industry<br />
in the Member State concerned. European-level<br />
co-ordination also gives Member States a valuable<br />
opportunity to share experience and expertise on<br />
action to reduce greenhouse gas emissions.
20<br />
International framework for action<br />
21. In 2000 the European <strong>Climate</strong> <strong>Change</strong><br />
<strong>Programme</strong> (ECCP) was launched, to identify and<br />
develop the necessary elements of an EU strategy<br />
to implement the Kyoto Protocol. Between 2001<br />
and 2003, a package of priority actions to tackle<br />
climate change was put in place, including the<br />
Directive setting up the EU emissions trading<br />
scheme 11 , as well as Directives on the promotion<br />
of electricity from renewable energy sources 12 , on<br />
the energy performance of buildings 13 , and on<br />
the promotion of biofuels 14 .<br />
22. The EU’s latest estimate of progress towards<br />
meeting its Kyoto target is that, as a result of<br />
measures in place or planned purchases of<br />
emissions credits, the EU is on track to lower<br />
projected emissions in 2010 by 9.3 per cent<br />
below base year levels 15 .<br />
EU medium- and long-term strategy<br />
23. Since 2004 the EU has been working to develop<br />
its strategy for the period beyond 2012,<br />
addressing both international and EU action for<br />
the medium and long term. The process is driven<br />
by EU leaders in the European Council, reflecting<br />
the fact that climate change is a major strategic<br />
challenge for the EU with implications for all<br />
sectors of the economy and requiring<br />
co-ordinated action to tackle both the causes and<br />
effects. The extent of the challenge and the<br />
possible responses were reflected in the European<br />
Commission’s February 2005 Communication,<br />
Winning the Battle Against <strong>Climate</strong> <strong>Change</strong>.<br />
Ministers’ conclusion that reductions of the order<br />
of 60-80 per cent by 2050 should be considered.<br />
EU Heads of Government underlined the<br />
importance of the EU engaging with other<br />
countries both on strategies for achieving further<br />
emissions reductions and on options for further<br />
action within the UN framework.<br />
25. Work is continuing to develop the medium and<br />
long term strategy. In October 2005 the<br />
Commission launched a new phase of the ECCP<br />
to consider further measures to contribute<br />
towards the EU’s Kyoto Protocol target and<br />
beyond. This will include geological carbon<br />
capture and storage, passenger road transport,<br />
aviation, and non-carbon dioxide emissions. For<br />
the first time, the ECCP will also consider<br />
adaptation to the impacts of climate change.<br />
During the <strong>UK</strong> Presidency the Government put<br />
particular emphasis on the involvement in climate<br />
change policy development of Ministers covering<br />
all relevant policy areas, including energy,<br />
competitiveness and agriculture.<br />
26. Under the <strong>UK</strong>’s Presidency, climate change<br />
featured prominently in the EU’s bilateral<br />
discussions with China and India at Head of<br />
Government level, with the successful agreement<br />
of the EU-China Partnership on climate change<br />
and the EU-India Initiative on clean development<br />
and climate change.<br />
24. In March 2005 the European Council moved the<br />
process forward significantly by identifying<br />
ambitious greenhouse gas emissions reductions<br />
pathways to be considered by developed<br />
countries, consistent with the EU’s objective of<br />
limiting average global temperature increase to<br />
no more than 2ºC above pre-industrial levels. EU<br />
leaders agreed that developed countries should<br />
consider emissions reductions in the order of<br />
15-30 per cent by 2020 compared to 1990 levels.<br />
They also stressed that longer-term cuts were<br />
essential, consistent with EU Environment<br />
11Directive 2003/87/EC.<br />
12Directive 2001/77/EC.<br />
13Directive 2002/91/EC.<br />
14Directive 2003/30/EC.<br />
15“Report on Demonstrable Progress under the Kyoto Protocol”, December 2005 –<br />
www.europa.eu.int/comm/environment/climat/pdf/demonstrable_progress_kyoto_2005.pdf
International framework for action<br />
21<br />
In September 2005, EU summits with China and<br />
India resulted in an EU-China Partnership on<br />
<strong>Climate</strong> <strong>Change</strong> and an EU-India Initiative on<br />
Clean Development and <strong>Climate</strong> <strong>Change</strong>.<br />
Through these initiatives the EU aims to scale<br />
up efforts for development, deployment and<br />
transfer of low carbon energy technologies as<br />
well as to increase co-operation on adaptation<br />
to climate change.<br />
A centre-piece of the EU-China Partnership on<br />
<strong>Climate</strong> <strong>Change</strong> was a new initiative on Near-<br />
Zero Emissions Coal with carbon capture and<br />
storage. The <strong>UK</strong> is leading the first phase of<br />
the project, supporting it with £3.5m of<br />
funding. The three-year feasibility study will<br />
examine the viability of different technology<br />
options for the capture of carbon emissions<br />
from power generation and the potential for<br />
geological storage in China.<br />
The EU-India Initiative on Clean Development<br />
and <strong>Climate</strong> <strong>Change</strong> aims to encourage and<br />
promote sustainable patterns of consumption<br />
and production to lessen the causes and the<br />
adverse impacts of climate change. India and<br />
the EU will also co-operate on improving<br />
adaptation to current climate variability and<br />
future climate change, and on one integration<br />
of adaptation concerns into sustainable<br />
development strategies.<br />
27. The EU-Russia Summit reaffirmed both parties’<br />
commitment to tackling climate change, and<br />
to the Kyoto Protocol and its effective<br />
implementation, and bolstered co-operation<br />
on energy and energy efficiency.<br />
28. EU leaders in the European Council are<br />
expected to return to the issue of considering a<br />
medium and long-term strategy under the Finnish<br />
Presidency in the second half of <strong>2006</strong>, when they<br />
will be able to reflect on further cost-benefit<br />
analysis by the Commission of action to reduce<br />
emissions, and on the outcome of the review of<br />
the ECCP.<br />
29. The Government strongly supports the<br />
development of the EU’s medium- and long-term<br />
strategy as an important signal of the EU’s<br />
continuing determination to show leadership in<br />
shaping the international response to climate<br />
change, both through its own actions and by<br />
developing and sharing proposals for<br />
strengthening international action. To be<br />
effective, it will be essential for the EU’s work on<br />
climate change and energy strategy development<br />
to be closely linked. The <strong>UK</strong> believes that a key<br />
priority for the EU is to give a firm signal about<br />
the medium and long term direction of EU policy<br />
to reduce greenhouse gas emissions and the<br />
continuing role of the EU emissions trading<br />
scheme in delivering emissions cuts beyond 2012.<br />
Without confidence in the EU’s determination to<br />
move decisively towards a low-carbon economy,<br />
business investment in the technologies needed<br />
to deliver deep cuts in emissions will simply not<br />
take place. The <strong>UK</strong> also believes that the EU<br />
should expand its outreach to other countries,<br />
supported by Community resources such as the<br />
Country Strategy <strong>Programme</strong>s and Research<br />
Framework <strong>Programme</strong>, and building in particular<br />
on the EU-China and India partnerships. The EU<br />
should direct significant future resources towards<br />
supporting its internal and external climate<br />
change objectives, in particular on co-operation<br />
with developing countries on research and<br />
development, technology and capacity building.<br />
The international carbon market<br />
30. The Government believes that, by providing for<br />
emissions savings to be made at the point of least<br />
cost, emissions trading is the most promising<br />
mechanism for stimulating international<br />
investment in low-carbon technology. The<br />
Government has been a strong advocate of the<br />
EU emissions trading scheme since its inception.<br />
The <strong>UK</strong> Government has made it a priority to<br />
work with the European Commission on its<br />
review of the EU emissions trading scheme post-<br />
2012. Our policy for the second phase of the<br />
scheme is set out in the “Business” chapter<br />
in Section 2.<br />
31. The EU Environment Council acknowledged in<br />
October 2005 that the scheme will remain an
22<br />
International framework for action<br />
essential instrument in the EU’s medium and long<br />
term strategy to tackle climate change. The <strong>UK</strong><br />
believes that the true potential for emissions<br />
trading to achieve global emissions reductions will<br />
only be delivered through the continued<br />
international extension of the carbon market<br />
outside Europe. Our international work on<br />
developing the Kyoto Protocol project<br />
mechanisms and promoting the use of emissions<br />
trading outside the EU recognises this as a<br />
priority.<br />
32. Since the Kyoto Protocol was adopted, the <strong>UK</strong><br />
has been active in developing the detailed rules<br />
and implementation of the project mechanisms of<br />
the Clean Development Mechanism (CDM) and<br />
Joint Implementation (JI). At the Montreal UN<br />
<strong>Climate</strong> <strong>Change</strong> Conference, the <strong>UK</strong>, holding the<br />
EU Presidency, played a key role in strengthening<br />
CDM institutions and procedures at UN level,<br />
establishing the framework for JI and the<br />
timetable for the deployment and linking of UN<br />
registry systems. Over $8m in additional funding<br />
was agreed to fund CDM administrative activities<br />
this year.<br />
schemes consistent with a multilateral approach<br />
to dealing with climate change but successful<br />
linking will also lead to greater economic<br />
efficiency, as cost-effectiveness and liquidity<br />
increase with market size, and as clearer signals<br />
for investment emerge through the establishment<br />
of a single price of carbon across all linked<br />
schemes. During 2005, we have continued to<br />
exchange information with those developing<br />
emissions trading schemes outside the EU,<br />
including a successful event at the Montreal UN<br />
<strong>Climate</strong> <strong>Change</strong> Conference which reviewed the<br />
prospects for linking trading schemes and areas<br />
such as monitoring and reporting where the use<br />
of common standards might play a role. The<br />
Government considers that the international<br />
carbon market has a vital role to play in the<br />
future of climate change policy and will continue<br />
to prioritise further work in this area, which in<br />
time could lead to the emergence of a global<br />
network of linked trading schemes.<br />
33. Through the EU Linking Directive, companies with<br />
obligations under the EU emissions trading<br />
scheme can now make use of credits from these<br />
mechanisms, leading to increased investment in<br />
overseas projects aimed at reducing emissions of<br />
the basket of six greenhouse gases. The <strong>UK</strong> is a<br />
leading investor country in the CDM. By the end<br />
of February <strong>2006</strong>, the <strong>UK</strong> was ranked second<br />
investor country in terms of number of registered<br />
projects with <strong>UK</strong> approval of participation. The<br />
<strong>UK</strong> designated national authority for CDM had<br />
issued 48 letters of approval of participation by<br />
17 <strong>UK</strong> companies in 38 CDM projects in 11<br />
countries. These are estimated to deliver annual<br />
reductions of up to almost 30 million tonnes<br />
carbon dioxide equivalent.<br />
34. At the same time, the Government has also been<br />
active in promoting the development of domestic<br />
emissions trading schemes in countries outside<br />
Europe and the potential for establishing links<br />
between those schemes and the EU emissions<br />
trading scheme. Not only is the linking of trading
SECTION<br />
2<br />
Delivering emissions reductions
24<br />
CHAPTER ONE<br />
<strong>UK</strong> emissions inventory and projections<br />
1. The <strong>Climate</strong> <strong>Change</strong> <strong>Programme</strong> is designed to<br />
deliver the <strong>UK</strong>’s Kyoto Protocol target of reducing<br />
emissions of the basket of six greenhouse gases<br />
by 12.5 per cent below base year levels over the<br />
commitment period 2008-2012, and move the<br />
<strong>UK</strong> close to the domestic goal to reduce carbon<br />
dioxide emissions by 20 per cent below 1990<br />
levels by 2010. It also aims to put the <strong>UK</strong> on a<br />
path to cutting carbon dioxide emissions by some<br />
60 per cent by about 2050, with real progress<br />
by 2020.<br />
2. This chapter includes information on historical<br />
trends of the <strong>UK</strong>’s greenhouse gas emissions<br />
since 1990 and sets out projections to 2020.<br />
These projections are defined as baseline with<br />
measures. They include the ongoing impact of<br />
existing policies and the effect of measures that<br />
the Government has introduced since the Kyoto<br />
Protocol was agreed. The projections do not<br />
reflect the impact of the additional policies and<br />
measures set out in the remainder of this Section.<br />
The Bringing it all together chapter summarises<br />
the baseline with measures projections and the<br />
impact of additional policies and measures in<br />
order to estimate the total level of emissions<br />
reductions that the <strong>Programme</strong> is expected<br />
to deliver.<br />
Base year<br />
3. The base year for the purposes of assessing<br />
progress towards the Kyoto Protocol target is a<br />
combination of 1990 and 1995 data. 1990 is the<br />
base year for emissions of carbon dioxide (CO 2<br />
),<br />
methane (CH 4<br />
) and nitrous oxide (N 2<br />
O). The <strong>UK</strong><br />
has chosen to use 1995 as the base year for<br />
emissions of hydrofluorocarbons (HFCs),<br />
perfluorocarbons (PFCs) and sulphur hexafluoride<br />
(SF 6<br />
) in accordance with the Kyoto Protocol which<br />
allows Parties the flexibility to choose either 1990<br />
or 1995 as the base year for the industrial gases.<br />
Using a 1995 base year is in line with the<br />
approach other EU Member States are adopting.<br />
Convention and Kyoto accounting<br />
4. The <strong>UK</strong> will report land use, and use change and<br />
forestry (LULUCF) emissions and removals in<br />
accordance with separate rules for reporting on<br />
this sector under the UNFCCC and the Kyoto<br />
Protocol. The Convention reporting basis includes<br />
all human-induced changes to land-based carbon<br />
stocks i.e. total emissions minus total removals<br />
from the LULUCF sector. This is consistent with<br />
the Intergovernmental Panel on <strong>Climate</strong> <strong>Change</strong><br />
(IPCC) 1996 guidelines. It is on this basis that the<br />
Government assesses and reports progress<br />
towards the domestic carbon dioxide goal 15 .<br />
5. The Kyoto reporting basis includes only LULUCF<br />
emissions and removals associated with<br />
mandatory activities under Article 3.3 of the<br />
Kyoto Protocol, which are afforestation,<br />
reforestation and deforestation occurring since<br />
1990, and forest management as an elective<br />
activity under Article 3.4 of the Kyoto Protocol.<br />
The <strong>UK</strong> has decided not to account for cropland<br />
or grazing land management or revegetation<br />
which are other options under Article 3.4<br />
because of the additional uncertainties associated<br />
with the detailed monitoring of these activities<br />
required under the Protocol. In addition, a small<br />
allowance related to deforestation emissions in<br />
1990 is included in our base year estimate, as<br />
required by Article 3.7 of the Kyoto Protocol and<br />
subsequent decisions of the COP.<br />
Greenhouse gas emissions inventory<br />
and trends<br />
6. In 1990, the <strong>UK</strong>’s emissions of the six greenhouse<br />
gases covered by the Kyoto Protocol were about<br />
209 million tonnes of carbon (MtC) 16 . Action in<br />
the <strong>UK</strong> is already driving a significant reduction in<br />
emissions, with annual emissions falling by about<br />
14.6 per cent between 1990 and 2004. Carbon<br />
dioxide emissions were 161.5 MtC in 1990 and<br />
fell by about 5.6 per cent between 1990 and<br />
2004. Figure 1 shows emissions of carbon dioxide<br />
and the basket of all six greenhouse gases<br />
included in the Kyoto Protocol target, over the<br />
period 1990 to 2004.<br />
15 The Government will also use any credits generated through the Kyoto mechanisms in its assessment of progress towards the domestic target.<br />
16 Greenhouse gas emissions are expressed throughout this document as million tonnes of carbon equivalent (MtC). One tonne of carbon is contained in 3.67<br />
tonnes of carbon dioxide which is the ratio of the molecular weight of carbon dioxide to the atomic weight of carbon (i.e. 44/12). Other gases are expressed<br />
in terms of carbon equivalent by multiplying their emissions by their global warming potential (GWP) and dividing by 3.67.
<strong>UK</strong> emissions inventory and projections<br />
25<br />
<strong>UK</strong> emissions of greenhouse gases 1990-2004<br />
MtCe<br />
250<br />
200<br />
150<br />
100<br />
50<br />
0<br />
1990<br />
Basket of six greenhouse gases<br />
Carbon dioxide<br />
1995<br />
2000<br />
2005<br />
Source: <strong>UK</strong> greenhouse gas inventory 1990-2004<br />
Kyoto target<br />
2008-2012<br />
Carbon dioxide<br />
goal 2010<br />
2010<br />
7. The reduction in greenhouse gas emissions since<br />
1990 has mainly been driven by restructuring,<br />
especially in the energy supply industry; energy<br />
efficiency; pollution control measures in the<br />
industrial sector and other policies that reduced<br />
emissions of non-CO 2<br />
greenhouse gases.<br />
Compared with what would have happened<br />
otherwise, it is estimated that greenhouse gas<br />
emissions in 2004 could have been some 15 per<br />
cent higher, rather than almost 15 per cent lower,<br />
than in the base year.<br />
8. The total annual reduction of all greenhouse<br />
gases since the base year is therefore estimated<br />
at about 30 per cent of base year emissions or<br />
some 65 MtC in 2004. Of this it is estimated<br />
that:<br />
• improved energy efficiency represents about<br />
35 per cent of the total reduction;<br />
• fall in non-CO 2<br />
greenhouse gas emissions<br />
contributed about 30 per cent;<br />
900<br />
800<br />
700<br />
600<br />
500<br />
400<br />
300<br />
200<br />
100<br />
• restructuring of the energy supply sector in<br />
the mid-1990s, with fuel switching from coal<br />
to gas, which led to an increase in the<br />
proportion of gas in the energy mix,<br />
contributed around 25 per cent; and<br />
• greater use of other lower carbon fuels,<br />
higher nuclear output, more renewable<br />
energy and other fuel switching, contributed<br />
around 10 per cent.<br />
0<br />
MtCO 2<br />
e<br />
Carbon dioxide<br />
9. Carbon dioxide is the main greenhouse gas in the<br />
<strong>UK</strong>. It contributed around 77 per cent of the <strong>UK</strong>’s<br />
total emissions of greenhouse gases in 1990 or<br />
161.5 MtC. The main driver behind the reduction<br />
in emissions between 1990 and 2004 comes<br />
from the power generation sector. While carbon<br />
dioxide emissions from power stations fell by<br />
16 per cent 17 between 1990 and 2004, electricity<br />
consumption increased by 17 per cent. The<br />
reason that emissions did not increase in line with<br />
electricity consumption was largely due to a<br />
switch from coal to gas in electricity generation,<br />
together with improved reliability and<br />
performance from nuclear generation. There have<br />
also been increases in the use of renewable<br />
energy and combined heat and power.<br />
10. Carbon dioxide emissions presented here take<br />
into account carbon emission factor revisions that<br />
have been implemented since the consultation<br />
document for the review of the <strong>UK</strong> <strong>Climate</strong><br />
<strong>Change</strong> <strong>Programme</strong> was published in December<br />
2004 18 . Emission factor revisions affect the whole<br />
historical time series and the projections.<br />
Methane<br />
11. Methane is the second most important<br />
greenhouse gas in the <strong>UK</strong> after carbon dioxide. It<br />
contributed 12 per cent of the <strong>UK</strong>’s total<br />
emissions of greenhouse gases in 1990 or 25.1<br />
MtC. The major sources were landfill waste,<br />
agriculture, natural gas distribution and coal<br />
mining. Annual emissions fell by about 50 per<br />
cent below 1990 levels to 12.5 MtC in 2004.<br />
Emissions from all the main sources of methane<br />
in the <strong>UK</strong> have fallen since 1990.<br />
12. Methane emissions from landfill sites have<br />
recently been revised upwards due to the revision<br />
of gas collection and oxidation efficiencies 19 .<br />
These revisions affect the whole historical time<br />
series and the projections.<br />
17 This percentage excludes emissions of carbon from Flue Gas Desulphurisation (FGD) units fitted to <strong>UK</strong> power stations. In 2004 these emissions were 0.08<br />
MtC.<br />
18 www.defra.gov.uk/corporate/consult/ukccp-review/ccpreview-consult.pdf<br />
19 <strong>UK</strong> Landfill Methane Emissions: Evaluation and Appraisal of Waste Policies and Projections to 2050, Golder Associates, November 2005.
26<br />
<strong>UK</strong> emissions inventory and projections<br />
Nitrous oxide<br />
13. Emissions of nitrous oxide from the <strong>UK</strong> in 1990<br />
were 18.6 MtC or 9 per cent of the <strong>UK</strong>’s total<br />
greenhouse gas emissions. The major sources<br />
were agricultural soils and industrial processes,<br />
particularly fugitive emissions from adipic acid<br />
manufacture. Emissions from this source have<br />
now been reduced significantly due to the<br />
introduction of abatement technology in 1998.<br />
Nitrous oxide emissions from road transport have<br />
increased due to the rise in the number of petrolfuelled<br />
motor vehicles fitted with three-way<br />
catalytic converters to reduce emissions of<br />
hydrocarbons, carbon monoxide and other<br />
nitrogen oxides (NO and NO2). Annual emissions<br />
of nitrous oxide fell by 40.4 per cent below 1990<br />
levels to 11.1 MtC in 2004.<br />
14. Estimates of nitrous oxide emissions from<br />
agricultural soils are currently under review and<br />
may be revised in future. This is unlikely to have a<br />
significant effect on the overall trend in nitrous<br />
oxide emissions.<br />
Fluorinated gases<br />
15. Although emissions of the fluorinated or<br />
industrial gases are small in absolute terms, these<br />
gases generally have high global warming<br />
potentials (GWP) 20 . Emissions of all fluorinated<br />
gases from the <strong>UK</strong> in 1995 (as indicated above,<br />
1995 is the <strong>UK</strong>’s base year for the fluorinated<br />
gases) were 4.7 MtC or 2.4 per cent of <strong>UK</strong> total<br />
greenhouse gas emissions in that year. Use of<br />
HFCs rose in the early to mid-1990s in response<br />
to the phase out of chlorofluorocarbons (CFCs)<br />
and hydrochlorofluorocarbons (HCFCs) under the<br />
Montréal Protocol 21 and accounted for 90 per<br />
cent of the total fluorinated basket in 1995. The<br />
major source in 1995 was fugitive emissions of<br />
HFC-23 from the manufacture of the refrigerant<br />
and chemical feedstock, HCFC-22.<br />
16. Emissions of HFCs have fallen by 42.8 per cent<br />
between 1995 and 2004, mainly due to the<br />
introduction of thermal oxidiser pollution<br />
abatement equipment at the two <strong>UK</strong> plants<br />
where HCFC-22 is manufactured. Emissions of<br />
PFCs have reduced by 25.2 per cent between<br />
1995 and 2004. This is mainly due to the<br />
introduction of improved technology in the<br />
aluminium production sector that has led to<br />
lower process emissions. SF 6<br />
is used in four main<br />
markets: electrical insulation, magnesium<br />
smelting, electronics and training shoes. Total use<br />
of SF 6<br />
has decreased from these end use markets<br />
by 9 per cent between 1995 and 2004.<br />
Projections of <strong>UK</strong> greenhouse<br />
gas emissions<br />
17. Even without the additional measures included in<br />
the <strong>Programme</strong>, the <strong>UK</strong>’s emissions of the basket<br />
of six greenhouse gases are expected to be about<br />
19.4 per cent 22 below base year levels in 2010.<br />
The <strong>UK</strong> is therefore on track to meet its Kyoto<br />
Protocol target. Emissions by sources minus<br />
removals by sinks of carbon dioxide are projected<br />
without additional measures to be about 10.6 per<br />
cent below 1990 levels in 2010. This means<br />
further effort is required to move the <strong>UK</strong> closer to<br />
its domestic goal to reduce carbon dioxide<br />
emissions by 20 per cent below 1990 levels by<br />
2010.<br />
18. Tables in this Section show historical greenhouse<br />
gas emissions data and baseline with measures<br />
projections classified in three different ways – by<br />
gas, by sector and by end user. The first table<br />
includes historical greenhouse gas emissions for<br />
the <strong>UK</strong>’s base year, 1990, 1995, 2000 and 2004<br />
and baseline with measures projections for 2010,<br />
2015 and 2020, disaggregated by gas 23 . The<br />
20 Global warming potentials are used by Parties to the UNFCCC to compare the relative climate effects of greenhouse gases by assessing their contribution<br />
to changes in the net downward infrared radiation flux at the tropopause (the top of the lower atmosphere) over a period of time. GWP provides the<br />
contribution of a unit emission of a greenhouse gas relative to the effect of a unit emission of carbon dioxide integrated over a fixed time period. A 100-year<br />
time horizon has been chosen by the Convention in view of the relatively long time scale for addressing climate change.<br />
21 www.ozone.unep.org/Treaties_and_Ratification/2B_montreal_protocol.asp<br />
22 This figure includes the effect of the mandatory Art 3.3 ARD activities and the Forest Management ‘cap’ in the LULUCF sector in accordance with the<br />
choices that the <strong>UK</strong> has made under Art 3.4.<br />
23 CO 2<br />
energy projections are based on the greenhouse gas inventory published in 2005 which agrees with the inventory published in January <strong>2006</strong> to about<br />
0.01 per cent for total CO 2<br />
emissions on average over the period 1990 to 2003, with individual years differing by up to about 0.4 per cent. The energy<br />
projections will be updated to be based on the <strong>2006</strong>. Other projections have already been updated for consistency with this inventory.
<strong>UK</strong> emissions inventory and projections<br />
27<br />
historical time series of emissions set out in this<br />
<strong>Programme</strong> is based on the <strong>UK</strong> greenhouse gas<br />
inventory published in <strong>2006</strong> covering the period<br />
1990 to 2004 24 . The methodologies used to<br />
generate the projections are described in Annex<br />
A and the uncertainties associated with the<br />
projections are set out by gas in Annexes B-E.<br />
19. The calculation of the <strong>UK</strong>’s base year for<br />
reporting under the Kyoto Protocol includes a<br />
small allowance representing emissions from<br />
Deforestation in 1990. This allowance (0.1<br />
MtC/year in 1990) is calculated in accordance<br />
with rules associated with Article 3.7 of the<br />
Kyoto Protocol and forms part of a Party’s<br />
assessment of progress towards meeting its<br />
Kyoto target.<br />
20. The same historical data and baseline with<br />
measures projections from Table 1 are set out in<br />
Table 2, grouped by sectors consistent with the<br />
UNFCCC’s reporting guidelines 25 . Table 2 shows<br />
how historical and projected greenhouse gas<br />
emissions are distributed across the <strong>UK</strong> economy.<br />
In this classification, the emissions from the<br />
energy supply sector which includes emissions<br />
from power stations, refineries and other energy<br />
supply industries are shown separately.<br />
21. Table 3 shows another way of looking at how<br />
historical and projected greenhouse gas emissions<br />
are distributed across the <strong>UK</strong> economy. In this<br />
classification, the emissions from power stations,<br />
refineries and other energy supply industries are<br />
re-allocated to the end users of the electricity,<br />
petroleum products and other fuels. There is<br />
therefore no separate line for the energy supply<br />
industry. This classification gives the most<br />
complete account of the relationship between<br />
emissions and the production of goods and<br />
services. It is called the end user classification.<br />
22. Tables 4 and 5 show emissions of carbon dioxide<br />
by source and by end user respectively, grouped<br />
by sector<br />
Table 1: <strong>UK</strong> greenhouse gas emissions, MtC<br />
Gas Base Year 1990 1995 2000 2004 2010 2015 2020<br />
Total carbon dioxide 26 161.5 161.5 149.9 149.0 152.5 144.3 149.0 146.6<br />
Methane 25.1 25.1 21.8 16.3 12.5 10.8 10.0 9.5<br />
Nitrous oxide 18.6 18.6 15.5 12.1 11.1 11.0 11.0 11.0<br />
Hydrofluorocarbons 4.2 3.1 4.2 2.5 2.4 2.7 2.6 2.5<br />
Perfluorocarbons 0.1 0.4 0.1 0.1 0.1 0.1 0.1 0.1<br />
Sulphur hexafluoride 0.3 0.3 0.3 0.5 0.3 0.4 0.3 0.3<br />
Total greenhouse gas emissions 27 209.9 209.0 191.9 180.5 178.9 169.2 173.0 170.0<br />
Total greenhouse gas emissions<br />
including only mandatory<br />
Art 3.3 LULUCF activities 28 209.5 208.2 191.6 180.3 179.0 168.9 172.1 168.5<br />
<strong>Change</strong> from base year levels<br />
(for row above) -0.6% -8.5% -13.9% -14.6% -19.4% -17.9% -19.6%<br />
Note: the percentage changes and emission estimates may differ slightly due to rounding<br />
24 <strong>UK</strong> Greenhouse Gas Inventory, 1990 to 2004, only data tables available at present. Full report will be available later in <strong>2006</strong> at www.naei.co.uk/reports.php.<br />
25 Guidelines for the preparation of national communications by Parties included in Annex I to the Convention FCCC/CP/1999/7 (UNFCCC, 2000).<br />
26 Total emissions by sources minus total removals by sinks.<br />
27 Does not include emissions from Overseas Territories or Crown Dependencies<br />
28 Totals for assessing progress with Kyoto Protocol commitments include the forest management cap of 0.37 MtC agreed for the <strong>UK</strong> under Art 3.4 of the<br />
Kyoto Protocol and emissions from <strong>UK</strong> overseas territories to whom the <strong>UK</strong>’s instruments of ratification of the Kyoto Protocol are being extended.
28<br />
<strong>UK</strong> emissions inventory and projections<br />
Table 2: Greenhouse gas emissions by source, MtC<br />
Sector Base year 1990 1995 2000 2004 2010 2015 2020<br />
Energy supply 74.4 74.4 63.1 58.2 61.4 56.2 56.0 51.1<br />
Business 58.4 57.5 52.5 43.8 38.7 38.0 39.8 40.4<br />
Transport 34.1 34.1 34.3 36.0 37.4 38.6 40.1 40.7<br />
Domestic 22.3 22.2 22.5 24.6 25.3 21.8 22.0 22.2<br />
Agriculture, forestry and<br />
land management 17.0 17.0 15.9 14.7 13.2 11.5 12.1 12.6<br />
Public 3.7 3.7 3.6 3.2 2.9 3.0 3.1 3.2<br />
Total emissions by sources minus<br />
total removals by sinks 209.9 209.0 191.9 180.5 178.9 169.2 173.0 170.0<br />
Note: the percentage changes and emission estimates may differ slightly due to rounding<br />
Table 3: Greenhouse gas emissions by end user, MtC<br />
Sector Base year 1990 1995 2000 2004 2010 2015 2020<br />
Business 97.2 96.4 84.7 74.1 70.3 65.2 66.3 66.0<br />
Transport 40.2 40.2 41.2 42.6 45.0 46.5 47.5 47.2<br />
Domestic 45.9 45.8 41.7 42.1 43.7 38.6 39.9 37.7<br />
Agriculture, forestry<br />
and land management 18.0 18.0 16.8 15.4 14.0 12.3 12.8 13.1<br />
Public 8.5 8.5 7.7 6.3 5.9 6.5 6.6 6.0<br />
Total emissions by sources minus<br />
total removals by sinks 209.9 209.0 191.9 180.5 178.9 169.2 173.0 170.0<br />
Note: the percentage changes and emission estimates may differ slightly due to rounding<br />
Table 4: Carbon dioxide emissions by source, MtC<br />
Sector 1990 1995 2000 2004 2010 2015 2020<br />
Energy supply 66.1 56.6 53.7 58.0 53.4 53.7 49.1<br />
Business 34.3 32.5 32.4 30.6 30.1 32.3 33.2<br />
Transport 33.5 33.4 34.7 35.8 37.0 38.3 38.8<br />
Domestic 21.7 22.1 23.8 24.4 20.8 21.0 21.2<br />
Agriculture, forestry and<br />
land management 2.2 1.7 1.2 0.7 0.0 0.6 1.1<br />
Public 3.7 3.6 3.2 2.9 3.0 3.1 3.1<br />
Total emissions by sources minus total<br />
removals by sinks 161.5 149.9 149.0 152.5 144.3 149.0 146.6<br />
Note: the percentage changes and emission estimates may differ slightly due to rounding<br />
Table 5: Carbon dioxide emissions by end user, MtC<br />
Sector 1990 1995 2000 2004 2010 2015 2020<br />
Business 29 68.8 61.2 60.3 60.5 56.4 58.0 58.1<br />
Transport 39.2 39.8 40.9 43.1 44.8 45.7 45.3<br />
Domestic 42.4 39.1 39.8 41.7 36.5 38.0 36.0<br />
Agriculture, forestry and<br />
land management 3.2 2.5 1.9 1.5 0.7 1.3 1.7<br />
Public 7.9 7.2 6.1 5.7 5.9 6.0 5.5<br />
Total emissions by sources minus total<br />
removals by sinks 161.5 149.9 149.0 152.5 144.3 149.0 146.6<br />
Note: the percentage changes and emission estimates may differ slightly due to rounding<br />
29 Includes the category ‘exports’ which includes emissions occurring within the <strong>UK</strong> from producing fuels (for example from a refinery or coal mine) which are<br />
subsequently exported or sent to bunkers for use outside the <strong>UK</strong>. These emissions are properly part of the <strong>UK</strong> inventory even if the use of the fuel occurs<br />
outside the <strong>UK</strong>.
<strong>UK</strong> emissions inventory and projections<br />
29<br />
23. The baseline with measures projections in the<br />
tables include the emission reductions expected<br />
from existing measures such as the climate<br />
change levy. They also include the effect of<br />
policies introduced since the <strong>Climate</strong> <strong>Change</strong><br />
<strong>Programme</strong> was published in 2000, such as the<br />
climate change agreements, the <strong>UK</strong> emissions<br />
trading scheme and the Energy Efficiency<br />
Commitment.<br />
24. The impact of these policies on greenhouse<br />
gas emissions in 2010 and 2015 has been<br />
re-evaluated and quantified wherever possible.<br />
The analytical work was undertaken by the<br />
Interdepartmental Analysts Group (IAG) following<br />
the consultation on the review of the 2000<br />
<strong>Climate</strong> <strong>Change</strong> <strong>Programme</strong> initiated in<br />
December 2004. The analytical work is<br />
summarised in the documents setting out<br />
respectively the basis for the analysis, the<br />
re-evaluation of existing policies, and the<br />
appraisal of new policies 30 . The review of the<br />
2000 <strong>Programme</strong> focused mainly on policies to<br />
reduce carbon dioxide emissions because of the<br />
significance for the <strong>UK</strong>’s domestic goal and<br />
because non-CO 2<br />
policies are generally described<br />
in the separate work commissioned by <strong>Defra</strong> on<br />
non-CO 2<br />
projections 31 . The Bringing it all together<br />
chapter sets out the estimated carbon savings<br />
that existing measures are now expected<br />
to deliver.<br />
30 Will be available at www.defra.gov.uk<br />
31 Non-CO 2<br />
projections report by Entec will be available at www.defra.gov.uk
30<br />
CHAPTER TWO<br />
Strategy to reduce <strong>UK</strong> emissions<br />
1. The Government’s priority is to deliver the <strong>UK</strong>’s<br />
legally binding target under the Kyoto Protocol<br />
but it believes that greater reductions in<br />
emissions are feasible, and that there will be real<br />
advantages to the <strong>UK</strong> in aiming to achieve them.<br />
That is why the Government and the devolved<br />
administrations agreed a separate domestic goal<br />
of reducing carbon dioxide emissions to 20 per<br />
cent below 1990 levels by 2010. This is to ensure<br />
that the <strong>UK</strong> continues to lead by example on<br />
climate change and starts to make the transition<br />
to a lower carbon economy.<br />
2. Recent rises in global energy prices and in<br />
particular their impact on the relative prices of<br />
coal and gas have led to increases in <strong>UK</strong> carbon<br />
dioxide emissions in recent years. Some policies<br />
designed to tackle climate change will involve<br />
upfront costs, but in the long-run they can lead<br />
to substantial savings in energy costs. The<br />
Government has therefore to combine a number<br />
of objectives and strike the right balance when<br />
making decisions.<br />
3. The <strong>Climate</strong> <strong>Change</strong> <strong>Programme</strong> is based<br />
on a number of principles:<br />
• the need to take a balanced approach with all<br />
sectors and all parts of the <strong>UK</strong> playing their<br />
part;<br />
• the need to safeguard, and where possible<br />
enhance, the <strong>UK</strong>’s competitiveness, encourage<br />
technological innovation, promote social<br />
inclusion and reduce harm to health;<br />
• the need to focus on flexible and cost<br />
effective policy options which will work<br />
together to form an integrated package;<br />
• the need to take a long term view, looking to<br />
targets beyond the first Kyoto commitment<br />
period and considering the need for the <strong>UK</strong> to<br />
adapt to the impacts of climate change; and<br />
• the need for the <strong>Programme</strong> to be kept under<br />
review.<br />
6. Our existing policies will ensure that we will meet<br />
our international commitment under the Kyoto<br />
Protocol. But more needs to be done to achieve<br />
our national carbon dioxide goal. The new<br />
measures in the <strong>Programme</strong> are expected to lead<br />
to further reduction of some 7-12 MtC by 2010,<br />
achieving an overall reduction of between 15-18<br />
per cent by 2010. The range is accounted for by<br />
the EU emissions trading scheme on which we<br />
will be launching consultation today. We will<br />
decide the final cap for the National Allocation<br />
Plan in the Summer, when we will need to submit<br />
our plan to the European Commission.<br />
7. By this time too, the Energy review will have<br />
reported to the Prime Minister. Its findings will<br />
inform decisions about how we can achieve our<br />
longer-term targets set out in the Energy White<br />
Paper, to reduce carbon dioxide emissions by<br />
some 60 per cent by about 2050 with real<br />
progress by 2020. Several processes that are<br />
currently underway such as the review of existing<br />
buildings, will be important parts of this process.<br />
The <strong>Programme</strong> also identifies some ideas for<br />
additional carbon savings. Work in these areas<br />
will continue to see if they should be taken<br />
forward.<br />
8. The next six chapters of the <strong>Programme</strong> set out<br />
the measures to reduce greenhouse gas emissions<br />
in six broad sectors: energy supply, business,<br />
transport, domestic, agriculture, forestry and land<br />
management and public and local government.<br />
9. The “Bringing it all together” chapter summarises<br />
all of the measures included in the <strong>Climate</strong><br />
<strong>Change</strong> <strong>Programme</strong> and gives an indication of<br />
the progress which the Government expects to<br />
be have made by 2010 against its commitments<br />
under the Kyoto Protocol and the domestic<br />
carbon dioxide target.<br />
10. This <strong>Programme</strong> is not the Government’s last<br />
word. We will keep our policy under review. The<br />
Government will introduce a new annual report<br />
to Parliament on the level of greenhouse gas<br />
emissions in the <strong>UK</strong> and the steps it has been
Strategy to reduce <strong>UK</strong> emissions<br />
31<br />
taking to reduce these. It will also set out an<br />
indicative work plan for the following year. The<br />
Review of the Economics of <strong>Climate</strong> <strong>Change</strong> –<br />
led by Sir Nick Stern, will also consider recent<br />
proposals for the introduction of “carbon<br />
budgeting”. This analysis will inform the<br />
Energy Review.<br />
11. In developing the measures in the <strong>Climate</strong><br />
<strong>Change</strong> <strong>Programme</strong> we have taken account of<br />
the principles of better regulation. This will mean<br />
that the programme will look to achieve its<br />
objectives with the minimum additional<br />
regulatory burden and taking on board the work<br />
of the Better Regulation Commission (previously<br />
the Better Regulation Task Force). Evaluations of<br />
individual policies will also consider options for<br />
simplifying the regulatory landscape as well as<br />
ideas for reducing administrative burdens.<br />
12. The ongoing review of the Air Quality Strategy to<br />
reduce air pollution, has also been considering<br />
the impact of policies and measures on<br />
greenhouse gases. The review of the <strong>Climate</strong><br />
<strong>Change</strong> <strong>Programme</strong> adopted a similar approach,<br />
identifying measures that will have some air<br />
quality benefits. In the long term the two policies<br />
will work together synergistically.<br />
13. Involving all parts of society in the fight against<br />
climate change is a key part of the national<br />
strategy. Each one of us, whether citizens,<br />
consumers, businesses or motorists, we all have<br />
something to offer. The Government is<br />
committed to raising awareness and<br />
understanding of climate change, working with<br />
organisations such as the Energy Saving Trust and<br />
the Carbon Trust to encourage and stimulate<br />
individuals and businesses to take action to<br />
reduce their greenhouse gas emissions.
32<br />
CHAPTER THREE<br />
Energy supply<br />
The energy supply sector has contributed a<br />
large reduction in the <strong>UK</strong>’s greenhouse gas<br />
emissions over the past decade. This has been<br />
largely through the switch away from more<br />
carbon intensive fuels such as coal and oil<br />
towards low or zero carbon emissions fuels<br />
such as gas, nuclear and renewables.<br />
In 2004, the energy supply sector was<br />
responsible for carbon dioxide emissions of<br />
53.7 MtC or about 36 per cent of the <strong>UK</strong> total.<br />
Emissions fell to about 19 per cent below 1990<br />
levels by 2004 and we estimate that they will<br />
fall further through to 2010 as a result of the<br />
impact on electricity demand of existing<br />
measures and a further increase in the share of<br />
gas-fired electricity generation. Greenhouse gas<br />
emissions fell by 17 per cent below base year<br />
levels by 2004.<br />
Introduction<br />
1. A principal reason for the fall in the <strong>UK</strong>’s<br />
greenhouse gas emissions over the past decade<br />
has been the restructuring of the energy supply<br />
industry in the mid-1990s. Fuel switching from<br />
coal and oil to gas led to a significant increase in<br />
the proportion of gas in the energy mix. The<br />
volatile and high gas price – and the<br />
corresponding switching from gas to coal and oil<br />
generation that have resulted from this – will<br />
inevitably have had a detrimental effect on<br />
carbon dioxide emissions this winter.<br />
Measures introduced in the <strong>Climate</strong> <strong>Change</strong><br />
<strong>Programme</strong> 2000 are estimated to save 2.5 MtC<br />
in 2010. The main contributions are the<br />
Renewables Obligation and support for<br />
Combined Heat and Power.<br />
The second phase of the EU emissions trading<br />
scheme will save an additional 3.0 – 8.0 MtC<br />
in 2010.<br />
The Government will also be introducing a<br />
support scheme for biomass heat in the<br />
industrial, commercial and community sectors.<br />
Budget <strong>2006</strong> announced a further £50m for<br />
DTI’s Low Carbon Buildings <strong>Programme</strong> with<br />
the aim of encouraging manufacture at higher<br />
scale leading to lower costs. This will help fund<br />
the installation of microgeneration<br />
technologies in a range of buildings including<br />
schools, social and local authority housing,<br />
businesses and public buildings. Further details<br />
will be announced by the DTI in due course.<br />
The Energy Review is assessing further options for<br />
longer-term carbon savings from both the supply<br />
and demand side for energy. This will include<br />
consideration of what more can be done to improve<br />
the conditions for low carbon technologies, such<br />
as carbon capture and storage, to come forward.<br />
2. The direction of the energy supply sector over the<br />
coming decade will be critical to our ability to<br />
make the much deeper emission cuts to which<br />
the Government is committed. This is one of the<br />
key questions being considered by the current<br />
Energy Review.<br />
Greenhouse gas emissions inventory<br />
and trends<br />
3. The energy supply sector, which is the biggest<br />
single contributor to the <strong>UK</strong>’s carbon dioxide<br />
emissions, was responsible for about 58 MtC or<br />
38 per cent of net CO 2<br />
emissions in 2004.<br />
4. Emissions from the energy supply sector include<br />
those from the production of fuel for final<br />
consumption by other sectors. This includes<br />
electricity generation, oil production and refining,
Energy supply<br />
33<br />
Greenhouse gas emissions from energy supply industry, MtC<br />
Gas 1990 1995 2000 2004 2010 2015 2020<br />
Carbon dioxide 66.1 56.6 53.7 58.0 53.4 53.7 49.1<br />
Methane 7.8 6.1 4.1 3.0 2.4 2.0 1.7<br />
Nitrous oxide 0.5 0.4 0.3 0.4 0.4 0.3 0.3<br />
Total 74.4 63.1 58.2 61.4 56.2 56.0 51.2<br />
<strong>Change</strong> from 1990 levels -15.2 -21.8 -17.6 -24.5 -24.8 -31.4<br />
Note: the percentage changes and emission estimates may differ slightly due to rounding.<br />
Existing measures<br />
Carbon savings in 2010 (MtC)<br />
Renewables Obligation 2.5<br />
TOTAL 2.5<br />
gas production and transmission, and the<br />
production of coal and other solid fuels. (Carbon<br />
dioxide emissions from the energy supply industry<br />
are shown separately in the table below, but are<br />
incorporated into emissions from individual<br />
sectors that use the final products from energy<br />
supply in the ‘end user’ tables.)<br />
Projections of greenhouse gas emissions from the energy supply<br />
sector and the estimated effect of additional quantified measures,<br />
MtC<br />
80<br />
70<br />
5. Carbon dioxide contributed around 94 per cent<br />
of the greenhouse gas emissions from the energy<br />
supply sector in 2004. The other emissions are of<br />
methane from natural gas transmission and<br />
distribution, coal mining and offshore oil and gas<br />
production. In 2004, greenhouse gas emissions<br />
from the <strong>UK</strong> energy supply sector were about<br />
61.4 MtC. Annual emissions have fallen since<br />
1990 and are projected to be about 56.2 MtC in<br />
2010, 24.5 per cent lower than 1990 emissions.<br />
MtC<br />
60<br />
50<br />
40<br />
1990<br />
1995<br />
2000<br />
2005<br />
2010<br />
Historical trend<br />
Baseline with measures projections<br />
Additional quantified measures<br />
(including low range for EU ETS)<br />
Additional quantified measures<br />
(including high range for EU ETS)<br />
2015<br />
2020<br />
Potential carbon savings<br />
Additional measures<br />
Carbon savings in 2010 (MtC)<br />
Subsidy for biomass heat 0.1<br />
Second phase of EU emissions trading scheme 3.0 – 8.0<br />
TOTAL 3.1 – 8.1
34<br />
Energy supply<br />
Energy policy<br />
6. The Government set out a long-term framework<br />
for energy policy in the 2003 White Paper “Our<br />
Energy Future – Creating a Low Carbon Economy”.<br />
The White Paper brings climate change to the<br />
heart of energy policy, as one of four key goals:<br />
• to put the <strong>UK</strong> on a path to cut its carbon<br />
dioxide emissions by some 60 per cent by<br />
about 2050, with real progress by 2020;<br />
• to maintain the reliability of energy supplies;<br />
• to promote competitive markets in the <strong>UK</strong><br />
and beyond, helping to raise the rate of<br />
sustainable economic growth and to improve<br />
our productivity; and<br />
• to ensure that every home is adequately and<br />
affordably heated.<br />
7. The White Paper made clear that, in reducing<br />
carbon dioxide emissions, the priority is to<br />
strengthen the contribution of energy efficiency<br />
and renewable energy sources, and to put the EU<br />
emissions trading scheme at the centre of the<br />
future market and policy framework. It also noted<br />
that energy efficiency is likely to be the cheapest<br />
and safest way of addressing all four goals.<br />
8. Liberalised and competitive markets continue to<br />
be a cornerstone of <strong>UK</strong> energy policy, improving<br />
efficiency and helping keep prices down for<br />
domestic consumers and industrial users.<br />
Indications are that in January <strong>2006</strong>, prices in the<br />
<strong>UK</strong> were below the EU median for both domestic<br />
electricity and gas prices. For industry, indications<br />
are that prices will be above the EU median for all<br />
size bands. However, historically prices to<br />
industrial users have been below the EU median,<br />
and right up to October 2005 prices were no<br />
higher than the EU median. Annual prices for<br />
2005 will be significantly higher than 2004, the<br />
latest available published annual figures. However,<br />
they are not as high as in previous years.<br />
Indications are that domestic gas prices in real<br />
terms 1 are likely to be around 1994 levels, and<br />
domestic electricity prices in real terms are likely to<br />
be around 1999 levels. Industrial gas prices in real<br />
terms including the climate change levy (CCL) are<br />
likely to be around 1988 levels, and industrial<br />
electricity prices in real terms including CCL are<br />
likely to be around 1997 levels. Provisional 2005<br />
estimates will be published in March <strong>2006</strong>.<br />
9. On 1 April 2005, a single GB-wide wholesale<br />
electricity market was introduced by BETTA (the<br />
British Electricity Trading and Transmission<br />
Arrangements). This extended the market<br />
arrangements previously operational in England<br />
and Wales to Scotland, enabling competitive<br />
markets in the generation and supply of<br />
electricity to develop further.<br />
10. The Government believes that the market<br />
framework, reinforced by long-term policy<br />
measures, is the best way of delivering energy<br />
security and encouraging investment, including<br />
through the provision, maintenance and<br />
replacement of electricity generating capacity to<br />
meet demand. Nevertheless the Government<br />
recognises, as set out in the Energy White Paper,<br />
that to encourage the innovation that will help us<br />
meet our goals, some technologies, including<br />
renewable energy, require additional support.<br />
11. In January <strong>2006</strong>, the Government launched a<br />
public consultation on the Energy Review. This is<br />
taking place against a background of more<br />
evidence on the nature and extent of climate<br />
change and increasing concerns about the future<br />
security of <strong>UK</strong> energy supplies. The Review is<br />
looking at whether the Government needs to take<br />
further steps to meet our goals and is due to<br />
report to the Prime Minister and the Secretary of<br />
State for Trade and Industry in early summer <strong>2006</strong>.<br />
The consultation document – “Our Energy<br />
Challenge: securing clean, affordable energy for<br />
the long-term” – makes clear that the <strong>UK</strong>’s<br />
liberalised energy markets have delivered well<br />
against the four goals for energy policy of the<br />
2003 White Paper, and the current review is not<br />
re-examining the goals themselves. Rather, it<br />
recognises that there are risks that the<br />
Government may make only limited further<br />
progress against these goals in the medium- and<br />
long-term without further measures. The Review is<br />
1 Adjusted to take account of inflation.
Energy supply<br />
35<br />
therefore assessing options on both the supply and<br />
demand side for energy. It does not mean pulling<br />
back from the priorities set out in the White Paper,<br />
notably on encouraging renewable energy and<br />
energy efficiency, but it does include looking again<br />
at nuclear power. The Review is also considering<br />
whether the <strong>UK</strong> should do more to improve the<br />
conditions for other low carbon technologies to<br />
come forward. The Review will also examine what<br />
role carbon capture and storage might play in<br />
ensuring we can continue to use fossil fuels,<br />
particularly coal, while also reducing emissions.<br />
expected to decline further, falling to around 41<br />
MtC by 2010, a reduction of 26 per cent below<br />
1990 levels, as older coal plant is retired and the<br />
proportion of electricity supplied from renewables<br />
increases. Although high gas prices have made<br />
coal stations more competitive in the past few<br />
years, pushing emissions back up, new gas-fired<br />
power stations are expected to replace some of<br />
the existing coal capacity as it reaches the end of<br />
its economic life or its closure is accelerated by<br />
other environmental legislation, such as the EU<br />
Large Combustion Plants Directive.<br />
Electricity generation<br />
EU emissions trading scheme<br />
12. There has been a significant change in the way<br />
that electricity is generated in the <strong>UK</strong> since 1990,<br />
and this has been an important contributor to<br />
reductions in the <strong>UK</strong>’s greenhouse gas emissions.<br />
There has been a shift away from more carbon<br />
intensive fuels such as coal and oil towards lower<br />
or zero carbon emission fuels such as gas, nuclear<br />
and renewables.<br />
TWh<br />
400<br />
350<br />
300<br />
250<br />
200<br />
150<br />
100<br />
50<br />
0<br />
<strong>UK</strong> electricity generation 1990-2010<br />
1990 2000<br />
Coal<br />
Gas<br />
Nuclear<br />
2010 2020<br />
Renewables<br />
Other<br />
13. Emissions from power stations have steadily<br />
decreased over the recent past – by around 26 per<br />
cent between 1990 and 2004. This is against a<br />
general rise in the demand for electricity, of some<br />
24 per cent over the same period. Emissions are<br />
14. The inclusion of the electricity industry in the EU<br />
emissions trading scheme (covered in detail in the<br />
next chapter) has also begun to provide generators<br />
and suppliers with direct incentives to reduce<br />
emissions. The scheme covers all emissions from<br />
the generation of electricity which is supplied to<br />
the grid and therefore, by association, the use of<br />
electricity by homes and businesses. Over time, it<br />
should provide incentives for investment in lower<br />
carbon forms of generating capacity.<br />
15. The Government will explore how it can provide<br />
the generators with more certainty about the<br />
contribution it expects the scheme to make to<br />
longer-term emissions reductions and how it could<br />
allocate allowances in ways that encourage the<br />
investment that is needed.<br />
16. The Government has decided that the overall<br />
cap for the second phase of the EU emissions<br />
trading scheme should be set within a range<br />
which would achieve average annual<br />
emission reductions of between 3.0 and<br />
8.0 MtC. In the draft National Allocation Plan,<br />
the Government proposes that the reductions in<br />
allowances against business as usual would be<br />
borne entirely by the electricity supply industry,<br />
which is relatively insulated from international<br />
competition and is able to pass on the costs of<br />
carbon to customers.
36<br />
Energy supply<br />
Electricity from renewables<br />
17. In January 2000, the Government set a target to<br />
increase the proportion of electricity provided by<br />
renewable sources to 10 per cent of electricity<br />
supplied by 2010, subject to the cost to the<br />
consumer being acceptable. The Energy White<br />
Paper signalled the Government’s aspiration to<br />
double the proportion of electricity supplied by<br />
renewables by 2020.<br />
18. The main policy mechanism through which the<br />
Government supports the development of new<br />
renewables capacity is the Renewables<br />
Obligation on licensed electricity suppliers in<br />
England and Wales and its equivalents in<br />
Scotland and Northern Ireland. The Renewables<br />
Obligation requires suppliers to source a specific<br />
and annually increasing percentage of electricity<br />
they supply from renewable sources. The level of<br />
the Obligation in England, Wales and Scotland is<br />
5.5 per cent for 2005-06 rising to 15.4 per cent<br />
by 2015-16. In order to provide a stable and<br />
long-term market for renewable electricity, the<br />
Obligation will remain in place until 2027. At the<br />
end of 2004, generation from renewable sources<br />
eligible under the Renewables Obligation stood at<br />
3.1 per cent 2 of electricity supplied.<br />
19. For each megawatt hour of renewable electricity<br />
generated, a tradable certificate called a<br />
Renewables Obligation Certificate (ROC) is issued<br />
by Ofgem who administers the scheme. Suppliers<br />
can meet their obligation either by acquiring<br />
ROCs or by paying a buy-out price, set at<br />
£32.33/megawatt hour in 2004/05 and indexed<br />
to inflation, or by a combination of both. Money<br />
paid into the buy-out fund is recycled to ROC<br />
holders at the end of the 12-month Obligation<br />
period.<br />
that have been built in the <strong>UK</strong>; almost 450MW of<br />
wind capacity was installed in 2005, double that<br />
installed in 2004. And following the opening of<br />
the Cefn Cross wind farm in Wales in June 2005,<br />
the <strong>UK</strong> became only the eighth country to pass 1<br />
GW of installed wind capacity. We expect <strong>2006</strong><br />
to be another record year for growth in onshore<br />
wind, with over 500 MW planned for<br />
construction in Scotland alone.<br />
22. In April 2001, The Crown Estate announced that<br />
18 companies had pre-qualified for offshore wind<br />
site development options under the first round of<br />
site awards in <strong>UK</strong> territorial waters. Three of the<br />
18 offshore windfarms have been built and are<br />
now generating electricity: North Hoyle off the<br />
north Wales coast, Scroby Sands off Great<br />
Yarmouth, Norfolk and Kentish flats in the<br />
Thames Estuary. A number of others are either<br />
under construction or planned for the near<br />
future. The first round was intended to act as a<br />
demonstration round, enabling prospective<br />
developers to gain technological, economic and<br />
environmental expertise and building on the<br />
experience of the Blyth offshore windfarm, which<br />
was commissioned in 2000. The second round<br />
took a more strategic approach to offshore<br />
windfarm development by restricting<br />
development to three areas: the Greater Wash,<br />
the Thames Estuary, and the North West<br />
(Liverpool Bay). In December 2003, The Crown<br />
Estate announced that 15 projects had been<br />
successful. Five applications for consent have<br />
been received from those projects granted leases<br />
in the second round.<br />
20. It is expected that the Obligation, together with<br />
exemption from the climate change levy for<br />
electricity from renewables, will provide financial<br />
support worth up to £1 billion per year by 2010.<br />
21. The Obligation is working well. Since its<br />
introduction in April 2002, there has been a step<br />
change in the number of renewables projects<br />
2 3.6 per cent including all non-eligible renewable sources.
Energy supply<br />
37<br />
23. Unlike some other renewable technologies,<br />
biomass has the advantage that it can be used to<br />
generate electricity when required, once a fuel<br />
supply chain is in place. A strong biomass supply<br />
chain can also offer diversification opportunities<br />
for farmers and foresters as well as job<br />
opportunities, and building and operating the<br />
generating plant. Installed biomass and waste<br />
capacity had reached 1,333 MWe by the end of<br />
2004, with biomass providing 2.6 mtoe of<br />
electricity and 0.64 mtoe of heat in 2004 3 £66m<br />
of capital grant funding allocated under the<br />
DTI/Big Lottery Fund is bringing forward<br />
additional capacity, such as the plants at Teesside<br />
(30 MW) and Lockerbie (43MW) which are under<br />
construction, and the biomass CHP plant at<br />
Enniskillen in Northern Ireland, which was<br />
commissioned in 2005.<br />
24. Co-firing of biomass with fossil fuels is eligible for<br />
ROCs under the Renewables Obligation with<br />
certain restrictions and a requirement for a<br />
minimum use of purpose-grown energy crops<br />
from 2009. The Government has recently<br />
announced its intention to review the co-firing<br />
rules within the Renewables Obligation as part of<br />
the Energy Review, focusing on the potential<br />
contribution to our energy and environmental<br />
policy goals and the level of support it will require<br />
going forward.<br />
25. Although the Government is making progress<br />
towards the 10 per cent target, recent projections<br />
indicate that this level of generation may not be<br />
achieved until some time after 2010. The<br />
Government is continuing with a range of work<br />
to address barriers to progress towards the 10 per<br />
cent target. The Government has recently laid a<br />
new Renewables Obligation Order before<br />
Parliament, which includes a number of small<br />
modifications that are aimed at improving its<br />
effectiveness over time.<br />
26. As well as the Renewables Obligation, the<br />
Government is providing support through R&D<br />
funding and capital grants worth around £500m<br />
between 2002 and 2008, including grants for<br />
offshore wind, biomass, solar PV and R&D. The<br />
Government will continue to explore other<br />
options, such as geopressure, to see whether<br />
they can play a role in producing low carbon<br />
energy in the <strong>UK</strong>.<br />
Wave and tidal stream<br />
27. Wave and tidal stream technologies will only<br />
make a small contribution towards the 2010<br />
renewables target but, if they can be successfully<br />
developed on a commercial scale, they could<br />
make a significant contribution towards achieving<br />
the 2020 aspiration and beyond. A report by the<br />
Carbon Trust, published in January <strong>2006</strong>,<br />
indicates that wave and tidal stream energy could<br />
provide 15 – 20 per cent of <strong>UK</strong> electricity.<br />
28. Since 1999, the Government has committed<br />
around £25m to the research and development<br />
of wave and tidal stream technologies through<br />
the DTI’s Technology <strong>Programme</strong>. This has led to<br />
a number of full-scale prototype demonstrations<br />
with several more planned. Developers of some<br />
of these devices have indicated that R&D is nearly<br />
complete and that they are, or soon will be,<br />
ready to begin pre-commercial operation to gain<br />
more experience through accelerated trials of<br />
small numbers of arrays of devices to discover<br />
whether feasible cost-effective solutions can be<br />
developed. In August 2004, the Secretary of State<br />
for Trade and Industry announced the setting up<br />
of a Marine Renewables Deployment Fund<br />
(MRDF) that aims to support innovative and<br />
visionary businesses to take R&D on wave and<br />
tidal stream technologies to market. The centrepiece<br />
of the MRDF is a Wave and Tidal Stream<br />
Energy Demonstration Scheme, which will<br />
provide up to £42m to support the deployment<br />
of a small number of multi-device wave or tidal<br />
stream electricity generating facilities connected<br />
to the <strong>UK</strong> electricity grid. It will do this through a<br />
combination of capital grants and revenue<br />
support.<br />
3 Digest of <strong>UK</strong> Energy Statistics 2005.
38<br />
Energy supply<br />
grid. While these islands are not connected to the<br />
transmission network yet, these proposals will<br />
help to support the industry and unlock the vast<br />
potential of the Scottish islands for renewables<br />
development.<br />
33. Ofgem and DTI consulted in 2005 on the high<br />
level regulatory options for offshore transmission.<br />
The Energy Minister, Malcolm Wicks intends to<br />
announce his decision as soon as possible.<br />
Biomass heat<br />
29. Support for technology deployment is also being<br />
backed up by support for infrastructure, such as<br />
support for the European Marine Energy Centre<br />
and the development of a consents framework<br />
for wave and tidal stream demonstration projects.<br />
Network infrastructure for<br />
renewables<br />
30. The development of renewable energy will<br />
require the upgrade or reinforcement of parts of<br />
the transmission or distribution system. In<br />
particular, there is a need for upgrades to allow a<br />
surplus of power from proposed wind farms in<br />
Scotland to flow to centres of demand in other<br />
parts of the <strong>UK</strong>.<br />
31. The Government is working with Ofgem to<br />
ensure that these upgrades happen in a timely<br />
manner and to ensure that there is sufficient<br />
network capacity for new renewable generators<br />
to connect to and thus contribute to meeting the<br />
Renewables Obligation target. In December 2004,<br />
Ofgem approved additional investment of £560m<br />
to strengthen electricity transmission networks in<br />
Scotland and the North of England so that they<br />
can accommodate the growth in renewable<br />
generation.<br />
32. The Government published a public consultation<br />
document in July 2005 outlining proposals for<br />
giving renewable developers on the Scottish<br />
Islands of Shetland, Orkney and the Western Isles<br />
a discount on the transmission charges they will<br />
have to pay to use the high voltage transmission<br />
34. Around 30 per cent of non-transport energy<br />
consumed in the <strong>UK</strong> is in the form of heat for<br />
space and process heating. The Government is<br />
committed to putting in place a framework for<br />
reducing emissions from heat production by<br />
supporting the use of combined heat and power<br />
and by looking to support the use of renewables.<br />
35. Developing a strong biomass heat sector supplied<br />
from indigenous sources will also help secure<br />
future energy supplies. The recent rise in fossil<br />
fuel prices has also helped shift the economic<br />
arguments, although in most cases biomass heat<br />
generation still remains more expensive than<br />
conventional heat generation.<br />
36. Currently only about one per cent of <strong>UK</strong> heat<br />
demand is supplied from renewable sources.<br />
A report commissioned by the Government 4<br />
concluded that this could rise to 1.8 per cent by<br />
2010 and 5.7 per cent by 2020, but that<br />
numerous barriers need to be addressed to<br />
achieve this outcome.<br />
37. One key barrier is the greater cost of renewable<br />
heating infrastructure compared to conventional<br />
systems. The Government will introduce a<br />
support scheme for biomass heat in the<br />
industrial, commercial and community<br />
sectors. The scheme will run for five years and<br />
will be worth at least £10-15m in England over<br />
the next two years. This builds on the support for<br />
renewable heat provided through the Bioenergy<br />
capital Grants Scheme and the Clear Skies<br />
initiative. In developing the scheme, account will<br />
be taken of the recommendations of the Biomass<br />
4 ‘Renewable Heat and Heat from Combined Heat and Power Plants – Study and Analysis’ Future Energy Solutions:<br />
www.dti.gov.uk/renewables/policy_pdfs/heatreportfinal.pdf
Energy supply<br />
39<br />
Taskforce on how the support can best be<br />
delivered. By May <strong>2006</strong>, the Government will<br />
have published its full response to the Taskforce's<br />
recommendations on optimising the contribution<br />
of biomass to renewable energy targets. Other<br />
measures on biomass are described in the<br />
Agriculture, Forestry and Land Management<br />
chapter.<br />
38. Additional analysis of the issues affecting<br />
renewable heat development is provided in<br />
reports from the Royal Commission on<br />
Environmental Pollution 5 and the Carbon Trust 6 .<br />
The latter noted that biomass can be drawn from<br />
a very large number of sources, and highlighted<br />
particularly forestry, agricultural residues, waste<br />
wood and energy crops. Energy from waste is<br />
considered further below.<br />
Combined heat and power (CHP)<br />
39. CHP is an efficient way of providing heat and<br />
electricity at the same time. Overall fuel efficiency<br />
is around 70-90 per cent of the input fuel – much<br />
better than conventional power stations which<br />
are only up to around 50 per cent efficient. It<br />
enables a very wide range of energy users, from<br />
heavy industry down to individual homes, to save<br />
money and to reduce overall carbon emissions.<br />
40. The Government has introduced a range of<br />
measures to support CHP, including:<br />
• climate change levy exemption on fuel inputs<br />
to Good Quality CHP and on all Good Quality<br />
CHP electricity outputs;<br />
• Enhanced Capital Allowances eligibility to<br />
stimulate investment;<br />
• reducing the VAT rate to all domestic micro-<br />
CHP appliances; and<br />
• a target for Government departments to<br />
source 15 per cent of their electricity from<br />
CHP by 2010.<br />
41. In recognition of CHP’s environmental benefits, in<br />
2000 the Government set a target to achieve at<br />
least 10 gigawatts (GW) of Good Quality CHP<br />
capacity by 2010. Installed capacity in the <strong>UK</strong><br />
stood at 5.6 GW at the end of 2004, which is<br />
estimated to save around 4.5 MtC per year.<br />
42. In recent years the CHP industry has faced<br />
adverse economic conditions, due largely to the<br />
spark spread – the difference between the price<br />
received for the electricity and the cost of<br />
generation – which has not been large enough to<br />
provide an adequate return on investment. The<br />
disparity between gas and electricity prices in<br />
recent years has acted against CHP, which means<br />
that there is still room for support for CHP in the<br />
current market conditions. Modelling by<br />
Cambridge Econometrics estimates a 2010<br />
capacity figure of 7.5-7.7 GW excluding the<br />
impact of the EU ETS. With the EU ETS,<br />
Cambridge Econometrics estimate an increased<br />
capacity of 9.3-9.6 GW with a medium allowance<br />
price. However this modeling is subject to<br />
uncertainty and depends significantly on carbon<br />
price assumptions.<br />
43. The Government has assessed several new<br />
support measures for CHP and will introduce two:<br />
• The treatment of CHP will be fully<br />
considered in the <strong>UK</strong>’s National Allocation<br />
Plan for the second phase of the EU<br />
emissions trading scheme, to address some<br />
of the concerns about the impact of the first<br />
5 ‘Biomass as a Renewable Energy Source’ 2004, Royal Commission on Environmental Pollution.<br />
6 ‘Biomass sector review for the Carbon Trust’ 2005. www.thecarbontrust.co.uk/carbontrust/about/publications/Biomass%20Sector_FINAL.pdf
40<br />
Energy supply<br />
phase allocations on CHP. Government will be<br />
consulting on proposals to create a separate<br />
sector for incumbent (existing) Good Quality<br />
CHP plant and a ring-fenced New Entrant<br />
Reserve for new plant generating Good<br />
Quality CHP electricity. Government will also<br />
consult on proposals for incumbent CHP to<br />
receive an equitable allocation based on<br />
historic emissions within the Good Quality<br />
CHP sector. Government will additionally<br />
consult on new entrant CHP to receive<br />
favourable allocation arrangements relative to<br />
non-CHP through the New Entrant Reserve.<br />
• eligibility for Renewable Obligation<br />
Certificates will be extended to include<br />
mixed waste plants which use Good<br />
Quality CHP. This would add CHP to the list<br />
of eligible advanced conversion technologies.<br />
44. The Government will shortly undertake a<br />
study into the licensing and exemption<br />
arrangements governing small-scale CHP and<br />
renewables operations and the cost and<br />
benefits of these operations.<br />
45. The Energy Review will consider the contribution<br />
that CHP can make to our energy policy goals.<br />
46. The Government has considered a number of<br />
other measures to support CHP but has decided<br />
not to take them forward at this time:<br />
• a CHP Obligation, along the lines of the<br />
Renewables Obligation would be the one<br />
measure that could enable us to meet the<br />
2010 target. However, it would be hugely<br />
expensive and interfere with our policy of<br />
promoting competitive energy markets;<br />
considered. However it would be an<br />
additional cost to customers at a time of<br />
rising fuel bills; and<br />
• adding a heat element to the target for using<br />
CHP electricity on the Government estate<br />
would be disproportionately expensive,<br />
because purchasing heat requires significant<br />
capital expenditure to install heat mains.<br />
47. The opportunity was also taken to review the<br />
proposed £10m Community Energy programme<br />
extension (discussed in the Domestic chapter) and<br />
CHP Quality Improvement <strong>Programme</strong> (QIP). The<br />
development of QIP was an undertaking in the<br />
CHP Strategy with an aim to increase Good<br />
Quality CHP capacity through targeting specific<br />
CHP schemes thought to have the potential for<br />
expansion. Detailed analysis, involving direct<br />
contact with schemes, indicates that the potential<br />
is around 35MW and it is not cost-effective to<br />
develop a programme for such a small return. We<br />
will be contacting the few schemes concerned<br />
with the offer of site-specific advice, but will not<br />
roll out the programme more widely.<br />
Microgeneration<br />
48. Micro generation is the production of heat or<br />
electricity on a small-scale from a low carbon<br />
source. Various technologies can be used for<br />
microgeneration – air source heat pumps, ground<br />
source heat pumps, fuel cells, micro-CHP, microhydro,<br />
micro-wind, bio-energy and solar.<br />
• the proposal to guarantee the level of spark<br />
spread for CHP, which would reduce the<br />
uncertainty that has inhibited growth in the<br />
CHP sector. However, the measure would have<br />
significant public expenditure implications and,<br />
at the same time, be a significant intervention<br />
in the electricity market;<br />
• under the review of the Renewables<br />
Obligation, exempting CHP from the<br />
Renewables Obligation base has been
Energy supply<br />
41<br />
49. The Government commissioned the Energy<br />
Saving Trust to undertake an analysis of the<br />
potential of microgeneration in the <strong>UK</strong>. This<br />
report, published in December 2005, suggests<br />
that microgeneration could reduce household<br />
emissions by approximately 15 per cent by 2050.<br />
The Government is currently developing a<br />
strategy to promote microgeneration, which will<br />
include measures to tackle the barriers currently<br />
preventing widespread take-up of<br />
microgeneration technologies. This strategy is due<br />
to be finalised by the beginning of April <strong>2006</strong>.<br />
51. Microgeneration technologies can also make a<br />
contribution to achieving our other energy goals.<br />
Widespread local generation from renewable<br />
sources would reduce the load on the national<br />
gas and electricity networks. A thriving<br />
microgeneration industry could improve the<br />
competitiveness of <strong>UK</strong> energy markets by<br />
providing consumers with a wider choice of<br />
products from which to gain their electricity and<br />
heat. It would also allow existing major energy<br />
suppliers to offer more innovative energy services<br />
packages including a microgeneration element.<br />
50. The strategy will also include the Low Carbon<br />
Buildings <strong>Programme</strong>. The Government has<br />
committed £80m over three years that will enable<br />
the programme to run between <strong>2006</strong>-09,<br />
including £1.5m that has been brought forward<br />
to facilitate a smooth transition between existing<br />
schemes (Clear Skies and the Major PV<br />
demonstration programmes) and the new<br />
programme.<br />
Carbon abatement technologies<br />
52. In June 2005, the Government set out its strategy<br />
for supporting the technical development and<br />
commercial deployment of carbon abatement<br />
technologies (CAT).<br />
Low Carbon Buildings <strong>Programme</strong><br />
The Low Carbon Buildings <strong>Programme</strong> (LCBP), with a £80 million budget over three years, is due to start in<br />
April <strong>2006</strong> and will supersede the current Clear Skies and Photovoltaic Major Demonstration programmes.<br />
£1.5million was brought forward to smooth transition between existing capital grant schemes and the new<br />
programme. The new programme will mark a change to current grant programmes as it aims to take a<br />
more holistic approach to reducing carbon emissions by innovatively combining energy efficiency and<br />
microgeneration technologies. This change is in direct response to The Renewable Innovation Review,<br />
February 2004, which recommended this approach.<br />
While there will be continued support for household and community installations, there will be a shift in<br />
emphasis to large-scale developments. The focus on larger developments is designed to engage the<br />
construction sector more widely and to increase the take up of microgeneration products in new build and<br />
refurbished developments. This change in focus will aim to deliver standard low carbon buildings that can<br />
be more easily replicated. The DTI will be working closely with the Carbon Trust to develop the advice<br />
element of the programme, which will be important to ensure projects deliver low carbon developments.<br />
DTI aims to promote these developments in ways, which clearly communicate the replicability, cost<br />
effectiveness and appeal of low carbon technologies.<br />
In parallel, work to develop the Microgeneration strategy should help to create a sustainable<br />
microgeneration industry in the <strong>UK</strong>. The microgeneration strategy will seek to address some of those nonegrant<br />
barriers preventing widespread take-up of microgeneration technologies.<br />
Budget <strong>2006</strong> announced a further £50m for DTI's Low Carbon Buildings <strong>Programme</strong> with the aim of<br />
encouraging manufacture at higher scale leading to lower costs. This will help fund the installation of<br />
microgeneration technologies in a range of buildings including schools, social and local authority housing,<br />
businesses and public buildings. Further details will be announced by the DTI in due course.
42<br />
Energy supply<br />
53. Carbon abatement technologies cover a range of<br />
generic options for reducing the carbon dioxide<br />
emissions from fossil fuel combustion, including<br />
higher efficiency conversion processes (also<br />
referred to as cleaner coal technologies), co-firing<br />
with biomass, and, the most radical, carbon<br />
capture and storage (CCS), which could be<br />
combined with enhanced oil recovery. Most of<br />
the technologies needed to implement CCS are<br />
currently available through other applications and<br />
the first requirement is to combine and optimise<br />
their operation for carbon dioxide capture.<br />
54. Over the longer term, carbon abatement<br />
technologies could make a significant<br />
contribution to reducing the <strong>UK</strong>’s carbon dioxide<br />
emissions. But as they are not commercially viable<br />
under current market conditions, the strategy<br />
announced £25m, in the form of capital grants,<br />
to support demonstration of these technologies,<br />
including capture ready plant and storage. In the<br />
2005 Pre-Budget report the Government<br />
committed an additional £10m to the<br />
demonstration programme.<br />
55. At Budget <strong>2006</strong> the Government published a<br />
consultation document on the barriers to the<br />
commercial deployment of carbon capture and<br />
storage in the <strong>UK</strong> and the potential role of<br />
economic incentives in addressing those barriers.<br />
The responses will be fed into the Energy Review.<br />
Energy from waste<br />
56. With increasing pressure to divert biodegradable<br />
waste from landfill, there will be opportunities to<br />
increase the recovery of energy from residual,<br />
post-recycling waste. This approach provides a<br />
waste management solution, as well as a source<br />
of partially – renewable energy and an additional<br />
tool for reducing carbon emissions. The energy<br />
currently recovered from residual municipal waste<br />
accounts for 0.35 per cent of electricity<br />
generation in the <strong>UK</strong> or 1.4 TWh. This could rise<br />
to about 1.5 per cent or 6 TWh by 2020 on the<br />
basis of anticipated increases in this waste<br />
management route 7 .<br />
57. A consultation on the Government’s Waste<br />
Strategy for England is currently in progress.<br />
This outlines the role and benefits of recovering<br />
energy from waste that cannot realistically be<br />
reused or recycled and would otherwise be<br />
disposed of to landfill, and invites views on the<br />
proposed approach.<br />
58. Advanced conversion technologies for generating<br />
energy from waste (pyrolysis, gasification and<br />
anaerobic digestion) are supported by the<br />
Renewables Obligation. These technologies<br />
currently make a very small contribution to waste<br />
management and electricity generation in the <strong>UK</strong>,<br />
but may be expected to expand as pressure to<br />
reduce landfilling of waste increases. The Biomass<br />
Taskforce recommended that more efficient use<br />
should be made of the heat element of energy<br />
from waste. The inclusion in the Renewables<br />
Obligation of ‘good quality’ CHP fuelled by<br />
waste should help to encourage this approach.<br />
59. Under the Renewables Obligation definition at<br />
least 98 per cent of the calorific value of the<br />
biomass must be derived from plant or animal<br />
matter. Following the review of the Obligation<br />
the Government has reduced the figure to 90 per<br />
cent to encourage the use for energy generation<br />
of some potential fuels (such as waste woods<br />
which are presently sent to landfill) that are very<br />
largely biomass in content but do not meet the<br />
requirements of the 98 per cent rule.<br />
60. Conventional energy from waste technology<br />
offers a considerable climate change benefit<br />
compared to landfill, principally by reducing<br />
methane emissions from landfill. Energy<br />
recovered also displaces fossil fuel use in<br />
conventional power generation. Recovering<br />
energy from one million tonnes of municipal<br />
waste could reduce greenhouse gas emissions by<br />
around 30 ktC compared to landfill 8 . However,<br />
the carbon benefit will decrease over time as<br />
increased recycling reduces the biodegradable<br />
component of the residual waste. Methane<br />
production, and the resulting energy generation,<br />
from the anaerobic digestion of animal and food<br />
wastes, are discussed in the Agriculture, Forestry<br />
and Land Management chapter.<br />
7 Some commentators have produced considerably higher estimates, based on theoretical maximum assumptions about conversion efficiencies and waste<br />
available for energy recovery.<br />
8 Impact of Energy from Waste and Recycling Policy on <strong>UK</strong> Greenhouse Gas Emissions, ERM report for <strong>Defra</strong>, <strong>2006</strong>:<br />
www.defra.gov.uk/environment/waste/strategy/pdf/ermreport.pdf
Energy supply<br />
43<br />
Coal mine methane<br />
61. The production of electricity from coal mine<br />
methane (CMM) was exempted from the climate<br />
change levy in November 2003. The Government<br />
is working with the Coal Authority to develop a<br />
competitive grant scheme to be administered by<br />
the Authority, to support projects aimed at<br />
controlling CMM emissions.<br />
Hydrogen<br />
65. The Government has targets of, as far as<br />
practicable, ending fuel poverty in England in<br />
vulnerable households by 2010 and in all<br />
households by 2016, with other targets being set<br />
in the devolved administrations such that by 2018<br />
no household in the <strong>UK</strong> should be in fuel poverty.<br />
A range of actions will be required to meet those<br />
targets, particularly in respect of hard-to-treat<br />
homes. Many of these households lack access to<br />
mains gas, the most efficient, cost-effective<br />
conventional fuel for heating, and many would<br />
not be removed from fuel poverty without such<br />
access.<br />
62. Hydrogen offers good prospects for costcompetitive<br />
reductions in carbon dioxide from<br />
2020 onwards, particularly for the transport<br />
sector. It may also have a role in energy storage<br />
for balancing intermittent renewables in gridconstrained<br />
situations.<br />
63. Hydrogen can be made via a number of different<br />
routes, thereby contributing to energy security,<br />
but its potential to contribute to carbon reduction<br />
is dependent on the method used. Low or carbon<br />
neutral methods include electrolysis using<br />
renewable or nuclear energy, and hydrogen<br />
production from biomass. Production of hydrogen<br />
from fossil fuels could be used in conjunction<br />
with carbon capture and storage.<br />
64. The Government announced in June 2005 a<br />
£15m demonstration programme for hydrogen<br />
and fuel cell technologies, part of a £50m<br />
programme also covering carbon abatement<br />
technologies. State Aids approval for the<br />
programme is currently being sought from the<br />
European Commission. The Government intends<br />
to establish a Hydrogen Coordination Unit to<br />
enable the development and deployment of low<br />
carbon, low cost and secure hydrogen energy<br />
chains for transport, and to ensure that the <strong>UK</strong><br />
contributes to and benefits from international<br />
collaboration on hydrogen through global<br />
partners such as the International Energy Agency<br />
and the International Partnership for the<br />
Hydrogen Economy.<br />
Extending the gas network<br />
66. The Design and Demonstration Unit (DDU), a<br />
team of private sector secondees based in DTI,<br />
has undertaken a number of demonstration<br />
projects designed to test a model for providing<br />
gas connections, together with associated<br />
heating and insulation measures to deprived<br />
communities. This model, which uses market<br />
mechanisms and draws on a range of public and<br />
private sector funding sources, has shown that<br />
the costs of providing connections can be<br />
significantly reduced. Whilst primarily designed to<br />
address fuel poverty, connecting a significant<br />
number of additional households to the gas<br />
network, and providing them with central heating<br />
and insulation at the same time, would also offer<br />
other social, health and environmental benefits.<br />
For example, connecting 120000 households<br />
could reduce carbon dioxide emissions by 0.1<br />
MtC in 2010.<br />
67. The DDU will shortly begin a combined gas<br />
network and community renewables programme<br />
in partnership with the Regional Development<br />
Agencies in the North East and Yorkshire and<br />
Humberside. The gas network element of the<br />
programme will use the proven DDU model. The<br />
renewables projects will draw on a range of<br />
proven technologies that can deliver heat at a<br />
price comparable with that of mains gas, to<br />
homes that could not economically be connected<br />
to the gas network because of the distance from<br />
the existing network or the local terrain.
44<br />
CHAPTER FOUR<br />
Business<br />
In 2004, the business sector was responsible for<br />
carbon dioxide emissions of 60.5 MtC or around<br />
40 per cent of the <strong>UK</strong> total. Emissions had fallen<br />
to about 12 per cent below 1990 levels by 2004<br />
and we estimate that, including the expected<br />
impact of the new measures included in this<br />
programme, they could fall further, to almost<br />
18 per cent below 1990 levels by 2010.<br />
Greenhouse gas emissions had fallen by about<br />
28 per cent between the base year and 2004.<br />
We estimate that with the additional measures<br />
introduced in this <strong>Programme</strong>, they could fall<br />
further to 33 per cent below base year levels<br />
by 2010.<br />
The Government is committed to developing<br />
a clear policy framework that allows for longterm<br />
planning and investment in reducing<br />
emissions while ensuring a healthy and<br />
competitive business base is maintained.<br />
Business has already cut its greenhouse gas<br />
emissions significantly, but further reductions<br />
could be made cost-effectively.<br />
Independent evaluation by Cambridge<br />
Econometrics forecast full carbon savings from<br />
the climate change levy to be 3.7 MtC in 2020.<br />
In addition, measures introduced in the <strong>Climate</strong><br />
<strong>Change</strong> <strong>Programme</strong> 2000 are estimated to save<br />
around 4.9 MtC in 2010. The main<br />
contributions are from the climate change<br />
agreements, the <strong>UK</strong> emissions trading scheme,<br />
the activities of the Carbon Trust, and the<br />
Building Regulations 2002 and 2005.<br />
Measures introduced through this programme<br />
will deliver additional carbon savings to 2010:<br />
• additional funding to allow for a significant<br />
expansion in the Carbon Trust’s Energy<br />
Efficiency Loans scheme for SMEs;<br />
• further measures to encourage SMEs to<br />
take up energy saving opportunities.<br />
Together it is estimated that these new<br />
measures will contribute an additional 0.2 MtC<br />
of carbon savings, bringing total savings to<br />
5.1 MtC in 2010.<br />
Introduction<br />
1. Business is a key determinant of the strength and<br />
momentum of an economy. However, increasing<br />
economic activity is putting greater pressure on<br />
our environment and natural resources. The<br />
business sector contributes the most to overall<br />
<strong>UK</strong> emissions.<br />
2. <strong>Climate</strong> change needs to be tackled if we are<br />
to achieve long-term growth and prosperity. If<br />
climate change is not tackled it means that<br />
economic growth is not sustainable, and so it<br />
is essential that business adapts to the new<br />
conditions it faces. The task is to maintain<br />
economic growth in the short, medium and<br />
long-term at the same time as meeting the<br />
challenge of climate change.<br />
3. Business’ commitment to tackling climate change<br />
is growing in the <strong>UK</strong>. Many firms recognise that<br />
action to reduce emissions can bring wideranging<br />
benefits including lower costs, improved<br />
competitiveness and new market opportunities.<br />
Energy-efficient alternatives can provide costeffective<br />
options for businesses. However, shortterm<br />
cost considerations and market failures can<br />
create barriers to investment. Where this is the<br />
case, the Government recognises the role of<br />
different policy instruments in overcoming these<br />
barriers. The decision to intervene needs to be<br />
evidence based and needs to take account of<br />
wider economic and social objectives. If a case for<br />
intervention is seen, the most cost-effective<br />
instrument – or range of instruments – should be<br />
used.<br />
4. The Government is committed to developing a<br />
clear, flexible and stable policy framework that<br />
allows for long-term planning and investment in<br />
reducing emissions while ensuring that a healthy<br />
and competitive business base is maintained. The<br />
framework must also recognise the diversity of<br />
the business sector: emissions, energy intensity<br />
and the ability to respond to climate change vary<br />
sharply between commerce and industry, and<br />
between large and small firms.
Business<br />
45<br />
5. This section covers emissions from both the<br />
manufacturing and commercial sectors, and also<br />
from industrial processes and waste<br />
management. Business’ share of the emissions<br />
associated with energy supply is taken into<br />
account when estimating the effects of policies.<br />
Business use of transport is covered in the<br />
transport chapter.<br />
projected to be around 33 per cent below base<br />
year levels by 2010.<br />
Projections of greenhouse gas emissions from the business sector and<br />
the estimated effect of additional quantified measures, MtC<br />
100<br />
90<br />
80<br />
MtC<br />
70<br />
60<br />
50<br />
1990 1995 2000 2005 2010 2015 2020<br />
Historical trend<br />
Baseline with measures projections<br />
Additional quantified measures<br />
Greenhouse gas emissions<br />
inventory and trends<br />
6. In the base year, greenhouse gas emissions from<br />
the business sector (including those from its use<br />
of energy) were 97.2 MtC. In 2004, emissions<br />
from this sector were about 28 per cent below<br />
1990 levels and they are projected to be around<br />
33 per cent below base year levels by 2010,<br />
mainly because of fuel switching in the electricity<br />
supply industry, other fuel switching and<br />
improved energy intensity. Emissions are<br />
7. Emissions of the other five greenhouse gases<br />
from the business sector have reduced<br />
significantly. More details are given below and in<br />
annexes C to E, but the key points to note are:<br />
• the increased collection of landfill gas for<br />
energy recovery and environmental control;<br />
and<br />
• a large reduction in N 2<br />
O from adipic acid<br />
manufacture and in HFCs from HCFC-23<br />
manufacture due to introduction of<br />
abatement equipment.<br />
Greenhouse gas emissions from business, MtC<br />
Gas Base year 1990 1995 2000 2004 2010 2015 2020<br />
Carbon dioxide 68.8 68.8 61.2 60.3 60.5 56.4 58.0 58.1<br />
Methane 14.8 14.8 12.8 8.6 5.7 4.6 4.1 3.8<br />
Nitrous oxide 9.0 9.0 6.1 2.6 2.0 1.9 1.9 1.9<br />
HFCs 4.1 3.1 4.1 1.9 1.7 1.9 1.9 1.7<br />
PFCs 0.1 0.4 0.1 0.1 0.1 0.1 0.1 0.1<br />
SF 6<br />
0.3 0.3 0.3 0.5 0.3 0.4 0.3 0.3<br />
Total 97.2 96.4 84.7 74.1 70.3 65.2 66.3 66.0<br />
<strong>Change</strong> from base year levels -12.9 -23.8 -27.7 -32.9 -31.8 -32.1<br />
Note: the percentage changes and emission estimates may differ slightly due to rounding
46<br />
Business<br />
Existing measures<br />
Carbon savings in 2010 (MtC)<br />
Voluntary <strong>UK</strong> emissions trading scheme 0.3<br />
Carbon Trust 1.1<br />
Building Regulations 2002 0.4<br />
Building Regulations 2005 0.2<br />
<strong>Climate</strong> change agreements 2.9<br />
TOTAL 4.9<br />
<strong>Climate</strong> <strong>Change</strong> Levy 1 3.7<br />
Potential carbon savings<br />
Additional measures<br />
Carbon savings in 2010 (MtC)<br />
Carbon Trust support for investment in energy efficiency<br />
in SMEs 0.1<br />
Measures to encourage or assist SMEs to take up energy<br />
saving opportunities 0.1<br />
TOTAL 0.2<br />
A framework for business action<br />
8. Business has asked for a clear, flexible and stable<br />
policy framework that allows long-term planning<br />
and investment in reducing greenhouse gas<br />
emissions. The Government and devolved<br />
administrations are committed to delivering this.<br />
9. The policy framework draws together in an<br />
integrated way a range of instruments and<br />
measures including:<br />
• economic instruments – the climate change<br />
levy and, for energy-intensive industries, the<br />
associated climate change agreements;<br />
emissions trading; enhanced capital<br />
allowances for energy-saving technologies<br />
and grant schemes;<br />
• technology deployment – the Carbon Trust<br />
delivers an integrated programme of support<br />
to accelerate the take up of low carbon<br />
technologies and other energy saving<br />
measures;<br />
• regulation – in England and Wales,<br />
implementation of the IPPC directive through<br />
the pollution prevention and control<br />
regulations, which require major industrial<br />
plants to take up best available techniques,<br />
and tightening the energy efficiency<br />
requirements of the Building Regulations in<br />
England and Wales and the Building<br />
Standards (Scotland) Regulations;<br />
• measures to make the market work<br />
better – helping business to respond to<br />
market pressures with advice and information;<br />
improving the energy efficiency of consumer<br />
products and other equipment; and<br />
supporting benchmarking; and<br />
• improving public and company<br />
information – making it easier for business<br />
to measure their emissions and set public<br />
targets for improvement by establishing clear<br />
guidelines for companies reporting on<br />
greenhouse gas emissions.<br />
10. The introduction of the EU emissions trading<br />
scheme in January 2005 means that overlapping<br />
policy measures now cover some business sector<br />
emissions. As an input into the review of this<br />
programme, the Government asked the Carbon<br />
Trust, as part of the Energy Efficiency Innovation<br />
1 An independent evaluation by Cambridge Econometrics (CE) concluded that CCL would deliver annual carbon savings of 3.7MtC by 2010, from an<br />
announcement effect and price effect of the levy. This figure assumes CCL rates are increased in line with inflation from 2005 to 2010. The impact of CCL in<br />
the projections is incorporated through the price elasticity of demand for different fuels (‘the price effect’), and there is no separately identified announcement<br />
effect within the UEP baseline.
Business<br />
47<br />
Review, to consider the future of measures<br />
impacting on business, in particular the<br />
relationship between the EU trading scheme and<br />
climate change agreements, and to recommend<br />
improvements to the policy mix. A key<br />
consideration was that while the EU emissions<br />
trading scheme will be the most significant policy<br />
instrument, it is unlikely on its own to deliver the<br />
full potential of emissions reductions from<br />
business.<br />
11. The Carbon Trust concluded that the current<br />
overlap between the EU trading scheme and<br />
climate change agreements is not an economic<br />
burden at this stage but can create additional<br />
administrative requirements. As the EU emissions<br />
trading scheme becomes more established, the<br />
implications of this for wider <strong>UK</strong> climate change<br />
policy will be considered. The Government will<br />
explore the medium-term regulatory framework<br />
in the light of developments in the EU emissions<br />
trading scheme.<br />
<strong>Climate</strong> change levy<br />
12. The climate change levy (CCL), introduced in<br />
2001, seeks to encourage businesses to improve<br />
the efficiency with which they use energy.<br />
Improving energy efficiency is an effective way to<br />
lower emissions of carbon dioxide, and can also<br />
help businesses reduce their energy costs. To<br />
support competitiveness, the introduction of the<br />
levy was accompanied by a 0.3 percentage point<br />
cut in employers’ national insurance contributions<br />
(NICs), which has led to a net reduction in tax<br />
liability for business.<br />
13. The CCL has had a significant impact on business<br />
energy demand which, in turn, has helped<br />
improve energy efficiency and reduce emissions.<br />
An independent evaluation by Cambridge<br />
Econometrics, commissioned by HM Revenue and<br />
Customs and published alongside Budget 2005,<br />
has examined the effect of the levy since its<br />
announcement in Budget 1999 and introduction<br />
in April 2001. It concluded that the levy could<br />
deliver cumulative savings to 2005 of 16.5 million<br />
tonnes of carbon (MtC) and by 2010, annual<br />
carbon savings of over 3.5 MtC a year – well<br />
above the 2 MtC estimated at the time of its<br />
introduction. According to this evaluation, the<br />
impact was largely due to an announcement<br />
effect, with a smaller reduction in demand due to<br />
the price effect of the levy feeding through into<br />
higher fuel prices. The impact of the levy is<br />
incorporated into the baseline with measures<br />
projections but only through the price effect and<br />
there is no separately identified announcement<br />
effect within the UEP baseline.<br />
14. It is also estimated that by 2010, CCL will reduce<br />
energy demand in the economy as a whole by<br />
2.9 per cent a year – and in the commercial and<br />
public sector by nearly 15 per cent a year –<br />
compared with the levy package not being in<br />
place. The reduction in energy demand, along<br />
with the 0.3 percentage point cut in employers’<br />
NICs, has reduced costs for business. Cambridge<br />
Econometrics estimated that the CCL/NICs<br />
package will reduce overall unit costs for business<br />
by 0.13 per cent by 2010 compared with the<br />
package not being in place.<br />
15. The climate change levy is playing a crucial role in<br />
enabling the <strong>UK</strong> to meet its Kyoto Protocol<br />
target. Levy rates have not been raised since its<br />
introduction. Budget <strong>2006</strong> announced that, to<br />
ensure the <strong>UK</strong> continues to make progress in<br />
tackling climate change, CCL rates will increase in<br />
line with current inflation. The inflation increase<br />
will be introduced on 1 April 2007. The<br />
Government is committed to returning CCL<br />
revenue to business, discussing with business the<br />
most effective way of supporting investment in<br />
energy efficiency and the environment.<br />
16. The levy is a tax on the use of energy in industry,<br />
commerce and the public sector. The levy does<br />
not apply to fuels used by the domestic or<br />
transport sectors, or fuels used for the production<br />
of other forms of energy (such as for electricity<br />
generation) or for non-energy purposes. It does<br />
not apply to oils, which are already subject to<br />
excise duty. Energy used by small firms is also<br />
excluded. There are also several exemptions from<br />
the levy, including:<br />
• electricity generated from new renewables;
48<br />
Business<br />
• fuel used by good quality combined heat and<br />
power (CHP);<br />
• fuels used as a feedstock; and<br />
• electricity used for electrolysis processes, such<br />
as the chlor-alkali process or primary<br />
aluminium smelting.<br />
17. The horticulture sector, which is relatively energy<br />
intensive, contains a large number of smaller<br />
companies and is exposed to significant<br />
international competition, was also given a<br />
temporary 50 per cent discount on the levy for a<br />
five-year period, which expires on 31 March<br />
<strong>2006</strong>. This sector has now qualified for a full<br />
climate change agreement under the new<br />
eligibility criteria (see below) and growers who<br />
have enjoyed the discount are eligible to join the<br />
new agreement.<br />
18. The current rates of levy are 0.15p/kWh for gas,<br />
1.17p/kg (equivalent to 0.15p/kWh) for coal,<br />
0.96p/kg (equivalent to 0.07p/kWh) for liquefied<br />
petroleum gas (LPG), and 0.43p/kWh for<br />
electricity.<br />
19. The levy is structured to incentivise business to<br />
improve their energy efficiency levels. Improving<br />
energy efficiency can help to deliver a double<br />
dividend of both reducing emissions but also<br />
maintaining and enhancing business<br />
competitiveness. To further ensure that the levy<br />
was introduced in a way that supported business<br />
competitiveness, it was accompanied by a 0.3<br />
percentage point cut in employers’ National<br />
Insurance contributions, worth approximately<br />
£1.2 billion in 2004-05, compared with the<br />
£772 million raised by the levy in the same year,<br />
helping shift the burden of taxation from ‘goods’<br />
to ‘bads’.<br />
20. Enhanced capital allowances (ECAs) were<br />
also introduced to encourage the use of<br />
environmentally friendly technologies. ECAs are<br />
now available for 15 different categories of<br />
technology and 13,000 different products. In<br />
addition, the Carbon Trust was established to<br />
provide support and advice to business. Combined<br />
with the incentive to improve energy efficiency<br />
provided by the levy, these other measures have<br />
provided support to help business adapt.<br />
<strong>Climate</strong> change agreements<br />
21. Recognising the need to maintain the<br />
competitiveness of energy-intensive sectors<br />
subject to international competition, climate<br />
change agreements (CCAs) were introduced<br />
alongside the climate change levy. CCAs provide<br />
an 80 per cent discount from the levy for those<br />
sectors that agree to meet challenging targets for<br />
improving energy efficiency or reducing<br />
greenhouse gas emissions.<br />
22. The twelve-year climate change agreements are<br />
negotiated between relevant trade associations<br />
and <strong>Defra</strong>. The agreements operate at two levels<br />
with targets for both sectors and individual<br />
operators. Sector level umbrella agreements detail<br />
the facilities covered by the agreement and the<br />
relevant process. They also list sector targets, and<br />
the conditions which apply to participating<br />
companies. Participants in the agreements can<br />
determine how best to achieve energy savings.<br />
They are able to meet their targets by trading<br />
emission allowances either with other companies<br />
in an agreement or companies in the voluntary<br />
<strong>UK</strong> emissions trading scheme.<br />
23. Eligibility to enter CCAs was dependent initially<br />
on criteria based on the Pollution and Prevention<br />
Control Regulations 2000, which implement the<br />
Directive (EC/96/61) on integrated pollution<br />
prevention and control. There are currently 42<br />
sectors with around 10000 facilities covered by<br />
agreements under this eligibility criterion. The<br />
Pre-Budget Report in 2003 announced that the<br />
eligibility criteria would be extended to cover<br />
other energy-intensive sectors of industry that<br />
qualify if they exceed energy intensity thresholds<br />
and, in some cases, a test of international<br />
competition. A further ten sectors with over 300<br />
facilities have completed negotiations and five of<br />
these have been granted state aid approval by<br />
the European Commission. The remainder are
Business<br />
49<br />
expected to obtain approval in the near future.<br />
The Government is also in discussion with other<br />
potentially eligible sectors.<br />
24. In order to continue to receive the discount,<br />
facilities must achieve the energy efficiency or<br />
emissions reduction targets set out in the<br />
agreements. Performance is tested every two<br />
years up to 2010.<br />
25. At the second target period in 2004, sectors<br />
again performed well against their targets, with a<br />
total of the absolute savings from each sector<br />
compared to its base year of 3.9 MtC (14.4Mt<br />
CO 2<br />
) per annum. Although in the first target<br />
period in 2002, a large proportion of the savings<br />
were a result of reduced output in the steel<br />
sector, in 2004, output had risen by 28 per cent<br />
over the 2002 level, and is forecast to rise further<br />
up to 2010. Nevertheless, energy use in the steel<br />
sector rose by only 10 per cent, indicating that<br />
the steel sector is continuing to improve its<br />
energy efficiency.<br />
26. Targets for <strong>2006</strong> to 2010 were reviewed during<br />
2004 and 2005 to ensure that they continued to<br />
represent the potential for cost-effective energy<br />
savings taking into account any changes in<br />
technical and market circumstances. The review<br />
took into account the better than expected<br />
performance for the majority of sectors in the<br />
first target period. For the largest sectors that are<br />
also affected by the EU Emissions Trading Scheme<br />
(EU ETS), the revised targets were taken into<br />
account in setting the allocations under the <strong>UK</strong><br />
National Allocation Plan.<br />
27. The target reviews have, overall, resulted in<br />
forecast additional savings by 2010 (over business<br />
as usual) of 0.2 MtC above the 2.5 MtC<br />
predicted in 2001. The additional savings from<br />
sectors excluding steel is 0.4 MtC. The forecast<br />
increase in production from the steel sector up to<br />
2010 which is reflected in the targets allows a<br />
net increase in emissions of 0.2 MtC for this<br />
sector.<br />
28. On the whole the ten sectors entering<br />
agreements under the new energy intensity<br />
criteria are smaller sectors in terms of number<br />
of companies and energy use, even though they<br />
are energy intensive. Estimated carbon savings<br />
from these ten sectors could amount to 0.03 MtC<br />
in 2010.<br />
29. It is estimated that the climate change<br />
agreements will, in aggregate, save 2.9 MtC per<br />
annum by 2010. These savings are included in<br />
the baseline with measures projections.<br />
30. Around 500 installations in the first phase of the<br />
EU emissions trading scheme are also at least<br />
partially covered by CCAs. The <strong>UK</strong> has obtained<br />
temporary exclusion for 331 of these, with the<br />
remainder opting to go into the scheme. To apply<br />
equivalent reporting arrangements with the EU<br />
ETS, which is a requirement of the Directive, the<br />
target units containing a temporarily excluded<br />
installation will report their CCA performance<br />
annually for the duration of the exclusion.<br />
31. For those installations opting to enter the EU ETS,<br />
there are overlaps in coverage with the CCAs. It<br />
was necessary to avoid the situation where<br />
companies would be able to sell a surplus arising<br />
from the same emission reduction in both<br />
schemes, or alternatively have to buy in both<br />
schemes to cover the same shortfall. Industry<br />
preferred a mechanism to net off the EU ETS<br />
surplus from the CCA performance to the<br />
alternative of taking out the EU ETS emissions<br />
from the CCA target. This procedure is in place<br />
for the first phase of the EU trading scheme, but<br />
the Government is consulting the sectors through<br />
the <strong>UK</strong> Emissions Trading Group on arrangements<br />
for the second phase.
50<br />
Business<br />
Carbon Trust<br />
1,000 installations, responsible for approximately<br />
50 per cent of our carbon dioxide emissions,<br />
including electricity generators, oil refineries,<br />
offshore platforms and industrial plants in the<br />
iron and steel, cement and chemicals sectors.<br />
32. The Carbon Trust is an independent company<br />
funded by the Government. It was established in<br />
April 2001, at the same time as the climate<br />
change levy was introduced, to help the <strong>UK</strong> move<br />
towards a low carbon economy by helping<br />
business and the public sector save energy,<br />
reduce carbon dioxide emissions and capture the<br />
commercial opportunities of low carbon<br />
technologies. It provides independent information<br />
and impartial advice on energy saving and carbon<br />
management, through site visits, events, and case<br />
studies.<br />
33. Carbon management is a systematic approach to<br />
support core business strategy looking at every<br />
aspect of an organisation’s performance in<br />
relation to climate change. The Carbon<br />
Management <strong>Programme</strong> has worked with more<br />
than 200 large companies, 63 local authorities<br />
and five major Government departments.<br />
34. The Carbon Trust also promotes the Enhanced<br />
Capital Allowances Scheme to encourage<br />
investment by business in qualifying energy<br />
saving technologies and products, and manages<br />
the list of qualifying equipment. Companies can<br />
claim 100 per cent first year allowances against<br />
investment in qualifying technologies.<br />
EU Emissions Trading Scheme<br />
35. The European Emissions Trading Scheme (EU ETS),<br />
which was established in 2003 by Directive<br />
2003/87/EC, is the largest emissions trading<br />
scheme in the world, regulating emissions of<br />
carbon dioxide from over 11,500 installations<br />
across Europe. In the <strong>UK</strong>, the scheme covers over<br />
36. The Government believes that, by providing for<br />
emissions savings to be made at the point of least<br />
cost, emissions trading is a cost-effective<br />
mechanism for reducing greenhouse gas<br />
emissions. The 2003 Energy White Paper therefore<br />
made clear that the Government wanted the EU<br />
emissions trading scheme to play a central role in<br />
our future emissions reduction policies.<br />
37. Since the Directive was adopted, the European<br />
Commission, the <strong>UK</strong> and other Member States<br />
have successfully established the institutional<br />
framework necessary for the scheme’s operation.<br />
National Allocation Plans for the first phase of the<br />
scheme which runs from 2005 to 2007 have<br />
been submitted by all Member States and been<br />
approved by the European Commission 3 . These<br />
plans state the total quantity of allowances to be<br />
issued – the ‘cap’ – and how many allowances<br />
each installation will receive. Since 1 January<br />
2005, operators of installations have been<br />
required to monitor their emissions and to ensure<br />
that they surrender allowances equivalent to their<br />
emissions in any calendar year. The Government<br />
has played an active role in the development of<br />
emissions trading registries which track the<br />
ownership and transfer of allowances and the <strong>UK</strong><br />
has licensed its GRETA software to 16 other<br />
States. The ‘carbon market’, which trades in EU<br />
3 For further details of the National Allocation Plans of other Member States see: www.europa.eu.int/comm/environment/climat/emission_plans.htm
Business<br />
51<br />
ETS allowances has developed rapidly across<br />
Europe with the City of London emerging as one<br />
of the main centres of trade.<br />
by the electricity supply industry, which is<br />
relatively less subject to international competition<br />
and able to pass on costs.<br />
38. The second phase of the scheme runs from 2008<br />
to 2012, coinciding with the first Kyoto Protocol<br />
commitment period. In developing their National<br />
Allocation Plans for the next phase, Member<br />
States will have to demonstrate how they intend<br />
to use the scheme and other policies and<br />
measures to achieve their targets under the<br />
burden sharing agreement. Over the last year, the<br />
Government has been working with the European<br />
Commission and other Member States to ensure<br />
that the lessons learned from the implementation<br />
of the scheme are applied for the second phase.<br />
39. For the purpose of assessing the contribution of<br />
the EU emissions trading scheme to the<br />
Government’s 2010 domestic carbon dioxide<br />
goal, the key issue is the total quantity of<br />
allowances to be allocated to <strong>UK</strong> installations.<br />
Installations in the EU emissions trading scheme<br />
can meet their obligations by purchasing<br />
allowances, which might come from installations<br />
in other EU countries, and credits from the Kyoto<br />
Protocol project mechanisms, which will come<br />
from outside the <strong>UK</strong> and might come from<br />
reducing emissions of greenhouse gases other<br />
than carbon dioxide. This means that the<br />
emissions reductions expected from the second<br />
phase of the scheme and included in this<br />
<strong>Programme</strong> (see below), will not necessarily take<br />
place in the <strong>UK</strong>, nor will they necessarily be of<br />
carbon dioxide. Nevertheless, as the chapter “<strong>UK</strong><br />
Emissions Inventory and Projections” explains 4 ,<br />
the Government will include allowances or<br />
project credits surrendered by installations in its<br />
assessment of the <strong>UK</strong>’s progress towards the<br />
2010 domestic carbon dioxide goal.<br />
40. The Government has decided that the overall cap<br />
for the second phase of the EU emissions trading<br />
scheme should be set within a range which<br />
would achieve average annual emission<br />
reductions of between 3.0 and 8.0 MtC. In the<br />
draft National Allocation Plan, the Government<br />
proposes that the reductions in allowances<br />
against business as usual would be borne entirely<br />
Key priorities for the second phase of<br />
the EU emissions trading scheme<br />
1 Contribution to <strong>UK</strong> emissions reduction<br />
targets: The Government has said that the<br />
total quantity of allowances allocated for<br />
the second phase should be consistent with<br />
ensuring that the trading sector makes an<br />
appropriate contribution to the domestic<br />
goal to reduce carbon dioxide emissions by<br />
20 per cent below 1990 levels by 2010 and<br />
ensure it contributes to making progress<br />
towards the long-term targets set out in the<br />
Energy White Paper.<br />
2 Maintain the competitive position of <strong>UK</strong><br />
industry: The Government has been<br />
working with other Member States and the<br />
European Commission to improve<br />
consistency of implementation of the<br />
Directive and welcomes the further<br />
clarification provided by the Commission’s<br />
guidance for the second phase. Application<br />
of the guidance will minimise distortions<br />
that have arisen through different<br />
interpretations in the first phase and the<br />
Government will work to encourage robust<br />
and transparent assessment of National<br />
Allocation Plans for the second phase.<br />
3 Facilitate development of an economically<br />
efficient EU-wide trading market that<br />
incentivises emissions reductions and<br />
provides appropriate signals for long term<br />
investment. A key consideration has been to<br />
look for ways in which to improve the<br />
scheme for the second phase by providing<br />
appropriate messages to industry and<br />
signalling the long term direction of the<br />
Government’s policy.<br />
41. The EU emissions trading scheme will continue<br />
after 2012 and, as noted by the European<br />
Environment Council in October 2005, will remain<br />
an essential instrument in the EU’s medium and<br />
4 paragraph 4.
52<br />
Business<br />
long-term strategy to tackle climate change. The<br />
Government recognises the need for more<br />
certainty about the future shape of the trading<br />
scheme post 2012 to encourage investment in the<br />
technologies needed to deliver deeper cuts in<br />
emissions. There is a strong case for strengthening<br />
the scheme beyond 2012 and for developing a<br />
robust scheme that maintains the competitiveness<br />
of European firms, supports investment in<br />
developing countries through the continuation of<br />
the Clean Development Mechanism, and provides<br />
early certainty for industry. The European<br />
Commission’s review of the trading scheme will<br />
provide the best opportunity to address these<br />
issues, by considering the level of emissions<br />
reductions required in future phases and by<br />
moving towards a harmonised approach to<br />
allocation, such as auctioning, which motivates<br />
rather than discourages early investment.<br />
42. The review also provides an opportunity to<br />
consider the expansion of the scheme to other<br />
greenhouse gases and activities. This should build<br />
upon the work on expansion to other industrial<br />
sectors and gases undertaken by the <strong>UK</strong> and<br />
other Member States as part of their preparation<br />
for the second phase. It should also consider the<br />
prospects for applying emissions trading to other<br />
sectors. The Commission is due to report on the<br />
review by 30 June <strong>2006</strong>.<br />
<strong>UK</strong> Emissions Trading Scheme<br />
43. In April 2002, the Government established the<br />
first economy-wide greenhouse gas emissions<br />
trading scheme. To enter the <strong>UK</strong> Emissions Trading<br />
Scheme (<strong>UK</strong> ETS), the 33 Direct Participants bid<br />
annual, cumulative greenhouse gas emissions<br />
reductions targets set against a 1998-2000<br />
baseline, in return for a share of the incentive<br />
money of £215 million. Direct Participants<br />
committed to reduce their emissions by 3.96m<br />
tonnes CO 2<br />
equivalent (MtCO 2<br />
e) (1.08 MtC) by<br />
<strong>2006</strong>. The voluntary <strong>UK</strong> ETS was established as a<br />
5 year pilot scheme, and is set to end for Direct<br />
Participants in December <strong>2006</strong>. Installations<br />
temporarily excluded from the EU ETS due to <strong>UK</strong><br />
ETS participation will then move into the EU ETS.<br />
44. The three main aims of the scheme were to<br />
achieve cost-effective emissions reductions; to<br />
enable ‘learning by doing’ ahead of international<br />
emissions trading; and, to establish the City of<br />
London as a centre for emissions trading.<br />
45. In 2004, an independent National Audit Office<br />
report described the scheme as a “pioneering<br />
initiative” that had achieved “significant<br />
emissions reductions”. Whilst the scheme has<br />
mostly delivered its key aims, there are also<br />
important lessons to be learned, which the<br />
Government will apply in future policy<br />
development.<br />
46. To date, the scheme has delivered emissions<br />
reductions of over 1.6 MtC – significantly in<br />
excess of planned reductions. While the<br />
Government recognises that the voluntary nature<br />
of the scheme meant that it was more attractive<br />
to businesses with greater potential for low cost<br />
emissions reductions, which led to an oversupply<br />
of allowances and reduced liquidity in the<br />
market, it has nonetheless still delivered<br />
substantial emissions reductions. In particular, the<br />
inclusion of non-CO 2<br />
emissions meant that<br />
certain participants were able to install relatively<br />
low cost abatement equipment and then have<br />
large quantities of allowances to sell. Overall, as<br />
results from the first two years show, some<br />
companies were able to meet their targets easily,<br />
resulting in a surplus of allowances in the market,<br />
and a significant fall in the price of allowances.
Business<br />
53<br />
47. In November 2004, six leading companies restated<br />
their commitment to the <strong>UK</strong> ETS by offering an<br />
additional 2.4 MtC emissions reductions relative to<br />
their baselines by <strong>2006</strong>. This helped to reduce the<br />
overall surplus of allowances in the market and to<br />
keep the scheme on track. In considering the<br />
future policy mix (see paragraphs 11 and 53) the<br />
Government will take full account of the<br />
experience gained from the voluntary <strong>UK</strong> scheme.<br />
48. Site closures and other changes of operation are<br />
factored into annually amended baselines. Figure<br />
1 shows planned and actual emissions reductions<br />
due to the scheme.<br />
Direct Participants’ planned and delivered reductions in<br />
emissions levels<br />
Reduction in emissions levels due to<br />
the Scheme (MtCO 2e<br />
)<br />
7<br />
6<br />
5<br />
4<br />
3<br />
2<br />
1<br />
0<br />
2002 2002-<br />
2003<br />
Actual<br />
2002-<br />
2004<br />
2002-<br />
2005<br />
Planned<br />
2002-<br />
<strong>2006</strong><br />
49. Participants have gained valuable experience in<br />
developing emissions reduction strategies as well<br />
as learning about the mechanics of trading and<br />
how to monitor, report and verify their emissions.<br />
The Government has also learnt valuable lessons<br />
from the development of the scheme, notably the<br />
importance of incorporating emissions projections<br />
into baseline setting, to ensure “real and<br />
additional” emissions reductions, and the fact<br />
that trading has delivered more emissions<br />
reductions than expected.<br />
50. The <strong>UK</strong> ETS has given <strong>UK</strong> business a ‘first-mover<br />
advantage’ on the global carbon trading market.<br />
Companies providing emissions trading services,<br />
such as brokerage and verification, have gained<br />
experience that places them in a strong position<br />
as EU and international emissions trading<br />
develop. In addition, the <strong>UK</strong> Emissions Trading<br />
Registry (ETR) has been adapted for use in the EU<br />
scheme and the <strong>UK</strong>’s EU/UN registry has now<br />
been licensed to 16 other countries.<br />
51. In the Pre-Budget Report 2004, the Chancellor<br />
announced that <strong>Defra</strong> and HM Treasury would<br />
jointly sponsor a review into innovation in energy<br />
efficiency. The purpose of the review was to<br />
examine how a step-change in energy efficiency<br />
in the domestic, business and public sectors in<br />
the <strong>UK</strong> could be delivered cost-effectively and<br />
how energy efficiency improvement could be<br />
embedded into decision making across the<br />
economy. A summary of the principal conclusions<br />
of the review was published alongside the Pre-<br />
Budget report in December 2005. The Carbon<br />
Trust and the Energy Saving Trust published<br />
detailed, independent reports to Government at<br />
the same time.<br />
52. The Carbon Trust concluded that there is<br />
significant scope for cost-effective energy<br />
efficiency and emissions reductions in large nonenergy<br />
intensive businesses and public sector<br />
organisations. It put forward a proposal for a<br />
new, mandatory auction based <strong>UK</strong> emissions<br />
trading scheme, which would not be linked to<br />
the existing voluntary market, that would target<br />
energy use by large non-energy intensive<br />
businesses and public sector organisations not<br />
covered by the EU emissions trading scheme or<br />
climate change agreements.<br />
53. The Government is considering the proposal,<br />
which raises some important issues, and will<br />
decide in due course whether to take it forward.<br />
As well as exploring the potential environmental<br />
benefits of such a scheme, we will also examine<br />
the impact of such a scheme on different sectors,<br />
including implications for regulatory burden and<br />
competitiveness. We will also consider whether it<br />
would be consistent with the Government’s<br />
Better Regulation principles.<br />
Small and medium-sized businesses<br />
54. The Carbon Trust launched a pilot Energy<br />
Efficiency Loan scheme for SMEs in 2002. It
54<br />
Business<br />
provides interest free loans of between £5,000<br />
and £100,000 for up to four years for qualifying<br />
energy efficiency projects. The purpose of the<br />
scheme is to overcome a common barrier to<br />
investment – where the project is financially<br />
viable but the capital budget is constrained by<br />
short-term cash flow requirements. The Scottish<br />
Executive funds an equivalent scheme in Scotland<br />
called Loan Action Scotland.<br />
55. In the 2005 Pre-Budget Report, the<br />
Chancellor announced extra funding of £15m<br />
for the Carbon Trust to support the roll-out<br />
of the Energy Efficiency Loans scheme for<br />
SMEs, building on the current pilot. <strong>Defra</strong><br />
will provide additional funding to allow the<br />
Carbon Trust to expand the scheme further.<br />
The Government estimates that the scheme could<br />
save 0.1 MtC by 2010.<br />
56. The Government will introduce further<br />
measures to encourage and assist SMEs to<br />
take up energy saving opportunities. <strong>Defra</strong><br />
has commissioned work to examine some<br />
different possible policy options. Initial<br />
analysis suggests that these measures could save<br />
0.1 MtC by 2010.<br />
Improving company reporting on<br />
climate change<br />
57. There is an increasing recognition that good<br />
environmental performance makes good business<br />
sense. <strong>Climate</strong> change risks and uncertainties<br />
impact to some extent on many companies, and<br />
affect investment decisions, consumer behaviour<br />
and Government policy. Management of energy,<br />
natural resources or waste will affect current<br />
performance; failure to plan for a future in which<br />
environmental factors, such as climate change,<br />
are likely to be increasingly significant may risk<br />
the long-term future of a business.<br />
58. Some good progress has been made – the<br />
Carbon Disclosure Project’s third information<br />
request in 2005 received a record high 71 per<br />
cent disclosure rate from Financial Times Global<br />
500 companies, with 54 per cent disclosing<br />
emissions data. In the <strong>UK</strong>, 140 companies in the<br />
FTSE250 now report on their environmental<br />
performance. However, the number of FTSE All<br />
Share companies linking climate change and<br />
financial performance is markedly lower. For<br />
example, only 17 per cent of companies refer to<br />
climate change risks in their Annual Report and<br />
Accounts, and only 6 per cent provide<br />
quantitative information.<br />
59. From April 2005, the EU Accounts Modernisation<br />
Directive introduced requirements for quoted and<br />
large private companies to produce an Enhanced<br />
Business Review. Companies will need to report<br />
on environmental matters to the extent necessary<br />
for an understanding of the company’s<br />
development, performance or position.<br />
60. In January <strong>2006</strong>, the Government published<br />
‘Environmental Key Performance Indicators:<br />
reporting guidelines for <strong>UK</strong> business’ 5 . The use<br />
of Key Performance Indicators (KPIs) will help<br />
companies both manage and communicate the<br />
links between environmental and financial<br />
performance, and meet their reporting<br />
obligations under the EU Accounts Modernisation<br />
Directive, which requires, where appropriate,<br />
analysis using KPIs relating to environmental<br />
matters. For most sectors, greenhouse gas<br />
emissions is the most significant KPI, which<br />
means that KPIs provide a mechanism for<br />
Government to challenge the FTSE All Share and<br />
large private companies to report on their climate<br />
change performance in a transparent and<br />
meaningful way.<br />
Investors and climate change<br />
61. Investors’ primary interest in climate change is<br />
financial, and based upon the need to protect the<br />
value of the investments under their care. <strong>Climate</strong><br />
change brings with it compliance, reputational,<br />
strategic and physical risks for many sectors.<br />
Investors are beginning to check that companies<br />
have carbon management systems in place<br />
(including through the Carbon Disclosure Project).<br />
There are also many opportunities for companies<br />
to create shareholder value, for example through<br />
5 www.defra.gov.uk/corporate/consult/envrep-kpi/envrep-kpi.pdf<br />
6 The full statement can be found at www.defra.gov.uk/environment/business/scp/ems.htm
Business<br />
55<br />
energy efficiency, clean energy and new markets<br />
for low carbon products and services.<br />
62. The longer-term nature of climate change (versus<br />
investors’ typically shorter-term investment<br />
horizon) means that among most ‘mainstream’<br />
investors, interest is still at a fairly early stage.<br />
The Government is seeking to enable investors<br />
to engage more effectively in driving business<br />
change and is working with institutional<br />
investors, lenders and insurers. It is also currently<br />
examining policy options on long-term<br />
responsible investment. As part of this, the<br />
Government will look at what can be done to<br />
empower individuals to make sustainable choices<br />
in how their money is invested.<br />
63. The <strong>UK</strong> already has some landmark legislation in<br />
this area. The amendment to the Pensions Act<br />
1995 requiring pension schemes to state the<br />
extent to which they consider social,<br />
environmental or ethical issues in their investment<br />
strategy will continue to raise the profile of<br />
responsible investment. In August 2005, a guide<br />
for pension trustees on climate change, prepared<br />
by Mercer Investment Consulting for the Carbon<br />
Trust and the Institutional Investor Group on<br />
<strong>Climate</strong> <strong>Change</strong>, confirmed that considering<br />
climate risk was consistent with fiduciary duty.<br />
The guide offered innovative and practical<br />
guidance to pension trustees for understanding<br />
and addressing climate risk 7 .<br />
64. In the Charity Sector, the new Statement of<br />
Recommended Practice highlights the need for<br />
charities to communicate with their stakeholders<br />
and the public how ethical considerations, which<br />
include sustainability considerations, influence<br />
their investment decisions.<br />
65. The Carbon Trust is also actively engaging with<br />
the financial and investment community to<br />
encourage the emergence of a low carbon<br />
technology sector in the <strong>UK</strong>, primarily by<br />
supporting direct investment in low carbon<br />
technologies through direct venture capital<br />
investment in companies alongside commercial<br />
investors. In November 2004 one of the Carbon<br />
Trust’s investments, Ceres Power, floated on the<br />
Alternative Investment Market (AIM).<br />
66. The Trust also helps technology companies get<br />
ready for the investment market under its low<br />
carbon technology incubator programme. The<br />
Carbon Trust’s investor engagement programme<br />
plays a key independent role in the quantification<br />
of shareholder value at risk from climate change,<br />
and in engaging grassroots mainstream<br />
institutional investor interest.<br />
67. The Carbon Trust is building on the G8 Action<br />
Plan by bringing together leading international<br />
investors and policymakers to develop a better<br />
understanding of how policy can accelerate low<br />
carbon technology investment. This group,<br />
known as the Transatlantic Investment Forum,<br />
will feed in to the G8 Dialogue process.<br />
68. Many <strong>UK</strong> institutional investors are engaged in<br />
the United Nations Environment <strong>Programme</strong>’s<br />
Finance Initiative (UNEP-FI). UNEP-FI has facilitated<br />
the drafting of a set of Principles for Responsible<br />
Investment, expected to be launched in March<br />
<strong>2006</strong>. These are primarily designed to be applied<br />
by asset-owners (such as pension funds,<br />
endowments and insurance companies).<br />
69. In a similar vein, in 2002, the Corporation of<br />
London initiated the London Principles Project<br />
on the role of the <strong>UK</strong>’s financial services sector<br />
in promoting sustainable development. This<br />
proposed seven principles by which financial<br />
market mechanisms can best promote the<br />
financing of sustainable development, and is<br />
an example of the City of London’s leadership<br />
in this area.<br />
70. In March <strong>2006</strong>, the Carbon Trust published its<br />
report on <strong>Climate</strong> <strong>Change</strong> and Shareholder Value.<br />
This introduced a clear new methodology to<br />
analyse potential profit risk from climate change<br />
across a range of sectors. Its findings concluded<br />
that what can initially appear a high exposure, can<br />
reduce significantly if properly managed. Under its<br />
base case scenario, only two of the sector case<br />
studies analysed were exposed to value risk in<br />
excess of 10 per cent of Earnings before Interest<br />
and Tax (EBIT) by 2013. The report clearly<br />
illustrates that 'value at risk' is not as simple as<br />
mere emissions exposure, and that for many<br />
companies understanding their risk exposure<br />
7 It can be accessed through http://www.thecarbontrust.co.uk/trustees
56<br />
Business<br />
could be complex. The report provides a list of<br />
seven key questions that senior corporate<br />
management should ask themselves, and investors<br />
should ask companies, in order to ensure that<br />
climate risks are being properly addressed.<br />
Industrial processes<br />
71. Industrial processes produce significant emissions<br />
of nitrous oxide and fluorinated gases from large<br />
IPPC regulated sites. There has been<br />
understandable uncertainty about HFCs ever since<br />
the agreement of the Kyoto Protocol, and the<br />
Government believes it needs to give a clear<br />
signal to industry and users so that they can<br />
make investment decisions with more certainty.<br />
regulated. IPPC has applied to existing nitric acid<br />
production processes since the end of 2004.<br />
74. Total hydrofluorocarbon (HFC) emissions have<br />
fallen significantly between 1990 and 2004<br />
because of action to control emissions as a byproduct<br />
of one industrial process. However, this<br />
masks an underlying upward trend in emissions<br />
as HFCs are used as a replacement for ozonedepleting<br />
substances. The Government is<br />
concerned that emissions from these sources are<br />
forecast to grow strongly in the near future. It<br />
believes that this trend is unsustainable in the<br />
longer term and that action should be taken to<br />
limit the projected growth.<br />
75. The Government recognises that the successful<br />
phase out of ozone-depleting substances under<br />
the Montreal Protocol is being achieved with a<br />
range of technologies, and accepts that HFCs are<br />
necessary to replace ozone-depleting substances<br />
in some applications. In view of this, the key<br />
elements of the Government’s position on HFCs<br />
are set out below:<br />
• HFCs should only be used where other safe,<br />
technically feasible, cost effective and more<br />
environmentally acceptable alternatives do<br />
not exist;<br />
72. Nitrous oxide is emitted during the manufacture<br />
of adipic acid, an intermediate chemical in the<br />
production of nylon. Emissions from this process<br />
accounted for 6.8 MtC in 1990. DuPont (<strong>UK</strong>) Ltd<br />
operates the only adipic acid plant in the <strong>UK</strong>.<br />
Emissions from this source have been reduced<br />
greatly since 1990 due to the introduction of<br />
Common Off-gas Abatement (COGA) equipment<br />
in 1998, and are projected to be about 90 per<br />
cent lower in 2010.<br />
73. Manufacture of nitric acid was responsible for<br />
emissions of 1.1 MtC in 1990. Emissions are<br />
projected to decrease to 0.7 MtC by 2010 due<br />
mainly to the closure of one plant. All nine nitric<br />
acid manufacturing facilities in the <strong>UK</strong> are currently<br />
• HFCs are not sustainable in the long term –<br />
the Government believes that continued<br />
technological developments will mean that<br />
HFCs may eventually be able to be replaced in<br />
the applications where they are used;<br />
• HFC emission reduction strategies should not<br />
undermine commitments to phase out ozone<br />
depleting substances under the Montreal<br />
Protocol; and<br />
• HFC emissions will not be allowed to rise<br />
unchecked.<br />
76. This policy takes account of the fact that HFCs<br />
are used in a wide range of applications and that<br />
they will continue to have a role in these<br />
applications where there are no acceptable<br />
alternatives. At the same time, industry and users<br />
are being given a clear signal to look closely at all
Business<br />
57<br />
the alternatives and to select those that are more<br />
acceptable where they do exist.<br />
77. The policy also takes account of energy efficiency.<br />
The Government recognises that, over recent<br />
years, industry has made significant improvements<br />
in the energy efficiency of equipment but it<br />
believes there are opportunities for further gains.<br />
The scope for improving energy efficiency mainly<br />
depends upon the size, design, and the<br />
maintenance and operation of equipment. The<br />
choice of refrigerant can have an impact but is less<br />
significant. It is noted that the use of HFCs in<br />
insulation foams can in certain applications provide<br />
higher energy savings than other types of<br />
insulation.<br />
EU Regulation and Directive on f-gases<br />
78. Final agreement on a Regulation on certain<br />
fluorinated greenhouse gases and a Directive<br />
relating to emissions from Mobile Air<br />
Conditioning systems in cars was reached in<br />
January <strong>2006</strong>.<br />
79. The principal objective of these proposals is to<br />
contain, prevent and thereby reduce emissions of<br />
f-gases covered by the Kyoto Protocol. They will<br />
make a significant contribution towards the<br />
European Community’s Kyoto Protocol target by<br />
introducing cost effective mitigation measures.<br />
80. The main provisions in the Regulation cover:<br />
• containment through responsible handling<br />
during use;<br />
• certain placing on the market prohibitions.<br />
81. The Directive will modify the European Whole<br />
Vehicle Type Approval Directive (70/156/EEC),<br />
which lays down the procedure Member States<br />
use to ensure vehicles comply with technical<br />
requirements before they are placed on the<br />
market. The Directive will therefore place<br />
restrictions on the types of Mobile Air<br />
Conditioning (MAC) systems fitted to vehicles<br />
before vehicles are approved for sale. Specifically,<br />
the Directive will introduce:<br />
• a two-step phase out of MACs that use f-gases<br />
with a GWP greater than 150: 1 January 2011<br />
for new types of vehicle, and 1 January 2007<br />
the sunset date for all new vehicles;<br />
• maximum annual leakage limits to cover the<br />
interim period before the phase out; and<br />
• controls on refilling the retrofitting for these<br />
systems.<br />
82. These measures will minimise emissions of f-gas<br />
from MAC by ensuring only environmentally<br />
responsible technology may be fitted to any vehicle.<br />
83. The Regulation will enter into force in mid <strong>2006</strong><br />
with the main body of the provisions in the<br />
Regulation set to apply from one or two years<br />
after that date. The Government will work with<br />
key stakeholders to ensure that the key<br />
information is targeted to those who need it in<br />
timely way. We expect that the Directive will<br />
enter into force in mid <strong>2006</strong> and it will be<br />
transposed by the Vehicle Certification Agency.<br />
• recycling and end-of-life recovery;<br />
• training and certification for personnel<br />
involved in the containment and recovery f-<br />
gases;<br />
• reporting on quantities produced, supplied,<br />
used and emitted;<br />
• labelling of products and equipment;<br />
• certain application specific controls on use;<br />
and<br />
Waste management<br />
84. Methane is the dominant greenhouse gas<br />
emission from the waste sector, and of this,<br />
landfills contributed 98 per cent of national<br />
methane emissions from that sector in 1990.<br />
Landfill methane emissions are falling mainly<br />
because of increased collection of landfill gas for<br />
energy recovery and environmental control.<br />
Future reductions will be dominated by growth in<br />
alternative waste management routes.
58<br />
Business<br />
85. The EU Landfill Directive will have a significant<br />
effect on emissions; partly because it imposes<br />
strict engineering requirements on landfills, partly<br />
because it requires landfill gas (methane) to be<br />
captured and used, and partly as it imposes limits<br />
on the amount of biodegradable municipal waste<br />
that can be landfilled. The targets (based on the<br />
amount of waste produced in 1995) and<br />
timescales that apply to the <strong>UK</strong> are:<br />
• a reduction to 75 per cent of the total<br />
amount by 2010;<br />
• to 50 per cent of the total amount by 2013;<br />
and<br />
• to 35 per cent of the total amount by 2020.<br />
86. The Government has introduced a number of<br />
policy measures to divert biodegradable waste<br />
from landfill, including landfill allowance schemes<br />
to specifically meet these targets for<br />
biodegradable municipal waste, as well as more<br />
generally through increasing landfill tax. These<br />
are described in chapter 1 Diverting<br />
biodegradable municipal waste from landfill to<br />
meet these targets will result in additional carbon<br />
savings, through avoided methane emissions, of<br />
2.7 MtC by 2010 and 3.3 MtC by 2020<br />
(compared to 2000 levels) 8 . The total reduction in<br />
methane emission from <strong>UK</strong> landfills relative to the<br />
level in 1990 is between 6 and 7 million tonnes<br />
of carbon equivalent. Additionally the increase in<br />
energy recovery from biomass waste at<br />
incineration plant is projected to save a further<br />
0.2 MtC in 2010. This is built in to the baseline<br />
with measures projections.<br />
landfill, result in CO 2<br />
emissions from the transport,<br />
treatment and recovery or disposal of waste.<br />
88. There may be additional CO 2<br />
savings not in the<br />
baseline arising from savings in fossil fuel CO 2<br />
emissions due to an increase in energy from<br />
waste beyond the level allowed for in the DTI<br />
model; as a result of landfill allowance schemes<br />
(for municipal waste) and increases in landfill tax<br />
that will also impact on commercial and industrial<br />
waste streams. To the extent that the resulting<br />
changes in waste management practices<br />
(including increases in recycling) divert greater<br />
amounts of waste from landfill than is assumed in<br />
the DTI model, and displace additional fossil fuel<br />
generation, there will be further greenhouse gas<br />
emissions savings. These have not been quantified.<br />
Working with others to deliver change<br />
89. Businesses play a crucial role in supporting<br />
Government to move become innovative and<br />
develop low carbon emission technologies needs<br />
to stretch beyond 2010. Alongside companies<br />
that are already taking action to cut their<br />
emissions, there are already those that are<br />
developing innovative low-carbon products and<br />
services. To ensure this effort is maintained and<br />
enhanced, the Government is committed to carry<br />
on working to support the deployment of new<br />
technologies and products and to help develop<br />
vibrant markers to provide businesses with the<br />
confidence for long-term investments.<br />
87. Other waste management routes produce<br />
significantly less GHG emissions per tonne of<br />
waste managed than does landfill. The principal<br />
reason for this is that methane emissions from<br />
landfill are avoided by managing the waste some<br />
other way. In addition, however, recycling<br />
generates significant CO 2<br />
savings as a result of the<br />
reduced need to extract and process raw materials<br />
(although much of this benefit accrues overseas),<br />
whilst recovering energy from the biogenic<br />
fraction of waste yields other, relatively modest,<br />
savings. All waste management options, including<br />
8 <strong>UK</strong> Landfill Methane Emissions: Evaluation and Appraisal of Waste Policy and Projections to 2050, Golder Associates report for <strong>Defra</strong>, 2005.
Business<br />
59<br />
BT<br />
BT’s targets for sustainable environmental improvement include capping their CO 2<br />
emissions at no more<br />
than 25 per cent below 1996 levels by 2010. BT are currently running at a 53 per cent reduction below 1996<br />
levels and expect this figure to change significantly due to increases in electricity consumption as a result of<br />
increased broadband usage and the need to run two networks in parallel during installation of our new<br />
21st Century Network.<br />
The annual CO 2<br />
savings arising from their energy and fleet efficiency initiatives alone, which began in 1991,<br />
equate to almost 1.4 million tonnes of CO 2<br />
.<br />
In 2005 BT signed the world's largest green energy contract which means that almost all of its <strong>UK</strong> electricity<br />
needs will be met from environmentally-friendly, sustainable sources, including wind generation, solar,<br />
wave and hydroelectric schemes or low carbon fuel-efficient energy from CHP (combined heat and power)<br />
sources. In terms of CO 2<br />
emissions savings, this equates to an additional 325,000 tonnes each year<br />
(equivalent to the amount of CO 2<br />
produced by more than 100,000 cars) on top of the considerable savings<br />
we have already made in the last 10 years.<br />
90. In the 2005 Pre-Budget report 9 , the Government<br />
announced support for alternative sources of<br />
energy and committed to consult on carbon<br />
capture and storage (CCS) and work with Norway<br />
to develop its understanding of this technology<br />
further. In addition, Budget 2005 10 announced a<br />
new <strong>UK</strong> Energy Research Partnership (<strong>UK</strong>ERP)<br />
bringing together private and public sectors to<br />
develop a common vision for energy research an<br />
innovation. The Government will work closely<br />
with the <strong>UK</strong>ERP and will consider further the<br />
scope for supporting innovation and<br />
technological development as part of the<br />
Comprehensive Spending Review 2007.<br />
91. In October 2005, <strong>Defra</strong>, DTI and the <strong>Climate</strong><br />
Group co-hosted “<strong>Climate</strong> <strong>Change</strong>: The Business<br />
Forecast”, a major international conference. The<br />
event was attended by over 300 delegates, and<br />
produced a set of “business insights” on climate<br />
change. The consistent message from the<br />
discussions was that climate policy should be long<br />
(long-term), loud (to compete with other CSR<br />
issues) and legal (underpinned by regulation).<br />
92. Looking ahead, <strong>Defra</strong> is funding work by the <strong>UK</strong><br />
Business Council for Sustainable Energy and the<br />
<strong>Climate</strong> Group to examine business issues and<br />
concerns around the ‘post-2012’ debate, the<br />
date when the first commitment period ends<br />
under the Kyoto Protocol.<br />
The G8 Davos <strong>Climate</strong> <strong>Change</strong> Roundtable is a collaborative project between the <strong>UK</strong> Government and the<br />
World Economic Forum in the year of the <strong>UK</strong>’s G8 Presidency. It was conceived as a way of providing global<br />
business leaders with an opportunity to present the Prime Minister with their perspectives on climate<br />
change ahead of the G8 Summit.<br />
The Corporate Leaders Group (CLG) was convened by the University of Cambridge <strong>Programme</strong> for Industry,<br />
under the auspices of HRH The Prince of Wales’ Business & the Environment <strong>Programme</strong>. In a letter to the<br />
Prime Minister, the CLG offered advice and help in taking forward action on climate change, including<br />
proposing a partnership between business and the <strong>UK</strong> Government. Secretaries of State for <strong>Defra</strong> and DTI<br />
met the CLG on 20 July 2005 to discuss how to take forward this offer.<br />
Representatives of both the Davos Roundtable and the Corporate Leaders Group presented their messages<br />
to the Prime Minister at a meeting on 9 June 2005, ahead of the G8 Summit.<br />
10 www.hm-treasury.gov.uk/media/FA6/45/pbr05_chapter7_173.pdf<br />
11 www.hm-treasury.gov.uk/media/AA7/59/bud05_chap07_171.pdf
60<br />
Business<br />
Environment Agency<br />
93. The Environment Agency for England and Wales<br />
plays a major role in managing climate change.<br />
With the exception of offshore installations that<br />
are regulated by DTI, the Agency is the main<br />
Competent Authority to implement the EU<br />
emissions trading scheme in England and Wales,<br />
and it handles the registry for the <strong>UK</strong>.<br />
places a strong emphasis on a sustainable energy<br />
and transport policies for the <strong>UK</strong> and on the<br />
actions that trade unions can take in the<br />
workplace, in their own operations and in the<br />
management of their pension funds to deliver this.<br />
94. The Environment Agency promotes the<br />
implementation of waste minimisation action<br />
plans at industrial and commercial sites action<br />
plans and seeks to ensure the use of Best<br />
Available Technology (BAT). In the future, the<br />
Environment Agency will seek to assess the scope<br />
for reducing non-carbon dioxide greenhouse<br />
gases using IPPC measures and by promoting<br />
waste and land/soil management practices that<br />
reduce methane emissions and nitrous oxide<br />
emissions. It will also promote renewable energy<br />
technologies onshore and offshore and will<br />
prepare to handle the regulatory impact of<br />
emerging technologies (such as hydrogen,<br />
carbon capture and storage).<br />
95. The Environment Agency also has an important<br />
role on work adapting to climate change. It has<br />
core responsibilities on coastal and river flood risk<br />
management and water resource planning and<br />
ensures that general environmental protection<br />
responsibilities are incorporated in its operations.<br />
Representative groups and trade<br />
unions<br />
96. There is great potential for the trade unions to<br />
work in partnership with Government and<br />
businesses to tackle climate change in the<br />
workplace. The Trade Union Sustainable<br />
Development Advisory Committee (TUSDAC) can<br />
mobilise the trade union movement to engage<br />
companies on these issues and provide pertinent<br />
advice to Government. In June 2005, the trade<br />
unions launched Greening the Workplace , a<br />
forward-looking strategy to tackle climate change<br />
and other environmental issues. The strategy
CHAPTER FIVE<br />
Transport<br />
61<br />
In 2004, the transport sector was responsible<br />
for around 27 per cent of total <strong>UK</strong> carbon<br />
dioxide emissions. Emissions had risen to about<br />
10 per cent above 1990 levels by 2004. We<br />
estimate that including the expected impact of<br />
the new measures in this <strong>Programme</strong>, emissions<br />
are expected to be at the same levels in 2010.<br />
Similarly greenhouse gases had increased by<br />
around 12 per cent between the base year and<br />
2004 and we estimate that they will be at<br />
about the same level in 2010 with the new<br />
measures described in this chapter.<br />
Introduction<br />
1. It is important to be clear why transport<br />
emissions are rising, especially at a time when<br />
emissions from most other sectors are falling. As<br />
the economy grows, people travel much further<br />
than they used to and buy more goods from all<br />
over the world.<br />
The Government is committed to reducing the<br />
impact of travel on the environment and with<br />
the devolved administrations is promoting<br />
policies to reduce the fossil carbon content of<br />
transport fuels, increase the fuel efficiency of<br />
vehicles and encourage a move towards more<br />
environmentally friendly forms of transport.<br />
Measures included as part of the 2000 <strong>Climate</strong><br />
<strong>Change</strong> <strong>Programme</strong> are projected to save around<br />
5.1 MtC by 2010. The voluntary agreement package<br />
(including reform of company car taxation and<br />
graduated vehicle excuse duty – 2.3 MtC),<br />
wider transport policies (0.8 MtC), sustainable<br />
distribution (in Scotland – 0.1MtC) and the fuel<br />
duty escalator (1.9 MtC) are the main contributors.<br />
New measures delivering savings to 2010 include:<br />
• the Renewable Transport Fuel Obligation<br />
which will require 5 per cent of all <strong>UK</strong> fuel<br />
sales to come from renewable sources by<br />
2010-11; and<br />
• further improving the fuel efficiency of new<br />
vehicles, for example through use of fiscal<br />
incentives and by working to develop<br />
options on how to move forward beyond the<br />
first phase of the EU voluntary agreements<br />
with automotive manufacturers after 2008.<br />
Together it is estimated that these new<br />
measures will contribute an additional 1.7 MtC<br />
savings in 2010, bringing total savings in 2010<br />
to 6.8 MtC. Further unquantified carbon<br />
savings will be delivered through measures to<br />
help people make smarter travel choices,<br />
including using more fuel efficient vehicles.<br />
Also, looking beyond this programme, we will<br />
continue to work towards the inclusion of<br />
aviation in the EU emissions trading scheme.<br />
2. As they get more prosperous, they also tend to<br />
choose to travel in a way that uses more carbon.<br />
Instead of walking, they are more likely to take<br />
the bus and instead of taking the bus they go by<br />
car or by train. They also heat their homes more<br />
and their businesses use more fuel. But the<br />
impact on travel is larger because in a growing<br />
economy the demand for transport fuel grows<br />
faster than the demand for other kinds of fuel<br />
and so transport's share of total emissions is likely<br />
to increase.<br />
3. This is why road transport CO 2<br />
emissions grew by<br />
8 per cent between 1990 and 2000 even though<br />
average new car fuel efficiency has improved by<br />
10 per cent since 1997. And this is why forecasts<br />
indicate that road transport emissions will grow<br />
by another 8 per cent between 2000 and 2010,<br />
although the link between traffic growth and<br />
economic growth has weakened in recent years.<br />
4. This is the difficult backdrop against which the<br />
Government’s decisions are made. What we need<br />
to do is on the one hand reduce the<br />
environmental impact of the journeys people
62<br />
Transport<br />
make and on the other hand help people make<br />
more informed travel choices, which will benefit<br />
both them and the environment.<br />
5. And in making a significant contribution to<br />
meeting the Government’s long-term emissions<br />
reduction goals there will also be opportunities<br />
for the transport sector and for <strong>UK</strong> industry, with<br />
the potential to benefit from domestic and global<br />
demand for innovative products and services<br />
geared towards greener transport.<br />
2004, and would be expected to be 15.6 per<br />
cent above 1990 emissions by 2010 in the<br />
absence of the further measures described in this<br />
chapter. The table below shows the baseline<br />
‘with measures’ projections for transport to 2020.<br />
These projections include the effect of policies<br />
introduced since Kyoto but not the additional<br />
policies and measures in this programme. 1<br />
Potential carbon savings<br />
Greenhouse gas emissions inventory<br />
and projections<br />
6. Transport accounted for about 21 per cent of <strong>UK</strong><br />
greenhouse gas emissions in 2004. Carbon<br />
dioxide is the most significant greenhouse gas<br />
emitted from this sector, accounting for over 95<br />
per cent of emissions in 2004. Nitrous oxide is<br />
emitted during the catalytic conversion of vehicle<br />
exhaust, and hydrofluorocarbons are emitted<br />
from vehicle air conditioning systems and<br />
refrigerated transport. Methane is emitted in<br />
small amounts by natural gas powered vehicles.<br />
7. Greenhouse gas emissions from road transport<br />
grew by some 12 per cent between 1990 and<br />
8. The Government appraises all its road schemes<br />
for their environmental impacts, including carbon<br />
dioxide emissions. Beyond this the Government<br />
has a range of policies in place to reduce the<br />
environmental impact of transport and these are<br />
already delivering significant carbon savings.<br />
9. But we want and need to do more, and so this<br />
programme adds a set of carbon-saving policies<br />
including:<br />
• the Renewable Transport Fuels Obligation;<br />
• measures to help people make smarter travel<br />
choices; and<br />
Greenhouse gas emissions from transport, MtC<br />
Gas 1990 1995 2000 2004 2010 2015 2020<br />
Carbon dioxide 39.2 39.8 40.9 43.1 44.8 45.7 45.3<br />
Methane 0.6 0.6 0.4 0.3 0.1 0.1 0.1<br />
Nitrous oxide 0.4 0.8 1.3 1.6 1.7 1.8 1.9<br />
Total 40.2 41.2 42.6 45.0 46.5 47.5 47.2<br />
<strong>Change</strong> from 1990 levels 2.3 5.8 11.8 15.6 18.0 17.4<br />
Note: the percentage changes and emission estimates may differ slightly due to rounding<br />
Existing measures<br />
Carbon savings in 2010 (MtC)<br />
Voluntary Agreement package, including reform<br />
of company car taxation and graduated VED 2.3<br />
Wider transport measures 2 0.8<br />
Sustainable distribution (in Scotland) 0.1<br />
Fuel duty escalator 3 1.9<br />
TOTAL 5.1<br />
1 Transport's use of energy including refineries is included in the carbon dioxide estimates given in the table. The estimates also include emissions from<br />
domestic aviation, but not emissions from international aviation which are currently excluded from international target assessments.<br />
2 As set out in 'Transport 2010: The 10 Year Plan for Transport' and built upon in 'The Future of Transport: A network for 2030'.<br />
3 The fuel duty escalator was in place from 1993 to 1999. Carbon savings have been estimated by comparing the level of emissions with the fuel duty<br />
escalator in place with what would have happened had fuel duty been increased annually in line with inflation.
Transport<br />
63<br />
• further improving the fuel efficiency of new<br />
vehicles, for example by enhancing fiscal<br />
incentives to choose less polluting vehicles<br />
and working to develop options on how to<br />
move forward beyond the first phase of the<br />
EU voluntary agreements with automotive<br />
manufacturers after 2008.<br />
10. Overall, these additional policies are designed to<br />
reduce carbon dioxide emissions by 1.7 million<br />
tonnes per annum in 2010. This is over and<br />
above the carbon savings from the measures that<br />
have been previously agreed and does not<br />
include the potential benefits from including<br />
surface transport in emissions trading schemes.<br />
Projections of greenhouse gas emissions from the transport sector<br />
and the estimated effect of additional quantified measures, MtC<br />
MtC<br />
50<br />
48<br />
46<br />
44<br />
42<br />
40<br />
38<br />
36<br />
34<br />
1990 1995 2000 2005 2010 2015 2020<br />
Historical trend<br />
Baseline with measures projections<br />
Additional quantified measures<br />
Impact of transport on carbon emissions from 1990-2010, MtC<br />
-6 -4 -2 0 2 4 6 8 10 12<br />
Increased traffic growth due to GDP growth<br />
Lower real fuel prices 2000-2010<br />
Higher real fuel prices 1990-2000<br />
Better car fuel efficiency due to VAs package,<br />
including reforms to VED and CCT<br />
Measures including RTFO and sustainable distribution<br />
Notes: VAs = Voluntary agreements, VED = Vehicle Excise Duty, CCT =<br />
Company Car Tax, RTFO = Renewable Transport Fuel Obligation<br />
11. The Government estimates that, as a result of the<br />
additional measures we are taking, transport<br />
carbon dioxide emissions in 2010 will be 5 per<br />
cent lower than they would have been from the<br />
original programme (the with measures<br />
projections), and 13 per cent lower than they<br />
would have been if we had not acted at all (if we<br />
had not taken the measures set out in the<br />
original climate change programme). This does<br />
not mean that we expect total transport<br />
emissions to fall.<br />
Additional measures<br />
Renewable Transport Fuel Obligation (RTFO) 1.6<br />
Future EU level agreement with car manufacturers<br />
to reduce CO 2<br />
emissions from new cars 0.1<br />
TOTAL 1.7<br />
Carbon savings in 2010 (MtC)
64<br />
Transport<br />
Policies and measures<br />
12. The Government is committed to promoting<br />
sustainable transport and cutting transport<br />
emissions in the medium to longer term. The task<br />
of tackling emissions growth in this sector from<br />
strong sustained economic growth is challenging<br />
and a range of approaches will be required,<br />
including regulation, taxation, public spending<br />
and voluntary measures.<br />
• promoting the inclusion of aviation in<br />
emissions trading schemes and developing the<br />
evidence base around the possibility of<br />
including surface transport in emissions<br />
trading schemes in the future.<br />
Reducing the fossil carbon content<br />
of road transport fuels<br />
15. The 2003 Energy White Paper made clear that for<br />
transport to play its part in putting the <strong>UK</strong> on the<br />
path to a 60 per cent reduction in CO 2<br />
emissions<br />
by 2050, with real progress by 2020, there has to<br />
be a move towards low carbon and renewably<br />
produced fuels.<br />
13. Carbon dioxide emissions from transport depend<br />
on three key variables:<br />
I) the fossil carbon content of fuel consumed;<br />
II) the fuel efficiency of vehicles; and<br />
III) the distance travelled and the means of<br />
transport chosen.<br />
14. It is essential that we address all three of these in<br />
the most cost-effective and practical way<br />
possible. To achieve this we need to take action<br />
on a range of levels and that is exactly what we<br />
are doing by developing policies for:<br />
• reducing the fossil carbon content of road<br />
transport fuels;<br />
• improving the fuel efficiency of vehicles;<br />
• encouraging a move towards more<br />
environmentally friendly means of transport;<br />
and<br />
16. The Government published the Alternative Fuels<br />
Framework as part of Pre-Budget Report 2003.<br />
This set out the Government’s commitment to<br />
promoting the development of sustainable<br />
alternatives to fossil fuel, and affirmed the need<br />
for fiscal incentives to reflect environmental<br />
benefits. The framework committed the<br />
Government to a three-year rolling guarantee for<br />
biofuels and road fuel gas duty rates, offering<br />
certainty to support investment. Budget <strong>2006</strong><br />
announced that the 20 pence per litre duty<br />
incentive for bioethanol and biodiesel will be<br />
maintained to 2008-09.<br />
17. In November 2005 the Government announced it<br />
would introduce a Renewable Transport Fuel<br />
Obligation (RTFO). The RTFO requires transport<br />
fuel suppliers to ensure a set percentage of their<br />
sales are from a renewable source. It will be<br />
introduced in 2008-09, with the obligation level set<br />
at 5% in 2010-11. We estimate that this will lead<br />
to a 1.6MtC reduction in emissions. This figure<br />
follows the internationally agreed methodology for<br />
allocating emissions to individual states, which<br />
prevents global double counting of emissions.<br />
As such it does not take into account the carbon<br />
emitted during the production of biofuels which<br />
are produced abroad and used in the <strong>UK</strong>. When<br />
this is taken into consideration the net global<br />
reduction in carbon dioxide emissions is around<br />
1MtC, equivalent to taking one million cars off the<br />
road, without stopping people from travelling.
Transport<br />
65<br />
18. Budget <strong>2006</strong> announced that the level of<br />
obligation will be 2.5% in 2008-09 and 3.75% in<br />
2009-10. This will ensure significant growth of<br />
biofuels prior to reaching the 5% level in 2010-<br />
11. RTFO levels beyond 2010-11 will be set in<br />
due course, but the Government intends that in<br />
principle the target should rise beyond 5% after<br />
2010-11, so long as infrastructural requirements<br />
and fuel and vehicle technical standards allow,<br />
and subject to the costs being acceptable to the<br />
consumer. This will deliver additional carbon<br />
savings from road transport.<br />
21. The Government has also announced, subject to<br />
State aids agreement, an Enhanced Capital<br />
Allowance (ECA) scheme for the cleanest biofuels<br />
production plant, to support innovation and help<br />
develop the lowest-carbon biofuels production<br />
methods. This will provide a 100% first-year<br />
allowance for biofuels plant that meet certain<br />
qualifying criteria and which make a good carbon<br />
balance inherent in the design. The Government<br />
has now applied for State aids approval and<br />
envisages the scheme starting early in 2007.<br />
22. To ensure that biofuels are sourced sustainably,<br />
the Government is developing a robust carbon<br />
and sustainability assurance scheme as part of the<br />
Obligation. Obligated companies will be required<br />
from day one to report on the level of carbon<br />
savings achieved and on the sustainability of their<br />
biofuel supplies.<br />
23. The Government is consulting on the details<br />
of how the Obligation will work, and aims<br />
to publish draft Regulations by early 2007.<br />
24. We are also working to support the use of clean,<br />
low carbon fuels:<br />
19. In the short term, the fuels that will be used to<br />
meet the Obligation are almost certain to be<br />
biofuels, which are available today and can easily<br />
be blended into today's petrol and diesel and<br />
used in any vehicle. Drivers filling up at petrol<br />
stations will not notice any difference, as biofuels<br />
used in low percentage blends do not change the<br />
performance of cars.<br />
20. Today most biofuels come from crops including<br />
oilseed rape and wheat. Biofuels can be blended<br />
with fossil fuels and used in ordinary cars. In the<br />
future we could see more advanced biofuels<br />
made from waste and possibly even renewable<br />
hydrogen. The Government is considering<br />
how best to use the Obligation to<br />
encourage innovation in this area, including<br />
the development of advanced biofuel<br />
production techniques to promote greater<br />
carbon savings.<br />
• the Hydrogen and Fuel Cells Demonstration<br />
<strong>Programme</strong> (referred to in the Energy<br />
Chapter) will provide £15m support over the<br />
next four years to demonstrate hydrogen and<br />
fuel cells, including the use of hydrogen as a<br />
transport fuel; and<br />
• The Government has announced a new grant<br />
programme to support an alternative refuelling<br />
infrastructure. This could, for<br />
example, include funding for hydrogen,<br />
electric, bio-ethanol and natural gas/biogas<br />
refuelling points 4 .<br />
Improving the fuel efficiency<br />
of vehicles<br />
25. We are taking action on a range of levels, from<br />
voluntary agreements to fiscal measures to<br />
information campaigns, to create incentives to<br />
encourage consumers to make more<br />
environmentally friendly choices and to make sure<br />
4 Details of the grant programme are at www.est.org.uk/fleet/funding/infrastructurep.
66<br />
Transport<br />
that they can make informed decisions. And the<br />
Energy Review will also be considering the medium<br />
to long-term potential of technologies to reduce<br />
carbon dioxide emissions in the transport sector.<br />
25. We have seen steady progress in improving the<br />
average fuel efficiency of new cars sold in the<br />
<strong>UK</strong>. New cars sold in the <strong>UK</strong> in 2004 were on<br />
average some 10 per cent more fuel-efficient<br />
than in 1997. The rate of progress has slowed in<br />
recent years, however, and new cars sold in 2005<br />
were only 0.9 per cent more fuel efficient on<br />
average than new cars sold in 2004. There is also<br />
an increasing split between the company car<br />
market, where average emissions of new vehicles<br />
continue to fall, and that for private cars, where<br />
progress has stagnated.<br />
26. The Government will also continue to<br />
support the development, introduction and<br />
take-up of new vehicle technologies to help<br />
cut carbon dioxide emissions. The 2002<br />
Powering Future Vehicles Strategy, which will be<br />
reviewed during <strong>2006</strong>, sets out the main policies<br />
and targets in this area and a grant programme<br />
supports research and development into low<br />
carbon vehicle technologies 5 . The Government<br />
will continue to fund the Low Carbon Vehicle<br />
Partnership (LowCVP), a stakeholder<br />
organisation set up in 2003 to help the shift<br />
towards low carbon vehicles and fuels.<br />
The Low Carbon Vehicle Partnership is an<br />
action and advisory group, established in<br />
January 2003 to take the lead in accelerating<br />
the shift to clean low carbon vehicles and fuels<br />
in the <strong>UK</strong>.<br />
LowCVP is a partnership of organisations from<br />
the automotive and fuel industries,<br />
Government, academia, environmental NGOs<br />
and other stakeholders who are working<br />
together on shared goals to make the shift<br />
happen.<br />
27. The Government is committed to the Voluntary<br />
Agreements on new car fuel efficiency<br />
between the European Commission and the<br />
automotive industry, which aim to improve the<br />
average fuel efficiency of new cars sold in the EU<br />
by 25 per cent by 2008-9 against a 1995<br />
baseline. These have already led to improvements<br />
in average new car fuel efficiency across the EU,<br />
but, as indicated in the figure below, indications<br />
are that the target is unlikely to be reached in<br />
full. The target has been set at EU level, and, as<br />
such, not all countries need to individually meet<br />
the target in order for it to be reached on<br />
average. However, by 2003 average new car<br />
carbon dioxide emissions had been reduced by<br />
only 12 per cent across the EU. The Government<br />
is pressing for new targets beyond 140g/km after<br />
2008 to be finalised as soon as possible. This<br />
might deliver carbon savings of 0.1 MtC in 2010,<br />
potentially increasing to 0.7MtC by 2015,<br />
depending on the form it took.<br />
European Community Strategy to reduce CO 2<br />
emissions from cars<br />
The voluntary agreements on new car fuel<br />
efficiency represent one of the three pillars of<br />
the European Community’s Strategy to reduce<br />
CO 2<br />
emissions from cars, launched in 1995. The<br />
aim of the strategy is to reach – by 2010 at the<br />
latest – an average CO 2<br />
emission figure of 120<br />
g/km from new passenger cars sold in the<br />
European Union. The objective of the voluntary<br />
agreements is to reduce average new car CO 2<br />
emissions to 140g/km by 2008-9, mainly<br />
through technological developments. The other<br />
two pillars of the Strategy are to improve<br />
consumer information on the fuel-economy<br />
of cars and market-based measures to<br />
influence motorists’ choice towards more<br />
fuel-efficient cars.<br />
More information on the strategy can be found<br />
at http://europa.eu.int/comm/environment/<br />
co2/co2_home.htm The strategy is currently<br />
being reviewed as part of the wider review of<br />
the European <strong>Climate</strong> <strong>Change</strong> <strong>Programme</strong>.<br />
5 Details of the grant programme are at www.est.org.uk/fleet/funding/lowcarbonresearch/.
Transport<br />
67<br />
Average new car CO 2<br />
emissions in grams per km for the <strong>UK</strong> and EU<br />
since 1995 (the base year of the voluntary agreement).<br />
CO 2<br />
(g/km)<br />
200<br />
190<br />
180<br />
170<br />
160<br />
150<br />
140<br />
130<br />
120<br />
1995<br />
2000<br />
Year<br />
Note: ACEA = European Automobile Manufacturers Association<br />
JAMA = Japanese Automobile Manufacturers Association<br />
KAMA = Korean Automobile Manufacturers Association<br />
28. The Government is committed to using<br />
vehicle taxation frameworks alongside other<br />
policy instruments to support the move to<br />
lower carbon transport. The Government<br />
reformed Vehicle Excise Duty in 2001 to move to<br />
a carbon dioxide-based graduated system, and<br />
reformed company car tax in 2002 to move the<br />
benefit in kind charge similarly to make it carbonbased.<br />
It is estimated that this saved 200,000 to<br />
300,000 tonnes of carbon in 2005 – and it is<br />
expected to save up to 0.65MtC in 2010.<br />
29. The company car tax fuel benefit charge was also<br />
reformed in 2003, and the Government<br />
published, alongside Budget <strong>2006</strong>, a consultation<br />
on capital allowances for new business cars,<br />
including options to introduce a range of first<br />
year allowances for cars depending on carbon<br />
emissions.<br />
30. Budget <strong>2006</strong> also announced further reforms to<br />
Vehicle Excise Duty (VED) for cars, to sharpen<br />
incentives to choose fuel-efficient cars. A new<br />
higher band of VED (Band G) has been set at<br />
£210 for the most polluting new cars, while VED<br />
for the very lowest-emission vehicles has been<br />
reduced to £0, to assist the development of the<br />
low carbon vehicles market.<br />
EU<br />
<strong>UK</strong><br />
2005<br />
ACEA<br />
JAMA/<br />
KAMA<br />
2010<br />
31. To further promote environmentally friendly<br />
vehicles, Budget <strong>2006</strong> announced that the<br />
threshold for the minimum percentage charge<br />
rate for calculating the company car tax benefit<br />
in kind will be reduced from 140g CO 2<br />
/km to<br />
135g CO 2<br />
/km in 2008-09. A new rate of 10% for<br />
cars of 120g CO 2<br />
and below will also be<br />
introduced from 2008-09.<br />
32. The chart below demonstrates the significant<br />
annual savings that can be made on VED and<br />
company car tax through opting for less polluting<br />
vehicles. The figures are illustrative (as the<br />
company care list price is held constant), however<br />
they demonstrate the level of savings available to<br />
motorists for a given company car list price.<br />
Annual VED and company car tax paid on a typical petrol company car<br />
£2,500<br />
£2,000<br />
£1,500<br />
£1,000<br />
£500<br />
£0<br />
VED<br />
Company car tax<br />
≥245<br />
240<br />
235<br />
230<br />
225<br />
220<br />
215<br />
210<br />
205<br />
200<br />
195<br />
190<br />
185<br />
180<br />
175<br />
170<br />
165<br />
160<br />
155<br />
150<br />
145<br />
140<br />
135<br />
130<br />
125<br />
120<br />
115<br />
110<br />
105<br />
≤100<br />
CO 2<br />
(g/km)<br />
33. It is important that consumers have the best<br />
possible information available to them when<br />
they buy a car, so that they can make informed<br />
choices, reflecting the benefits that lower<br />
emissions vehicles bring. With this in mind, most<br />
<strong>UK</strong> car showrooms now display colour-coded<br />
fuel efficiency labels, developed and delivered<br />
in close co-operation with the vehicle industry<br />
and LowCVP, which are directly linked to the<br />
Vehicle Excise Duty (VED) bands and which will<br />
be familiar to consumers used to similar labels<br />
for their household white goods.
68<br />
Transport<br />
An example of the fuel economy label, reflecting the recent changes<br />
to VED (note official VCA version not available at time of print)<br />
consumed and on accidents. This work should<br />
deliver increasing carbon savings over time and<br />
help reduce congestion as transport operators<br />
integrate this best practice fully into their<br />
everyday activities. In the meantime, we have<br />
decided to allocate a one off budget increase of<br />
£1.5m to the Safe and Fuel Efficient Driving<br />
scheme (SAFED) which aims both to provide<br />
relevant training and to identify best practice<br />
for truck and van drivers.<br />
34. We are also awaiting a legislative proposal from<br />
the European Commission which is likely to<br />
propose a mandatory system of colour coded<br />
fuel-efficiency labelling across the EU. The <strong>UK</strong><br />
strongly supports this approach, provided that<br />
flexibility is built into the system so that Member<br />
States can ensure compatibility with other<br />
national policy measures.<br />
Logistics<br />
35. In <strong>2006</strong> we will also look at how and<br />
whether to expand the sustainable<br />
distribution programmes to encourage<br />
efficient operating practices in the<br />
haulage/logistics industry through which we<br />
have been able to give practical advice on<br />
how to cut down on lorry mileage, on fuel<br />
36. Using rail instead of road to transport freight can<br />
also cut carbon emissions. The amount of freight<br />
moved by rail in terms of tonne kilometres has<br />
increased by over 55 per cent since 1995/96. The<br />
Government is currently spending around £20m<br />
each year on grants for rail freight, which take<br />
about 800,000 lorry movements off the road<br />
each year.<br />
The Food Industry Sustainability Strategy,<br />
published by <strong>Defra</strong> in April <strong>2006</strong>, challenges<br />
the food and drink industry (manufacturers,<br />
wholesalers, retailers and the food service<br />
sector) to make significant reductions in the<br />
external costs associated with the domestic<br />
transportation of food, including road<br />
congestion and carbon dioxide emissions, by<br />
building upon current best practice and the<br />
logistical improvements of the last decade.<br />
Emissions from food transportation by the food<br />
industry in the <strong>UK</strong> were about 2.6MtC in 2002.<br />
Hydrogen and hybrid buses<br />
The number 25 bus route runs the gamut of London traffic conditions in its journey between Oxford Circus<br />
and Ilford, which makes it a perfect choice for the first hydrogen fuel cell trial bus route. These buses emit<br />
only steam from their tailpipes, because they work by generating electricity from a fuel cell on the vehicle,<br />
in which hydrogen reacts with oxygen from the air to form an electrical charge which powers the vehicle. If<br />
the hydrogen can be produced from carbon-free sources such as renewable electricity, these vehicles could<br />
lead to totally carbon-free transport.<br />
In February <strong>2006</strong>, the Mayor of London announced the addition by Transport for London (TfL) of six new,<br />
environmentally friendly hybrid vehicles - the first ever such vehicles in London - to the London Buses fleet.<br />
The hybrids operate on route 360, run by London Central. A leafy motif on the buses will help passengers<br />
recognise their environmentally-friendly status. They use less fuel than a standard diesel bus, leading to a<br />
substantial reduction in carbon dioxide emissions.
Transport<br />
69<br />
Encouraging a move towards more<br />
environmentally friendly means of<br />
transport<br />
37. We are putting record investment into public<br />
transport to improve reliability and to give people<br />
a real alternative to travelling by car.<br />
38. The <strong>UK</strong> now has the fastest growing railway in<br />
Europe and we expect it to continue to grow.<br />
Encouraging more people to use rail rather than<br />
road helps because the average person travelling<br />
by rail produces around half the carbon dioxide<br />
emissions of the average person travelling by<br />
car 6 . The Government will consider how new<br />
technologies can improve energy efficiency<br />
and reduce fuel consumption to get even<br />
more environmental benefits from rail.<br />
39. A good bus network plays a similar role in cutting<br />
congestion and carbon dioxide emissions. In the July<br />
2004 Future of Transport White Paper we announced<br />
further measures to develop the potential of<br />
Quality Contracts, which give local authorities<br />
greater powers to determine the bus network.<br />
40. The Government has also greatly increased<br />
funding for local authority expenditure on<br />
infrastructure schemes such as bus lanes, and has<br />
funded many new services through the rural bus<br />
grants and urban bus challenge.<br />
41. Alongside this investment in public transport, we<br />
support a range of measures, called ‘smarter<br />
choices’ which are aimed at helping people<br />
choose sustainable travel options.<br />
42. The Government has also been encouraging local<br />
authorities to make smarter choices an integral<br />
part of their transport plans and have three<br />
headline projects:<br />
• with the Department for Education and Skills<br />
we are working on a Travelling to School<br />
initiative which aims to have active travel<br />
plans in every school in England by the end of<br />
the decade. We have already achieved our<br />
interim target for 25% of schools to have an<br />
active travel plan by March 2005;<br />
• the Sustainable Travel Towns initiative aims to<br />
create three showcase sustainable travel towns to<br />
act as models for other local authorities and<br />
show what can be achieved. Over five years, the<br />
Department for Transport is providing revenue<br />
funding for Darlington, Peterborough and<br />
Worcester to help them achieve this; and<br />
• we have set up an expert advisory body,<br />
Cycling England, with an annual budget of<br />
£5m a year for the next three years. Its work<br />
programme includes £2.8m a year for the<br />
next three years for six cycle demonstration<br />
towns to test the hypothesis that by<br />
providing investment at the level sustained<br />
by certain European towns which have seen<br />
cycling increase, cycling in English towns can<br />
be similarly increased. The towns are<br />
Aylesbury, Brighton, Darlington, Derby, Exeter<br />
and Lancaster (with Morecambe).<br />
Woodfield Infant and St George’s Junior<br />
Schools, Shrewsbury<br />
The share of children at these schools who<br />
walk, cycle or take the bus to school has risen<br />
steadily from 46 per cent in 2000 to 56 percent<br />
in 2004 – an impressive result as car use<br />
continues to rise nationwide. Of particular note<br />
is an almost doubling of the level of cycling at<br />
both schools, to 7 per cent.<br />
This success is down to a mix of imagination<br />
and commitment. In 2001 many parents told<br />
the schools that they were worried about the<br />
traffic around the school entrances and about<br />
the dangers of crossing local roads on their<br />
route to school. By 2002, the schools had<br />
produced their first joint travel plan offering:<br />
cycle training, walking buses, Walk to School<br />
Weeks and an innovative trailer bike loan<br />
scheme for parents. This travel plan was<br />
publicised at social and community events such<br />
as a summer fete and with a ‘walk and cycle to<br />
school’ winning entry in the 2003 Shrewsbury<br />
Carnival. In 2004, the children themselves were<br />
asked how they preferred to travel. Some<br />
73 per cent chose walking and cycling – only<br />
10 percent chose travelling by car.<br />
6 Average emission factors are calculated using 2002 National Atmospheric Emissions Inventory CO 2<br />
emissions estimates by mode/vehicle type and data on<br />
passenger kilometres and load factors from DfT Transport Statistics
70<br />
Transport<br />
43. Other aspects of transport policy can help<br />
support and reinforce the measures described<br />
above. These include using technology to enable<br />
the improved management of transport<br />
networks and to help manage demand. For<br />
instance in some local authority areas<br />
sophisticated real time information and traffic<br />
management systems are being used to provide<br />
bus priority at traffic signals and information for<br />
real-time passenger information displays.<br />
Transport information services, such as Transport<br />
Direct, can also help to encourage a move to<br />
more environmentally friendly means of transport<br />
by offering information on different forms of<br />
transport, and helping travellers to make betterinformed<br />
travel decisions.<br />
achieved occur within the surface transport sector<br />
itself, the impact on carbon prices and the impact<br />
on <strong>UK</strong> competitiveness.<br />
46. Drawing on the work we have already<br />
carried out, we will engage with key<br />
stakeholders, the European Commission and<br />
other EU member states to help develop a<br />
robust evidence base on the costs and<br />
benefits of including surface transport in CO 2<br />
emissions trading at an EU level. We will also<br />
continue to investigate the desirability of<br />
introducing surface transport CO 2<br />
emissions<br />
trading at a <strong>UK</strong> level, either as preparation<br />
for EU-wide adoption or as a self-standing<br />
measure.<br />
44. Demand management on the road network can<br />
include anything from relatively simple parking<br />
measures to sophisticated road pricing schemes.<br />
The Government is examining how pricing could<br />
be used to address congestion in areas where it is<br />
a problem today or soon will be. It is also<br />
committed to using pricing in these areas in ways<br />
that allow piloting of technology for a national<br />
scheme in the longer term. Complementary public<br />
transport and travel information, together with<br />
pricing, can form an overall transport solution to<br />
make a town or city a better place to live and<br />
work. The Government is prepared to invest up to<br />
£200m per annum between 2008/09 and<br />
2014/15 from the Transport Innovation Fund to<br />
support schemes involving road pricing, if suitable<br />
packages are developed by local authorities.<br />
Aviation<br />
47. At present, the emissions from international<br />
aviation are not included either in the Kyoto<br />
Protocol target, or the domestic carbon dioxide<br />
goal, as there is no international agreement yet<br />
on allocating these emissions to national<br />
greenhouse gas inventories. We are continuing to<br />
pursue such agreement with a view to their<br />
inclusion within any future international climate<br />
change regime. The Air Transport White Paper,<br />
published in December 2003, acknowledged the<br />
growing contribution that aviation emissions are<br />
making towards climate change and recognised<br />
the need for the aviation sector to take its share<br />
of responsibility for tackling the problem of<br />
climate change.<br />
Emissions trading schemes<br />
45. The Government has been examining the scope<br />
for including surface transport in CO 2<br />
emissions<br />
trading mechanisms. Whilst the results of our<br />
work suggest this could be a means of delivering<br />
carbon reductions at relatively low cost, there are<br />
many issues to be addressed before a definitive<br />
view can be taken about the desirability of<br />
including surface transport in emissions trading.<br />
These issues include the route for<br />
implementation, the regulatory burden on current<br />
and future participants, whether carbon savings
Transport<br />
71<br />
48. <strong>UK</strong> forecasts suggest that by 2030 carbon dioxide<br />
emissions from <strong>UK</strong> aviation could amount to<br />
some 16 to 18 MtC 7 , of which over 90 per cent<br />
would be from international flights. It has been<br />
estimated that the climate change impact of<br />
aircraft emissions are 2-4 times greater than that<br />
of CO 2<br />
alone. Further research is required to<br />
clarify the exact figure, but it is clear that the<br />
impact of aviation on climate change is greater<br />
than that due to direct CO 2<br />
emissions alone, due<br />
to some of the other emissions released and their<br />
specific effects at altitude (including increased<br />
tropospheric ozone, contrail formation and a<br />
small amount of methane destruction). Hence, as<br />
set out in the Air Transport White Paper, aviation<br />
could amount to about a quarter of the <strong>UK</strong>’s total<br />
contribution to global warming by 2030 8 .<br />
49. We believe that the best way of ensuring that<br />
aviation contributes towards climate stabilisation<br />
is through a well-designed emissions trading<br />
regime, because it allows a specific emissions<br />
limit to be set and achieves that limit in the most<br />
cost effective way.<br />
50. In light of this the Government made the<br />
inclusion of aviation in the EU emissions trading<br />
scheme by 2008 or as soon as possible thereafter,<br />
a priority of the recent <strong>UK</strong> Presidency of the<br />
European Union. Therefore we welcome the fact<br />
that in December 2005 under our chairmanship<br />
the EU Environment Council recognised that<br />
emissions trading seems to be the best way<br />
forward. The European Commission is taking<br />
forward work through an Aviation Working<br />
Group (within the European <strong>Climate</strong> <strong>Change</strong><br />
<strong>Programme</strong>) and will aim to bring forward draft<br />
legislation by the end of <strong>2006</strong>. We are taking an<br />
active role in this Working Group and will consult<br />
on this legislative proposal in due course, taking<br />
account of the full range of impacts, including on<br />
the existing trading scheme.<br />
• the geographical coverage of aviation<br />
emissions under the scheme;<br />
• the trading entity – who should be made<br />
responsible for surrendering allowances and<br />
be allowed to trade;<br />
• allocation methodology – how many allowances<br />
should be available, who should allocate them<br />
and how they would be allocated;<br />
• how to integrate aviation into the EU scheme,<br />
given that emissions from international<br />
aviation are not covered by assigned amount<br />
units (AAUs) under the Kyoto Protocol;<br />
• monitoring, reporting and verification – the<br />
emission measurement or calculation method<br />
to be used and the agent responsible for<br />
monitoring and reporting emissions; and<br />
• the impact on the allowance price of the<br />
current scheme – forecasting allowance prices<br />
is complicated and uncertain but an<br />
understanding of the impact on the allowance<br />
price should form part of the impact<br />
assessment of any legislative proposal.<br />
52. The Government is also continuing to press for<br />
the development and implementation, through<br />
the International Civil Aviation Organization, of<br />
emissions trading at the international level. It is<br />
also pressing for other ways of tackling aviation<br />
emissions, including:<br />
• the adoption by airports, airlines and air traffic<br />
controllers – including the European<br />
Organisation for the Safety of Air Navigation<br />
(EUROCONTROL) – of working practices that<br />
minimise the impact of their activities on<br />
climate change;<br />
51. In line with our approach to Better Regulation, a<br />
rigorous impact assessment will be central to<br />
policy decisions. Some of the key issues to<br />
consider are:<br />
• how the non-CO 2<br />
impacts of aviation should<br />
be covered;<br />
7 The Future of Air Transport, DfT 2003<br />
8 As an analytical device, <strong>UK</strong> aviation is defined here as all domestic services plus all international departures from the <strong>UK</strong>, there being no international<br />
agreement yet on how to divide international emissions into national contributions.
72<br />
Transport<br />
• research and development by aerospace<br />
manufacturers of new technologies to reduce<br />
the climate change impact of future aircraft;<br />
and<br />
• voluntary action by airlines, airports and<br />
aerospace companies to control greenhouse<br />
gas emissions and develop sustainability<br />
strategies (such as the Sustainable Aviation<br />
strategy). Such action should include emissions<br />
reporting and targets at a company level.<br />
53. All these measures provide a solid foundation for<br />
action in tackling aviation’s global impacts, but<br />
we realise that they may not provide a total<br />
solution. In view of this, the Government will<br />
continue to explore and discuss options for the<br />
use of economic instruments for tackling<br />
aviation's greenhouse gas emissions. The<br />
Government has made it clear that it reserves the<br />
right to act alone or bilaterally if progress at an<br />
international level proves too slow.<br />
Carbon offsetting<br />
54. We recognise the potential of carbon offsetting<br />
to help raise awareness of the environmental<br />
impact of travel and other activities. Investment in<br />
high quality offset projects (for example through<br />
the Clean Development Mechanism) can deliver<br />
certified emission reductions to offset<br />
unavoidable emissions and often provide<br />
additional sustainable development benefits.<br />
55. Carbon offsetting of air travel emissions played a<br />
large part in minimising the environmental impact<br />
of the <strong>UK</strong>’s G8 Presidency. As a result, the Kuyasa<br />
low-income housing energy upgrade project (the<br />
first Clean Development Mechanism project to be<br />
accredited in Africa) was selected to offset the G8<br />
Presidency. Emissions arising from the <strong>UK</strong>’s<br />
Presidency of the EU are to be offset in a similar<br />
way.<br />
56. We are developing this approach to offset<br />
emissions arising from central Government air<br />
travel through a Government Carbon Offsetting<br />
Fund from April <strong>2006</strong>. We are also encouraging<br />
other sectors to consider the value of offsetting<br />
and we welcome recent airline initiatives,<br />
allowing customers to voluntarily calculate and<br />
offset emissions from their flights.<br />
Shipping<br />
57. The <strong>UK</strong> is also playing an active role in reducing<br />
emissions from Shipping.<br />
58. In the medium to long term, technological<br />
improvements may deliver carbon savings. For<br />
example, developments in marine engine<br />
manufacturing, the use of propulsion systems<br />
other than diesel engines and alternative fuels<br />
could all offer ways to cut carbon dioxide<br />
emissions.<br />
59. Working within the International Maritime<br />
Organization (IMO), the <strong>UK</strong> made a significant<br />
contribution at the latest Maritime Environment<br />
Protection Committee (MEPC) negotiations on<br />
the adoption of Interim Guidelines for Voluntary<br />
Ship CO 2<br />
Emission Indexing for Use in Trials. Ships<br />
under the United Kingdom flag are being<br />
encouraged to participate in these trials, which<br />
will help identify a ship’s greenhouse gas index.<br />
Other Measures<br />
60. The Highways Agency is working hard to<br />
improve its environmental performance and has<br />
made substantial progress. The energy it uses to<br />
light the network and provide communications<br />
systems is now sourced in a greener way: 15 per<br />
cent will come from clean energy and the rest<br />
through good-quality Combined Heat and Power.<br />
The Agency has also adopted innovative<br />
construction techniques and materials, cutting<br />
both the embodied energy needs of roads and<br />
the energy used in transporting materials. On<br />
recent projects such techniques have saved tens<br />
of thousands of lorry trips. Beyond that, it is<br />
investigating the wider use of solar panels and<br />
inter-seasonal heat transfer systems.
Transport<br />
73<br />
61. On the issue of the extra carbon dioxide<br />
emissions that road improvements generate, we<br />
estimate that the road improvements this decade<br />
will only have a small impact – offsetting just 10<br />
per cent of the net carbon savings expected from<br />
the Renewable Transport Fuel Obligation in 2010.<br />
62. We will also conduct a feasibility study into the<br />
potential carbon emission reductions, and other<br />
environmental benefits, of an accreditation<br />
scheme for <strong>UK</strong> companies that implement best<br />
practice and show improvements in the<br />
environmental performance of their transport<br />
operations. Such a scheme could cover a wide<br />
range of issues, from the efficiency of HGVs<br />
and/or company cars to the travel modes used<br />
by employees when commuting and travelling<br />
for work.
74<br />
CHAPTER SIX<br />
Domestic<br />
In 2004, the domestic sector was responsible for around 27 per cent of total <strong>UK</strong> carbon dioxide emissions on<br />
an end user basis. Emissions had fallen to about 2 per cent below 1990 levels by 2004 and we estimate that,<br />
including the expected impact of the new measures included in this <strong>Programme</strong>, they will fall further, to<br />
almost 16 per cent below 1990 levels by 2010.<br />
Greenhouse gas emissions had fallen by about 5 per cent between the base year and 2004. We estimate<br />
that with the additional measures introduced in this <strong>Programme</strong>, they could fall further to almost 16 per<br />
cent below base year levels by 2010.<br />
The Government is committed to taking action to cut carbon dioxide emissions from the domestic sector.<br />
Tackling household energy usage is an effective way not only to reduce emissions but also to support<br />
progress towards wider economic and social objectives. Although most energy efficiency measures are very<br />
cost-effective, generating net benefits to consumers, significant barriers remain, especially the lack<br />
of consumer demand for energy efficiency measures.<br />
Measures introduced in the <strong>Climate</strong> <strong>Change</strong> <strong>Programme</strong> 2000 are estimated to save around 3.6 MtC in 2010.<br />
The Energy Efficiency Commitment (1.6 MtC), Building Regulations (1.5 MtC), and fuel poverty programmes<br />
(0.4 MtC) are the main contributors in carbon terms, with product policy and information, advice and<br />
support also playing a key role.<br />
New measures that will deliver additional carbon savings to 2010 are:<br />
• seeking to achieve substantially higher carbon savings from the Energy Efficiency Commitment in 2008-<br />
11. We will consider with stakeholders how to provide as much flexibility as possible in the range of<br />
measures that can be employed;<br />
• the Code for Sustainable Homes which has minimum standards for energy and water efficiency at every<br />
level of the Code, with the lowest levels raised above the level of mandatory building regulations;<br />
• the update to the Building Regulations in April <strong>2006</strong> to raise energy standards of new build and<br />
refurbished buildings. The cumulative effect of these and the 2002 and 2005 changes to the Building<br />
Regulations is substantial, giving a 40 per cent improvement in the energy efficiency of new buildings.<br />
We are also conducting a review of measures to improve the sustainability of existing buildings, which<br />
will be completed by summer <strong>2006</strong>;<br />
• more reliable consumer product information and setting effective standards for energy-using products<br />
via voluntary agreements, in particular a new initiative with major retailers, the Eco-design of Energy<br />
Using Products (EUP) framework Directive and other national, EU and international policy measures and<br />
initiatives, including public procurement;<br />
• enabling consumption feedback to households via improved billing and metering;<br />
• continuing to tackle fuel poverty through the Warm Front and Decent Homes programmes; and<br />
• continuing to support the activities of the Energy Saving Trust and the <strong>Climate</strong> <strong>Change</strong> Communications<br />
Initiative to raise awareness about climate change and the action individuals can take to help tackle it.<br />
We are launching a major new initiative designed to strengthen consumer demand for energy efficiency,<br />
working closely with local authorities, energy suppliers, and others, with funding of £20m over the next<br />
two years.<br />
Together, it is estimated that these new measures will contribute an additional 1.2 MtC of carbon savings in<br />
2010, bringing total savings in 2010 to 4.8 MtC.
Domestic<br />
75<br />
Introduction<br />
1. In 2004 the domestic sector was responsible for<br />
about 30 per cent of total <strong>UK</strong> energy use and<br />
about 27 per cent of carbon dioxide emissions on<br />
an end user basis. That energy is used by a wide<br />
range of different appliances in the home – with<br />
around 60 per cent used for heating, 20 per cent<br />
for hot water and the remainder for lighting and<br />
appliances.<br />
policy interventions are sometimes necessary.<br />
The case for government intervention needs to<br />
be built on a firm evidence base, with decisions<br />
taking account of wider economic and social<br />
objectives. Where the case for intervention is<br />
seen, the most cost-effective and well-targeted<br />
package of measures need to be used. But the<br />
Government cannot deliver this alone – it will<br />
need changes in consumer attitudes and<br />
behaviour if we are to successfully make a stepchange<br />
in energy efficiency and tackle the trend<br />
towards rising energy demand that has been<br />
predominant for recent decades.<br />
Greenhouse gas emissions inventory<br />
and projections<br />
2. A range of different approaches are required to<br />
tackle domestic energy efficiency effectively.<br />
These include the provision of information and<br />
advice to consumers, such as energy labels on<br />
new appliances, incentives, such as reduced VAT<br />
on energy saving materials, voluntary agreements<br />
with retailers and manufacturers, regulations,<br />
such as minimum standards for buildings and<br />
appliances, or supplier obligations such as the<br />
Energy Efficiency Commitment.<br />
3. There are many potential barriers to the take-up<br />
of energy efficiency measures in the home.<br />
People can be reluctant to introduce energy<br />
efficiency measures, even when they are<br />
demonstrably cost effective, for a variety of<br />
reasons – lack of awareness and information, lack<br />
of capital for the up-front investment required or<br />
other spending priorities, inertia, or an<br />
unwillingness to become involved in even limited<br />
building improvements, because of the ‘hassle<br />
factor’ for example. To correct these market<br />
failures, the Government recognises that different<br />
4. In 1990 greenhouse gas emissions from this<br />
sector were 45.8 MtC 1 , they had fallen to 43.7<br />
MtC in 2004 and they are projected to be 38.7<br />
MtC in 2010. Carbon dioxide emissions in 1990<br />
were 42.4MtC, and fell by 2.6MtC over the<br />
decade to reach 39.8MtC in 2000. This small net<br />
change was the result of the interaction between<br />
several much larger individual contributions over<br />
the decade. Three factors had a major influence<br />
on carbon dioxide emissions:<br />
• growth in demand for the underlying energy<br />
services (such as warmer homes, hot water,<br />
and home entertainment) – up nearly 30 per<br />
cent, i.e. 11.5 MtC;<br />
• background improvement in energy efficiency<br />
– over 1 per cent per annum or a 12 per cent<br />
reduction, i.e. 4.5 MtC; and<br />
• reduction in the carbon intensity of grid<br />
electricity resulting from the switch from coal<br />
to gas generation – worth over 20 per cent of<br />
household emissions, i.e. 8 MtC.<br />
Together with other smaller factors (such as fuel<br />
switching by householders and changes in<br />
external temperatures), which reduced emissions<br />
by around 1 MtC, these resulted in an overall net<br />
reduction of 6 per cent, or around 2.5 MtC.<br />
1 Emissions from the generation of electricity used by this sector are included in the total figures
76<br />
Domestic<br />
5. Over 2000-10, before the effects of policies in<br />
this programme are taken into account, emissions<br />
under Business as Usual (BAU) would now be<br />
expected to remain almost constant, increasing<br />
by only 0.3 MtC, from 39.8 MtC in 2000 to<br />
40.1 MtC in 2010. However, policy savings,<br />
which are calculated net of BAU savings, are<br />
expected to reduce annual emissions by 4.8 MtC<br />
below the BAU emissions figure for 2010, so that<br />
emissions in 2010 are projected to be 35.3 MtC.<br />
These policy savings consist of 3.6 MtC from<br />
policies in the 2000 programme and a further<br />
1.2 MtC from the new measures introduced in<br />
this programme. These savings will keep us on<br />
track to meet our 2010 targets for household<br />
energy efficiency 2 .<br />
6. As with the previous decade, the very small net<br />
change in estimated BAU emissions for 2000-<br />
2010 is the result of several larger effects: this<br />
time, they more or less cancel out.<br />
These are:<br />
• upward pressure from service demand<br />
increases (slightly less than in the 1990s as<br />
gas central heating installations saturate) at<br />
nearly 25 per cent, i.e. around 8.5 MtC;<br />
• decreases from the background level of<br />
energy efficiency improvement (ie before the<br />
additional effects of policies are counted), very<br />
similar to that over 1990-2000, at 12 per<br />
cent, i.e. around 4.5 MtC;<br />
Domestic carbon emissions<br />
1990<br />
2003<br />
By end use<br />
Lights &<br />
appliances<br />
33%<br />
Cooking<br />
8%<br />
Space<br />
heating<br />
41%<br />
Lights &<br />
appliances<br />
22%<br />
Cooking<br />
5%<br />
Space<br />
heating<br />
53%<br />
Water<br />
heating<br />
18%<br />
Water<br />
heating<br />
20%<br />
By fuel<br />
Oil<br />
5%<br />
Solid<br />
10%<br />
Gas<br />
37%<br />
Oil<br />
7%<br />
Solid<br />
3%<br />
Gas<br />
54%<br />
Electricity<br />
48%<br />
Electricity<br />
36%<br />
Source: <strong>Defra</strong><br />
2 Our targets are: savings of 3.5 MtC from households in England by 2010 (as set out in the Energy Efficiency Action Plan 2004, in fulfilment of the<br />
Sustainable Energy Act 2003); and to improve household energy efficiency in England by 20 per cent by 2010, from a 2000 baseline (Housing Act 2004).
Domestic<br />
77<br />
Greenhouse gas emissions from the domestic sector, MtC<br />
Gas Base year 1990 1995 2000 2004 2010 2015 2020<br />
Carbon dioxide 42.4 42.4 39.1 39.8 41.7 36.5 38.0 36.0<br />
Methane 3.2 3.2 2.3 1.6 1.2 1.2 1.0 0.8<br />
Nitrous oxide 0.2 0.2 0.2 0.1 0.1 0.2 0.2 0.1<br />
HFCs 0.1 0.0 0.1 0.6 0.7 0.8 0.8 0.8<br />
Total 45.9 45.8 41.7 42.1 43.7 38.7 39.9 37.7<br />
<strong>Change</strong> from base year -9.2 -8.3 -4.7 -15.8 -13.0 -17.9<br />
Note: the percentage changes and emission estimates may differ slightly due to rounding<br />
Existing measures<br />
EEC (2002-05) 0.4<br />
EEC (2005-08) 0.6<br />
EEC (2008-11) 0.6*<br />
Building Regulations <strong>2006</strong> including 2005 condensing<br />
boilers update 0.8<br />
Building Regulations 2002 0.7<br />
Warm Front and fuel poverty programmes 0.4<br />
Other measures 0.2<br />
TOTAL 3.6 3<br />
Carbon savings in 2010 (MtC)<br />
*Note: This does not include the proposed increase to EEC savings – see below.<br />
• smaller reduction than in the 1990s from<br />
changes in the generators’ fuel mix, probably<br />
around 3 MtC; and<br />
• a net reduction from smaller factors,<br />
i.e. around 1 MtC.<br />
The overall Business as Usual (BAU) effect is<br />
projected to be a small increase of 0.3 MtC over<br />
the decade.<br />
7. The main sources of other greenhouse gases from<br />
the domestic sector are methane from domestic<br />
waste disposed in landfill and hydrofluorocarbons<br />
from domestic refrigeration. Landfill methane<br />
emissions are expected to be around 70 per cent<br />
lower in 2010 than 1990, as a result of measures<br />
to collect and burn landfill gas and reduced<br />
waste disposal in landfill. Hydrofluorocarbon<br />
emissions are expected to increase from 0.1 to<br />
0.8 MtC from 1990 to 2010, due to their use as<br />
replacements for ozone-depleting refrigerants.<br />
Projections of greenhouse gas emissions from the domestic sector and<br />
the estimated effect of additional quantified measures, MtC<br />
MtC<br />
50<br />
48<br />
46<br />
44<br />
42<br />
40<br />
38<br />
36<br />
34<br />
32<br />
30<br />
1990 1995 2000 2005 2010 2015 2020<br />
Historical trend<br />
Baseline with measures projections<br />
Additional quantified measures<br />
3 Figures may not add up due to rounding
78<br />
Domestic<br />
Additional measures<br />
Increased activity in EEC (2008-11) 0.5*<br />
Provision of advice to stimulate early replacement of<br />
inefficient boilers and implementation of the<br />
Energy Performance of Buildings Directive 0.2<br />
Package of measures to improve energy efficiency<br />
in buildings 0.1<br />
Better billing and metering 0.2<br />
Products Policy: consumer information and standards<br />
for lights and other energy-using products (EUPs) 0.2<br />
TOTAL 1.2<br />
Carbon savings in 2010 (MtC)<br />
* This is the median figure from the range of proposed EEC (2008-11) levels<br />
Energy Efficiency Commitment (EEC)<br />
8. The Energy Efficiency Commitment (EEC) is the<br />
principal policy mechanism driving increases in<br />
the efficiency of existing homes. Under EEC,<br />
electricity and gas suppliers are required to<br />
achieve targets for the promotion of energy<br />
efficiency improvements in the domestic sector.<br />
These targets do not prescribe how suppliers<br />
should attain these improvements. Suppliers can<br />
fulfil their obligations by carrying out any<br />
combination of approved measures including<br />
installing insulation or supplying and promoting<br />
low-energy light bulbs, high efficiency appliances<br />
or boilers. The only constraint on the suppliers’<br />
activity is that they must achieve at least half of<br />
their energy savings in households on incomerelated<br />
benefits and tax credits.<br />
9. The first phase of EEC ran from April 2002 to<br />
March 2005. Energy suppliers successfully met<br />
their targets and were able to bank additional<br />
activity into the next phase of the scheme. EEC<br />
2002-05 is expected to save 0.37 MtC annually<br />
by 2010. The current phase of EEC running from<br />
April 2005 to March 2008 will deliver roughly<br />
double the level of activity of EEC 2002-05 and is<br />
expected to achieve carbon savings of around<br />
0.62 MtC annually by 2010.<br />
10. Since April 2002 EEC has delivered energy saving<br />
measures to consumers, with overall costeffectiveness<br />
of about £300 per tonne of carbon<br />
saved (i.e. net benefits) and costs to suppliers of<br />
around £3.20 per customer per fuel year 4 . The<br />
assumed average cost of the current phase of<br />
EEC to energy suppliers is estimated at less than<br />
£9 per fuel per customer per year. To put this<br />
indicative figure in context, energy bills in Great<br />
Britain currently average around £340 and £530<br />
per year for electricity and gas respectively 5 , so<br />
this contribution equates to around 2 per cent of<br />
household bills. On average, these costs will be<br />
more than outweighed, by the end of EEC2, by<br />
the benefits householders enjoy in the form of<br />
reduced fuel bills or increased comfort from<br />
installing the subsidised energy efficiency<br />
measures on offer. These benefits continue for<br />
the lifetime of the measure 6 .<br />
11. The Energy Efficiency Innovation Review 7 looked<br />
in detail at the scope to further expand EEC, and<br />
has concluded that it would be feasible and cost-<br />
4 Assessment of EEC 2002-05 Carbon, Energy and Cost Savings, (<strong>Defra</strong> <strong>2006</strong>), www.defra.gov.uk/environment/energy/eec/pdf/eec-assessment.pdf<br />
5 Source: Energywatch, March <strong>2006</strong>.<br />
6 Assuming around 12 years for appliances and 40 years for cavity wall insulation, for example<br />
7 www.defra.gov.uk/environment/energy/eeir/index.htm
Domestic<br />
79<br />
effective to do so. However, an increasing share<br />
of EEC activity is likely to come from the<br />
installation of insulation in privately owned<br />
homes, compared to the earlier years when<br />
activity in social housing predominated.<br />
Awareness needs to be raised to increase<br />
demand. To encourage consumers to take<br />
up energy efficiency measures, the<br />
Government is launching a major new<br />
initiative, working closely with local<br />
authorities, energy suppliers and others to<br />
help overcome consumers’ reluctance to<br />
invest in measures, with funding of<br />
£20m over the next two years.<br />
12. With the current phase of EEC underway for less<br />
than a year, it is too early to set a firm target for<br />
the next phase. The Government believes that<br />
in its third phase, which runs from 2008-11,<br />
the Energy Efficiency Commitment could<br />
offer more options for delivery of carbon<br />
savings, with a larger range of eligible<br />
measures and more scope for innovation and<br />
competition among companies to encourage<br />
consumers to reduce their energy demand.<br />
The scheme must, however, remain cost-effective<br />
and practical and the overall policy framework<br />
needs to continue to take account of wider social<br />
considerations. The design and scale of the<br />
scheme will be set following the review (which<br />
has already started) and public consultation in<br />
2007. The Government believes that it could<br />
deliver about 0.9 to 1.2 MtC per year by 2010.<br />
13. The Government intends to consider with all<br />
stakeholders how to provide as much<br />
flexibility as possible in the range of<br />
measures that can be employed to meet EEC<br />
targets, for example microgeneration,<br />
renewables, smart metering and behavioural<br />
measures. Legislative amendments currently<br />
being considered as part of the <strong>Climate</strong> <strong>Change</strong><br />
and Sustainable Energy Bill would allow the<br />
Government more flexibility in extending the<br />
range of measures suppliers could use to meet<br />
obligations in the domestic sector. The provisions<br />
would only be implemented following full<br />
analysis and consultation on the practical<br />
implications, potential benefits and disbenefits<br />
of such an approach, and would be included in<br />
our consultation process for the next phase of<br />
the EEC.<br />
14. The Government recognises the important role<br />
that market mechanisms can play in delivering<br />
environmental benefits at least cost and in a way<br />
that gives flexibility and stimulates innovation by<br />
business and has therefore commissioned a study<br />
to critically evaluate existing mechanisms and the<br />
potential to introduce new market-based<br />
mechanisms to deliver energy efficiency, with a<br />
particular focus on households. The Government<br />
has recently published this work and will use its<br />
conclusions to inform the EEC review, particularly<br />
the question of whether and if so, how enhanced<br />
trading should be incorporated into the EEC<br />
framework from 2008.<br />
15. The Government also recognises that appropriate<br />
transitional arrangements between one phase of<br />
the EEC and the next are essential to ensure<br />
effective delivery of higher targets. The<br />
Government intends to allow unlimited<br />
carry-over of activity from the current phase<br />
of EEC to the next and will establish<br />
effective transitional arrangements<br />
following appropriate consultation and<br />
analysis providing clarity as soon as possible<br />
on practical arrangements. Budget <strong>2006</strong><br />
announced that suppliers will be able to count<br />
extra work carried out in this EEC period towards<br />
their targets in the next period. As a result, British<br />
Gas, EDF, npower, PowerGen, and Scottish and<br />
Southern Energy have already announced that<br />
they will carry out between them an extra<br />
250,000 subsidised installations of home<br />
insulation over the next two years. This will bring<br />
forward annual carbon savings of 35,000 tonnes<br />
and reduce annual household bills by around<br />
£20 million.
80<br />
Domestic<br />
Building Regulations<br />
16. Building Regulations 8 are steadily driving up the<br />
energy standards of new and refurbished<br />
buildings. Since 1990, the energy efficiency of<br />
new buildings has increased by 70 per cent. For<br />
example, a house built to the 2002 standards<br />
uses about half the energy consumed in the<br />
average existing house. The 2002 Building<br />
Regulations are expected to deliver reductions in<br />
carbon dioxide emissions in 2010 of 0.7 MtC in<br />
the domestic sector.<br />
17. In September 2005, the Government announced<br />
further changes to the Building Regulations to<br />
make buildings more energy efficient. From April<br />
<strong>2006</strong> these new measures will deliver increased<br />
energy efficiency standards for new buildings of<br />
up to 27 per cent in non-domestic buildings,<br />
22 per cent in houses and 18 per cent in flats.<br />
On average the energy efficiency improvement in<br />
dwellings will be 20 per cent, which reflects the<br />
growing proportion of flats being built with more<br />
people now living alone.<br />
18. The new measures, taken together with the 2002<br />
revisions, will improve new build standards of<br />
energy efficiency by 40 per cent and cut fuel bills<br />
by up to 40 per cent for new homes built from<br />
<strong>2006</strong> compared to pre-April 2002 new build. The<br />
latest changes to new building standards and<br />
requirements for condensing boilers are expected<br />
to deliver carbon savings of around 0.75MtC per<br />
year by 2010 9 . One provision of the revised<br />
Building Regulations came into force in April<br />
2005, requiring all new and replacement boilers<br />
to be at least B-rated condensing boilers, subject<br />
to some exemptions. This has been a major<br />
success and has had the effect of rapidly<br />
increasing the market share of the most efficient<br />
condensing boilers.<br />
19. The Building Regulations do not currently address<br />
the fabric of a significant proportion of the existing<br />
building stock, which dominates the overall impact<br />
of buildings. There is significant potential to reduce<br />
carbon emissions further through an improvement<br />
in the energy efficiency performance of existing<br />
buildings. The Government is currently<br />
undertaking a wide-ranging review to<br />
identify measures to improve the<br />
sustainability of the existing building stock,<br />
including energy efficiency and will put<br />
recommendations to ministers by the summer<br />
of <strong>2006</strong>.<br />
20. The Government is aware of the need for greater<br />
compliance with the Building Regulations.<br />
Therefore, as part of the <strong>2006</strong> revisions to the<br />
Building Regulations, the Government has<br />
engaged in an unprecedented dissemination<br />
programme aimed at ensuring that all<br />
stakeholders can acquaint themselves with the<br />
changes and what they mean in practice. This<br />
programme includes “train-the-trainer”<br />
workshops for over 200 industry trainers,<br />
seminars and regional road-shows for Building<br />
Control Bodies. An e-learning pack that walks<br />
through the new Part L as applied in an example<br />
building situation will be issued to every Building<br />
Control Surveyor. We have also introduced a<br />
requirement for random sample air leakage<br />
testing of buildings. This will help secure better<br />
compliance by showing where there is<br />
unacceptable air leakage, which can reduce the<br />
energy efficiency of the building.<br />
8 The same Building Regulations do not apply <strong>UK</strong>-wide: those in England and Wales are shared, while Northern Ireland and Scotland have separate<br />
Regulations.<br />
9 Note that the carbon savings quoted here are larger than those recently published by the Office of the Deputy Prime Minister (ODPM), for a number of<br />
reasons: the figure here applies to the <strong>UK</strong> (ODPM to England and Wales only), include savings for an additional year, allow for increased demand for comfort<br />
and hot water by 2010, and assume a slightly larger number of boiler replacements each year.
Domestic<br />
81<br />
Transformation of the market for domestic boilers 1999-2005: boiler deliveries by efficiency (coloured bands) with increasing average efficiency<br />
(black line) (Source: Society of British Gas Industries)<br />
100%<br />
90%<br />
80%<br />
70%<br />
60%<br />
50%<br />
86.2<br />
87.8<br />
40%<br />
30%<br />
20%<br />
77.2 76.4<br />
77.8<br />
80.9 80.4<br />
Weighted Average<br />
81.2<br />
10%<br />
0%<br />
1999 2000 2001 2002 2003 2004 2005 Jan-06<br />
A B C D E F G Unknown<br />
Code for Sustainable Homes<br />
21. The Code for Sustainable Homes will set out<br />
voluntary standards beyond those required by<br />
Building Regulations and further contribute to<br />
decreasing the environmental impact of housing<br />
growth. The lowest level will be above Building<br />
Regulations. It will cover a range of<br />
environmental impacts including energy, water<br />
and waste, with minimum standards of energy<br />
and water efficiency at every level of the Code.<br />
This will ensure that builders cannot trade energy<br />
and water efficiency for other kinds of<br />
improvements. To encourage on site energy<br />
generation, new homes that use micro-renewable<br />
technology such as wind turbines will gain extra<br />
Code points.<br />
22. Importantly, the Code will form the basis for the<br />
next set of improvements to building regulations<br />
to ensure that industry can have certainty in the<br />
longer term regarding the minimum levels they<br />
will be expected to build to. The Code will apply<br />
to all new buildings, with the initial focus on<br />
new housing.<br />
23. Once the Code is launched, all new homes<br />
funded by the Government or its agencies,<br />
including through relevant public-private<br />
partnerships, will have to meet Code level 3.<br />
As an interim measure, these homes will have<br />
to meet the new EcoHomes Very Good <strong>2006</strong><br />
standard from 1 April, which is broadly equivalent<br />
to Code level 3. The Government is now looking<br />
at how to encourage new homes to be built to<br />
the highest levels of the Code.<br />
Setting an example<br />
The Government, working with partners,<br />
including English Partnerships, is showing<br />
leadership in creating exemplar sustainable<br />
new settlements in the growth areas, of which<br />
Northstowe, Cambridgeshire will be one of<br />
the first.
82<br />
Domestic<br />
Energy Performance of Buildings<br />
Directive<br />
24. The Government will also be implementing<br />
elements of the EU Energy Performance of<br />
Buildings Directive (EUPD) from April <strong>2006</strong> 10 .<br />
The Directive lays down requirements on the<br />
application of minimum standards for the energy<br />
performance of new buildings and on the<br />
performance of large existing buildings<br />
undergoing major renovation. It also requires the<br />
provision of energy performance certificates<br />
when buildings are constructed, sold or rented<br />
out, and the display of these certificates in public<br />
buildings over 1000m 2 .<br />
25. One of the key provisions of the Directive is the<br />
regular inspection of boilers, or an equivalent<br />
national advice system, and the inspection of air<br />
conditioning systems in buildings 11 . We estimate<br />
that the effect of this, including the early<br />
replacement of boilers brought about by advice<br />
could deliver additional savings of up to 0.2 MtC<br />
in 2010.<br />
26. Other key provisions of the Directive are:<br />
• minimum energy performance requirements<br />
for all new buildings;<br />
• minimum energy performance requirements<br />
for large existing buildings subject to major<br />
renovation; and<br />
• requirement to consider renewable energy<br />
and CHP in new buildings over 1000sqm.<br />
27. The energy used in buildings represents around<br />
45 per cent of carbon dioxide emissions in the<br />
<strong>UK</strong>. There is significant potential for cost-effective<br />
energy savings in the stock of existing buildings –<br />
only some 2 per cent of the building stock at any<br />
given time is under construction or undergoing<br />
refurbishment that is subject to current Building<br />
Regulations.<br />
28. Given this potential, we have commenced a<br />
review of the existing building stock as<br />
mentioned earlier in the chapter. It will not only<br />
examine what more can be done to improve<br />
energy efficiency but go further and consider<br />
how existing buildings can make more efficient<br />
use of other resources – especially water. The<br />
review will be wide ranging and cover the whole<br />
spectrum of tools available to us from regulatory<br />
and non-regulatory measures to demonstration<br />
through leadership and market pull. It will<br />
identify cost effective measures that can be<br />
readily employed to improve the sustainability<br />
of the existing building stock.<br />
29. The Government is exploring what more can be<br />
done to implement the EPBD in ways that<br />
encourage greater carbon savings.<br />
30. In the Energy Efficiency Action Plan we<br />
committed to procuring buildings in the upper<br />
quartile of energy performance. The technical<br />
basis for this commitment will be developed as<br />
part of ODPM’s work to develop the nondomestic<br />
energy rating methodologies necessary<br />
under the Energy Performance of Buildings<br />
Directive.<br />
31. Better communication and advice is highlighted<br />
as one way of tackling the failure to recognise<br />
the economic case for energy-saving measures.<br />
One means through which the Government will<br />
be delivering this is the requirement of the Energy<br />
Performance of Buildings Directive for an energy<br />
performance certificate to be made available to<br />
the prospective owner or tenant when buildings<br />
are constructed, sold or rented out. Home<br />
Information Packs, being introduced in June 2007<br />
under the Housing Act 2004, will deliver this for<br />
residential properties on marketed sale. The Packs<br />
will include a ‘Home Condition Report’, part of<br />
which will be an energy survey for prospective<br />
buyers that will specify the energy efficiency of<br />
the property. The survey will also provide<br />
information on energy efficiency measures<br />
together with a potential SAP rating 12 that the<br />
property could achieve if those measures were<br />
carried out.<br />
32. The Government estimates that the<br />
Sustainable Buildings Code, the Energy<br />
Performance in Buildings Directive, the<br />
commitment on procuring public buildings,<br />
10 www.europa.eu.int/eur-lex/pri/en/oj/dat/2003/l_001/l_00120030104en00650071.pdf<br />
11 In accordance with article 8(b) of the Energy Performance Buildings Directive.<br />
12 The Standard Assessment Procedure is the Government's recommended system for energy rating of dwellings.
Domestic<br />
83<br />
and further measures coming out of the<br />
review of the existing building stock,<br />
together could deliver additional carbon<br />
savings of 0.1 MtC in 2010. ODPM and <strong>Defra</strong><br />
will work together to establish how this<br />
level of carbon savings could be delivered.<br />
In addition to this, the provision of advice to<br />
stimulate the early replacement of inefficient<br />
boilers and the effective use of heating and<br />
hot water controls could deliver additional<br />
carbon savings of up to 0.2 MtC in 2010.<br />
Encouraging consumer choice<br />
and raising standards<br />
33. Most household energy is used by gas heating<br />
equipment. Nevertheless almost a quarter of all<br />
the electricity used in the <strong>UK</strong> is used by domestic<br />
appliances and lighting systems. As products<br />
such as washing machines and TVs achieve near<br />
universal take-up, new services, such as digital TV<br />
and broadband communications, pose new<br />
challenges. Not only are these appliances energyhungry,<br />
but also, as users, most of us are also<br />
energy-lazy. For example, we leave appliances to<br />
consume around £650m worth of electricity<br />
annually (£25 per household) while on standby<br />
and power supplies and chargers permanently<br />
plugged in.<br />
34. Our targets for saving energy in households<br />
depend on a policy package which, over time,<br />
removes the inefficient products from use, and<br />
builds markets for the most resource efficient<br />
goods and services. Consumer education is<br />
important, encouraging better behaviours and<br />
raising expectations that goods and services<br />
should be designed to be energy efficient and<br />
not waste energy. But there is also the need for<br />
Government to work with industry to set and to<br />
drive up product performance standards that can<br />
meet those expectations.<br />
35. The Government’s Market Transformation<br />
<strong>Programme</strong> (MTP) 13 works with industry and<br />
other stakeholders to drive and underpin<br />
sustainable improvements in the energy efficiency<br />
and other environmental characteristics of<br />
products. It does this via policy measures which<br />
assess and rank the performance of energy-using<br />
products, establish performance information,<br />
including labels, to encourage innovation and<br />
competition, and identify appropriate levels for<br />
rising minimum, average, or best practice<br />
standards which show how product performance<br />
would need to develop over time if the<br />
sustainability commitments are to be met.<br />
36. The Government committed last July in<br />
Gleneagles to promote an international 1-Watt<br />
Initiative to reduce these emissions, and is<br />
concerned that progress in reducing them is too<br />
slow. The Government believes that voluntary<br />
agreements can be an effective way to raise<br />
standards and reduce carbon emissions. Budget<br />
<strong>2006</strong> announced a new initiative, in<br />
partnership with major retailers and the<br />
Energy Saving Trust, to introduce voluntary<br />
schemes in the retail sector that encourage<br />
the purchase of more energy efficient<br />
alternatives in consumer electronics.<br />
37. The Eco-design of Energy Using Products (EUP)<br />
framework Directive now provides a formal<br />
mechanism for establishing product standards.<br />
EUP permits Member States and the EU to signal<br />
to industry their product innovation priorities, to<br />
negotiate and, if necessary, to set mandatory<br />
energy and other eco-design requirements for<br />
energy-using products which are placed on the<br />
EU market. The Commission estimates that this<br />
measure alone could reduce EU energy<br />
consumption by around 10 per cent 14 . Clearly,<br />
if successful, this could avoid the costs that can<br />
arise from overlapping national programmes<br />
which aim to achieve the same result. EUP will<br />
integrate with a wide range of existing EU<br />
measures dealing with the energy performance of<br />
domestic appliances including mandatory energy<br />
labelling of domestic appliances, minimum<br />
standards directives which remove the worst<br />
performing appliances from the market place and<br />
a number of existing industry self commitments.<br />
Although the focus of the directive is on setting<br />
mandatory standards, a clear intention is to<br />
encourage voluntary action by manufacturers to<br />
improve their products, which would make<br />
13 www.defra.gov.uk/environment/consumerprod/mtp/ and www.mtprog.com/<br />
14 By way of comparison, a recent IEA study on energy savings in California attributes 30 per cent of all energy saved to product standards of the type<br />
envisaged in EUP.
84<br />
Domestic<br />
regulatory action unnecessary. The Government<br />
would prefer voluntary agreements where<br />
they are effective and has already committed<br />
to proactively follow this policy approach<br />
and, supported by the Market<br />
Transformation <strong>Programme</strong>, is actively<br />
determining <strong>UK</strong> priorities to negotiate with<br />
the Commission and other Member States.<br />
The Commission has identified 14 priority<br />
product sectors including consumer<br />
electronics, lighting, heating, white goods<br />
and electric motors.<br />
• industry voluntary agreements – such as<br />
the new initiative mentioned above and the<br />
Code of Conduct on Digital TV Services. As a<br />
result of this code over half the set-top boxes<br />
in <strong>UK</strong> homes now consume significantly less<br />
than they would have done and the <strong>UK</strong> has<br />
been able to avoid carbon emissions of an<br />
estimated 0.4 MtC per annum at virtually<br />
no cost;<br />
• embedding product standards into<br />
Building Regulations – such as raising the<br />
standards of new and replacement boilers<br />
through the Building Regulations;<br />
• product endorsement via schemes such as<br />
the Energy Saving Trust’s ‘Energy Saving<br />
Recommended’ logo;<br />
• procurement policy – the Government and<br />
the wider public sector can use their market<br />
leverage to promote energy efficient products<br />
and buildings. The <strong>UK</strong> Procurement Task Force<br />
is due to publish an action plan in April <strong>2006</strong>;<br />
and<br />
• the International Task Force on<br />
Sustainable Products – a <strong>UK</strong> initiative,<br />
responding to G8 and wider international<br />
commitments to promote more co-operation<br />
on labelling and standards policy, encouraging<br />
international benchmarking, looking ahead at<br />
least 10-20 years.<br />
38. The first implementation measures under EUP will<br />
be introduced at the earliest in 2008 and therefore<br />
the Government is actively pursuing other<br />
measures, both in the <strong>UK</strong> and internationally,<br />
to raise product standards. These include:
Domestic<br />
85<br />
39. Statutory labels 15 providing relative performance<br />
information for traded goods need to be<br />
established at the EU level but are often<br />
supported by additional national schemes<br />
promoting the best appliances, for example the<br />
Energy Saving Trust’s Energy Saving<br />
Recommended logo 16 . In conjunction with the<br />
Energy Efficiency Commitment, regulations and<br />
other policy instruments, labelling has<br />
transformed the market for key domestic<br />
appliances as shown below.<br />
policy drivers for domestic energy efficiency –<br />
EEC, Warm Front, Decent Homes and Building<br />
Regulations. Its principal activities are aimed at<br />
increasing demand for energy efficiency by raising<br />
awareness, providing advice and support for<br />
action. It also supports the supply of energy<br />
efficiency products and services to meet this<br />
demand by developing partnerships, stimulating<br />
innovation, supporting training and providing<br />
accreditation.<br />
Market Share of A Rated Cold Appliances (Source: GfK Retail Audit)<br />
Share (%)<br />
Market Share of A Rated Wet Appliances (Source: GfK Retail Audit)<br />
Share (%)<br />
90<br />
80<br />
70<br />
60<br />
50<br />
40<br />
30<br />
20<br />
10<br />
100<br />
0<br />
1996-97<br />
90<br />
80<br />
70<br />
60<br />
50<br />
40<br />
30<br />
20<br />
10<br />
0<br />
1996-97<br />
Dishwashers<br />
1998-99<br />
1998-99<br />
2000-01<br />
2000-01<br />
Washer<br />
Dryers<br />
Consumer engagement<br />
2002-03<br />
2002-03<br />
Includes A+<br />
2004-05<br />
Freezers Fridge Freezers Refrigerators<br />
2004-05<br />
Washing<br />
Machines<br />
40. The Energy Saving Trust’s (EST) activities are<br />
designed to underpin and complement the work<br />
of other actors in energy efficiency markets. In<br />
particular it seeks to work with key Government<br />
41. The EST’s energy efficiency activity is grant<br />
funded by <strong>Defra</strong>. The Trust also receives funding<br />
from Scottish Executive, from the Department of<br />
Transport to run transport programmes and from<br />
the Department of Trade and Industry to run<br />
renewable energy programmes.<br />
42. The EST is piloting the development of a<br />
Sustainable Energy Network (SEN), a network of<br />
regional delivery agencies that aims to support<br />
national awareness raising of sustainable energy<br />
and translate householder awareness into<br />
practical action. EST has set up three Sustainable<br />
Energy Centres which build on the approach of<br />
existing Energy Efficiency Advice Centres by<br />
providing increased resources, more support for<br />
action and covering small-scale renewable energy<br />
and transport as well as energy efficiency. <strong>Defra</strong><br />
has provided additional funding of £10m over<br />
three years for the SEN Pilot.<br />
43. An increasing share of energy efficiency activity<br />
under EEC is likely to come from the installation<br />
of insulation in privately owned homes, compared<br />
to the earlier years when activity in social housing<br />
predominated. The Energy Efficiency Innovation<br />
Review identified barriers to the uptake of energy<br />
efficiency measures that will need to be<br />
overcome:<br />
• the widespread misapprehension about<br />
installing insulation with regard to its costs,<br />
benefits, and the disruption it causes; and<br />
15 The mandatory EU Energy label currently covers domestic refrigeration appliances, washing machines, electric tumble dryers, washer dryers, dishwashers,<br />
lamps, electric ovens and air conditioners (see www.defra.gov.uk/environment/consumerprod/energylabels/index.htm)<br />
16 www.est.org.uk/myhome/efficientproducts/recommended/
86<br />
Domestic<br />
• consumers’ lack of confidence in offers made<br />
by energy suppliers and the installation<br />
industry, and lack of awareness of the<br />
independent 25-year guarantees for cavity<br />
wall insulation fitted by registered installers.<br />
44. The EEIR also recognised that acting alone, the<br />
EEC suppliers are unlikely to be able to tackle<br />
these barriers. As part of the Government’s<br />
ongoing work to help overcome these barriers,<br />
we will continue to highlight the benefits of<br />
energy efficiency measures and the links between<br />
what EEC offers and our wider climate change<br />
targets. As set out above, the Government will<br />
launch a £20m programme, working closely with<br />
local authorities and energy suppliers, to help<br />
raise levels of consumer demand for energy<br />
efficiency measures.<br />
Energy Services<br />
45. In January <strong>2006</strong>, HM Treasury hosted a high-level<br />
summit to explore the potential for energy<br />
services – energy services is a shift away from<br />
providing units of energy towards a focus on the<br />
services delivered from the use of energy. Energy<br />
services appear to have the potential to overcome<br />
a number of the barriers to delivery of efficiency<br />
in the domestic sector. Participants agreed that<br />
growing public awareness of climate change and<br />
high energy prices provide new opportunities for<br />
alternative ways to deliver energy. Following the<br />
summit, an independent industry group has<br />
undertaken to explore options for energy services,<br />
and to contribute to the Energy Review process.<br />
Billing and metering<br />
46. Providing customers with better information<br />
about their energy use and its costs may<br />
encourage energy-saving behaviour among<br />
households, such as switching off unnecessary<br />
lights and appliances, or purchasing more<br />
efficient products. ‘Smart’ electricity and gas<br />
meters and associated feedback devices can<br />
provide real-time information on energy costs to<br />
users in a more visible way than a regular bill.<br />
47. The Government is committed to seeking<br />
measures to achieve savings of 0.2 MtC by<br />
2010 through better billing and metering in<br />
the <strong>UK</strong> and believes one way this could be<br />
achieved is if all new and replacement meters are<br />
‘smart’ meters, also providing consumption<br />
feedback. More informative billing and feedback<br />
devices attached to existing meters can also play<br />
a role. However, there is considerable uncertainty<br />
about the scale and duration of these carbon<br />
savings. The Government announced at<br />
Budget <strong>2006</strong> a £5m fund to co-finance with<br />
energy suppliers a pilot study of feedback<br />
devices such as ‘smart’ energy meters that<br />
could potentially reduce energy demand and<br />
facilitate other market efficiencies.<br />
48. Smart meters have not only the potential to<br />
reduce consumption but they could also be a<br />
useful tool for reducing peak loads e.g. via<br />
time-of-day tariffs. Smart meters can therefore<br />
contribute to improving energy security, as some<br />
network re-enforcement and new generation<br />
capacity could be avoided. Smart metering could<br />
also be beneficial for addressing fuel poverty, by<br />
helping consumers to better manage their energy<br />
use and avoid waste. In addition, meters with an<br />
“import-export” facility are required for any<br />
consumers installing micro-generation such as<br />
small scale wind, solar (PV) panels or micro-CHP.<br />
49. Despite their potential benefits very few smart<br />
meters have been installed in the <strong>UK</strong>. Ofgem’s<br />
recent review of metering looked at international<br />
experience of smart metering and, in the light of<br />
this evidence, examined the potential costs and<br />
benefits of innovative metering in the <strong>UK</strong> context.<br />
Ofgem conducted a public consultation, which<br />
closed in March. The results are due in May <strong>2006</strong><br />
and will inform the nature of the pilot study and<br />
future decisions on what measures need to be<br />
taken to secure carbon savings and other benefits<br />
from improved metering and billing.<br />
50. The recently agreed Energy End-Use Efficiency<br />
and Energy Services Directive will require<br />
installation of ‘actual time of use’ metering for all<br />
new connections and for replacement meters
Domestic<br />
87<br />
where “technically possible, financially reasonable<br />
and proportionate to the potential savings”.<br />
Economic instruments<br />
51. In line with its 1997 Statement of Intent on<br />
Environmental Taxation, the Government has<br />
used the tax system to support progress towards<br />
environmental goals. Fiscal measures – as part of<br />
a range of measures – can help to address<br />
market failures. In 1998, the Government<br />
introduced a reduced VAT rate of 5 per cent VAT<br />
for the grant-funded installation of certain<br />
energy-saving materials (ESMs) in the homes of<br />
elderly, less well off and vulnerable households.<br />
This reduced VAT rate applied to all insulation,<br />
draught stripping, hot water and central heating<br />
controls. In Budget 2000, the Government<br />
extended this scheme to all households, even if<br />
the service is not grant funded. Budget 2000 and<br />
2002 also introduced further reduced VAT rates<br />
for ESMs when they are part of grant-funded<br />
installations into vulnerable households –<br />
including central heating systems, heating<br />
appliances, and factory-insulated hot water tanks.<br />
52. The Government has also introduced reduced<br />
VAT rates for microgeneration in order to support<br />
the development of micro technologies that use<br />
renewable energy sources and can help to<br />
improve energy efficiency. Since Budget 2000,<br />
reduced VAT rates have been introduced for solar<br />
panels; micro wind and water turbines; ground<br />
source and air source heat pumps; microcombined<br />
heat and power (micro-CHP); and<br />
wood fuelled boilers.<br />
53. The Government consulted in 2002 and 2003 on<br />
the possible use of economic instruments for<br />
domestic energy efficiency. Responses indicated<br />
that there was little incentive for private landlords<br />
to improve the energy efficiency of the residential<br />
properties that they let, as the benefit of<br />
investment often flows to the tenant rather than<br />
to the landlord. In response to this, the<br />
Government introduced the Landlord’s Energy<br />
Saving Allowance (LESA) in 2004. This offers upfront<br />
relief (up to £1500) for capital expenditure<br />
on investment in cavity wall and loft insulation.<br />
This was extended in 2005 to include solid wall<br />
insulation, and again in <strong>2006</strong> to include draught<br />
proofing and hot water system insulation. The<br />
Government will also seek to improve awareness<br />
of LESA among landlords, and examine the<br />
possible extension of LESA to corporate landlords.<br />
54. In the 2005 Pre-Budget Report, the Government<br />
also announced that it intended to implement a<br />
Green Landlord Scheme by reforming the existing<br />
Wear and Tear Allowance and making it<br />
conditional on the energy efficiency level of the<br />
property. The Government continues to explore<br />
how the Allowance should be reformed to make<br />
it incentivise landlords to invest in the energy<br />
efficiency of their properties, with a view to<br />
introducing the new allowance structure alongside<br />
the forthcoming Energy Performance Certificates.<br />
Tackling fuel poverty<br />
55. Fuel poverty 17 is caused by a combination of<br />
poorly insulated, energy inefficient housing and<br />
low incomes. The latest available figures 18 ,<br />
indicate that the number of fuel poor households<br />
had fallen between 1996 and 2003. The<br />
published figures show that there were<br />
approximately two million households in fuel<br />
poverty in the <strong>UK</strong> in 2003, down from six and a<br />
half million in 1996. Of this figure, around one<br />
and a half million vulnerable households were in<br />
fuel poverty in the <strong>UK</strong> in 2003, down from five<br />
million in 1996. However, it is expected that<br />
recent increases in energy prices will have begun<br />
to reverse the process that has been made to<br />
date. Analysis of the overall effects of changes in<br />
fuel prices and incomes, excluding consideration<br />
of energy efficiency improvements, suggested<br />
that the total number of vulnerable households in<br />
fuel poverty is likely to rise by around one million<br />
households in England between 2003 and <strong>2006</strong>,<br />
with proportional rises in the Devolved<br />
Administrations.<br />
56. In Fuel Poverty In England: The Government’s<br />
Plan for Action, published in November 2004, the<br />
Government set out how the 2010 target in<br />
17 A household is in fuel poverty if in order to maintain a satisfactory heating regime it would be required to spend more than 10 per cent of its income<br />
(including Housing Benefit or Income Support for Mortgage Interest) on all household fuel use<br />
18 Taken from The <strong>UK</strong> Fuel Poverty Strategy: Third Annual Progress Report, published in July 2005.
88<br />
Domestic<br />
England 19 will be met and announced extra<br />
funding of £140m between 2005-08 to tackle<br />
fuel poverty. This has since been boosted by the<br />
announcement in the 2005 Pre-Budget Report of<br />
an additional £300m over the same period to<br />
tackle fuel poverty across the <strong>UK</strong>. £250m of this<br />
funding will help tackle fuel poverty in England,<br />
taking total fuel poverty funding over the 2005-08<br />
period to over £800m. Carbon dioxide savings<br />
from Warm Front and other fuel poverty<br />
programmes are expected to be 0.4 MtC by 2010.<br />
57. The document also set out a number of changes<br />
to the Warm Front Scheme, the Government’s<br />
key tool for tackling fuel poverty in the private<br />
sector in England, which seeks to target<br />
vulnerable households to provide a range of<br />
heating and insulation measures that can be<br />
tailored to suit each individual property. These<br />
changes have now been implemented. Warm<br />
Front now offers central heating to all eligible<br />
households and gives them the option to receive<br />
the full range of appropriate measures over a<br />
period of time, subject to the maximum amount<br />
of grant that can be paid. Since the launch of the<br />
Scheme in June 2000, over one million<br />
households have been assisted.<br />
58. A range of challenges lie ahead in tackling fuel<br />
poverty. The Energy Review will consider whether<br />
there are any further steps that the Government,<br />
working with a wide cross-section of key<br />
stakeholders, can take to ensure we meet our <strong>UK</strong><br />
goal of eradicating fuel poverty by 2016-18.<br />
Decent Homes Standard<br />
59. Since 2001 there has been a 31 per cent<br />
reduction in the number of social sector homes<br />
failing the Decent Home standard on the thermal<br />
comfort criterion (from 1.3 to 0.9 million homes),<br />
which is a key criterion of the standard. Also<br />
since 2001, over 470,000 dwellings have received<br />
work to improve their energy efficiency under the<br />
decent homes programme or as part of wider<br />
local authority work to update the stock. This<br />
work is continuing. Local authorities typically<br />
work very closely with EEC suppliers when<br />
tackling their housing stock, so most of the<br />
carbon savings from the Decent Homes<br />
programme are attributed to EEC, and to a lesser<br />
extent to Building Regulations. But some<br />
additional activity does take place that is not<br />
accounted for elsewhere, and savings from this<br />
are conservatively estimated at 0.02 MtC per year.<br />
60. The average SAP rating 20 of the social sector<br />
stock rose to 58 by 2004 from 48 in 1996 and is<br />
likely to rise further over the coming years. The<br />
Decent Homes standard is a ‘trigger point’ for<br />
action to improve energy efficiency. As social<br />
landlords undertake works beyond the standard,<br />
energy efficiency improvements are continuing, in<br />
turn reducing carbon emissions.<br />
Community Energy<br />
61. In January 2002, the Government launched<br />
Community Energy, a £50m <strong>UK</strong>-wide capital<br />
programme for installing and refurbishing<br />
community heating. Schemes are mainly based<br />
on CHP with innovative approaches also<br />
encouraged. The funding was provided by<br />
Treasury’s Capital Modernisation Fund.<br />
62. In December 2004, <strong>Defra</strong> announced an extra<br />
£10m to extend the programme. The decision to<br />
do this was based on initial strong demand and a<br />
number of larger schemes with significant<br />
outputs. However, experience has shown that<br />
many larger schemes under the initial programme<br />
could not complete within the 31 March 2007<br />
spend deadline and did not go ahead. The<br />
smaller schemes that can complete tend to be<br />
expensive in relation to their outputs. The<br />
following table summarises how the programme<br />
has delivered against its targets and shows that<br />
the programme has fallen well short of delivering<br />
its objectives on all fronts.<br />
63. The high drop out rate for larger schemes is the<br />
main reason for the limited estimate of spend.<br />
The situation would not improve appreciably if<br />
we extended the spend deadline, as these larger<br />
schemes cannot complete within a timescale<br />
19 “To eradicate fuel poverty in vulnerable households in line with the Government’s fuel poverty strategic objective”.<br />
20 SAP (2001) rating is on a scale from 1 to 120. This will be replaced on the 6 April <strong>2006</strong> with the SAP (2005) rating scale which comes into effect with the<br />
Building Regulations.
Domestic<br />
89<br />
suitable for government funding, in some cases<br />
after 2010.<br />
64. The review of the 2000 <strong>Climate</strong> <strong>Change</strong><br />
<strong>Programme</strong> has given us the opportunity to<br />
conduct a wide ranging appraisal of the<br />
effectiveness of existing climate change policies.<br />
In the light of the considerations above we have<br />
decided to neither extend the time span for the<br />
£50m programme nor continue with the £10m<br />
extension. In considering the relative costeffectiveness<br />
of programmes, we have decided<br />
that there are other programmes that more costeffectively<br />
deliver carbon savings. These include<br />
taking forward support for biomass community<br />
heating through the new heat support scheme,<br />
which will include CHP.<br />
Comparison of outputs against targets for the Community Energy programme<br />
<strong>Programme</strong> targets<br />
Estimated programme outputs<br />
Funding £50m £22.3m (45%)<br />
Carbon Savings (tC/yr) 150,000 19,481 (13%)<br />
Leverage of other funding £200m £50m (25%)<br />
CHP capacity ( MWe) 130 28.9 (22%)<br />
People on low incomes helped 100,000 18,453 (18%)
90<br />
CHAPTER SEVEN<br />
Agriculture, forestry and land management<br />
The agriculture and forestry sector contributes 7 per cent of <strong>UK</strong> greenhouse gas emissions. The major focus<br />
is on non-CO 2<br />
gases, with, in 2004, this sector accounting for 46 per cent of methane and 66 per cent of<br />
nitrous oxide emissions, but only 1 per cent of carbon dioxide. Annual total emissions fell by 22 per cent<br />
between 1990 and 2004, with methane emissions reducing by 13 per cent, and nitrous oxide emissions by<br />
17 per cent.<br />
The major issue for this sector is in tackling direct emissions of nitrous oxide and methane emissions, rather<br />
than carbon dioxide emissions. The agriculture and forestry sector has a contribution to make to creating a<br />
low carbon economy through the production of bioenergy. Agriculture and forestry is the first sector to<br />
feel the direct effects of a changing climate. The challenge is to adapt to new threats and opportunities,<br />
whilst still maintaining a sustainable agriculture and forestry sector. As with many other sectors climate<br />
change has not, until recently, been a priority. This programme seeks to raise awareness of the issues across<br />
the sector and develop measures for the sector to allow it to play a full part in tackling climate change.<br />
Since 2000 we have introduced the Energy Crops Scheme, the Bioenergy Infrastructure Scheme and an<br />
overarching Non-Food Crops Strategy, saving 0.1MtC by 2010.<br />
In addition the Government is committed to:<br />
• Promoting resource efficient farm management, including making the best use of the latest research<br />
findings and technology, in order to reduce nitrogen and other inputs which contribute to greenhouse<br />
gas emissions.<br />
• Examining the scope and feasibility of a market based mechanism to facilitate trading of greenhouse<br />
gas reductions from agriculture, forestry and other land management sectors.<br />
• Developing a communications strategy to raise awareness and communicate climate change issues to<br />
land managers.<br />
• Exploring how Environmental Stewardship can make a greater contribution to achieving the<br />
Government’s climate change objectives.<br />
• Considering the case under the new EU Rural Development Regulation for providing support for land<br />
managers to establish energy crops and develop biomass and woodfuel supply chains.<br />
• Launching a further round of the Bioenergy Infrastructure Scheme in <strong>2006</strong>-07 to help further the<br />
development of biomass supply chains.<br />
• Taking forward the Non-Food Crops Strategy to substitute renewable products for those based on<br />
fossil fuels.<br />
• Ensuring that the development of measures under the Catchment Sensitive Farming <strong>Programme</strong> and<br />
Nitrate Action Plan also support our climate change goals.<br />
• Engaging the Rural <strong>Climate</strong> <strong>Change</strong> Forum fully in delivering this programme.<br />
Introduction<br />
1. Agriculture, forestry and land management 1 have<br />
a key role to play in addressing climate change,<br />
by providing alternative energy sources and low<br />
energy materials, by helping to mitigate adverse<br />
climate change events, and by direct mitigation<br />
of greenhouse gas emissions from agriculture,<br />
forestry and land management activities.<br />
2. Action to address climate change issues in the<br />
land management sector forms a key part of the<br />
Strategy for Sustainable Farming and Food. The<br />
1 Agriculture and forestry are devolved issues and therefore while the discussion of land management’s role applies to the <strong>UK</strong>, the specific policy measures<br />
discussed apply only to England except where otherwise noted.
Agriculture, forestry and land management<br />
91<br />
Government’s priority is to facilitate a farming<br />
and food industry in this country which makes a<br />
major contribution to sustainable development.<br />
This means a partnership to:<br />
• help <strong>UK</strong> farming and food industries compete<br />
successfully both at home and abroad;<br />
• produce quality food and non-food products<br />
that the market will buy;<br />
• ensure an appropriate reward structure for the<br />
positive contribution our farmed landscape<br />
makes to the countryside and the natural<br />
environment; and<br />
economy, and to incentivise innovation of all<br />
kinds. This chapter of the <strong>Climate</strong> <strong>Change</strong><br />
<strong>Programme</strong> is intended to establish the context<br />
and set out the broad policy framework in which<br />
such change can take place.<br />
6. A second element of the <strong>Programme</strong> is to ensure<br />
that future policies affecting land managers are<br />
‘climate change proofed’ so that they deliver,<br />
directly or as an ancillary benefit, positive climate<br />
change outcomes.<br />
Greenhouse gas emissions inventory<br />
and projections<br />
• play an increasing part in tackling the biggest<br />
threat, climate change.<br />
3. To date, most <strong>UK</strong> and EU agricultural, forestry<br />
and land management policies have not included<br />
greenhouse gas mitigation or climate change<br />
adaptation as specific goals. This means that<br />
identifying their precise contribution to<br />
addressing climate change can be difficult. In<br />
future, more explicit recognition of their<br />
contribution will be needed. This will also need<br />
to be consistent with the Government’s intention<br />
to prepare and consult on a new PPS setting out<br />
how its expects participants in the planning<br />
process to work towards the reduction of carbon<br />
in the location, siting and design of new<br />
development.<br />
4. Equally, the agricultural and forestry industries<br />
need to do more to ensure that climate change is<br />
regarded as a high priority. Agriculture and<br />
forestry are among the first activities to be<br />
directly affected by changes in climate, and are<br />
already beginning to adapt to climate change<br />
through, for example, new crops, changed<br />
planting and harvesting regimes, and dealing<br />
with new pest threats.<br />
5. The Government believes that it is vital that land<br />
managers change their behaviour in order to help<br />
to deliver emission reductions, to allow them to<br />
take advantage of the opportunities to their<br />
businesses of adopting a resource efficiency<br />
approach, contribute to the shift to a low carbon<br />
7. Land management activities both absorb and<br />
release greenhouse gases. Although agriculture<br />
and forestry contributes to carbon dioxide<br />
emissions (primarily through the use of fossil fuels<br />
and electricity, as in other sectors), the major<br />
focus is on non-CO 2<br />
gases, with agriculture<br />
accounting for 46 per cent of methane and<br />
nearly 66 per cent of nitrous oxide emissions in<br />
the <strong>UK</strong> in 2004 2 . Emissions of these gases arise<br />
mainly from the digestive processes of animals,<br />
animal wastes, and fertiliser use.<br />
8. Land management can help to remove carbon<br />
from the atmosphere through increases in forest<br />
coverage and organic matter in the soil, and<br />
avoidance of degradation of those stores and so<br />
avoid carbon loss. Woody and other non-food<br />
crops also have an important potential to provide<br />
renewable sources of energy and alternatives to<br />
fossil fuel based materials and products.<br />
9. The Government funds a continuing programme<br />
of research looking at the contribution of<br />
different land management practices to<br />
greenhouse gas emissions. However, comparisons<br />
between different farming methods and land use<br />
change are complex and the research findings are<br />
dependent on the scale considered. Limited<br />
evidence comparing different farming systems is<br />
available, and reduced emissions in one<br />
greenhouse gas may be offset by increased<br />
emissions of another, so whole life cycle analyses<br />
are needed. The Government will continue to<br />
support research, at a cost of £1m over three<br />
2 http://www.defra.gov.uk/environment/statistics/globatmos/gagccukem.htm
92<br />
Agriculture, forestry and land management<br />
years, to improve the inventory of emissions from<br />
agriculture and will continue to invest in research<br />
to improve the overall environmental<br />
performance of different farming systems,<br />
including organic, to improve our understanding<br />
of, and their ability to optimise their contribution<br />
to climate change objectives.<br />
10. In 1990, greenhouse gas emissions from<br />
agriculture, forestry and land management were<br />
18 MtC or about 9 per cent of the <strong>UK</strong>’s total<br />
greenhouse gas emissions. This includes net<br />
emissions and removals from the land use, land<br />
use change and forestry (LULUCF) sector<br />
estimated to be 0.8 MtC in 1990 (see Annex F for<br />
the breakdown by gas). Annual emissions from<br />
agriculture, forestry and land management are<br />
estimated to have fallen by 22 per cent between<br />
1990 and 2004, and are projected to continue to<br />
fall to 32 per cent below 1990 levels by 2010 3 .<br />
Projections of greenhouse gas emissions from the agriculture, forestry<br />
and land management sector and the estimated effect of additional<br />
quantified measures, MtC<br />
MtC<br />
19<br />
18<br />
17<br />
16<br />
15<br />
14<br />
13<br />
12<br />
1990 1995 2000 2005 2010 2015 2020<br />
Historical trend<br />
Baseline with measures projections<br />
Additional quantified measures<br />
11. As is clear from the figures, the <strong>UK</strong> land<br />
management sector’s potential contribution to<br />
addressing climate change arises at least as much<br />
from tackling methane and nitrous oxide as CO 2<br />
.<br />
Opportunities to reduce methane and nitrous<br />
oxide must therefore take a more important place<br />
than previously if this sector is to play its full part<br />
in addressing climate change.<br />
12. Raising awareness of the issues and working with<br />
stakeholders to develop practical and sustainable<br />
options is vital to help land managers play their<br />
part in addressing climate change. There are a<br />
wide range of mitigation and adaptation options<br />
that offer benefits for land managers, the<br />
environment, and wider society.<br />
13. The Government sees it as vital to highlight the<br />
challenges of climate change for land managers<br />
and to provide leadership in developing a policy<br />
framework that will encourage practical action.<br />
The Government set up the Rural <strong>Climate</strong> <strong>Change</strong><br />
Forum 4 (see box) as a high level forum for<br />
discussion, input into policy development, and<br />
communication with land managers on climate<br />
change mitigation and adaptation. The Forum<br />
has discussed practical actions for mitigation,<br />
how best to communicate key messages on<br />
climate change to this sector, and has advised<br />
the Government on the development of this<br />
<strong>Programme</strong>. It will also have a role in advising<br />
on the most effective ways to deliver this<br />
<strong>Programme</strong>.<br />
14. To raise awareness in the land management<br />
sector of the risks, responsibilities and<br />
opportunities of climate change, the Government<br />
will put in place a sector specific communications<br />
strategy, as part of the its wider <strong>Climate</strong> <strong>Change</strong><br />
Communications Initiative. The Rural <strong>Climate</strong><br />
Greenhouse gas emissions from agriculture, forestry and land management, MtC<br />
Gas 1990 1995 2000 2004 2010 2015 2020<br />
Carbon dioxide 3.2 2.5 1.9 1.5 0.7 1.3 1.7<br />
Methane 5.9 5.8 5.5 5.2 4.4 4.4 4.4<br />
Nitrous oxide 8.9 8.5 8.0 7.4 7.1 7.1 7.0<br />
Total 18.0 16.8 15.4 14.0 12.3 12.8 13.1<br />
<strong>Change</strong> from 1990 levels -7.0 -14.7 -22.3 -32.0 -29.1 -27.1<br />
Note: the percentage changes and emission estimates may differ slightly due to rounding.<br />
3 Largely due to reducing livestock numbers and more targeted input use.<br />
4 For more information on the work of the Forum see http://www.defra.gov.ukweb/environment/climatechange/uk/agriculture/rccf
Agriculture, forestry and land management<br />
93<br />
Rural <strong>Climate</strong> <strong>Change</strong> Forum<br />
The Rural <strong>Climate</strong> <strong>Change</strong> Forum was launched in March 2005 to provide a high level forum for dialogue<br />
with Government, and authoritative advice and leadership for rural stakeholders, on climate change and<br />
rural land management.<br />
The Forum's objectives are to:<br />
• raise awareness among stakeholders at all levels about the impacts of climate change in rural areas<br />
through existing and/or new knowledge networks, to help develop and promote appropriate responses<br />
to climate change;<br />
• identify, propose and promote practical actions and policy options, including the uptake of research<br />
findings:<br />
– to reduce and offset greenhouse emissions from rural land uses;<br />
– on adaptation measures for rural land uses (including for conservation purposes and new agricultural<br />
uses); and<br />
– on the potential for managing the impacts of climate change, e.g. Flooding, through changed land<br />
management practices.<br />
• identify relevant research needs and priorities; and<br />
• contribute to relevant policy review and development.<br />
The Forum is co-chaired by Elliot Morley MP, Minister of State (<strong>Climate</strong> <strong>Change</strong> and Environment), <strong>Defra</strong>,<br />
and John Gilliland, Member of the Sustainable Development Commission.<br />
<strong>Change</strong> Forum will be invited to advise on the<br />
delivery of this communications strategy.<br />
15. A number of the Carbon Trust’s programmes (see<br />
Chapter 4) are available to businesses in the<br />
agriculture, forestry and land management sector.<br />
The Government will work with the Carbon Trust<br />
to identify new opportunities for action by them<br />
which could support the agriculture, forestry and<br />
land management sector.<br />
16. <strong>Climate</strong> change and agriculture is a matter of<br />
importance not only for the <strong>UK</strong> but also for our<br />
European partners. In September 2005, the <strong>UK</strong><br />
under its Presidency of the EU, hosted the first<br />
ever Joint Informal Meeting of EU Agriculture and<br />
Environment Councils, where international experts<br />
presented a range of issues on climate change<br />
and agriculture. They underlined that sustainable<br />
agriculture and land-use can play a significant<br />
role in addressing climate change and still provide<br />
the economic and social benefits rural areas<br />
need. We have encouraged the Commission and<br />
future Presidencies of the EU to consider how to<br />
take forward work on the issues highlighted at<br />
the Ministerial meeting, and the <strong>UK</strong> will continue<br />
to encourage our European partners to give this<br />
issue the importance it deserves, including in the<br />
revised European <strong>Climate</strong> <strong>Change</strong> <strong>Programme</strong>.<br />
17. Scenarios presented at the Informal and<br />
elsewhere suggest that climate change impacts<br />
do not appear to threaten the viability of <strong>UK</strong><br />
agriculture industry as a whole, due to the<br />
adaptability of <strong>UK</strong> systems 5 . But particular regions<br />
and individual farmers need to be aware of<br />
changes so they are able to deal with the risks<br />
and opportunities in good time. This is discussed<br />
in more detail in the adaptation section of this<br />
<strong>Programme</strong> and will be developed in the<br />
Adaptation Policy Framework. The Government<br />
will continue to fund research on impacts<br />
and adaptation responses for land managers.<br />
5 For example, the review of the <strong>Defra</strong>’s research on climate impacts on agriculture concluded that “the negative impacts of climate change on <strong>UK</strong><br />
agriculture’s productivity will be small and that in all likelihood the effects will be positive, with the exception of low lying areas susceptible to flooding”.
94<br />
Agriculture, forestry and land management<br />
18. Understanding of these issues is supported within<br />
<strong>Defra</strong> by an ongoing research programme of<br />
£4m into both the impacts of climate change on<br />
agriculture, and means through which agriculture<br />
can contribute to reducing emissions. This work<br />
is complemented by knowledge transfer<br />
programmes, including through partners such<br />
as <strong>UK</strong>CIP (See Section 3), to ensure that policy<br />
makers and land managers receive relevant and<br />
timely information. The Government’s approach<br />
to addressing climate change in this <strong>Climate</strong><br />
<strong>Change</strong> <strong>Programme</strong> is informed by these<br />
principles, and we will continue to promote<br />
action to address climate change across the full<br />
range of issues covered by the Strategy for<br />
Sustainable Farming and Food.<br />
Impact of reforms of the<br />
Common Agricultural Policy<br />
19. Over the past thirty years the European Common<br />
Agricultural Policy (CAP) has had a dominant<br />
influence on <strong>UK</strong> agriculture. Since the launch of<br />
the <strong>Climate</strong> <strong>Change</strong> <strong>Programme</strong> in 2000, there<br />
have been two significant reforms of the CAP.<br />
Firstly, Agenda 2000 led to some moderation in<br />
production subsidies and greater emphasis on<br />
rural development measures. Independent<br />
economic evaluation and the Government’s own<br />
economists suggest that the impact of Agenda<br />
2000 on greenhouse gas emissions was limited.<br />
20. The CAP reform agreement reached in June 2003<br />
was more fundamental in nature, particularly in<br />
breaking the link between production and direct<br />
payments through the introduction of the Single<br />
Payment Scheme. Although not designed for the<br />
purpose of climate change mitigation, and<br />
though it is still too early to know exactly how<br />
farmers will respond to the 2003 CAP reforms,<br />
the associated changes in agricultural practice<br />
and market responses are likely to have an impact<br />
on greenhouse gas emissions. Decoupling of<br />
direct payments from production is likely to lead<br />
to a reduction in livestock numbers and an<br />
associated decrease in methane emissions<br />
estimated at some 0.68 MtC per annum in 2010.<br />
Similarly, it is expected that trends towards lower<br />
input agriculture and better soil nutrient<br />
management will be reinforced with a<br />
consequent reduction in nitrous oxide emissions.<br />
21. The 2003 model of reform has subsequently been<br />
applied to the sugar sector. There is expected to<br />
be a reduction in sugar beet growing in Europe,<br />
although in England it is noted that beet growing<br />
currently occupies only 2 per cent of crop and<br />
grassland areas. Direct climate change<br />
implications are uncertain, but the sugar reform<br />
is encouraging processors to look at<br />
diversification into bioethanol. Demand will<br />
depend on competitiveness of beet compared<br />
to other feedstocks and wider renewable<br />
energy policy drivers.<br />
22. The 2003 CAP reforms also introduced<br />
mandatory cross-compliance measures linked to<br />
all CAP direct payments to farmers, including<br />
those under the Single Payment Scheme. This will<br />
result in an increasing focus on some aspects of<br />
environmental management that, together with<br />
changes driven by decoupling, are likely to have<br />
positive effects on greenhouse gas mitigation.<br />
Notably our aim is that cross compliance will<br />
generally improve soil management through the<br />
implementation of Soil Protection Reviews, and<br />
so reduce soil carbon loss. The Government<br />
will consider whether monitoring of crosscompliance<br />
can help to identify ancillary<br />
benefits in addressing climate change. This<br />
monitoring is due to be undertaken in 2008.<br />
23. These are significant changes that will affect the<br />
agricultural sector. We are committed, through<br />
the Agriculture and Environmental <strong>Change</strong><br />
Observatory to monitoring the changes in order<br />
to improve our understanding of the implications<br />
for the industry and the environment, including<br />
climate change. The Government will ensure<br />
that the Agricultural <strong>Change</strong> and<br />
Environment Observatory contributes data<br />
to assess current and predicted greenhouse<br />
gas emissions from agriculture, and the<br />
factors underlying the change.
Agriculture, forestry and land management<br />
95<br />
Reducing nitrous oxide emissions<br />
24. The use of inorganic nitrogen as fertiliser is a<br />
major source of nitrous oxide. Nitrous oxide<br />
emissions also arise from manures during storage.<br />
There are a number of effective practical actions<br />
and technologies that can be taken up by farmers<br />
to optimise the efficiency of the use of fertilisers,<br />
reduce inorganic nitrogen use and maximise the<br />
benefit of organic nitrogen, thereby reducing<br />
nitrous oxide emissions. These would contribute<br />
to greater resource efficiency and more<br />
sustainable farming overall, and include:<br />
• regular fertiliser spreader testing to ensure<br />
accuracy of application;<br />
• operator registration and training;<br />
• crop nutrient management planning;<br />
• soil nutrient status testing – to better match<br />
application of fertiliser to need;<br />
• maximising the use of technology to target<br />
nutrient use and reduce machinery<br />
operations;<br />
• integration of manures into fertiliser regimes<br />
and reduction in inorganic fertiliser use<br />
(particularly grassland fertiliser applications);<br />
and<br />
• improved slurry handling.<br />
25. For example, we estimate that a 5 per cent<br />
reduction in overall fertiliser use could be<br />
achieved through improving spreader efficiency<br />
and related measures. This would save the<br />
equivalent of 0.15 MtC per year by 2010.<br />
26. The practices needed to reduce nitrous oxide<br />
emissions are, in many cases, similar to those<br />
required to address other negative impacts of the<br />
use of nutrients. As part of a resource efficient<br />
approach to farm management, these actions<br />
would also reduce farmers’ fertiliser costs as<br />
a proportion of overall production costs and<br />
also contribute to a reduction in the overall<br />
negative environmental impact of agriculture.<br />
The Government’s aim is to encourage action<br />
which will maximise the multiple benefits<br />
that can be achieved from changes in farm<br />
practice, and to simplify the messages to<br />
land managers about the change in<br />
behaviour required.<br />
27. Farm practice changes can be incentivised by an<br />
appropriate policy framework, which may range<br />
from voluntary initiatives and supportive<br />
measures (including incorporation of some<br />
changes in revisions of agri-environment<br />
schemes), through market mechanisms to<br />
well-designed and targeted regulation. This range<br />
of policy measures is being examined by the<br />
Government as part of the Catchment Sensitive<br />
Farming (CSF) <strong>Programme</strong> aimed at tackling<br />
diffuse water pollution from agriculture (DWPA)<br />
to help meet objectives of the Water Framework<br />
Directive. For water quality outcomes, the CSF<br />
programme focuses on all pollutants and takes<br />
account of delivery of commitments under the<br />
Nitrates Directive through the Nitrate Vulnerable<br />
Zones (NVZ) Action programme. CSF and NVZ<br />
Action <strong>Programme</strong>s are discussed in detail below.<br />
28. The Water Framework Directive requires all inland<br />
and coastal waters to reach ‘good status’ by<br />
2015. Diffuse pollution from agriculture is a<br />
significant problem; 60 per cent of nitrates and<br />
44 per cent phosphorus loads in <strong>UK</strong> surface<br />
waters comes from agriculture. <strong>Defra</strong>’s<br />
Catchment Sensitive Farming (CSF) <strong>Programme</strong><br />
seeks to tackle this issue and help land managers<br />
meet their obligations under the Directive. The
96<br />
Agriculture, forestry and land management<br />
Nitrates Directive will be a basic measure under<br />
the Water Framework Directive and will be a key<br />
mechanism for helping to meet the Directive’s<br />
nitrates targets.<br />
gas emissions. The Government will encourage<br />
agricultural practice changes which both<br />
deliver water quality outcomes and at the<br />
same time reduce greenhouse gas emissions<br />
and will ensure that the developing measures<br />
under the Catchment Sensitive Farming<br />
<strong>Programme</strong> and NVZ Action <strong>Programme</strong> are<br />
also designed, where possible, to maximise<br />
benefits for climate change goals.<br />
29. The CSF <strong>Programme</strong> and measures under NVZ<br />
Action <strong>Programme</strong>s are not however designed to<br />
tackle climate change directly. The final package<br />
of measures for tackling diffuse water pollution<br />
from agriculture will not be finalised until 2008-<br />
09. Work on predicting the ancillary benefits of<br />
future and current policy options (including<br />
impacts of the England CSF Delivery Initiative and<br />
Nitrates Directive), such as greenhouse gas<br />
reduction, is under way, as is monitoring of the<br />
effectiveness of the current CSF Delivery Initiative.<br />
The monitoring activity is unlikely, however, to<br />
provide clear results until 2009. The Nitrates<br />
Directive is aimed at reducing water pollution by<br />
nitrate from agricultural sources.<br />
30. The final package of CSF policy measures, which<br />
will most likely go further than the England CSF<br />
Delivery Initiative and the Nitrates Directive, will be<br />
based on the most cost-beneficial options for<br />
meeting the Water Framework Directive, which will<br />
include consideration of impacts on climate<br />
change. At this stage, and before final decisions<br />
are made, it is difficult to predict the precise<br />
greenhouse gas reductions resulting from these<br />
measures. However, information available on the<br />
impacts of the Nitrates Directive suggests that the<br />
changes in organic and inorganic nitrogen use that<br />
NVZ Action <strong>Programme</strong>s may bring about, are<br />
expected to lead to some reduction in greenhouse<br />
31. There may also be a need in future for further<br />
action on greenhouse gas emissions if other<br />
policies, such as the Catchment Sensitive Farming<br />
<strong>Programme</strong>, are assessed as not delivering<br />
sufficient change, or where there is continued<br />
uncertainty as to their effect on greenhouse gases.<br />
The Government will explore this further in<br />
the context of a broader approach to resource<br />
efficiency in agriculture, as part of future<br />
work on delivering the Sustainable Farming<br />
and Food Strategy.<br />
Reducing methane emissions<br />
32. Methane is an important greenhouse gas, with<br />
46 per cent of <strong>UK</strong> emissions arising from<br />
agriculture. 80 per cent of this methane comes<br />
from enteric fermentation in the digestive systems<br />
of animals, and 20 per cent from animal waste 6 .<br />
Methane levels have been decreasing over the<br />
recent years. The likely decline in animal numbers<br />
as a result of decoupling following the latest CAP<br />
reform, and ongoing increases in productivity and<br />
fertility in the livestock industry, suggest that<br />
overall emissions of methane are likely to<br />
decrease further in the period to 2020.<br />
6 www.defra.gov.uk/environment/statistics/globatmos/gagccukem.htm
Agriculture, forestry and land management<br />
97<br />
33. Emissions of methane result from diffuse sources<br />
and through variable biological processes, making<br />
them difficult to quantify. Actions to directly<br />
reduce methane emissions from livestock may<br />
include changes to feed regimes: recent research<br />
suggests that substantial methane reductions<br />
could be achieved by this approach. Improving<br />
the longevity of dairy cows will also result in<br />
decreased methane production as a result of a<br />
reduction in the total number of animals needed<br />
to produce the same quantity of milk. In the<br />
longer-term it may be technically feasible to<br />
directly reduce emissions by manipulating enteric<br />
fermentation processes, for example through<br />
genetic improvement. <strong>Defra</strong>’s research portfolio is<br />
examining all these options in a programme<br />
costing some £5.5m in 2005-06.<br />
34. Some of the potential options may however be<br />
inappropriate: they may not always be compatible<br />
with the Government’s wider goals for<br />
sustainable agriculture, may not be cost effective,<br />
have unacceptable animal welfare implications,<br />
or may risk additional environmental impacts<br />
involved in growing a high resource input<br />
alternative, for example maize instead of grass<br />
based feed.<br />
Research into use of feed additives to<br />
reduce methane emissions<br />
Researchers at the Rowett Institute in<br />
Aberdeen have been conducting research into<br />
developing a feed additive for ruminants that<br />
inhibits methane formation and improves feed<br />
efficiency. By adding a form of fumaric acid to<br />
the diet, lamb growth trials have shown that<br />
up to 70 per cent inhibition of methane<br />
formation can be achieved. This inhibition also<br />
gives rise to an improved feed efficiency of 10<br />
per cent, i.e. the lambs gain weight 10 per cent<br />
faster for the same consumption of feed 7 .<br />
Further economic and environmental<br />
evaluations are now being conducted.<br />
Anaerobic digestion<br />
35. Anaerobic digestion is a widely-used technology<br />
for the purification of industrial and municipal<br />
waste waters, which reduces their environmental<br />
impact and also produces a useful by-product in<br />
the form of biogas, mainly methane. The<br />
technology can be applied to the treatment of<br />
animal manures. The resulting biogas can be used<br />
for heat and power, thereby providing an<br />
additional income source for farmers and further<br />
reducing greenhouse gas emissions through<br />
fossil-fuel substitution, especially in areas where<br />
animal slurries are available year-round, for<br />
example in intensive livestock units. Compared to<br />
the original manures, the remaining solid<br />
digestate can have improved properties for use as<br />
an organic fertiliser.<br />
36. Manures can also be co-digested with other<br />
waste streams, such as from the food chain. The<br />
latter already provides a composting and disposal<br />
opportunity for some farm businesses. Codigestion<br />
also enhances the nutrient content of<br />
the digestate, further improving its value as a<br />
fertiliser source. Industry has called for a standard<br />
for the digestate produced by anaerobic digestion<br />
plants, and the Government is currently scoping<br />
what further work might be required on this<br />
issue.<br />
37. The understanding of the technologies, practical<br />
management options, issues such as biosecurity,<br />
and the market potentials for dealing with<br />
methane from the agriculture sector is still<br />
evolving. The Government views this as an<br />
important area for further work, and the Biomass<br />
Taskforce recently recommended that options to<br />
pursue anaerobic digestion technology and<br />
biogas production were explored. The <strong>UK</strong> is also<br />
committed to identifying solutions as part of the<br />
G8 inspired international Methane to Markets<br />
Partnership and co-chairs a new Agriculture Subcommittee<br />
of the Partnership. The Government<br />
will convene a high level international<br />
seminar of experts before the end of <strong>2006</strong> to<br />
identify opportunities, barriers and<br />
technologies for addressing methane<br />
7 www.rowett.ac.uk/Reducing_Methane_JWallace.htm
98<br />
Agriculture, forestry and land management<br />
emissions from agriculture under the<br />
auspices of the Methane to Markets<br />
Partnership Agriculture Sub-committee.<br />
environmental issues should contribute to three<br />
EU level priority areas: biodiversity, water, and<br />
climate change.<br />
Market-based mechanisms<br />
38. The measures described above for reducing<br />
emissions of nitrous oxide and methane are<br />
intended to deliver gains in the short to medium<br />
term. To allow the agriculture forestry and land<br />
management sector to play its full part in<br />
meeting the challenge of climate change, and to<br />
ensure real engagement by individuals and<br />
businesses, the Government believes that a long<br />
term policy signal is required. This needs to offer<br />
the prospect of bringing financial gain in return<br />
for behavioural change, and of promoting<br />
innovation. The Government will examine<br />
the scope and feasibility of a market based<br />
mechanism, compatible with the<br />
Government’s aspirations for the EU<br />
Emissions Trading Scheme and <strong>UK</strong> Emissions<br />
Trading Scheme, to facilitate trading of<br />
greenhouse gas reductions from agriculture<br />
and other land management sectors.<br />
Rural Development Regulation<br />
and Environmental Stewardship<br />
39. The impact on greenhouse gas mitigation of<br />
existing agri-environment agreements is not easy<br />
to evaluate, as the schemes were not designed to<br />
achieve this goal. However, they have encouraged<br />
low-input agriculture and are likely to have<br />
contributed to decreased emissions, for example<br />
through decreased fertiliser use, buffered<br />
waterways against fertiliser run off, and reduced<br />
grazing intensity. The Government sees it as<br />
essential to improve our knowledge base on this<br />
issue, and will support further relevant research.<br />
40. The Government is currently preparing a strategy<br />
for England for expenditure under the new EU<br />
Rural Development Regulation for 2007-2013, of<br />
which Environmental Stewardship will be a key<br />
part. The EU Strategic Guidelines for Rural<br />
Development require that resources devoted to<br />
41. The Regulation contains many relevant measures,<br />
for example support for agri-environment<br />
schemes, forestry and energy crops. The strategy<br />
for England is currently the subject of<br />
consultation, which provides an opportunity for<br />
consideration on how the England Rural<br />
Development <strong>Programme</strong> might best assist in<br />
future in addressing climate change.<br />
42. The main vehicle in England for environmental<br />
land management is Environmental Stewardship,<br />
introduced in 2005 under the England Rural<br />
Development <strong>Programme</strong>. It builds on the success<br />
of the previous schemes, but has wider objectives,<br />
and it comprises Entry Level, Organic Entry Level,<br />
and Higher Level strands. The requirements of<br />
Entry Level Stewardship go beyond those of crosscompliance<br />
regulations and it is hoped that the<br />
majority of agricultural land will be covered by ELS<br />
after the first few years of operation.<br />
43. Building on the first phase of Environmental<br />
Stewardship, the Government will review<br />
progress in 2007-8 to ensure that<br />
expenditure is effectively directed to policy<br />
priorities, including the potential for<br />
Environmental Stewardship to contribute to<br />
climate change objectives. Through its<br />
research programme the Government will<br />
improve its understanding of the<br />
contribution which improved land<br />
management practices (including<br />
Environmental Stewardship measures)<br />
can make to climate change mitigation.<br />
Integrated Pollution, Prevention and<br />
Control (IPPC)<br />
44. The <strong>UK</strong> Pollution Prevention and Control<br />
Regulations will apply to large intensive pig and<br />
poultry producers in the agricultural sector.<br />
Measures being considered under IPPC are<br />
focused primarily on ammonia reductions, but are<br />
likely also to contribute to nitrous oxide emission<br />
reductions.
Agriculture, forestry and land management<br />
99<br />
Reducing carbon dioxide emissions<br />
45. Although the majority of greenhouse gas<br />
emissions from land-based sectors are non-CO 2<br />
gases, there are ways in which land-based sectors<br />
can reduce their own carbon dioxide emissions.<br />
Additionally, agricultural practices can help to<br />
mitigate carbon dioxide emissions from other<br />
sectors, through carbon sequestration in soil and<br />
timber, and by substituting for fossil fuels and<br />
fossil fuel-based products.<br />
Energy efficiency<br />
46. The intensive pig and poultry farming sectors<br />
have been involved in climate change agreements<br />
since 2001 and have targets to reduce their CO 2<br />
emissions by some 100k tonnes over their<br />
baselines.<br />
Carbon Aware Land Management<br />
The Country Land and Business Association<br />
(CLA) is pioneering the use of a farm-level tool<br />
for land managers to audit their net<br />
greenhouse gas emissions and sinks. The CLA<br />
has developed CALM as a way of raising<br />
awareness of climate change amongst rural<br />
land based businesses. Doing a greenhouse gas<br />
audit will give individual farmers an idea of the<br />
magnitude of their emissions and will enable<br />
them to look at ways to reduce those emissions<br />
while working with the grain of their business.<br />
For example, this could include more efficient<br />
use of fuel, budgeting nutrient inputs and<br />
sequestering carbon in soil and timber, where<br />
these are practical and in some cases supported.<br />
Non-food crops<br />
47. Members of the horticulture sector of the<br />
National Farmers’ Union also receive a 50 per<br />
cent discount from the climate change levy until<br />
the end of March <strong>2006</strong> In the 2003 Pre-Budget<br />
Report the Chancellor announced an extension to<br />
include some other energy intensive businesses in<br />
the climate change agreements. The horticulture<br />
sector is now eligible for a full climate change<br />
agreement under the new criteria and has agreed<br />
challenging energy reduction targets.<br />
48. Government research to identify methods to<br />
improve energy efficiency in the glasshouse<br />
horticulture sector is ongoing. Early results<br />
indicate it is possible to achieve significant<br />
reductions in energy use in commercial situations,<br />
often combined with the use of combined heat<br />
and power.<br />
49. Crops grown for alternative uses to food can be<br />
used as energy crops or as a source of renewable<br />
raw materials to replace other fossil fuel based<br />
products. The Government is committed to<br />
supporting the development of non-food<br />
crops and in November 2004 launched the<br />
Strategy for Non-Food Crops and Uses 8 . The<br />
Biomass Taskforce, headed by Sir Ben Gill, was<br />
established to help Government and industry<br />
optimise the development of biomass energy<br />
in support of renewable energy targets and<br />
sustainable farming, forestry and rural objectives.<br />
The Taskforce published its final report 9 on<br />
25 October 2005 and the Government will<br />
respond at the end of April <strong>2006</strong>.<br />
8 Strategy for Non-Food Crops and Uses, November 2004: www.defra.gov.uk/farm/acu/pdf/nfc-strategy.pdf<br />
9 Biomass Task Force Report 25 October 2005: www.defra.gov.uk/farm/acu/energy/biomass-taskforce/btf-finalreport.pdf
100<br />
Agriculture, forestry and land management<br />
further in the energy supply chapter, as part of<br />
the discussion on renewable energy, and in the<br />
public sector chapter.<br />
51. In 2000 we introduced the Energy Crops Scheme<br />
to support farmers growing energy crops. This<br />
runs to <strong>2006</strong>, and the Government is consulting<br />
on further measures to apply from 2007 under<br />
the new EU Rural Development Regulation. <strong>Defra</strong><br />
also supports an extensive energy crop breeding<br />
programme to develop varieties which offer<br />
increasing yields but require little in the way of<br />
fertilisers and pesticides.<br />
50. The Biomass Taskforce has made<br />
recommendations directly relevant to land<br />
managers on energy crops research and support<br />
for supply chains. We are considering these<br />
proposals as part of the Government's response<br />
to the Taskforce report. Subject to State Aids<br />
approval, the Government intends to launch<br />
a further round of the Bio-energy<br />
Infrastructure Scheme during <strong>2006</strong>-07. The<br />
Taskforce recommendations are considered<br />
52. Plantings to <strong>2006</strong> under the existing Energy Crops<br />
Scheme are expected to lead to carbon savings of<br />
11 ktC in 2010. Additional savings from a new<br />
scheme with plantings from 2007 onwards,<br />
including interim arrangements already made by<br />
<strong>Defra</strong>, would be expected to be around 13ktC in<br />
2010, rising to 43 ktC by 2020. In addition to the<br />
contribution to emissions reduction through fossil<br />
fuel substitution, the expansion of energy crops<br />
also enhances on-site carbon stocks. It is<br />
estimated that in 2010, the projected uptake<br />
associated with standing biomass stocks (stumps<br />
and roots) from planting under a new scheme<br />
from 2007, would be 47 ktC, with ongoing new<br />
savings of 27 ktC and 12 ktC by 2015 and 2020<br />
respectively.<br />
Energy Crops Scheme<br />
Renewable Energy Growers Ltd in South Yorkshire,<br />
and Thames Valley Bioenergy Coppice in Berkshire,<br />
are two producer groups established with funding<br />
from <strong>Defra</strong>'s Energy Crops Scheme. Grants have<br />
been provided to help with the administrative setup<br />
costs for the producer groups and the purchase<br />
of equipment such as harvesters and trailers. The<br />
groups aim to recruit 30 and 50 short rotation<br />
coppice growers respectively during the five year<br />
funding period. Members will work together to<br />
harvest their crop and supply it to a variety of endusers<br />
including small-scale local heat boilers, Slough<br />
Heat and Power (a large CHP plant) and Drax Power<br />
Ltd (a large power station which is trialling the<br />
co-firing of energy crops with coal).
Agriculture, forestry and land management<br />
101<br />
53. Non-food crops can also provide renewable raw<br />
materials to replace fossil fuel based products such<br />
as plastics and chemicals. In principle, crop derived<br />
products can usually be considered to be carbon<br />
neutral, or offer further carbon savings when<br />
assessed over their whole lifecycle, subject to<br />
efficient production and proper recovery. The<br />
Government-supported National Non-Food Crops<br />
Centre is driving forward innovation in the nonfood<br />
crops sector and is working with farmers,<br />
universities and research institutes, and industry,<br />
to help bring new sustainable products and<br />
technologies to market. The Government will<br />
continue its research on non-food crops with<br />
funding of around £2m a year, and the<br />
monitoring of the Non-Food Crops Strategy<br />
for its contribution to climate change policy<br />
outcomes.<br />
56. Growing trees provide an important ‘carbon sink’<br />
by capturing carbon dioxide from the atmosphere<br />
and storing it as wood and in associated forest<br />
soils. The proportion of land under woodland in<br />
the <strong>UK</strong> has increased from 5 per cent in 1924 to<br />
nearly 12 per cent in 2003. These woodlands<br />
contain 150 MtC in tree biomass and are<br />
currently removing about 4 MtC annually.<br />
Increasing and protecting such sinks through<br />
afforestation, reducing deforestation and good<br />
management, are therefore important aspects of<br />
climate change mitigation and adaptation. Forest<br />
soils in the <strong>UK</strong> contain significantly more carbon<br />
than the trees and it is essential that these carbon<br />
reserves be maintained through good<br />
management practice. Updated guidance will be<br />
available following the ongoing revision of the<br />
Forests and Soil Conservation Guidelines 10 .<br />
54. The Strategy encompasses a range of concerted<br />
actions to incentivise and support development of<br />
markets for non-food crops, including provision<br />
of advice and information and funding scientific<br />
research into their use. This policy could save<br />
0.1MtC by replacing crude oil, used as a<br />
feedstock in various industrial processes, with<br />
renewable raw materials (RRM). It is estimated<br />
that up to 10 per cent of crude oil consumed in<br />
the EU is used for these purposes especially in the<br />
production of polymers but also in the production<br />
of lubricants, solvents, surfactants and fibres. At<br />
end of life disposal of such materials a transfer of<br />
carbon from fossil deposits to the atmosphere<br />
occurs though incineration, or over a significantly<br />
longer timescale through material decay. Using<br />
plant-derived RRM ensures that at least some of<br />
this carbon cycle is closed by substituting<br />
atmospheric carbon for fossil carbon in products.<br />
Sustainable forestry policy<br />
55. The practical framework for the delivery of<br />
sustainable forestry in the <strong>UK</strong> is the <strong>UK</strong> Forestry<br />
Standard, which has been endorsed by the<br />
administrations of England, Scotland, Wales and<br />
Northern Ireland and built into their separate<br />
forestry policies.<br />
57. Forestry policies which support planting or the<br />
sustainable management of woodland are a<br />
useful tool in delivering carbon benefits. For<br />
example, woodland established since 1990 under<br />
the English Woodland Grant Scheme will remove<br />
3.5MtC between <strong>2006</strong> and 2020, assuming<br />
planting continues at current levels 11 . The<br />
dynamics of tree growth mean that any increase<br />
in woodland creation would have limited initial<br />
impact, with maximum carbon savings achieved<br />
beyond 2020. As an illustration, increasing the<br />
area planted threefold between <strong>2006</strong> and 2020<br />
would only realise relatively modest additional<br />
emissions reductions of 0.025 and 0.3 MtC in<br />
2010 and 2020, rising to 0.4MtC in 2035.<br />
58. Forestry can contribute to mitigating climate<br />
change through providing wood as a renewable<br />
10 FC (1998). Forests and soil conservation guidelines. Forestry Commission, Edinburgh.<br />
11 Modelling carried out by CEH using methodology employed in <strong>UK</strong> GHG inventory projections (www.nbu.ac.uk/ukcarbon).
102<br />
Agriculture, forestry and land management<br />
fuel source, as identified by the Biomass Taskforce<br />
and the existing Forestry Strategies. In England,<br />
0.7Mt of woodfuel (equivalent to carbon savings<br />
of 0.25MtC) could be provided annually without<br />
serious disruption to existing wood-using<br />
industries 12 . The majority would be sourced from<br />
the use of arboricultural arisings, harvesting<br />
residues and small dimension or poor quality<br />
stemwood from ongoing management activity.<br />
59. Increases in the growing stock have outstripped<br />
removals through harvesting over a number of<br />
decades, particularly for broadleaf species in<br />
privately owned woodlands. Many woodlands are<br />
currently overstocked and not being actively<br />
managed. If barriers to active management were<br />
removed, up to an additional one million dry<br />
tonnes per annum of woodfuel could be sourced<br />
from existing English woodland between now<br />
and 2020, corresponding to savings of 0.12MtC<br />
in 2010 and 0.4MtC in 2020. Utilisation of this<br />
existing woodfuel resource could satisfy much of<br />
the immediate need for woody biomass, enabling<br />
the strategic development of capacity in<br />
bioenergy. The Government will continue<br />
to develop the woodfuel supply chain,<br />
increasing the operationally available<br />
resources and focusing on local capabilities<br />
though the Regional Forestry Frameworks.<br />
60. As with other non-food crops, wood can make a<br />
substantial contribution to emissions reductions<br />
by substituting for materials that have a higher<br />
fossil fuel input required for their production,<br />
such as concrete or steel. Development of wood<br />
technology and an increased usage of wood in<br />
the construction industry will maximise these<br />
benefits. The Government will continue to<br />
promote the role of wood as a renewable<br />
material in sustainable development though<br />
schemes such as ‘wood for good’ which<br />
transfers knowledge of timber systems to<br />
the construction industry.<br />
environmental, social and landscape functions of<br />
woodland. We will ensure that adaptation policy<br />
operates at a landscape scale and is an integral<br />
part of other rural and urban policies. We also<br />
recognise that woodlands can assist society in<br />
coping with the some of the challenges of a<br />
changing environment such as protecting<br />
threatened habitats and species, reducing<br />
pollution impacts on water resources and<br />
achieving sustainable flood management.<br />
The Government will ensure that the current<br />
and future reviews of the England Forestry<br />
Strategy take full account of the<br />
opportunities and risks for forestry from<br />
climate change. These include forestry’s<br />
role in mitigation and its contribution to<br />
adaptation strategies to minimise the effects<br />
of climate change.<br />
Soil management<br />
62. Soil is a major reservoir of carbon: <strong>UK</strong> soil carbon<br />
stocks are in the order of 10,000 billion tonnes,<br />
and soils of the English uplands contain more<br />
carbon than all the trees in the <strong>UK</strong> and France<br />
added together. Evidence suggests that over<br />
the last 25 years there has been a general decline<br />
in soil organic matter in agriculturally managed<br />
soils, more so in some soils than others.<br />
The mechanism for this, and that of carbon<br />
sequestration in soils, is complex and still not<br />
fully understood.<br />
61. The Government will continue to develop<br />
adaptation strategies to make woodlands<br />
more resilient against the impacts of climate<br />
change, both to prevent stored carbon being<br />
released into the atmosphere and to protect the<br />
63. The Government has a programme of work in<br />
place to increase our understanding of which<br />
soils are vulnerable to carbon loss (among other<br />
12 McKay H. (2003). Woodfuel resource in Britain. Final contract report to DTI, Scottish Enterprise, Welsh Assembly Government and the Forestry Commission<br />
(www.dti.gov.uk/renewables/publications/pdfs/bw300787main.pdf).
Agriculture, forestry and land management<br />
103<br />
key threats), and identify and encourage land<br />
management practices that will conserve soil<br />
resources, for example through erosion control<br />
and cultivation practices. The Strategy for<br />
Sustainable Farming and Food includes targets to<br />
encourage practices to halt the decline of soil<br />
organic matter caused by agricultural practices in<br />
vulnerable soils by 2025. These measures are<br />
currently being implemented through a number<br />
of policies; more may be needed in the future.<br />
Specifically, sequestration of carbon in soil is not<br />
a simple process and requires a long-term<br />
commitment to consistent land management in<br />
order to be viable.<br />
64. Under Action 30 of the First Soil Action Plan for<br />
England, <strong>Defra</strong> and <strong>UK</strong>CIP have also funded initial<br />
work on the impacts of climate change on soil<br />
functions. This work is reviewing research to date<br />
to provide us with a comprehensive, current view<br />
of potential climate change impacts on soils and<br />
the ecosystem services they provide; and to<br />
identify high risk land management practises<br />
and potential mitigation/climate-proofing options.<br />
This research also aims to identify suitable soil<br />
reference sites for use in assessing climate change<br />
effects in the years ahead. The Government<br />
will commission further work on the cause<br />
of soil carbon decline and will host a<br />
conference to address the state of our<br />
knowledge of the issue and what could<br />
be done to address it.
104<br />
CHAPTER EIGHT<br />
Public sector<br />
In 2004, the public sector estate, including the devolved administrations, was responsible for carbon dioxide<br />
emissions of 5.7 MtC on an end user basis or about 5 per cent of the <strong>UK</strong> total. Central government<br />
departments were responsible for about one-tenth of this that share.<br />
Emissions had fallen to about 28 per cent below 1990 levels by 2004 and we estimate that, including the<br />
expected impact of the new measures included in this programme, they will remain at about this level<br />
through to 2010, as electricity consumption has been increasing per unit of floor area with the introduction of<br />
open plan working, increased IT equipment and air conditioning, and flexible and extended working hours.<br />
The Government recognises that demonstrating leadership by reducing carbon dioxide emissions from its<br />
own estate is important and can be achieved by reducing energy demand, improving energy efficiency and<br />
continuing to source more electricity from renewables. Local authorities can have a significant influence<br />
over emissions in their local areas, particularly through how they exercise their functions and discharge<br />
their statutory duties. The Government is also currently responsible for around 30 per cent of total new<br />
build spending and will only procure buildings in the Central Government estate that are in the topquartile<br />
in terms of energy performance.<br />
Measures introduced in the <strong>Climate</strong> <strong>Change</strong> <strong>Programme</strong> 2000 are estimated to save around 0.2 MtC in<br />
2010. Activity undertaken to meet targets in the central Government estate and NHS, public sector<br />
engagement with the Carbon Trust, and improvements in the standard of buildings as a result of the<br />
Building Regulations are the main contributors, with product policy also playing an important role.<br />
Some of the new measures that will deliver additional carbon savings to 2010 are:<br />
• provision of £4 million in new funding to create a local authority best practice support and<br />
improvement programme to be launched in <strong>2006</strong>-7 and consideration of how to ensure that the local<br />
government performance framework will include an appropriate focus on action on climate change,<br />
sufficient to incentivise more authorities to reach the levels of the best.<br />
• a new revolving loan fund of £20m to finance investment by the public sector in energy efficiency. This<br />
will provide support to at least 20 local authorities in <strong>2006</strong>-07 and 20 other public sector organisations<br />
by the end of 2008; and<br />
• delivering the DfES Building Schools for the Future and other capital programmes to make a substantial<br />
improvement in energy efficiency and carbon emissions standards of new and refurbished schools in<br />
England.<br />
Together it is estimated that these new measures will contribute an additional 0.3 MtC of carbon savings in<br />
2010, bringing total savings in 2010 to 0.5 MtC.<br />
Introduction<br />
1. The public sector is in a key position to lead on<br />
carbon emissions reduction by setting a<br />
behavioural and strategic example to the private<br />
sector. By setting high standards of energy<br />
efficiency and reducing carbon emissions, the<br />
public sector can not only reduce its own<br />
emissions but also influence the supply chain for<br />
buildings and energy-using appliances.<br />
2. However, like the private sector, public sector<br />
organisations, face barriers in identifying and<br />
driving through carbon saving opportunities.<br />
A key consideration is finding the up-front<br />
investment that could lead to savings in future<br />
years. Equally important is the need to engage<br />
senior management and to attract staff resources<br />
dedicated to tackling energy waste. By<br />
overcoming these barriers in its own organisation,<br />
the Government can set an example for the<br />
wider public and the private sector to follow.
Public sector<br />
105<br />
Greenhouse gas emissions inventory<br />
and projections<br />
3. In 2004, public sector greenhouse gas emissions<br />
were around 6 MtC on an end user basis, around<br />
3.3 percent of total <strong>UK</strong> emissions and had reduced<br />
by some 30 percent since 1990. Annual emissions<br />
by 2010 are expected to be 23 per cent below<br />
1990 levels. These emissions include those from<br />
the central government estate, the NHS estate,<br />
local authorities, and the education sector 1 .<br />
Projections of greenhouse gas emissions from the public sector and<br />
estimated effect of additional quantified measures, MtC<br />
The role of local government<br />
4. Action by local authorities is likely to be critical to<br />
the achievement of Government’s climate change<br />
objectives. Local authorities are uniquely placed<br />
to provide vision and leadership to local<br />
communities, raise awareness and help change<br />
behaviours. In addition, through their powers and<br />
responsibilities (housing, planning, local transport,<br />
powers to promote well-being and through<br />
activities such as their own local procurement and<br />
operations) they can have significant influence<br />
over emissions in their local areas.<br />
MtC<br />
11<br />
10<br />
9<br />
8<br />
7<br />
6<br />
5<br />
1990 1995 2000 2005 2010 2015 2020<br />
Historical trend<br />
Baseline with measures projections<br />
Additional quantified measures<br />
5. During the review of the <strong>Climate</strong> <strong>Change</strong><br />
<strong>Programme</strong> the Government commissioned a<br />
study to assess the scope for carbon savings from<br />
local and regional activity 2 . This showed that<br />
some local authorities are already taking<br />
exemplary action on climate change. For<br />
example, in response to their responsibilities<br />
under the Home Energy Conservation Act<br />
(HECA) 3 . Examples of such action have been<br />
showcased in the Round 6 Sustainable Energy<br />
Beacon Councils Theme and through initiatives<br />
such as the Nottingham Declaration on <strong>Climate</strong><br />
<strong>Change</strong>.<br />
Greenhouse gas emissions from the public sector, MtC<br />
Gas 1990 1995 2000 2004 2010 2015 2020<br />
Carbon dioxide 7.9 7.2 6.1 5.7 5.9 6.0 5.5<br />
Methane 0.5 0.4 0.2 0.2 0.5 0.4 0.4<br />
Nitrous oxide 0.1 0.0 0.0 0.0 0.1 0.1 0.1<br />
Total 8.5 7.7 6.3 5.9 6.5 6.6 6.0<br />
<strong>Change</strong> from 1990 levels -9.5 -25.0 -30.1 -22.7 -22.5 -29.4<br />
Note: the percentage changes and emission estimates may differ slightly due to rounding<br />
Existing measures<br />
Central Government estate energy efficiency target,<br />
NHS Estates targets, <strong>UK</strong> universities and English schools 0.2<br />
TOTAL 0.2<br />
Additional measures<br />
Additional effort by local authorities 0.2<br />
Revolving loan fund for the public sector 0.1<br />
TOTAL 0.3<br />
Carbon savings in 2010 (MtC)<br />
Carbon savings in 2010 (MtC)<br />
1 Local authority housing is covered by the domestic sector.<br />
2 ‘Local and Regional Action to Cut Carbon’, Centre for Sustainable Energy, July 2005.<br />
3 Under the 1995 Home Energy Conservation Act, local authorities with housing responsibilities are required to report on energy efficiency improvements for<br />
all residential accommodation within their boundaries. They must also prepare a strategy for improving energy efficiency within residential accommodation,<br />
produce annual progress reports and set targets for themselves.
106<br />
Public sector<br />
Sustainable Energy Beacon Councils<br />
In 2005, the Government launched a<br />
Sustainable Energy Beacon Councils scheme.<br />
Seven councils were selected as Beacons:<br />
Cornwall with Caradon, Carrick, Isles of Scilly,<br />
Kerrier, North Cornwall, Penwith, and<br />
Restormel has an ambitious and far-reaching<br />
strategy for sustainable energy development,<br />
published by the Cornwall Sustainable Energy<br />
Partnership.<br />
Within its Environmental Management Audit<br />
Scheme (EMAS) partnership framework, High<br />
Peak takes responsibility for delivering its<br />
climate change, fuel poverty, energy efficiency,<br />
energy costs and air quality objectives.<br />
Leicester has set itself a very ambitious 50 per<br />
cent reduction target for CO 2<br />
emissions by<br />
2025. Innovative projects include innovative use<br />
of metering and monitoring; and recycling of<br />
sustainable electricity export receipts from<br />
households.<br />
Lewisham’s work includes large-scale domestic<br />
energy efficiency and fuel poverty<br />
programmes; providing sustainable energy<br />
advice; energy auditing surveys and use of<br />
remote energy management controllers.<br />
Nottinghamshire has reduced CO 2<br />
emissions<br />
from council buildings by 25% in the past 4<br />
years. The council has delivered projects<br />
covering energy management, CHP, woodfuelled<br />
boilers, transport and fleet management.<br />
Shropshire engages in partnership working<br />
with various communities including Women’s<br />
Institute groups, church congregations and<br />
focused action in specific market towns. Action<br />
and targets are formulated with the<br />
communities.<br />
Woking operates a private wire distributed<br />
generation system, using technologies<br />
including fuel cell CHP, solar PV and ground<br />
source heat pumps A save-to-spend approach<br />
maintains momentum.<br />
6. The Government welcomes and supports the work<br />
by these exemplary local authorities, and recognises<br />
the value they have added. However, the study<br />
raised concerns about the extent that local action<br />
depends critically on interested, committed<br />
individuals within local government to succeed.<br />
7. The Government recognises that the local<br />
government performance framework does not<br />
currently include the outcome-focused content<br />
on climate change which would reflect the<br />
importance of tackling climate change and the<br />
potentially critical role local government will need<br />
to play in this in the short, medium and long<br />
term. But the Government also has a<br />
commitment to avoid placing unfunded new<br />
burdens on local government, and to move<br />
existing responsibilities to a more flexible,<br />
outcome-focussed basis, with greater flexibility to<br />
deliver on national priorities in the most effective<br />
way for that locality.<br />
8. Local Area Agreements (LAAs) offer great<br />
potential for delivering shared central local<br />
priorities, including sustainable development<br />
outcomes. <strong>Climate</strong> change and energy outcomes<br />
are included in the current LAA Guidance and<br />
associated Outcomes Framework.<br />
9. The Government wants to see a significant<br />
increase in the level of engagement by local<br />
government in climate change issues. The current<br />
local government performance framework,<br />
including the Comprehensive Performance<br />
Assessment, is currently under review. It is<br />
intended a new framework will be introduced<br />
post 2008, following the Comprehensive<br />
Spending Review, which is considering the<br />
overall performance framework for public<br />
services. In this context, the Government will<br />
consider how to ensure that the local<br />
government performance framework will<br />
include an appropriate focus on action on<br />
climate change, sufficient to incentivise more<br />
authorities to reach the levels of the best.
Public sector<br />
107<br />
The Nottingham Declaration on climate change<br />
The Nottingham Declaration was launched in October 2000. The Declaration is a voluntary pledge to<br />
address the issues of climate change, signed by the Leader and Chief Executive of a council. In signing it,<br />
councils are committing to ensure that tackling climate change is a cornerstone of the council's strategy.<br />
So far, over 100 local authorities have signed the Declaration, each pledging to actively tackle climate<br />
change within their area.<br />
The Declaration was recently re-launched and will soon be accompanied by a much improved support<br />
package that shows councils how to develop a sustainable energy strategy.<br />
10. The Government will also publish a report<br />
on ways in which local authorities can<br />
reduce greenhouse gas emissions and<br />
alleviate fuel poverty, within 18 months of<br />
the <strong>Climate</strong> <strong>Change</strong> and Sustainable Energy<br />
Bill’s commencement. Local authorities will<br />
have to have regard to this report in carrying<br />
out their functions. The Bill, currently before<br />
Parliament, is sponsored by Mark Lazarowicz and<br />
supported by the Government.<br />
11. The Government will ensure that there are no<br />
unfunded new burdens created. In keeping with<br />
this commitment the Government and its<br />
agencies will:<br />
• fund a new £4m local government best<br />
practice support programme, to be<br />
launched in <strong>2006</strong>-7. This programme will be<br />
delivered through the new local authority led<br />
Improvement Partnerships being set up in<br />
every region in conjunction with the 7<br />
Sustainable Energy Beacons. The programme<br />
will aim to proactively benchmark the<br />
performance of local authorities on climate<br />
change and sustainable energy and target<br />
those who need the most help to raise their<br />
performance. It will help local authorities to<br />
access existing sources of expertise, support<br />
and funding, on sustainable energy and<br />
climate change by the EST and the Carbon<br />
Trust, as well as external sources of support,<br />
such as the Nottingham Declaration and <strong>UK</strong><br />
Home Energy Conservation Association;<br />
• to assist this HM Treasury announced in<br />
Budget <strong>2006</strong> that it will host a seminar that<br />
will bring together central and local<br />
government to encourage the further<br />
dissemination of best practice and innovation;<br />
• provide further resources to local<br />
authorities to invest in energy saving on<br />
their own estate through the Carbon<br />
Trust’s Local Authority Energy Financing<br />
Scheme, which will be developed into a<br />
public sector revolving loan fund following the<br />
announcement of an additional investment<br />
of £20m in the 2005 Pre-Budget Report.<br />
This is discussed in more detail elsewhere<br />
in this chapter;<br />
• as set out in the Domestic Sector chapter, the<br />
Government has announced £20 million over<br />
the next two years, to help local authorities<br />
and others work in partnership with energy<br />
companies to promote and incentivise energy<br />
efficiency measures to households; and<br />
• work with the Local Government<br />
Association (LGA) and others, to review<br />
thoroughly existing requirements on, and<br />
guidance to, local authorities on<br />
sustainable energy and climate change.<br />
Within this, the Government is committed to<br />
a realignment of existing resources away from<br />
process (for example the preparation of<br />
reports) and towards outcomes (for example<br />
carbon savings, delivered in a way most<br />
appropriate for the local area) – so that,<br />
combined with funding available to local<br />
authorities, consideration of the inclusion<br />
of a focus on climate change in the new<br />
performance framework does not represent a
108<br />
Public sector<br />
new unfunded burden and provides greater<br />
flexibility to deliver on national priorities in the<br />
most effective way for that locality.<br />
12. We believe that together these measures can<br />
deliver additional savings of 0.2MtC in 2010.<br />
Given the critical role of local government in<br />
achieving our climate change objectives, the<br />
longer term benefits may be much more<br />
significant.<br />
13. Datasets will be important if local authorities are<br />
to begin to effectively monitor their performance<br />
on climate change issues. In October 2005, the<br />
Government published experimental statistics on<br />
carbon dioxide emissions at local authority and<br />
Regional Government Office level. These<br />
estimates will be updated in <strong>2006</strong> and there will<br />
be further engagement with local and regional<br />
government and other stakeholders to establish<br />
what other monitoring approaches may be useful.<br />
14. The Government recognises the important role<br />
Sustainable Community Strategies, Local Strategic<br />
Partnerships (LSPs) and Local Area Agreements<br />
have to play in helping to tackle climate change.<br />
In order to strengthen the delivery of sustainable<br />
development at local level, the Government has<br />
committed to reshaping Community<br />
Strategies into Sustainable Community<br />
Strategies. As previously mentioned, under<br />
the <strong>Climate</strong> <strong>Change</strong> and Sustainable Energy<br />
Bill, the Government will publish a report<br />
which local authorities will have to have<br />
regard to in exercising their functions. The<br />
Sustainable Community Strategy framework<br />
may be a suitable route to show how they<br />
will take this forward with partners on LSPs.<br />
Planning<br />
15. The location, design, construction and siting of<br />
built development and economic and social<br />
activity can significantly affect the level of<br />
greenhouse gas emissions. Statements of<br />
planning policy, issued by the Government and<br />
the devolved administrations, set out a national<br />
policy framework for plan making at regional and<br />
local levels and may be relevant to individual<br />
planning decisions. These statements take<br />
account of the impacts of climate change. The<br />
Government is examining ways to enhance the<br />
role of the planning system in tackling climate<br />
change.<br />
16. The Government has already set out in Planning<br />
Policy Statement 22 its policies for the promotion<br />
of renewable energy in England. It is committed<br />
to a review of the permitted development rights<br />
enjoyed by householders, to see if the rules could<br />
be made easier and clearer, especially as regards<br />
the installation of renewable energy technology<br />
on the exterior of houses and in domestic<br />
gardens. It is currently in the process of<br />
strengthening guidance on managing flood risk<br />
in development. The Government now intends<br />
to prepare and consult on a new PPS setting<br />
out how it expects participants in the<br />
planning process to work towards the<br />
reduction of carbon emissions in the<br />
location, siting and design of new<br />
development.<br />
The role of communities<br />
17. Local communities have a major role to play in<br />
tackling climate change, for example, by raising<br />
awareness locally or through local projects on<br />
cleaner transport or the use of renewable energy<br />
in community buildings. All types of community<br />
groups can make a difference including<br />
neighbourhood groups, residents’ groups, sports<br />
or social groups, faith groups and tenants’<br />
groups.<br />
18. Many communities are already making a big<br />
difference through programmes such as the<br />
Energy Saving Trust’s Community Action for<br />
Energy initiative, which is designed to promote<br />
and facilitate local community-based energy<br />
projects. It provides advice, case studies and<br />
support to groups who are interested in getting<br />
involved in local action 5 .<br />
19. The Prime Minister made a commitment to<br />
re-invigorate community action on sustainable<br />
4 The LAA Guidance outlined how LAAs can help deliver SD. A section of the LAA Toolkit deals with the ways in which LAAs can deliver on cross-cutting<br />
outcomes such as climate change. This can be found at: www.idea-knowledge.gov.uk/idk/core/page.do?pageId=910763<br />
5 For further information call the helpline on 08701 261 444. or visit the website at www.est.org.uk/cafe/
Public sector<br />
109<br />
development and, at the launch of the<br />
Sustainable Development Strategy in March<br />
2005, he announced Community Action 2020.<br />
This is a programme of action to improve support<br />
for wider community action on the sustainable<br />
development priorities 6 . Community Action 2020<br />
is part of the Government’s overall commitment<br />
to work together with local people to secure a<br />
more sustainable future 7 .<br />
The role of English Regions<br />
20. The Energy White Paper (EWP) highlighted the<br />
key role played in England by regional bodies,<br />
such as Regional Development Agencies (RDAs),<br />
Regional Assemblies and Government Offices and<br />
local authorities in delivering <strong>UK</strong> objectives on<br />
climate change and sustainable energy.<br />
21. Regional bodies have powers and responsibilities<br />
that will impact on the long-term shift to low<br />
carbon such as the responsibility RDAs have for<br />
regional economic development. Regional bodies<br />
are uniquely placed to help coordinate local, subregional<br />
and regional activity with national policy,<br />
and reduce overlaps to optimise outcomes.<br />
23. In response to the Energy White Paper’s call for<br />
the English regions to develop strategic<br />
approaches to energy, energy partnerships, partfunded<br />
by central Government, now exist in all<br />
regions. These partnerships have been taking<br />
forward a variety of practical regional projects<br />
aimed at reducing emissions, linking closely with<br />
the regional sustainable development agenda.<br />
Through work to integrate climate change into<br />
the new performance framework for local<br />
authorities, the Government proposes to look<br />
over the next year at what might be done to<br />
further enhance the role.<br />
The Greater London Assembly (GLA)<br />
London’s directly elected Mayor and Assembly, came to power in July 2000.<br />
The Mayor has stated that energy and climate change are key issues for London and in 2004, through his<br />
own initiative, set out how the capital could contribute to reducing <strong>UK</strong> emissions in the London Energy<br />
Strategy. One of the aims of the strategy was to set up the London Energy Partnership to ensure that<br />
London’s energy sector attracted both investment and intellectual capital.<br />
In 2005, the London <strong>Climate</strong> <strong>Change</strong> Agency was established with a remit to support climate change<br />
projects in the capital utilising public and private funds.<br />
The GLA has also published a draft Supplementary Planning Guidance document on Sustainable Design and<br />
Construction to complement the Spatial Development Strategy (London Plan). The Guidance includes new<br />
policies on energy efficiency and renewable energy.<br />
The Government welcomes these steps. The consultation on the review of GLA powers in 2004-5, asked<br />
specifically whether the GLA should be given statutory responsibility to produce an energy strategy to<br />
enhance the impact of a wider range of regional strategies, and act as a focus for cooperation between<br />
regional partners.<br />
The Government will be reviewing responses to this consultation and will consider how the Assembly’s<br />
role in promoting sustainable energy and climate change may be enhanced.<br />
London's programme of activities may generate additional carbon savings, which may impact on progress<br />
towards our domestic goal. GLA are developing a roadmap for emissions reductions, which they intend to<br />
publish in summer <strong>2006</strong>. The Government will work closely with GLA over the coming months to<br />
determine how any savings that emerge should be factored into the <strong>UK</strong> <strong>Programme</strong>.<br />
6 More information, ideas and useful links can be found at the community action webpage:<br />
www.sustainable-development.gov.uk/delivery/global-local/community.htm<br />
7 Further information about the Government’s Together we can initiative can be found at the following website:<br />
www.communities.homeoffice.gov.uk/civil/together-we-can/
110<br />
Public sector<br />
24. The Government is working with representatives<br />
of the Regional Development Agencies to<br />
respond to Recommendation 13 of Ben Gill’s<br />
biomass taskforce report, which recommends that<br />
all RDAs should set themselves targets for carbon<br />
reduction. Initial discussions have been<br />
positive, and the Government and RDAs<br />
expect to bring forward proposals jointly<br />
over the coming year.<br />
Funding schemes for public sector<br />
organisations<br />
25. In the 2005 Pre-Budget Report the Chancellor<br />
announced an increase in funding for the Carbon<br />
Trust by £20m over the next two years to<br />
establish a revolving fund for energy<br />
efficiency work in the public sector, building<br />
on the pilot Local Authority Energy<br />
Financing (LAEF) Scheme. In such a scheme<br />
loan funding for organisations is conditional on<br />
maintaining a ring-fenced energy management<br />
fund, with initial funding supplied by the scheme<br />
and sometimes all or part matched by the<br />
participating organisation.<br />
they plan, invest and save within their portfolio<br />
giving them real reasons to ‘invest to save’ for<br />
the long term. Not only does this improve<br />
environmental and efficiency standards within<br />
estates, but it can also stimulate more<br />
widespread adoption of energy saving and<br />
carbon reduction measures.<br />
27. With the additional funding of £20m, Salix<br />
Finance, which was set up by the Carbon Trust to<br />
administer the new revolving fund, will initiate a<br />
major escalation in funding support for public<br />
sector organisations in <strong>2006</strong>-07. The scheme is<br />
expected to deliver additional carbon savings<br />
of 0.1MtC by 2010. Salix will seek proposals<br />
from local authorities with the aim of<br />
increasing the size of its existing LAEF<br />
programme by around 60 authorities and<br />
will begin work on new funding vehicles to<br />
support central Government departments,<br />
higher education and the NHS, with the aim<br />
of supporting at least 20 new public sector<br />
organisations in 2007-08.<br />
28. The experience that Carbon Trust and Salix<br />
Finance have gained through the development of<br />
the Local Authority Energy Finance Scheme has<br />
shown that successful delivery of the fund will<br />
depend on client organisations developing<br />
innovative approaches to overcoming financial<br />
barriers to providing up-front investment in<br />
energy management. Therefore the<br />
Government, with the Carbon Trust, will<br />
establish a high level steering group to<br />
oversee the early development of the fund<br />
and to tackle barriers as they are<br />
encountered.<br />
26. Most energy efficiency measures in public sector<br />
buildings have a payback period of within five<br />
years or less. A scheme which creates revolving<br />
funds would be a net benefit to public<br />
expenditure after around four years, and<br />
continuing for the lifetime of the measures<br />
installed, in many cases, at least another ten<br />
years. Financial mechanisms of this type drive<br />
change by encouraging procurement managers<br />
and decision makers to look again at the way<br />
29. Overcoming financial barriers is important but<br />
they do not exist in isolation. Alongside the<br />
development of a revolving fund mechanism, the<br />
role of advice and support is central to the public<br />
sector achieving its goals. The Carbon Trust’s<br />
Carbon Management programme is tailored<br />
to large public sector organisations such as<br />
Government Departments, local authorities and<br />
higher education organisations. The programme<br />
helps organisations assess how to combat the<br />
risks and take advantage of the opportunities
Public sector<br />
111<br />
associated with climate change. It goes beyond<br />
energy management, enabling organisations to<br />
consider their strategy and operations in the<br />
context of climate change. As well as reducing<br />
carbon emissions, the benefits include cost<br />
savings, clarity around responses to legislation<br />
and operational improvements.<br />
Public sector procurement<br />
30. The Government is ideally placed to lead by<br />
example, through its procurement of goods,<br />
services and buildings. With a budget of over<br />
£125bn, the wider public sector can build<br />
markets for new and improved products and<br />
services, such as systems for the generation of<br />
renewable electricity and renewable heat and<br />
through pursuing higher standards of energy<br />
performance. Sustainable procurement is a key<br />
lever to achieve this, from developers to<br />
architects, engineers, construction companies and<br />
facilities managers, the skills and mentality to<br />
deliver and operate low-carbon buildings could<br />
develop quickly across both public and private<br />
sectors if the public sector takes the lead.<br />
31. In 2003 the Government implemented a range<br />
of measures to encourage central government<br />
departments to apply minimum environmental<br />
standards across a wide range of commonly<br />
purchased products. To help Government<br />
departments meet these standards the Sustainable<br />
Procurement Group identified 19 energy<br />
consumption-focused ‘Quick Wins’ which are<br />
off-the-shelf procurement specifications. These<br />
were published in the OGC Buying Solutions<br />
(OGCbs) website 9 , along with corresponding<br />
procurement frameworks. The Government has<br />
since committed to extending and updating the<br />
list of Quick Wins. Proposals to extend them to<br />
31 energy consumption focused products have<br />
been published in the Government’s Market<br />
Transformation <strong>Programme</strong> and OGC’s websites.<br />
32. The future direction and scope of this initiative<br />
will take into account the views of the<br />
Sustainable Procurement Task Force. Established<br />
in May 2005 under the chairmanship of Sir<br />
Neville Simms, the Sustainable Procurement Task<br />
Force is set up to draw up an action plan by<br />
spring <strong>2006</strong>, to bring a step-change in<br />
sustainable public procurement so that the <strong>UK</strong><br />
is among the leaders in the EU by 2009.<br />
33. Energy is also set to play its part in meeting the<br />
wider target, set by the Gershon report, to<br />
generate £22bn public sector savings by March<br />
2008. The Public Sector Efficiency Review for<br />
Energy is a project, managed by OGCbs, to<br />
generate £200m energy savings, through<br />
developing innovation in energy procurement,<br />
improving the management of energy through<br />
better metering and clearer billing and increasing<br />
conservation activity. A Pan-Government Energy<br />
Forum, which includes key stakeholders from the<br />
public and private sectors, will ensure that the<br />
project leverages good work, and avoids<br />
duplication of activity in different departments.<br />
Central Government<br />
34. Targets for the Government Estate are being<br />
reviewed as part of the <strong>UK</strong> Sustainable<br />
Development Strategy commitment to improve<br />
the Government’s performance and ensure it<br />
leads by example. Targets on energy and climate<br />
change are two key areas for the review.<br />
35. The Government launched the Sustainable<br />
Development Framework for the Government<br />
Estate 10 in 2002 which included a range of<br />
environmental targets. The six energy targets<br />
focus on reducing the amount of energy used,<br />
and hence carbon dioxide emitted, increasing<br />
energy efficiency and sourcing energy from more<br />
sustainable sources. There are also transport<br />
targets for reducing emissions from road<br />
transport.<br />
36. Progress is being made in many areas. For<br />
example most departments have continued to<br />
reduce their fossil fuel use per unit floor area since<br />
2000. Overall, the combined average total of the<br />
amount of electricity sourced from renewable<br />
sources for the departments and their agencies is<br />
19 per cent, suggesting that the central<br />
9 www.ogcbs.gov.uk/environmental/newsroom/articles/downloads/Min Env Standards.DOC<br />
10 www.sustainable-development.gov.uk/delivery/integrating/estate/energy-intro.htm
112<br />
Public sector<br />
Government Estate has already met its renewable<br />
electricity target of 10 per cent by 2008. All nine<br />
of the departments that have initiated new estate<br />
management contracts since August 2004 have<br />
included clauses to ensure opportunities are<br />
identified, and measures are taken to reduce<br />
carbon dioxide emissions, leading to greater<br />
improvements in the management of the Estate in<br />
the future. Departments have already met, or are<br />
close to meeting, their transport carbon dioxide<br />
emissions reduction target.<br />
37. Key targets on reducing absolute carbon<br />
emissions and electricity use per unit floor area<br />
are not currently being met. The Government<br />
is therefore reviewing the existing targets<br />
in the Framework to deliver strengthened<br />
strategic targets by summer <strong>2006</strong>, to ensure<br />
a step change in the way that Government<br />
departments manage their own energy and<br />
emissions is achieved. Making sure that the<br />
correct set of targets is in place and issues with<br />
the collection and quality of data are tackled is<br />
necessary to guarantee a high level of confidence<br />
in the progress of this sector. Equally important is<br />
securing commitment to changing behaviour. To<br />
tackle the issue of engaging top management<br />
attention, new annual reporting procedures are<br />
being developed, and larger public sector<br />
organisations are being encouraged to sign up<br />
for the Carbon Trust’s Carbon Management<br />
programme 11 . <strong>Defra</strong> was the first department to<br />
do so. The Sustainable Development Commission<br />
already provides an independent report and<br />
commentary on the performance of central<br />
Government departments. In the future, each<br />
Secretary of State will be required to sign-off<br />
their department’s annual progress report.<br />
38. However there are significant challenges ahead.<br />
For example the Civil departments, excluding the<br />
Ministry of Defence, have experienced a 7 per<br />
cent increase in total floor area since 1999-2000;<br />
their electricity consumption per unit floor area<br />
has also been increasing with the introduction of<br />
open plan working, increased IT and air<br />
conditioning, flexible and extended working<br />
hours. Sustainable Development Ministers 12 have<br />
agreed that all central Government<br />
Departments will sign up for a Carbon Trust<br />
energy audit to identify cost effective<br />
savings and develop the action plans needed<br />
to deliver them.<br />
The wider public sector<br />
39. The whole public sector estate, including the<br />
devolved administrations, is responsible for about<br />
5 per cent of the total <strong>UK</strong> carbon dioxide<br />
emissions. Since central Government is<br />
responsible for only about 15 per cent of this<br />
total, it is necessary to extend focus on the wider<br />
public sector.<br />
40. In December 2005 Sustainable Development<br />
Ministers committed to establishing reporting<br />
mechanisms on activity to improve energy<br />
efficiency for all parts of the public sector. To<br />
deliver this the Government will carry out an<br />
examination of energy management information<br />
in the wider public sector with a view to making<br />
recommendations for improvements in the<br />
completeness and quality of energy data before<br />
the end of <strong>2006</strong>. This will help Government<br />
achieve its own public sector target of achieving<br />
a 0.5MtC reduction in emissions from it’s own<br />
operations, by 2010 which was set in 2000.<br />
41. All sectors of the Government Estate will review<br />
their carbon emissions reduction strategies. While<br />
a raft of energy efficiency measures are currently<br />
being deployed to good effect across the Estate,<br />
further opportunities exist to reduce emissions<br />
from fossil fuels. A key approach is by using<br />
renewable fuels in place of gas and oil. This<br />
approach goes further than buying renewable<br />
electricity from the grid, it looks to the<br />
Government to produce its own renewable<br />
electricity and heat. Regarding heating for<br />
example: if 20 per cent of the heating boilers,<br />
which annually are replaced or refurbished on the<br />
Government Estate, were replaced by boilers<br />
equipped to run on biomass, the annual carbon<br />
savings from the replacements by 2020 would be<br />
between 0.12 – 0.15MtC by 2020. 13<br />
11 Carbon Management is a tool developed by the Carbon Trust to help large public and private sector organisations develop effective management<br />
procedures for the efficient use of energy.<br />
12 www.sustainable-development.gov.uk/government/ministers.htm<br />
13 Assumes 20-year replacement/refurbishment cycle; total Government Estate heat demand of 17.7TWhth/a (of Public Estate total heat demand of<br />
59.1TWhth/a); 2.65TWh/a replaced; and carbon saving of 0.05 – 0.06 MtC per TWh.
Public sector<br />
113<br />
Schools<br />
42. The education sector accounts for approximately<br />
10 per cent of carbon emissions for all commercial<br />
and public buildings. Annual energy returns from<br />
schools, collected by the Government for the<br />
period 1999-00 to 2002-03 show that, due to<br />
increased use of information and communications<br />
technologies and extended opening hours, there<br />
has been a substantial increase in electricity<br />
consumption. Greater use of renewable energy<br />
technologies in schools has the potential to help<br />
address increased consumption and reduce carbon<br />
emissions from the schools estate.<br />
43. Building on the Sustainable Development<br />
Action Plan for Education and Skills launched<br />
in 2003, the Government will emphasise<br />
the sustainability and energy efficiency<br />
requirements for school buildings through<br />
a Sustainable Schools launch and<br />
consultation in <strong>2006</strong>. The intention is to provide<br />
a framework for sustainable development for<br />
existing schools which is designed to assist them<br />
in producing and delivering a sustainability plan<br />
tailored to their needs.<br />
44. To meet the challenge set by the Prime Minister,<br />
that all new schools and City Academies should be<br />
models for sustainable developmentthe<br />
requirement is for all schools procured through the<br />
Building Schools for the Future (BSF) and other<br />
major capital programmes to achieve rating of<br />
‘very good’ 15 or better. Funding levels provide for<br />
this. A number of quality indicators 16 must be used<br />
in all BSF school projects and in post-occupancy<br />
evaluations, such as transport (including cyclists),<br />
reducing energy and waste in the building process<br />
and using natural day-light and ventilation<br />
wherever possible. To support this work, this<br />
year the Government will collect energy and<br />
consumption data from 2003-04 to 2005-06 to<br />
benchmark school energy consumption and<br />
set targets for the sector and will publish new<br />
guidance on the design of sustainable<br />
schools, emphasising the role of energy<br />
performance in sustainable design.<br />
45. The Government is committed to promoting<br />
renewable energy technologies in all schools in<br />
England from a range of options including<br />
biomass boilers, wind turbines, solar PV, solar<br />
thermal and ground source heat pumps.<br />
Government programmes to support the<br />
development of micro-generation have played an<br />
important part in providing funding for the<br />
development of technologies within the schools<br />
estate. To date the Government has committed<br />
nearly £3m for projects in 186 schools. The<br />
Budget <strong>2006</strong> announcement to provide a further<br />
£50m for the installation of mircogeneration<br />
technology will benefit schools further. There are<br />
approximately 25,000 schools in England,<br />
uniquely distributed within its communities and<br />
connecting tangibly with millions of children,<br />
young people and families. Renewable energy<br />
technologies have a key role to play in reducing<br />
carbon emissions and engaging future<br />
generations with climate change issues. The use<br />
of renewable technologies can also provide a rich<br />
learning resource for teaching of science,<br />
geography, design and technology, citizenship<br />
and mathematics.<br />
14 Though in secondary schools this has been partially offset by improved energy efficiency.<br />
15 This is based on the Building Research Establishment Environmental Assessment Method (BREEAM13).<br />
16 www.dqi.org.uk/Schools/default.htm
114<br />
Public sector<br />
48. The Higher Education Funding Council for<br />
England 17 (HEFCE) provides grants to institutions<br />
through their Leadership, Governance and<br />
Management Fund to support the development<br />
and promotion of good practice. In July 2005<br />
HEFCE published a strategy and action plan 18 ,<br />
setting out how, within the next ten years, the<br />
Higher education sector in England will achieve<br />
sustainability and tackle climate change. This will be<br />
a key cross-cutting theme of HEFCE’s strategic plan<br />
for <strong>2006</strong>-11, which will be published in April <strong>2006</strong>.<br />
46. To aid this process, the Government is<br />
developing a strategy on renewable energy<br />
generation and carbon reduction for schools.<br />
This will include a whole life costs toolkit to help<br />
decision makers prioritise expenditure on energy<br />
efficiency measures and low and zero carbon<br />
energy systems. The Government will work<br />
with the private sector and NDPBs to<br />
develop an approach to support schools in<br />
developing, as part of the primary capital<br />
programme, renewable energy generation to<br />
make the process easy, low (or zero) cost,<br />
and genuinely attractive to schools. This<br />
approach will promote excellent sustainable<br />
design, offer high efficiency potential, develop<br />
best practice partnering with the private sector<br />
and set out how to develop the skill necessary in<br />
schools, local authorities and the private sector.<br />
Higher and further education<br />
47. Higher education institutions have a significant<br />
impact on the environment. Each year they are<br />
responsible for consuming 5.2 billion kWh of<br />
energy at a cost of over £200m and spend £3bn<br />
on goods and services. They educate two million<br />
students and employ almost 300,000 staff, and<br />
have an opportunity to support a sustainable<br />
society by equipping students with the values,<br />
skills and knowledge to contribute to sustainable<br />
development. They also have the opportunity to<br />
generate and transfer knowledge through<br />
research and leadership of, and influence on,<br />
local, national and international networks.<br />
49. The Carbon Trust has developed a version of<br />
Carbon Management tailored to the needs of<br />
the Higher education sector. This provides technical<br />
and change management support to help the<br />
sector realise carbon emissions savings from areas<br />
such as academic, accommodation and leisure<br />
buildings and vehicle fleets. This is supported by<br />
a Higher Education Carbon Management Toolkit<br />
which provides process guidance, technical<br />
advice, case studies and a suite of specifically<br />
tailored tools. The pilot programme was launched<br />
in April 2005 to 20 universities and runs until<br />
March <strong>2006</strong>. The second phase is due to<br />
commence in May <strong>2006</strong> and will extend support<br />
to a further 25 universities.<br />
The Learning and Skills Council (LSC) estate<br />
is approximately 7.13 million square metres<br />
(excluding agricultural buildings and<br />
residences) and is responsible for consuming<br />
approximately 1.7 billion kWh of energy at a<br />
cost of over £43m per year.<br />
The Government expects providers, working<br />
with the Learning Skills Council, to<br />
demonstrate good governance in sustainable<br />
buildings and estate management which will<br />
see them undertake a review of the social,<br />
economic and environmental aspects of their<br />
organisations and identify areas for action.<br />
relating to energy, building and design,<br />
procurement and travel through for example,<br />
encouraging the use of video and telephone<br />
conferencing across the LSC to reduce business<br />
travel and ‘recycling’ redundant IT equipment<br />
for schools and charities.<br />
17 www.hefce.ac.uk/<br />
18 This is available at: www.hefce.ac.uk/pubs/hefce/2005/05_28/.
Public sector<br />
115<br />
The NHS Estate<br />
50. The NHS has the largest property portfolio in<br />
Europe and the biggest capital spend programme<br />
with an annual budget over £76bn. The NHS<br />
employs over one million people and spends<br />
£11bn per year on goods and services. Tasked<br />
with building new hospitals, and GP premises,<br />
it expects to spend £12bn on new facilities by<br />
2010. Energy use costs the NHS over £312m per<br />
year and is responsible for emissions of nearly<br />
1 MtC each year.<br />
The NHS has two targets in England:<br />
• to reduce the level of primary energy<br />
consumption by 15 per cent or 0.15 MtC<br />
from a base year of March 2000 by March<br />
2010; and<br />
• to achieve a target of 35-55 Gj/100m3 energy<br />
efficiency performance for the healthcare<br />
estate for all new capital developments and<br />
major redevelopments or refurbishments; and<br />
that all existing facilities should achieve a<br />
target of 55-65 Gj/100m 3 .<br />
51. Data up to 2004-05 demonstrates that the energy<br />
efficiency of the NHS estate in England continues<br />
to improve. If this trend continues, predictions<br />
show that total energy consumption is likely to<br />
reduce by 15 per cent from 2000 figures by 2010.<br />
Predictions indicate that this performance is likely<br />
to continue with higher building standards and<br />
greater elements of the future estate comprising<br />
more local low-tech facilities and fewer, but more<br />
efficient, high-tech acute facilities. Carbon<br />
dioxide emissions are not reducing to the same<br />
extent but it is anticipated this will improve with<br />
the impact of the forthcoming revised Building<br />
Regulations and the Energy Performance of<br />
Buildings Directive and the further development<br />
of renewable energy sources.<br />
52. The Hartlepool Hospital energy centre is a clear<br />
example of a partnership between the NHS and<br />
the private sector and is an exemplar of Best<br />
Value Procurement for the NHS. Not only does it<br />
deliver lower energy costs and reduce carbon<br />
emissions, but it also provides the Trust with a<br />
secure energy source and the ability to generate<br />
revenue when it exports electricity.<br />
CHP and the Hartlepool Energy Centre<br />
Dalkia Utilities Services developed a new energy<br />
centre at the Hartlepool Hospital as part of a PFI<br />
contract with North Tees and Hartlepool NHS Trust.<br />
This development includes the installation,<br />
operation and the management of a 1.4 MWe<br />
reciprocating engine based CHP scheme with waste<br />
heat recovery boiler. The boiler extracts heat from<br />
the engine’s exhaust gases to generate steam which<br />
will then be fed into the hospital’s steam system.<br />
The low-grade heat from the engine water jacket<br />
will also be utilised to provide hot water.<br />
The scheme is designed to provide most of the<br />
Hospital’s steam and electricity requirements. Any<br />
surplus electricity is to be exported to other Trust<br />
properties so they can benefit from the climate<br />
change levy exemption. The scheme is to generate<br />
about 11,000 MWh of electricity per year for on site<br />
use and export to the Trust’s other properties.
116<br />
Public sector<br />
THE ENCODE<br />
The Department of Health in partnership with<br />
the Carbon Trust and collaboration with the<br />
devolved administrations is working to produce<br />
a Health Technical Memorandum entitled<br />
“EnCO2de – making energy work in healthcare”.<br />
The document is to be published in <strong>2006</strong> and is<br />
intended as a comprehensive guide to all issues<br />
relating to the procurement and management<br />
of energy in the NHS in the <strong>UK</strong>. The aim of<br />
Encode is to ensure that everyone involved in<br />
managing, procuring and using buildings and<br />
equipment thinks about the implications of<br />
energy use; today and in the future.<br />
Cross-cutting measures to improve<br />
energy efficiency<br />
53. The majority of emissions from the public sector<br />
come from buildings. In 2004 the sector<br />
accounted for 34 per cent of new non-domestic<br />
building construction and 37 per cent of nondomestic<br />
refurbishment and maintenance work<br />
(totalling almost 1.5 per cent of <strong>UK</strong> GDP) 19 .<br />
54. The <strong>2006</strong> revision to Part L of Building<br />
Regulations in England and Wales is set to<br />
reduce emissions by up to 27 per cent for nondomestic<br />
buildings. Continued tightening of the<br />
standard with successive revisions to Part L will<br />
enable the sector to make progress towards the<br />
2050 target of reducing <strong>UK</strong> emissions by 60 per<br />
cent. This will be necessary as the public sector is<br />
increasing the intensity of its activities, with the<br />
total floor area of public sector buildings growing<br />
at nearly 2 per cent per year (mostly in the health<br />
and education sectors). However, most of the<br />
emissions between now and 2050 will come from<br />
buildings that are already part of the public estate<br />
therefore the elements of the Building<br />
Regulations which apply to refurbishment and<br />
should generate a 5 per cent improvement in<br />
energy performance in the existing stock.<br />
55. Another key measure which targets existing<br />
building stock is the Energy Performance of<br />
Buildings Directive (EPBD). A key requirement<br />
of the Directive is that when a building is<br />
constructed, sold or rented out an energy<br />
performance certificate must be made available<br />
to the prospective buyer or tenant. In buildings<br />
over 1000m 2 that are used to provide a public<br />
service there is a requirement to display the<br />
certificate in a public place. Displaying an energy<br />
performance certificate is intended to encourage<br />
public pressure on building occupiers to modify<br />
their behaviour in order to make energy<br />
performance transparent. Through this measure<br />
the Government will deliver the commitment<br />
announced in the 2004 Energy Efficiency Action<br />
Plan to only procure buildings in the Central<br />
Government estate which are in the topquartile<br />
in terms of energy performance. This<br />
has the potential to open up price differentials<br />
which could help to transform the property market<br />
in the similar way to white goods labelling.<br />
56. The conclusion of negotiations of the Energy<br />
End-Use Efficiency and Energy Services<br />
Directive was a key achievement as part of the<br />
Government’s efforts to give energy efficiency a<br />
high priority during <strong>UK</strong>’s Presidency of the EU.<br />
The Directive was agreed in December 2005 and<br />
will be formally adopted in Spring <strong>2006</strong>. Its<br />
objective is to enhance the cost-effective<br />
improvement of energy end-use efficiency in the<br />
Member States. This is to be achieved among<br />
other ways through the public sector<br />
communicating its efforts to the public and<br />
ensuring the exchange of best practice. As part<br />
of implementing the Directive, the Government<br />
must apply at least two measures from the<br />
following list: the use of financial instruments;<br />
guidance; requirements to purchase energy<br />
efficient equipment and vehicles; requirements<br />
to replace or retrofit existing equipment and<br />
vehicles; requirements to use energy audits; and<br />
the requirement to purchase or rent energyefficient<br />
buildings. Through implementation of<br />
the Directive, the public sector will play a key part<br />
in contributing to the overall savings target of<br />
9 per cent of the average amount of energy<br />
consumed during the previous five years, over<br />
9 years.<br />
19 BSRIA Statistics Bulletin, June 2005.
CHAPTER NINE<br />
Stimulating action by individuals<br />
117<br />
Individuals, households and communities have a crucial role in tackling climate change. The <strong>UK</strong>'s emissions<br />
are the cumulative result of the choices made by government, businesses, organisations in other sectors<br />
and individuals. But government can play a critical role, by establishing a framework that encourages and<br />
enables changes in behaviour that reduce the footprint of individuals. Many of the policies set out<br />
elsewhere in this programme will contribute to this. But we will do more, and enable individuals to make<br />
choices that reduce the impact of our individual and collective actions on the environment and help to<br />
meet our emissions reduction goals.<br />
• The Government will review and find more innovative ways to encourage individuals to make<br />
sustainable choices and help them to understand their own role and responsibility in tackling climate<br />
change. Earlier chapters set out a number of commitments which will contribute to this.<br />
• The Government will continue to build relationships with organisations such as the Energy Saving Trust<br />
to ensure that partnerships between key players are developed and links are made between raising<br />
awareness and taking action at all levels – individual, business and the public sector.<br />
• The Government will set out a plan for further action on sustainable consumption by the end of <strong>2006</strong>,<br />
responding to the report of the Round Table on Sustainable Consumption due in Spring <strong>2006</strong>.<br />
• The Government is planning a new online information service (working title: Environment Direct) to<br />
provide information on the environmental impact of a range of everyday products and services, and<br />
practical advice on how people can make the most sustainable lifestyle choices.<br />
• In December 2005 <strong>Defra</strong> launched the first elements of a new <strong>Climate</strong> <strong>Change</strong> Communications<br />
Initiative. The Initiative aims to change public attitudes toward climate change, with a central focus on<br />
local, grass roots and regional engagement.<br />
• <strong>Defra</strong> is providing up to £4m over three years to roll out a new package of measures to help thousands<br />
of community groups across England to take action on sustainable development, including climate<br />
change. This initiative will be launched later in <strong>2006</strong>.<br />
Understanding the barriers<br />
1. Encouraging changes in the way we live, often<br />
habits engrained over many years, is not simple.<br />
What Government has done in the past has led<br />
to some significant changes but failed to make<br />
the fundamental shift needed to move to a low<br />
carbon economy. This chapter summarises the<br />
aspects of the <strong>Climate</strong> <strong>Change</strong> <strong>Programme</strong><br />
through which the Government aims to<br />
encourage a change in individual and collective<br />
behaviour, and sets out further plans.<br />
2. The Government’s Sustainable Development<br />
Strategy, Securing the Future – delivering <strong>UK</strong><br />
sustainable development strategy 1 , introduced a<br />
new approach to delivering long-term behaviour<br />
change based on the latest available research and<br />
evidence, and gave greater recognition to some<br />
of the social and practical factors that influence<br />
and limit how we choose to behave.<br />
3. Further work has been undertaken by the Round<br />
Table on Sustainable Consumption, jointly led by<br />
the Sustainable Development Commission and<br />
the National Consumer Council, which has<br />
examined the potential for a significant shift<br />
towards more sustainable lifestyles and is about<br />
to come forward with recommendations aimed<br />
at those areas of our lives which have greatest<br />
environmental impact, including food, homes<br />
and travel.<br />
4. One important issue that the Round Table has<br />
raised is the need to understand the respective<br />
1 HM Government (2005) Securing the future – delivering <strong>UK</strong> sustainable development strategy: www.sustainable-development.gov.uk
118<br />
Stimulating action by individuals<br />
roles of Government, business and consumers in<br />
promoting behaviour change and reducing the<br />
negative environmental impacts of products. In<br />
certain circumstances Government and business<br />
will need to play a leadership role in “choice<br />
editing”, taking responsibility for ensuring<br />
appropriate minimum standards as well as<br />
advising consumers about better lifestyle choices.<br />
Consumers should expect that environmental<br />
responsibility will be as fundamental to the<br />
products they buy as health and safety is now.<br />
Making the <strong>Change</strong><br />
Exemplify – Government taking<br />
the lead<br />
6. Government can play a critical role by<br />
establishing a framework that encourages and<br />
enables changes in behaviour that reduces the<br />
footprint of individuals. Many of the policies set<br />
out in this programme already will contribute to<br />
this. But we will do more, and enable individuals<br />
to make choices that reduce the impact of our<br />
individual and collective actions on the<br />
environment and help to meet our emissions<br />
reduction goals.<br />
5. The new model in Securing our Future set out an<br />
integrated approach to catalysing behaviour<br />
change through the four “Es”. The <strong>Climate</strong><br />
<strong>Change</strong> <strong>Programme</strong> includes measures that seek<br />
to exemplify, enable, engage, and encourage<br />
the right attitude.<br />
7. By increasing the purchase and use of energy<br />
efficient goods and services we create a powerful<br />
demand that markets will seek to meet,<br />
stimulating innovation and new business<br />
opportunities. The Government is committed to<br />
leading by example by making sustainable<br />
choices in the management of its own estates.<br />
Approach evolves<br />
as attitudes and<br />
behaviours change<br />
over time<br />
• Remove barriers<br />
• Give information<br />
• Provide facilities<br />
• Provide viable alternatives<br />
• Educate/train/provide skills<br />
• Provide capacity<br />
Enable<br />
• Tax system<br />
• Expenditure – grants<br />
• Reward schemes<br />
• Recognition/<br />
social pressure –<br />
league tables<br />
• Penalties, fines and<br />
enforcement action<br />
Encourage<br />
Catalyse<br />
Is the package enough to<br />
break a habit and kick<br />
start change?<br />
Engage<br />
• Community action<br />
• Co-production<br />
• Deliberative fora<br />
• Personal contacts/<br />
enthusiasts<br />
• Media campaigns/<br />
opinion formers<br />
• Use Networks<br />
Exemplify<br />
• Leading by example<br />
• Achieving consistency<br />
in policies
Stimulating action by individuals<br />
119<br />
As set out in the Public Sector chapter:<br />
• The Government will use its own<br />
purchasing power to lead by example and<br />
has set itself a challenge of being an EU<br />
leader in sustainable public procurement<br />
by 2009.<br />
• In Summer <strong>2006</strong>, the Government will<br />
introduce new strategic targets for the<br />
central government estate.<br />
Enable – make it easy to behave<br />
differently<br />
8. This is the starting point. We know that providing<br />
individuals and communities with information is<br />
not sufficient to enable behaviour change. We<br />
need to help people make responsible choices by<br />
providing them with accessible alternatives and<br />
suitable infrastructure, and supporting them with<br />
the necessary skills and information.<br />
• As part of its Market Transformation<br />
<strong>Programme</strong>, the Government will identify<br />
potential eco-design standards for<br />
important products in households and<br />
non-households sectors.<br />
• The Government will explore the role of<br />
industry voluntary agreements such as<br />
the Code of Conduct on Digital TV<br />
services, procurement policy and <strong>UK</strong>-Led<br />
International Task Force on Sustainable<br />
Products which will encourage<br />
international benchmarking.<br />
• Budget <strong>2006</strong> announced a new initiative,<br />
in partnership with major retailers and<br />
the Energy Saving Trust, to introduce<br />
voluntary schemes in the retail sector<br />
which encourage the purchase of more<br />
energy efficient alternatives in consumer<br />
electronics.<br />
• The Government will continue to support<br />
colour-coded efficiency labels for products<br />
to help consumers make sustainable<br />
choices.<br />
• Providing better information and<br />
feedback on energy consumption through<br />
better billing and metering will also help<br />
individuals become more responsible in<br />
the way they use energy. The<br />
Government will work with Ofgem to<br />
explore these benefits and the potential<br />
for introducing smart metering in the <strong>UK</strong>.<br />
• Making sustainable choices when<br />
travelling is equally important. The<br />
Government will therefore explore the<br />
role of “smarter choices” to help curb<br />
emissions.<br />
• <strong>Defra</strong> is providing up to £4m over three<br />
years to roll out a new package of<br />
measures to help thousands of<br />
community groups across England to take<br />
action on sustainable development,<br />
including climate change. ‘Every action<br />
counts’ will provide new tools,<br />
information and support to community<br />
groups in taking small simple actions on<br />
energy, waste and water which add up to<br />
make a big difference nationwide. This<br />
initiative will also support over 20<br />
national voluntary and community sector<br />
organisations to develop and implement<br />
their own sustainable development<br />
action plan, which will include the<br />
contribution these bodies can make to<br />
tackling climate change and energy<br />
efficiency. This initiative will be launched<br />
later in <strong>2006</strong>.
120<br />
Stimulating action by individuals<br />
Engage – get people involved<br />
Encourage – give the right signals<br />
9. Research 2 shows that information in isolation is<br />
rarely enough to change people’s behaviour, but<br />
it has a very important role in underpinning and<br />
increasing the effectiveness of other Government<br />
actions. Information provision usually works best<br />
if some of the people the Government is seeking<br />
to influence are involved at a local level in<br />
developing the communication materials and<br />
selecting the media used. Such an approach<br />
also helps identify and encourage community<br />
champions and leaders and their networks to<br />
be involved.<br />
10. As set out in the Public Sector chapter the<br />
Government will:<br />
• provide local authorities with additional<br />
guidance on how to stimulate action on<br />
climate change at local level; and<br />
• introduce a revolving fund of £20m over<br />
the next two years to support public<br />
sector organisations in implementing<br />
energy efficiency measures.<br />
11. Businesses in the agriculture and land<br />
management sector face particular challenges<br />
from a changing climate, and awareness of the<br />
impacts of climate change in this sector needs<br />
improving. The Rural <strong>Climate</strong> <strong>Change</strong> Forum has<br />
made a strong contribution to getting key<br />
messages to farmers, but further effort is<br />
required.<br />
• The Government will put in place an<br />
agriculture sector communications<br />
strategy as part of the wider <strong>Climate</strong><br />
<strong>Change</strong> Communications Initiative.<br />
12. The Government must use the most efficient and<br />
effective techniques to reward, encourage and<br />
where necessary, enforce, the desired behaviour<br />
change. The Government already supports<br />
consumers through the work of the Energy<br />
Saving Trust (EST) 3 and other organisations such<br />
as the Low Carbon Vehicle Partnership.<br />
• As set out in the Domestic chapter, the<br />
Government has announced £20m over<br />
the next two years for a programme to<br />
strengthen consumer demand for energy<br />
efficiency, working closely with energy<br />
suppliers, local authorities and others.<br />
13. EST’s activities are designed to underpin and<br />
complement the work of other actors in energy<br />
efficiency markets. In particular it seeks to work<br />
with key Government policy drivers for household<br />
energy efficiency – EEC, Warm Front, Decent<br />
Homes and Building Regulations. Its principal<br />
activities are aimed at increasing demand for<br />
energy efficiency by raising awareness, providing<br />
advice and support for action to consumers, local<br />
authorities, schools, communities, vehicle<br />
manufacturers and technology developers. It also<br />
supports the supply of energy efficiency products<br />
and services to meet this demand by developing<br />
partnerships, stimulating innovation, supporting<br />
training and providing accreditation. The Energy<br />
Saving Trust also runs the Energy Efficiency Advice<br />
Centres in England, Scotland, Wales and Ireland.<br />
14. More generally, the Government is supporting<br />
behaviour change, and our understanding of what<br />
drives change, through the Environmental Action<br />
Fund. This Fund, worth £6.75m in its current three<br />
year round, is supporting 35 projects in England<br />
that are designed to promote more sustainable<br />
consumption and production, covering lifestyle<br />
areas such as homes, food and transport.<br />
2 Motivating Sustainable Consumption - a review of evidence on consumer behaviour and behavioural change:<br />
www.sd-research.org.uk/documents/MotivatingSCfinal.pdf, Tim Jackson, 2005 .<br />
The impact of sustainable development on public behaviour Andrew Darnton, for <strong>Defra</strong>, March 2004:<br />
www.sustainable-development.gov.uk/taking-it-on/pdf/desk-research1.pdf<br />
Driving public behaviours for sustainable lifestyles, Andrew Darnton, for <strong>Defra</strong>, May 2004:<br />
www.sustainable-development.gov.uk/taking-it-on/pdf/desk-research2.pdf<br />
Personal Responsibility and Changing Behaviour: the state of knowledge and its implications for public policy, Prime Minister Strategy Unit, February 2004:<br />
www.number10.gov.uk/files/pdf/pr.pdf<br />
Carrots, sticks and sermons: influencing public behaviour for environmental goals Demos and the Green Alliance, for <strong>Defra</strong>, December 2004:<br />
www.green-alliance.org.uk/publications/PubCarrotsSticksSermons<br />
3 Further information can be found on the Trust’s website.
Stimulating action by individuals<br />
121<br />
Experience from these projects will be fed back into<br />
the Government’s climate change and sustainable<br />
consumption and production programmes.<br />
Catalyse – breaking habits<br />
15. The ultimate test for the <strong>Climate</strong> <strong>Change</strong><br />
<strong>Programme</strong> is how all of our individual policy<br />
initiatives on climate change come together as a<br />
package to collectively deliver the changes in<br />
behaviour needed – across business, voluntary<br />
organisations, Government at all levels,<br />
communities, families and individual consumers.<br />
• As part of the monitoring process of the<br />
<strong>Programme</strong>, we will set up a Stakeholder<br />
group to oversee the practical delivery of<br />
the new measures.<br />
• The Government will set out a plan for<br />
further action on sustainable consumption<br />
by the end of <strong>2006</strong>, responding to the<br />
report of the Round Table on Sustainable<br />
Consumption due in Spring <strong>2006</strong>.<br />
Educating the public<br />
16. The public need clear and reliable advice about<br />
the environmental impact of different products<br />
and services and how they can make the most<br />
sustainable consumption choices. The<br />
Government believes the best way of making this<br />
available is through the internet, and is planning<br />
a new online information service (working title:<br />
Environment Direct). This will aim to enhance<br />
consumers’ image of sustainable living so that<br />
it is perceived as attractive and desirable rather<br />
than about compromising quality of life. The<br />
Government aims to launch the new service by<br />
the end of <strong>2006</strong>.<br />
<strong>Climate</strong> <strong>Change</strong> Communications<br />
Initiative<br />
17. Engaging with the public on climate change is a<br />
vital part of the <strong>UK</strong> climate change programme,<br />
both to encourage specific behaviours to reduce<br />
carbon dioxide emissions directly and to gain<br />
acceptance for more ambitious Government<br />
policy. In December 2005 <strong>Defra</strong> launched the<br />
first elements of a new <strong>Climate</strong> <strong>Change</strong><br />
Communications Initiative, with funding of<br />
£12m announced earlier in the year.<br />
18. The <strong>Climate</strong> <strong>Change</strong> Communications Initiative 4<br />
aims to change attitudes toward climate change<br />
within the general public, with a central focus on<br />
local and regional level engagement. The initiative<br />
will address different themes as it unfolds. Its<br />
initial focus is on making climate change a ‘here<br />
and now’ and ‘front of mind’ issue, with the<br />
emphasis moving over time towards collective<br />
action and the social status of the attitudes and<br />
behaviours associated with climate change.<br />
19. The research supporting the communications<br />
strategy shows that changing attitudes is an<br />
essential first step to voluntary behaviour change,<br />
so the communications strategy is intended to<br />
shift attitudes such that individual behaviour<br />
change as well as further government-led action<br />
to tackle climate change can be achieved at a<br />
later stage.<br />
20. The <strong>Climate</strong> <strong>Change</strong> Communication Initiative<br />
includes:<br />
• a linking device or slogan “Tomorrow’s<br />
climate, today’s challenge” to give a visual<br />
identity to the whole initiative and, where<br />
used on other climate change-related<br />
material, to show central government, its<br />
partners and others working together;<br />
• a medium-long term aspirational goal<br />
“Together this generation will tackle<br />
climate change” to provide a clear, publicly<br />
accessible focus for all of our climate-related<br />
communications;<br />
• a £6m fund for local communication<br />
initiatives in England, which was opened in<br />
January <strong>2006</strong>;<br />
• an interactive and user-friendly climate change<br />
website: www.climatechallenge.gov.uk;<br />
4 Further details on the initiative and all of the resources are available from the website: www.climatechallenge.gov.uk/
122<br />
Stimulating action by individuals<br />
• guidance for communicators with ideas on<br />
how to communicate about climate change,<br />
together with free-to-use resources such as a<br />
short film and radio advertisements; and<br />
• in January <strong>2006</strong>, the Government launched<br />
an England-wide “climate change<br />
champions” competition to find young<br />
ambassadors for climate change in the 10-18<br />
year age range. The aim of the competition is<br />
to raise the profile of climate change among<br />
a critical and hard-to-reach audience.<br />
How individuals can help<br />
21. The <strong>UK</strong>’s overall carbon emissions could be<br />
reduced substantially by everyone making a<br />
few small changes. An action which seems<br />
insignificant on its own can combine with other<br />
actions to create a significant overall impact.<br />
These small changes can also save money.<br />
Some simple ideas are set out below.<br />
At home<br />
Households are responsible for around 30 per cent of total <strong>UK</strong> energy use, equivalent to around 40MtC.<br />
A combination of individual actions in the home can make a real contribution to reducing the <strong>UK</strong>’s<br />
emissions. They can make substantial cuts to utility bills, too.<br />
Some ideas (main source – Energy Saving Trust):<br />
Turn your thermostat down by 1°C. This could cut heating bills by up to 10 per cent. If every household did<br />
this, the savings would be equivalent to the energy consumed by all the schools, colleges and universities in<br />
the <strong>UK</strong>.<br />
Close your curtains at dusk to stop heat escaping through the windows and reduce draughts.<br />
Don’t leave appliances on standby. Every year, video recorders and televisions in the <strong>UK</strong> consume around<br />
£150m worth of electricity while on standby.<br />
Only boil as much water as you need (but remember to cover the elements if you’re using an electric<br />
kettle). If everyone did this, we could save enough electricity to run more than three quarters of the street<br />
lighting in the country.<br />
Eliminate draughts and wasted heat. Install a cheap, easy-to-fix brush or PVC seal on your exterior doors,<br />
and cover letterboxes and keyholes. Fill gaps in floorboards and skirting boards with newspaper, beading or<br />
sealant.<br />
Install energy saving light bulbs. They last up to 15 times longer than conventional bulbs and for each bulb<br />
you fit, you could save up to £7 on your annual electricity bill.<br />
Look for the logo. When replacing appliances, look for ones displaying the energy saving recommended<br />
logo. Energy saving appliances use less energy and could save you up to £35 a year.
Stimulating action by individuals<br />
123<br />
Transport<br />
A lot of individual journeys could be eliminated or made in a different way to reduce carbon emissions.<br />
Changing travel habits can also have health and financial benefits.<br />
For instance:<br />
Go by train. The average person travelling by rail produces around half the carbon dioxide emissions of the<br />
average person travelling by car. 5<br />
Teleconference. DfT research on smarter choices shows that the use of tele- and audio-conferencing and<br />
teleworking can be a powerful tool to help cut staff travel and therefore carbon emissions.<br />
Think sustainably. Where travel is necessary, the impact on carbon emissions can be reduced by taking<br />
certain choices, for example car sharing. Government is encouraging businesses and schools to work with<br />
employees and pupils to develop travel plans which enable individuals to make sustainable travel choices.<br />
Improve your technique. It is estimated that eco-driving techniques can help deliver significant reductions<br />
in carbon emissions from cars – and bring down fuel bills. Such techniques include maintaining appropriate<br />
tyre pressure, minimising weight, removing roof racks when not in use (minimising weight and drag),<br />
avoiding sharp braking and accelerating, using the correct gear and only using air conditioning when really<br />
necessary. Some of these measures, such as looking ahead to avoid sudden braking, can also have positive<br />
road safety benefits.<br />
Look for the logo. When purchasing a new car, look for the new fuel efficiency label that shows how much<br />
money you could save a year by choosing lower carbon models.<br />
5 Average emission factors are calculated using 2002 National Atmospheric Emissions Inventory CO 2<br />
emissions estimates by mode/vehicle type and data on<br />
passenger kilometres and load factors from DfT Transport Statistics
124<br />
CHAPTER TEN<br />
Bringing it all together<br />
Summary of proposed action<br />
1. Chapter 1 of this Section summarises the<br />
Government’s latest projections for emissions of<br />
carbon dioxide and other greenhouse gases in<br />
2010, 2015 and 2020. These projections reflect<br />
the ongoing impact of policies introduced since<br />
the <strong>Climate</strong> <strong>Change</strong> <strong>Programme</strong> 2000.<br />
2. The baseline with measures emissions projections<br />
show that in 2010:<br />
• emissions of the six greenhouse gas basket<br />
would be reduced to around 19.4 per cent<br />
below base year levels. This means that the<br />
<strong>UK</strong> is on track to exceed its Kyoto Protocol<br />
target; and<br />
• emissions of carbon dioxide would be reduced<br />
to around 10.6 per cent below 1990 levels<br />
with existing measures.<br />
3. Section 2 of this programme sets out the action<br />
Government is taking to reduce emissions from<br />
all sectors. This includes policies the Government<br />
is introducing which will be additional to those<br />
reflected in the emission projections. The table<br />
below sets out the carbon savings that we are<br />
expecting existing measures to deliver by 2010.<br />
The table overleaf sets out the carbon savings<br />
that we are expecting from the new measures<br />
contained in this programme, which the<br />
Government estimates could lead to additional<br />
carbon savings of some 7.0 – 12.0 MtC in 2010.<br />
Existing measures<br />
Energy supply<br />
Renewables Obligation 2.5<br />
Business<br />
<strong>Climate</strong> change levy 1 3.7<br />
<strong>UK</strong> emissions trading scheme 0.3<br />
Carbon Trust 1.1<br />
Building Regulations 2002 0.4<br />
Building Regulations 2005 0.2<br />
<strong>Climate</strong> change agreements 2.9<br />
Transport<br />
Voluntary Agreements package, including reform of company car taxation<br />
and graduated VED 2.3<br />
Wider transport measures 2 0.8<br />
Sustainable distribution in Scotland and Wales 0.1<br />
Fuel duty escalator 1.9<br />
Domestic<br />
Energy Efficiency Commitment (EEC) (2002-05) 0.4<br />
Energy Efficiency Commitment (EEC) (2005-08) 0.6<br />
Energy Efficiency Commitment (EEC) (2008-11) 0.6<br />
Building Regulations 2002 0.7<br />
Building Regulations <strong>2006</strong> including 2005 condensing boilers update 0.8<br />
Warm Front and fuel poverty programmes 0.4<br />
Market Transformation including appliance standards and labelling 0.2<br />
Agriculture<br />
Woodlands Grants Scheme (England) 0.2<br />
Woodland planting since 1990 (Scotland) 0.5<br />
Public Sector<br />
Central Government, NHS, <strong>UK</strong> universities and English schools including<br />
Carbon Trust activities 0.2<br />
TOTAL 17.1 3<br />
Carbon savings in 2010 (MtC)<br />
1 An independent evaluation by Cambridge Econometrics (CE) concluded that CCL would deliver annual carbon savings of 3.7MtC by 2010, from an<br />
announcement effect and price effect of the levy. This figure assumes CCL rates are increased in line with inflation from 2005 to 2010. The impact of CCL in<br />
the projections is incorporated through the price elasticity of demand for different fuels (‘the price effect’), and there is no separately identified announcement<br />
effect within the UEP baseline.<br />
2 As set out in ‘Transport 2010: The 10 Year Plan for Transport’ and built upon in ‘The Future of Transport: A network for 2030’.<br />
3 Total does not include cabon savings from climate change levy, and may differ slightly from figures for total carbon savings shown in Chapters 3 to 8 due to<br />
rounding.
Bringing it all together<br />
125<br />
Additional measures<br />
Energy supply<br />
Subsidy for biomass heat 0.1<br />
Second phase of EU emissions trading scheme 3.0-8.0<br />
Business<br />
Carbon Trust support for investment in energy efficiency in SMEs 0.1<br />
Measures to encourage or assist SMEs to take up energy saving opportunities 0.1<br />
Transport<br />
Renewable Transport Fuel Obligation (RTFO) 1.6<br />
Future voluntary agreement with car manufacturers to reduce CO 2<br />
emissions<br />
from new cars 0.1<br />
Domestic<br />
Increased activity in Energy Efficiency Commitment (EEC) (2008-11) 0.5<br />
Provision of advice to stimulate early replacement of inefficient boilers and<br />
implementation of the Energy Performance of Buildings Directive 0.2<br />
Package of measures to improve energy efficiency in buildings 0.1<br />
Better billing and metering 0.2<br />
Products Policy: consumer information and standards for lights and other<br />
energy-using products (EUPs) 0.2<br />
Agriculture<br />
Strategy for non-food crops 0.1<br />
Public Sector<br />
Additional effort by local authorities 0.2<br />
Revolving loan fund for the public sector 0.1<br />
Actions by devolved administrations 0.3<br />
Other measures 1 0.1<br />
TOTAL 7.0 – 12.0<br />
Carbon savings in 2010 (MtC)<br />
1 These include the Green Landlord Scheme, increased funding for Warm Front, an Energy Report in the Home Condition Report, improved enforcement of<br />
Building Regulations, enhanced capital allowances for cleanest biofuels processing plants, reduced VAT for wood fuelled plants, funding for demonstration<br />
of Carbon Abatement Technologies and for the Low Carbon Building <strong>Programme</strong>. These policies together could deliver carbon savings of about 0.1MtC in 2010.<br />
4. This <strong>Programme</strong> of action will take the <strong>UK</strong> well<br />
beyond its international target and move us close<br />
to the 2010 domestic carbon dioxide goal.<br />
The Government estimates that by 2010 the<br />
<strong>Programme</strong> could:<br />
• reduce the <strong>UK</strong>’s emissions of the basket of<br />
greenhouse gases on which the Kyoto target<br />
is based to 23 – 25 per cent below base year<br />
levels; and<br />
• reduce the <strong>UK</strong>’s carbon dioxide emissions to<br />
15 – 18 per cent below 1990 levels.<br />
5. The graph below shows the predicted effect in<br />
2010 of the <strong>Programme</strong> on the <strong>UK</strong>’s greenhouse<br />
gas emissions. The effects have been estimated<br />
for 2010, 2015 and 2020 only and emissions are<br />
assume to fall linearly between 2005 and 2010<br />
between 2010 and 2015, and between 2015<br />
and 2020.<br />
Projections of greenhouse gas emissions and estimated effect of<br />
quantified additional measures, MtC<br />
MtC<br />
220<br />
210<br />
200<br />
190<br />
180<br />
170<br />
160<br />
150<br />
1990 1995 2000 2005 2010 2015 2020<br />
Historical trend<br />
Baseline with measures projections<br />
Additional quantified measures<br />
(including low range for EU ETS)<br />
Additional quantified measures<br />
(including high range for EU ETS)
126<br />
CHAPTER ELEVEN<br />
Monitoring and review<br />
Tracking progress<br />
1. The <strong>UK</strong> reports on its greenhouse gas and<br />
specifically carbon dioxide emissions through a<br />
number of mechanisms at international, EU and<br />
domestic level.<br />
International<br />
2. Progress towards achieving <strong>UK</strong> and international<br />
climate change objectives is monitored through<br />
the <strong>UK</strong>’s greenhouse gas inventory. The<br />
Government submits the inventory annually to<br />
the UNFCCC and to the EU Monitoring<br />
Mechanism. In addition, the <strong>UK</strong> is required to<br />
submit to the UNFCCC at regular intervals<br />
national communications that report on action<br />
being taken to tackle climate change. The <strong>UK</strong> will<br />
submit its 4th National Communication (4NC)<br />
in April <strong>2006</strong>.<br />
EU<br />
3. Information on Member States’ projections must<br />
be reported to the European Commission on a<br />
biannual basis, by 15 June, with the next report<br />
due in 2007. The previous year’s results on the<br />
EU emissions trading scheme will be published<br />
in the first half of each year, and will set out<br />
what this means for progress towards our Kyoto<br />
target and domestic carbon dioxide goal.<br />
Domestic<br />
4. Updates on PSA delivery plans (including<br />
departmental PSAs relating to climate change) are<br />
submitted biannually to HM Treasury, and<br />
monitoring notes to departmental management<br />
boards quarterly.<br />
5. There are a number of different sets of<br />
indicators which already record progress on<br />
greenhouse gas emissions and in other relevant<br />
areas. These include sustainable development<br />
indicators, reported on annually by <strong>Defra</strong>, and<br />
energy sector indicators, reported on by DTI. DTI<br />
also publishes provisional estimates of carbon<br />
dioxide emissions every March.<br />
6. Progress on emission reductions is monitored<br />
through the Sustainable Energy Policy<br />
Network (SEPN), which operates through a<br />
Ministerial Committee, an Advisory Board,<br />
Strategy Group, working-level group and<br />
Interdepartmental Analysts’ Group (IAG). The IAG<br />
provides cross-cutting analytical support to SEPN<br />
including: reviewing analytical requirements<br />
feeding into the workstreams; advising on<br />
potential gaps; identifying cross-cutting<br />
requirements and drawing links between<br />
analytical work conducted in support of<br />
workstreams; and providing a measure of<br />
peer review.<br />
7. Two Cabinet Committees have climate change<br />
as part of their business:<br />
• the Cabinet Committee on Energy and the<br />
Environment (EE) has a remit to “develop<br />
the Government's energy and environmental<br />
policies, to monitor the impact on sustainable<br />
development of the Government's policies,<br />
and to consider issues of climate change,<br />
security of supply and affordability of energy”;<br />
and<br />
• the Cabinet Committee on Sustainable<br />
Development in Government (EE(SD))<br />
has a remit to “improve the Government's<br />
contribution to sustainable development<br />
through the conduct of its business, including<br />
through consideration of departmental<br />
sustainable development action plans; and to<br />
report as necessary to the Committee on<br />
Energy and the Environment.”<br />
8. In addition to these existing processes, the<br />
Government will introduce a new annual report<br />
to Parliament on the level of greenhouse gas<br />
emissions in the <strong>UK</strong> and the steps the<br />
Government has been taking to reduce these.<br />
The report will include data from the existing<br />
sets described above, as well as any additional<br />
information needed for it to provide<br />
comprehensive coverage. It will also set out an<br />
indicative work plan for the following year, the<br />
basis for which will be announced in due course.
Monitoring and review<br />
127<br />
Carbon budget<br />
9. One of the proposals made in response to the<br />
2004 consultation was for the introduction of an<br />
annual carbon budget to manage progress<br />
towards our domestic goal. This would mean that<br />
within a national carbon account, carbon would<br />
be given a market value and our position relative<br />
to our targets calculated in monetary terms. The<br />
Government will consider this proposal. However,<br />
at present the primary mechanism for monitoring<br />
progress towards our targets will be through the<br />
annual report and the other reporting<br />
requirements as listed above. The carbon budget<br />
proposal merits serious study and will therefore<br />
be considered by the Stern Review, with analysis<br />
informing the Energy Review.
SECTION<br />
3<br />
Adapting to the impacts of climate change
130<br />
CHAPTER ONE<br />
Adaptation<br />
The Government will take action to:<br />
• develop a comprehensive and robust<br />
approach to adaptation in the <strong>UK</strong> through<br />
the Adaptation Policy Framework (APF);<br />
• publish revised and expanded climate<br />
change scenarios for the <strong>UK</strong> in 2008; and<br />
• monitor and develop the knowledge base<br />
on climate change impacts and adaptation<br />
through the <strong>UK</strong>CIP.<br />
4. A great deal has happened in the field of climate<br />
impacts and adaptation since 2000, both<br />
internationally with the publication in 2001 of<br />
the IPCC’s Third Assessment Report and work by<br />
the UNFCCC to support adaptation in both<br />
developed and developing countries, and<br />
domestically, with the publication of climate<br />
change scenarios for the <strong>UK</strong> in 2002 and the<br />
development of widely adopted tools,<br />
methodologies and research by the <strong>UK</strong> <strong>Climate</strong><br />
Impacts <strong>Programme</strong> and other centres. The<br />
Government has played a key role in each of<br />
these arenas and will continue to do so.<br />
Introduction<br />
Impacts of climate change in the <strong>UK</strong><br />
1. Some degree of climate change resulting from<br />
past and present emissions of greenhouse gases<br />
is already inevitable. In order to cope with the<br />
impacts of climate change we need to adapt –<br />
this action is complementary to our efforts to<br />
reduce emissions to avoid dangerous levels of<br />
climate change.<br />
2. Adaptation can mean any action, either<br />
intentional or accidental, taken to minimise the<br />
adverse effects of climate change or to take<br />
advantage of any beneficial effects. Adaptation<br />
strategies vary considerably between different<br />
types of organisation, and will be undertaken at a<br />
range of scales, from central government policy<br />
to modest individual projects. There are two main<br />
approaches to adaptation:<br />
• building adaptive capacity. This involves<br />
creating the information and conditions<br />
(regulatory, institutional, managerial) that<br />
enable adaptation actions to be undertaken;<br />
and<br />
• delivering adaptation actions. This involves<br />
taking actions that will help to reduce<br />
vulnerability to climate risks, or exploit<br />
opportunities.<br />
3. Anticipatory adaptation (as opposed to reactive<br />
adaptation) is important for the protection or<br />
maintenance of existing and future capital assets<br />
with long life spans.<br />
5. Chapter 1 set out the way in which the <strong>UK</strong>’s<br />
climate has changed in the past, and is predicted<br />
to change further in the future. These changes in<br />
climate are likely to have far-reaching effects on<br />
our environment, economy and society in all<br />
regions and in some cases these are already being<br />
felt. Without effective action to tackle the causes<br />
of climate change, climate-related risks and<br />
damages will increase. Adaptation needs to be<br />
planned accordingly, and this section sets out the<br />
framework through which this will occur.<br />
6. In the <strong>UK</strong>, although climate change may bring<br />
opportunities and benefits as well as threats,<br />
we note that the larger the changes and rate of<br />
change in climate, the more the adverse effects<br />
will predominate.<br />
7. Some of the most widely-expected adverse<br />
impacts in the <strong>UK</strong> include:<br />
• an increased risk of flooding and coastal<br />
erosion;<br />
• increased pressure on drainage systems;<br />
• possible increased winter storm damage;<br />
• habitat and species loss;<br />
• summer water shortages and low stream<br />
flows;
Adaptation<br />
131<br />
• increased subsidence risk in subsidence-prone<br />
areas;<br />
• increasing thermal discomfort in buildings;<br />
and<br />
• health issues in summer.<br />
8. The greater the change in climate the more<br />
serious the effects will be. However some<br />
opportunities and benefits have also been<br />
identified, for example:<br />
• longer growing seasons;<br />
• less winter transport disruption;<br />
• reduced demand for winter heating; and<br />
• less cold-related illness.<br />
Some opportunities are anticipated, including:<br />
• agricultural diversification;<br />
• an increase in tourism and leisure pursuits;<br />
and<br />
• a shift to more outdoor-oriented lifestyles.<br />
9. The balance between these impacts will, to a<br />
large extent, depend on what approach is taken<br />
to adaptation. These impacts will also vary from<br />
region to region in the <strong>UK</strong>. However overall we<br />
expect that the adverse effects will outweigh the<br />
benefits particularly as climate change increases.<br />
10. The economic consequences of some of these<br />
climate changes may also be beginning to be felt.<br />
For example, damage related to the heat-wave in<br />
2003 left insurers with almost £400 million in<br />
subsidence claims in the <strong>UK</strong>. Claims for storm<br />
and flood damages in the <strong>UK</strong> totalled more than<br />
£6 billion over 1998-2003, which was twice the<br />
amount for the previous six-year period 1 .<br />
International commitments and<br />
programmes<br />
11. Under the United Nations Framework Convention<br />
on <strong>Climate</strong> <strong>Change</strong> (UNFCCC), the <strong>UK</strong> not only<br />
has a commitment to mitigate emissions, but also<br />
to make progress in adaptation.<br />
12. Article 4 (1(b)) states that all Parties to the<br />
Convention shall: “Formulate, implement,<br />
publish and regularly update national and where<br />
appropriate, regional programmes containing<br />
measures to mitigate climate change by<br />
addressing anthropogenic emissions by sources<br />
and removals by sinks of all greenhouse gases<br />
not controlled by the Montreal Protocol, and<br />
measures to facilitate adequate adaptation to<br />
climate change.”<br />
13. Article 4 (1(f)) goes on to state that Parties shall:<br />
“Take climate change considerations into<br />
account, to the extent feasible, in their relevant<br />
social, economic and environmental policies and<br />
actions, and employ appropriate methods, for<br />
example, impacts assessments, formulated and<br />
determined nationally, with a view to minimising<br />
adverse effects on the economy, on public health<br />
and on the quality of the environment, of<br />
projects undertaken by them to mitigate or adapt<br />
to climate change.”<br />
14. In December 2004, Parties to the UNFCCC<br />
agreed to develop a structured five-year<br />
programme of work on the scientific, technical<br />
and socio-economic aspects of impacts,<br />
vulnerability and adaptation to climate change.<br />
At Montreal in December 2005, agreement was<br />
reached on the framework and initial actions for<br />
this programme of work, and activities will begin<br />
during <strong>2006</strong>.<br />
15. The IPCC is currently working towards its Fourth<br />
Assessment Report and the Working Group 2<br />
report on Impacts and Adaptation will give<br />
particular emphasis to regional impacts and<br />
adaptation.<br />
16. In November 2005, the European Commission<br />
launched a consultation on the development<br />
1 A changing climate for insurance, June 2004, Association of British Insurers.
132<br />
Adaptation<br />
of the second European <strong>Climate</strong> <strong>Change</strong><br />
<strong>Programme</strong>, which includes a work stream on<br />
adaptation. The Commission are working towards<br />
the production of a green paper on adaptation at<br />
the end of <strong>2006</strong>, and the <strong>UK</strong> will contribute to<br />
this process.<br />
Domestic commitments and<br />
programmes<br />
Adapting to <strong>Climate</strong> <strong>Change</strong> in the United<br />
Kingdom – the Adaptation Policy<br />
Framework (APF)<br />
17. Although the more excessive regional<br />
temperature increases and precipitation changes<br />
may only be felt in a few decades time, they<br />
need to be factored into decisions on investment<br />
and infrastructure taken now. There are already a<br />
range of adaptation activities taking place within<br />
different sectors, including planning guidance,<br />
health advice and water resource management,<br />
and across different agencies and regions. In<br />
order to develop a full picture of adaptation in<br />
the <strong>UK</strong> we need to review such activities and<br />
assess how far current efforts are contributing to<br />
successful adaptation to climate change and to<br />
identify what more needs to be done.<br />
18. For this reason, the Government is developing a<br />
climate change Adaptation Policy Framework,<br />
which will set out the appropriate responsibilities<br />
and activities across a range of organisations in a<br />
sector by sector approach. A consultation exercise<br />
was completed in January <strong>2006</strong> 2 . This work<br />
contributes to the strategic outcome in <strong>Defra</strong>’s<br />
Five Year Strategy, published in 2004 3 under its<br />
climate change and energy strategic priority on<br />
the “<strong>UK</strong> successfully adapting to unavoidable<br />
climate change.<br />
19. The 5-year strategy included development of an<br />
Adaptation Policy Framework which is described<br />
below. For <strong>Defra</strong>, an emphasis was placed on<br />
promoting research into climate change impacts<br />
on agriculture, maintaining its substantial flood<br />
and coastal erosion risk management programme,<br />
with greater targeting of spending to reduce the<br />
risks associated with climate change.<br />
20. The Framework aims to provide a consistent<br />
approach to building adaptation into policies, and<br />
a coherent way to identify cross-cutting risks and<br />
opportunities and to assist in prioritisation of<br />
action across Government. Co-ordination of work<br />
within and across Government Departments and<br />
the devolved administrations will provide<br />
leadership to stakeholders.<br />
21. The development of objectives, targets and<br />
measures of progress in each area of the<br />
framework is the responsibility of the relevant<br />
Government Departments and the devolved<br />
administrations, along with other key players.<br />
However, work on adaptation is the responsibility<br />
of a wider range of stakeholders. While the<br />
evidence base and the framework for a response<br />
can be provided by Government, adaptation is<br />
the responsibility of all and brings benefits to<br />
those organisations and individuals who adapt<br />
appropriately.<br />
22. The Adaptation Policy Framework will provide the<br />
structure in which adaptation strategies can be<br />
integrated into policies developed by<br />
organisations at every level of decision making.<br />
Not only will the APF set out a rational structure<br />
for different roles and activities in adaptation<br />
(including at regional and local level), it will also<br />
be a primary information source for those<br />
involved in policy development and provide an<br />
indication of priorities for the private sector.<br />
23. This first stage aims to capture the national<br />
picture of climate change adaptation as it<br />
currently stands across the <strong>UK</strong>. It will focus on<br />
priority sectors where climate change will have a<br />
significant impact, or where considerable<br />
co-ordination between Departments or with<br />
other bodies will be needed to make progress on<br />
adaptation. During stage 2, commencing in<br />
<strong>2006</strong>, there will be an analysis of activities taking<br />
place and an assessment made of the reasons<br />
why some sectors are adapting more successfully<br />
than others. Stage 3 (2008) will identify those<br />
areas where adaptation is not occurring and what<br />
incentives and assistance may be required to<br />
ensure that it is considered appropriately in future<br />
planning and development.<br />
2 www.defra.gov.uk/environment/climatechange/uk/adapt/policyframe.htm<br />
3 Delivering the Essentials of Life: <strong>Defra</strong>’s Five Year Strategy, <strong>Defra</strong>, 2004. Available from www.defra.gov.uk
Adaptation<br />
133<br />
We will analyse stakeholder responses to the<br />
public consultation and will publish the first<br />
phase of the adaptation policy framework<br />
during <strong>2006</strong>.<br />
We will launch the second phase of<br />
consultation during 2007 and a third phase<br />
in 2008 to complete the APF work.<br />
We will develop a process for reviewing and<br />
assessing existing and new policies for their<br />
vulnerability to climate change impacts and<br />
their contribution to adaptation.<br />
We will initiate a study of the potential role<br />
of regulation and standards in accelerating<br />
action to adapt to inform future<br />
development of the APF.<br />
<strong>UK</strong> <strong>Climate</strong> Impacts <strong>Programme</strong><br />
24. The <strong>UK</strong> Government set up the <strong>UK</strong> <strong>Climate</strong><br />
Impacts <strong>Programme</strong> (<strong>UK</strong>CIP) in 1997 to provide<br />
essential information to help decision-makers<br />
plan their response to the impacts of climate<br />
change. <strong>Defra</strong> funds <strong>UK</strong>CIP on behalf of the <strong>UK</strong><br />
government and the devolved administrations.<br />
From an initial focus on impacts research studies,<br />
there has been a progression towards developing<br />
stakeholder partnerships that share information,<br />
identify research needs and pursue work on<br />
climate impacts and adaptation in their regions<br />
and sectors.<br />
<strong>UK</strong>CIP is modular in structure, with individual<br />
studies funded by stakeholder partnerships in two<br />
main categories:<br />
• regional studies that consider multiple sectors<br />
within a given region and deliver information<br />
that is relevant to local decision-making; and<br />
role in helping stakeholders to build adaptive<br />
capacity.<br />
25. An integrated summary of findings from studies<br />
carried out for the <strong>UK</strong> <strong>Climate</strong> Impacts<br />
<strong>Programme</strong> was published in 2005 4 .<br />
26. The <strong>UK</strong>CIP Office team helps others to<br />
commission and fund research and actively<br />
supports all studies and partnerships. The <strong>UK</strong>CIP<br />
has provided numerous tools to equip<br />
stakeholders to develop their own adaptation<br />
responses. All the tools and reports are available<br />
from the <strong>UK</strong>CIP website.<br />
Risk, uncertainty and decision-making<br />
framework<br />
27. The <strong>UK</strong>CIP report <strong>Climate</strong> adaptation: Risk,<br />
uncertainty and decision-making (Willows and<br />
Connell, 2003) was developed in co-operation<br />
with the Environment Agency. It provides an<br />
eight-stage decision-making framework with<br />
accompanying guidance to help assess climate<br />
risks and uncertainties and incorporate suitable<br />
adaptation measures into a decision. For each<br />
stage of the framework, there are questions to<br />
answer, and recommended tools to help.<br />
The framework:<br />
• directs decision-makers to undertake rapid risk<br />
characterisation and screening exercises, before<br />
moving on to more detailed assessments;<br />
• helps refine the problem and objectives and<br />
modify adaptation options, before making a<br />
decision; and<br />
• guides the decision-maker to review the<br />
decision, for instance to see if it delivered the<br />
expected benefits.<br />
• sectoral studies that are typically undertaken<br />
at the national level, tend to be quantitative<br />
in nature, and inform decision-making on<br />
climate impacts and adaptation at the local,<br />
regional and national scale for given sectors.<br />
More recently, <strong>UK</strong>CIP has played an increasing<br />
4 A comprehensive synthesis of the work achieved under the <strong>UK</strong> <strong>Climate</strong> Impacts <strong>Programme</strong> is provided in Measuring Progress: Preparing for climate change<br />
through the <strong>UK</strong> <strong>Climate</strong> Impacts <strong>Programme</strong>, <strong>UK</strong>CIP, 2005, available from www.ukcip.org.uk
134<br />
Adaptation<br />
• to promote a consistent programme of work<br />
on impacts and adaptation across the <strong>UK</strong>,<br />
working through partnerships with<br />
stakeholders and other researchers;<br />
• to provide a focal point for information on<br />
climate change impacts in the <strong>UK</strong>, through<br />
the <strong>UK</strong>CIP <strong>Programme</strong> Office and strategic<br />
communications activities; and<br />
• to learn from the research and experience of<br />
other countries, through appropriate links.<br />
28. The <strong>UK</strong>CIP has put stakeholders at the heart of<br />
the research process, in a pioneering approach<br />
for producing relevant information on climate<br />
change. The use of common tools and resources<br />
in climate impacts studies has achieved a degree<br />
of coherence within and between studies.<br />
29. In 2004, an independent review 5 of <strong>UK</strong>CIP indicated<br />
that the <strong>Programme</strong> had performed very effectively,<br />
establishing a valuable body of work on <strong>UK</strong> climate<br />
impacts and increasingly adaptation, through its<br />
stakeholder network. The review also noted that<br />
there is still much for the <strong>UK</strong>CIP to achieve, and that<br />
its work should be continued in a similar form.<br />
In 2005, <strong>Defra</strong> established a new five-year<br />
contract for the <strong>UK</strong>CIP. The new programme<br />
of work retains two main aims:<br />
• to improve knowledge and understanding<br />
of the impacts of climate change among<br />
stakeholders; and<br />
• to help stakeholders to be better equipped<br />
to undertake adaptation to climate change.<br />
And five objectives:<br />
• to improve knowledge and understanding of<br />
the impacts of climate change at a regional<br />
and national level among stakeholders,<br />
through the co-ordination, integration and<br />
communication of research;<br />
• to provide stakeholders with tools and methods,<br />
and supporting training and guidance;<br />
We will work with <strong>UK</strong>CIP to continue to raise<br />
awareness of climate change impacts and<br />
adaptation at strategic levels within private<br />
sector organisations and the business<br />
community.<br />
We will publish revised and expanded<br />
climate change scenario datasets and<br />
information for the <strong>UK</strong> in 2008.<br />
We will commission a programme of research<br />
to investigate cross-sectoral issues in adapting<br />
to the impacts of climate change in the <strong>UK</strong>.<br />
We will review and update <strong>UK</strong> indicators of<br />
climate change, and provide guidance for the<br />
development of regional indicators of<br />
climate change.<br />
We will commission a study of the business<br />
costs and benefits of adapting to climate<br />
change impacts.<br />
We will assess the role and status of regional<br />
stakeholder climate change partnerships<br />
including future funding options.<br />
Adaptation in the <strong>UK</strong> today<br />
30. Most examples of adaptation today relate to<br />
adaptation to current hazards, stemming from<br />
natural climate variability or climate change.<br />
31. The changing climate adds to the external risks<br />
that business already has to face. Alongside the<br />
physical risks from direct impacts in exposed<br />
sectors (like agriculture, property, life insurance,<br />
water, tourism), climate change may bring<br />
5 Review of <strong>UK</strong>CIP, ESYS, 2004. Available from www.defra.gov.uk/
Adaptation<br />
135<br />
additional market risks (as demands change<br />
and competitors take advantage of new<br />
opportunities), operational risks (as logistics and<br />
premises are affected by climate events) and<br />
reputational risks (as customers, suppliers and<br />
shareholders gain awareness of the climate<br />
change issue). Businesses may be more vulnerable<br />
if they are currently affected by the weather;<br />
make long-term investment decisions; or have<br />
global markets and suppliers. In many cases,<br />
the climate change experienced in other parts of<br />
the world may have a more significant indirect<br />
impact on <strong>UK</strong> businesses than the direct impacts<br />
domestically, as global markets or supply chains<br />
are affected. The changing climate may also<br />
present opportunities and potential benefits such<br />
as new markets, products or services, reduced<br />
operational costs (say for building maintenance<br />
or transport), and enhanced corporate reputation<br />
through proactively addressing climate change.<br />
32. The most secure way to manage increasing<br />
cross-cutting risks from climate change is likely to be<br />
through integrating climate change into corporate<br />
risk management strategies, particularly in order to<br />
attract forward-looking investors. The costs of<br />
adapting to climate change need not be large.<br />
Many adaptations may only require small changes<br />
to existing practices. “Win-win” solutions may also<br />
be identified, through other objectives, such as in<br />
corporate social responsibility or sustainable<br />
development plans. By contrast, the costs of impacts<br />
from damaging climate events can be very<br />
significant. In addition it may not be possible to<br />
adapt to all aspects or levels of climate change.<br />
We will work with the <strong>UK</strong> Biodiversity<br />
Partnership to publish practical guidance for<br />
nature conservation managers and planners.<br />
We will publish a revised guidance<br />
statement on the role of spatial planning<br />
in adapting to climate change.<br />
We will produce revised guidance, with the<br />
Environment Agency, on implementing flood<br />
and coastal erosion risk management measures,<br />
to ensure that adaptability to climate change<br />
becomes an integral part of all flood and<br />
coastal erosion management decisions.<br />
We will assess the role and status of regional<br />
stakeholder climate change partnerships<br />
including future funding options.<br />
Case studies of how organisations<br />
have started to adapt<br />
The New Construction Research and Innovation<br />
Strategy Panel (nCRISP)<br />
The mission of nCRISP is to 'prioritise and<br />
promote research and innovation that will<br />
sustain a first class construction industry and<br />
enhance the value of its contribution to the<br />
quality of the built environment and the wealth<br />
and well being of society’. nCRISP has links with<br />
government, industry and the research<br />
community, and considers the impact of climate<br />
change on the built environment and vice versa.<br />
The organisation has a <strong>Climate</strong> <strong>Change</strong> Task<br />
Group, formed to prioritise future research on<br />
the significance and effects of climate change<br />
on the built environment (various publications<br />
available). The remit of the task group is to<br />
focus on the impacts of climate change rather<br />
than mitigation measures: “Research is needed<br />
for the <strong>UK</strong> construction industry to plan for<br />
future construction and to provide solutions of<br />
adaptation to current infrastructure features<br />
amidst future climatic extremes” (Wilson and<br />
Burtwell, 2002). Reports produced advocate<br />
responsiveness and adaptation to climate<br />
change in the construction sector (in an<br />
‘effective and sustainable manner’).<br />
South East <strong>Climate</strong> <strong>Change</strong> Adaptation and<br />
Mitigation Implementation Plan<br />
The Implementation Plan is designed to support<br />
the South East Plan, and is part-funded by the<br />
ESPACE EU INTERREG project. The Plan seeks to<br />
provide both an overview of the existing actions<br />
and activities to mitigate and adapt to climate<br />
change in the South East as well as to propose<br />
new actions and activities to address gaps. The<br />
focus of the Implementation Plan is on actions<br />
that are relevant to spatial planning, but it also<br />
includes those that go beyond activity controlled<br />
by the town and country planning system.
136<br />
Adaptation<br />
The <strong>UK</strong>CIP Business Areas <strong>Climate</strong> Impacts Assessment Tool (BACLIAT) provides a simple checklist for<br />
organisations to assess the potential impacts of climate change on their business that can be used initially<br />
for any type of business organisation because it encourages consideration of the threats and opportunities<br />
across generic business areas. These include:<br />
• logistics: vulnerability of supply chain, utilities and transport infrastructure;<br />
• finance: implications for investment, insurance and stakeholder reputation;<br />
• markets: changing demands for goods and services;<br />
• process: impacts on production processes and service delivery;<br />
• people: implications for workforce, customers and changing lifestyles;<br />
• premises: impacts on building design, construction, maintenance and facilities management; and<br />
• management implications: what are the strategic responses to the issues identified?<br />
Costs of climate change on health in Hampshire<br />
The summer 2003 heat wave event had particular significance in Hampshire because it was one of the two<br />
counties in the <strong>UK</strong> where a daily maximum of 100°F was reached. The heat wave is estimated to have<br />
caused 21 excess or premature deaths in the county, and 2142 additional hospital days.<br />
Events such as the extreme temperatures experienced in summer 2003 are likely to become commonplace<br />
by 2050.<br />
An initial assessment for mortality and hospital admissions in Hampshire under scenarios of future climate<br />
change shows that in net present value terms, the additional impact costs over the period 2010 to 2100 are<br />
estimated to be between £95-150m, depending on emissions scenario.<br />
Adaptations to reduce some of this risk could include information provision and awareness-raising, and<br />
changes in spatial planning policy or building design. These kinds of measures might carry maximum annual<br />
costs of between £3-5m. These estimates were calculated using Costing the impacts of climate change in<br />
the <strong>UK</strong> costing method, available from the <strong>UK</strong> <strong>Climate</strong> <strong>Change</strong> Impacts <strong>Programme</strong> (<strong>UK</strong>CIP).<br />
An increase in the frequency of heat waves is likely to entail an increase in mortality and morbidity<br />
principally in older people, due to cardiovascular and respiratory diseases. Specific individual impacts that<br />
can be costed in this respect are premature mortality and hospital admissions.
Adaptation<br />
137<br />
<strong>Climate</strong> change partnerships<br />
The London <strong>Climate</strong> <strong>Change</strong> Partnership: Adaptation decision-making in London<br />
The London scoping study was published in 2002 by the London <strong>Climate</strong> <strong>Change</strong> Partnership (LCCP).<br />
Information from the study was incorporated into London’s key land use planning document, ‘The London<br />
Plan’ (Greater London Authority, 2004), which also refers to the role of the partnership in developing<br />
adaptation policies:<br />
“The Mayor will and boroughs should assess and develop policies for the likely impacts of climate change<br />
on London identified in the work of the London <strong>Climate</strong> <strong>Change</strong> Partnership. Policies will be developed in<br />
conjunction with the Partnership and addressed in the first review of the London Plan.”<br />
“London is already feeling the effects of climate change. Sea-level rise relative to the land is now widely<br />
accepted as occurring at 6mm/year at high tide in the London area. A significant proportion of future<br />
development will be in east London, which could be increasingly at risk from tidal flooding. Preventative<br />
and adaptive measures will therefore be needed, including the construction of appropriate flood defences<br />
in new developments.”<br />
Following on from the scoping study, the LCCP’s work has focused on transport and ‘growth areas’ such as<br />
developments in the Thames Gateway. LCCP has commissioned research to evaluate climatic risks and costs<br />
to London’s transport systems, including the underground and overground railways systems and road<br />
network. This information will be used by London’s transport decision-makers. In 2005, together with the<br />
South East and East of England climate change partnerships, the LCCP launched a consultation draft of<br />
‘Adapting to <strong>Climate</strong> <strong>Change</strong>: A Checklist for Development’ (TRCCG, 2005). This provides developers and<br />
their design teams with information and a checklist so that a new development can be designed to be<br />
comfortable and secure in the face of climate change throughout its lifetime.<br />
In early 2005, the GLA announced that it was developing the first climate adaptation strategy for a world<br />
city. This strategy will include policy directions on flooding, overheating, water resources management,<br />
emergency planning and other issues which will affected by London’s changing climate. Public consultation<br />
on the draft strategy is due to take place in summer <strong>2006</strong>.<br />
Research on climate change impacts<br />
across Government<br />
33. Research on climate change impacts and<br />
adaptation is carried out across a number of<br />
Government departments and agencies. <strong>Defra</strong><br />
leads on climate change policy, supports basic<br />
tools and frameworks for impacts research<br />
through <strong>UK</strong>CIP and other funded research of a<br />
more general exemplary nature. Remaining<br />
research falls to those responsible for different<br />
sectors as outlined below.<br />
34. <strong>Defra</strong> and the Environment Agency fund a<br />
collaborative research programme on flood and<br />
coastal erosion risk management. <strong>Climate</strong> change<br />
has featured in the work of a number of the<br />
themes and recently this has been based on<br />
analysis of the <strong>UK</strong>CIP02 6 scenarios to provide<br />
guidance for design and appraisal. Effort is<br />
currently focussed on better understanding fluvial<br />
flows and in a recent project modelling was<br />
undertaken using three different methods of<br />
representing <strong>UK</strong>CIP02 scenarios:<br />
• a “combined” scenario of percentage<br />
changes in average rainfall and the change in<br />
frequency of daily rainfall required for each<br />
month;<br />
• statistical downscaling methods for rainfall; and<br />
6 The <strong>UK</strong>CIP02 scenarios, which replace those produced for <strong>UK</strong>CIP in 1998, are based on four different IPCC greenhouse gas emissions scenarios, themselves<br />
based on four different descriptions of how the world may develop in the decades to come.
138<br />
Adaptation<br />
• data from the 25km Hadley Centre regional<br />
climate model.<br />
35. This provided valuable information, but was<br />
limited to a small proportion of catchments under<br />
a limited range of scenarios and showed a very<br />
wide range of potential variation. A further study<br />
is now underway to:<br />
• consider the evidence for refining current<br />
guidance to provide greater sensitivity to likely<br />
changes in both peak flood flows and total<br />
flood volumes between different regions and<br />
catchments with different characteristics and<br />
for different time periods;<br />
• provide the scientific basis for analysing and<br />
communicating uncertainties associated with<br />
climate change in comparison with other<br />
uncertainties generally encountered in<br />
hydrological estimation of flood flows and<br />
volumes; and<br />
• improve the scientific basis for regionalised<br />
policy guidance to the flood risk management<br />
community on changes in flood flows due to<br />
climate change or make recommendations for<br />
other developments necessary before such<br />
regionalisation can be achieved.<br />
36. Future work is likely to consider the impacts of<br />
climate change on sea levels, surges and waves<br />
and how the next generation of <strong>UK</strong>CIP climate<br />
change scenarios can best be used in flood and<br />
coastal erosion risk management design and<br />
analysis activities.<br />
We will produce revised guidance, with the<br />
Environment Agency, on implementing flood<br />
and coastal erosion risk management<br />
measures, to ensure that adaptability to<br />
climate change becomes an integral part of<br />
all flood and coastal erosion management<br />
decisions.<br />
37. The changing climate brings particular challenges<br />
for the management of biodiversity and protected<br />
sites. <strong>Defra</strong>’s research programme on biodiversity<br />
and climate change is undertaken in partnership<br />
with the devolved administrations, the statutory<br />
nature conservation agencies and other interested<br />
non-governmental organisations. The programme<br />
has three main objectives:<br />
• to improve the understanding of climate<br />
change impacts on biodiversity in the<br />
terrestrial and marine environments, including<br />
through application of modelling techniques<br />
to assess vulnerability of priority species and<br />
habitats;<br />
• to review and develop options for adaptation<br />
of policy and management, including<br />
improved knowledge transfer between<br />
researchers and practitioners; and<br />
• to ensure that long-term monitoring systems<br />
are in place to detect changes in biodiversity<br />
and discriminate the effects of climate change<br />
from other factors.<br />
38. <strong>Defra</strong> recently published a review of climate<br />
change impacts on migratory species 7 . As part of<br />
EPSRC programme “Building Knowledge for a Changing <strong>Climate</strong>” (BKCC)<br />
The Engineering and Physical Sciences Research Council (EPSRC) is working with <strong>UK</strong>CIP on a £3m portfolio<br />
of research projects addressing climate impacts and adaptation for the built environment.<br />
The projects are exploring climate impacts and adaptation for urban planning and design, urban drainage,<br />
historic buildings, transport operations and infrastructure, and the electricity supply industry. All of the<br />
projects involve partnerships of researchers with decision-makers who plan to use the research outputs to<br />
inform their own organisations’ adaptation strategies.<br />
A bi-annually convening Stakeholder Forum was set up to oversee the whole programme and ensure that<br />
the research outputs are geared to meet decision-makers’ information needs. The majority of the BKCC<br />
projects are due for completion in spring <strong>2006</strong>.
Adaptation<br />
139<br />
the <strong>UK</strong> Presidency of the EU, the <strong>UK</strong> Government<br />
hosted a meeting of the European Platform for<br />
Biodiversity Research Strategy to review the status<br />
of knowledge on impacts of climate change and<br />
to identify knowledge gaps which are hindering<br />
implementation of adaptation strategies 8 .<br />
We will publish the results of collaborative<br />
research on the effects of climate change<br />
on <strong>UK</strong> priority species and habitats<br />
(MONARCH3) and on the establishment of<br />
a long term monitoring network.<br />
We will review the implications of climate<br />
change for biodiversity in England and<br />
integrate adaptation within the England<br />
Biodiversity Strategy.<br />
Adaptation to climate change as an impact<br />
will be built into the development of<br />
integrated policy for the Natural<br />
Environment.<br />
39. Agriculture is inherently sensitive to climate.<br />
We have a long-standing programme of research<br />
of some £0.3m per year on climate change on<br />
agriculture and identifying adaptation options to<br />
help industry and policymakers plan for the<br />
uncertainties ahead. The programme has recently<br />
been reviewed and we will ensure climate change<br />
is factored into other key research on agriculture,<br />
Foresight Project on Future Flooding<br />
Rationale:<br />
The Foresight Future Flooding study was commissioned by the Office of Science and Technology to provide<br />
an independent vision of flood and coastal erosion risk management in the <strong>UK</strong> between 2030 and 2100 so<br />
as to inform long-term policy. In undertaking the study there was a recognition that decisions taken today<br />
will have a profound impact on the flood and coastal erosion risks which future generations will need to<br />
manage. It was also recognised that the options available for managing risks in the long-term will be<br />
strongly influenced by short term actions.<br />
Approach:<br />
The study used four Foresight socio-economic futures paired with <strong>UK</strong>CIP climate change scenarios (for<br />
example the high-growth ‘world markets’ future was combined with high greenhouse gas emissions) to allow<br />
responses to be tested against different outcomes. In this way it was possible to identify policies and responses<br />
capable of coping with a range of possible futures, allowing flexible adaptation as the situation evolves.<br />
Results:<br />
Under the baseline assumption of current levels of expenditure and approaches to flood and coastal<br />
management remaining unchanged, it was found that all scenarios would result in a substantial increase<br />
in risk. The team demonstrated that an integrated approach combining a portfolio of responses would<br />
provide significant cost savings over conventional defences and also enable a much more sustainable<br />
approach to be realised.<br />
Conclusions:<br />
The Foresight Future Flooding study does not provide a definitive vision of the future or specify what our<br />
aims should be. It does, however, give a clear indication of how we should approach the management of<br />
flood risk and what issues are likely to be important. It has provided a vital input to the developing cross<br />
government strategy Making Space for Water and demonstrated that reducing climate change could make<br />
the task we face substantially easier.<br />
Full details of the study are available from http://www.foresight.gov.uk/<br />
7 www.defra.gov.uk/wildlife-countryside/resprog/findings/climatechange-migratory/index.htm<br />
8 The recommendations of this meeting are available from www.epbrs.org/
140<br />
Adaptation<br />
and that climate change is linked more broadly to<br />
work on socio-economic change in the<br />
agriculture sector.<br />
40. The impacts of climate change are less wellstudied<br />
for the marine environment. <strong>Climate</strong><br />
change could significantly affect the physical,<br />
biological and biogeochemical characteristics of<br />
the oceans and coasts, modifying their ecological<br />
structure and functions.<br />
41. <strong>Change</strong>s in sea water temperature is changing<br />
the species composition of phytoplankton, the<br />
microscopic plants which respond to temperature,<br />
light and nutrients and form the lowest level in<br />
the food web. Such changes could also affect the<br />
life forms higher up the food web. More directly,<br />
sea temperature changes could affect the<br />
reproductive success of species at a given latitude<br />
and, thus, affect the abundance of animals and<br />
plants of any size. Since around 1987, changes in<br />
plankton have been considered so large-scale that<br />
they have been described as a regime shift. There<br />
has been increased primary productivity, merging<br />
of the spring and autumn blooms and a switch<br />
in the dominant species. This has been<br />
accompanied by the northward movement of<br />
plankton species by about 10 degrees of latitude.<br />
42. More specific action is now being taken to<br />
investigate the possible impacts of climate<br />
change in the marine environment:<br />
• The Government and the <strong>UK</strong> <strong>Climate</strong> Impacts<br />
<strong>Programme</strong> (<strong>UK</strong>CIP) are establishing a Marine<br />
<strong>Climate</strong> <strong>Change</strong> Impact Partnership in order<br />
to develop a long-term, multidisciplinary<br />
approach to understanding the implications<br />
for the marine ecosystem.<br />
• Within the <strong>UK</strong> Marine Monitoring Strategy,<br />
relevant indicators will be identified to<br />
monitor and evaluate the effects of climate<br />
change on marine ecosystems.<br />
We will commission an assessment of the<br />
changes in the distribution and abundance<br />
of marine species in relation to changes in<br />
hydrodynamics and sea temperature.<br />
We will combine knowledge and expertise<br />
on the impacts of climate change in the<br />
marine environment through the Marine<br />
<strong>Climate</strong> <strong>Change</strong> Impacts Partnership.<br />
43. Much of the research to date has been carried<br />
out to inform specific individual sectors about the<br />
implications of climate change. However, there<br />
may be more surprises in store as climate-related<br />
impacts on one sector bring with them indirect<br />
effects for another. Many of these cross-sectoral<br />
issues are much less studied, yet robust<br />
adaptation decisions in sectoral policy areas will<br />
need to take into account the implications of<br />
those decisions for facilitating or preventing<br />
effective adaptation in related sectors.<br />
We will commission a programme of<br />
research to investigate cross-sectoral issues<br />
in adapting to the impacts of climate change<br />
in the <strong>UK</strong>.<br />
44. Knowledge and understanding of the impacts of<br />
climate change is growing not only in the <strong>UK</strong>, but<br />
internationally too. The field of adaptation is still<br />
relatively young, and there is scope to learn much<br />
from initial efforts both in the <strong>UK</strong> and elsewhere<br />
to take effective adaptation. In order to be<br />
robust, policy-making needs to be flexible, build<br />
on the latest research, and allow the latest results<br />
to inform policy and planning.<br />
We will commission an academic “<strong>Climate</strong><br />
<strong>Change</strong> Impacts Review Group” to produce a<br />
review of the impacts of climate change and<br />
adaptation in the <strong>UK</strong>.<br />
We will conduct a review of current activities<br />
to assess the impacts of climate change in<br />
the marine environment.
Adaptation<br />
141<br />
Conclusions<br />
45. It is clear that there are many areas of policy<br />
where adaptation to the unavoidable impacts of<br />
climate change is beginning to occur. The <strong>UK</strong> has<br />
developed considerable expertise in this field, and<br />
in the period covered by this revised <strong>Programme</strong><br />
will have the opportunity to share this<br />
internationally.<br />
45. There is also much supporting research work that<br />
Government is taking forward to improve<br />
understanding of climate impacts and to enable<br />
the integration of this understanding into<br />
adaptation policy.<br />
46. Action is required more widely than just Central<br />
Government. We are working to set in place the<br />
knowledge and frameworks to allow us to more<br />
successfully adapt to unavoidable climate change.
SECTION<br />
4<br />
Action by the Devolved Administrations
144<br />
CHAPTER ONE<br />
Scotland<br />
The Scottish Executive is committed to:<br />
• Strengthening its climate change response<br />
through its own revised Scottish <strong>Climate</strong><br />
<strong>Change</strong> <strong>Programme</strong>.<br />
• Quantifying Scotland’s equitable<br />
contribution to the <strong>UK</strong>’s targets by<br />
developing the Scottish Share concept.<br />
• Creating a framework to assist Scotland in<br />
repsponding to the unavoidable impacts of<br />
climate change .<br />
Introduction<br />
with the <strong>UK</strong> Government in moving towards its<br />
ambitious domestic carbon dioxide goal for 2010.<br />
3. To complement historic data, the Executive is<br />
developing updated greenhouse gas and carbon<br />
dioxide emissions projections for Scotland.<br />
The Executive is committed to developing<br />
its strategic response to climate change as<br />
scientific understanding of the problem, and<br />
Scotland’s contribution to it, develops. During<br />
the review of the Scottish <strong>Programme</strong>, described<br />
in greater detail below, the Executive developed<br />
a new approach to define what an equitable<br />
contribution to <strong>UK</strong> climate change commitments<br />
is in specific emissions saving terms (the “Scottish<br />
Share” – see below).<br />
1. This chapter outlines some of the action being<br />
taken by the Scottish Executive to tackle climate<br />
change in Scotland. It is largely retrospective,<br />
providing an update on action the Executive has<br />
taken since the <strong>UK</strong> and Scottish programmes<br />
were published in November 2000. Detailed<br />
information about the outcome of the review<br />
process in Scotland and the new policies to be<br />
introduced will be provided in the revised Scottish<br />
<strong>Climate</strong> <strong>Change</strong> <strong>Programme</strong>, to be published<br />
soon after the <strong>UK</strong> <strong>Programme</strong>.<br />
Greenhouse gas emissions inventory<br />
and projections<br />
4. Greenhouse gas emissions data, disaggregated for<br />
the four countries of the <strong>UK</strong>, is available for 1990,<br />
1995 and annually from 1998. Scotland’s<br />
greenhouse gas emissions reductions demonstrate<br />
that Scotland is making a substantial contribution<br />
to the <strong>UK</strong>’s Kyoto target. Greenhouse gas<br />
emissions fell by 2 MtC between 1990 and 2003<br />
(10 per cent below 1990 levels and 14 per cent<br />
below if land use change removals are taken into<br />
account). Carbon dioxide emissions fell by almost<br />
1.3 MtC over the same period (8 per cent below<br />
1990 levels and 13 per cent if land use change<br />
removals are taken into account). These reductions<br />
were achieved at the same time as a 29 per cent<br />
growth in the Scottish economy over the period.<br />
2. The original Scottish <strong>Programme</strong> contains a range<br />
of regulatory, voluntary and educational measures<br />
aimed at delivering emissions reductions in areas<br />
devolved to the Executive. It committed the<br />
Executive to make an equitable contribution to<br />
the <strong>UK</strong> Kyoto target and to work in partnership<br />
5. Scotland’s carbon dioxide and total greenhouse gas<br />
emissions have fallen by more than the <strong>UK</strong> average<br />
in the period since the <strong>UK</strong> and Scottish <strong>Climate</strong><br />
<strong>Change</strong> <strong>Programme</strong>s were published (2000-2003),<br />
by 5 and 6 per cent respectively. Scotland’s<br />
greenhouse gas emissions reduction between 1990<br />
and 2003, including land use change and forestry<br />
emissions and removals, was greater than that of<br />
13 of the 15 EU Member States that make up the<br />
EU Kyoto burden-sharing agreement.
Scotland<br />
145<br />
Scottish and <strong>UK</strong> greenhouse gas emissions by sector in 2003<br />
Sector Greenhouse Gas Emissions (MtC) 1 % <strong>Change</strong> Scotland as %<br />
1990 2003 1990-2003 of <strong>UK</strong> 2 (2003)<br />
Business 3.2 2.0 -36 7<br />
Waste Management 0.4 0.2 -51 6<br />
Industrial Process 0.5 0.1 -72 3<br />
Transport 2.8 3.0 6 9<br />
Residential 1.9 2.0 2 8<br />
Energy Supply 6.3 6.5 3 11<br />
Agriculture 2.4 2.1 -15 16<br />
Land Use <strong>Change</strong> Emission 1.5 1.4 -3 35<br />
Public 0.5 0.3 -48 9<br />
Total Emissions 19.6 17.6 -10 10<br />
Land Use <strong>Change</strong> 3 : Removals** -2.3 -2.7 20 62<br />
Total Net Emissions 17.3 14.9 -14 9<br />
Notes:<br />
1 Base year and 2003 emission figures taken from the Greenhouse Gas Inventories for England, Scotland, Wales and Northern Ireland 1990-2003 (Baggott et<br />
al., 2005). The emissions estimates for Scotland, Wales and Northern Ireland inventories are subject to greater uncertainty than the consolidated <strong>UK</strong> estimates.<br />
2 <strong>UK</strong> figures exclude unallocated emissions. This affects energy supply and transport (where emissions due to military transport, fishing and domestic aviation<br />
are unallocated).<br />
3 Land use change removals is a sink and, therefore, removes carbon. Thus, the percentage change between 1990 and 2003 (in column 3) has therefore been<br />
shown as a positive to reflect the fact that the capacity of the sink has increased.<br />
The impacts of climate change in<br />
Scotland<br />
6. The <strong>UK</strong> <strong>Climate</strong> Impact <strong>Programme</strong>’s climate<br />
change scenarios 1 , published in 2002, predict<br />
that:<br />
• by the 2080s Scotland will have warmer and<br />
wetter winters;<br />
• there will be less snowfall and increased<br />
flooding;<br />
• summer temperatures could rise by up to<br />
3.5˚C and winter ones by 2.5˚C;<br />
• rainfall in 24 hours from storms, which are<br />
expected to occur biennially, could rise by up<br />
to 25 per cent, especially in the east;<br />
• the growing season could be extended by<br />
30 to 80 days;<br />
• sea levels could rise by up to 600 mm;<br />
• snowfall could decrease by up to 90 per cent<br />
depending on location.<br />
7. The Executive has worked closely with the <strong>UK</strong><br />
Government on a £400,000 cross-regional<br />
research programme, which is funding six projects<br />
on impacts and adaptation. It is also working<br />
with: (1) the Scotland and Northern Ireland<br />
Forum for Environmental Research on the<br />
development of a regional partnership to assist<br />
organisations in Scotland to respond to the<br />
impacts of climate change; and (2) the <strong>UK</strong><br />
<strong>Climate</strong> Impacts <strong>Programme</strong> to assist businesses<br />
and local authorities plan their adaptation<br />
response. In addition, the Executive is working<br />
closely with the <strong>UK</strong> Government and the other<br />
devolved administrations on the development<br />
of the <strong>UK</strong> climate change Adaptation Policy<br />
Framework. Further information on the<br />
Executive’s adaptation response to flood risk<br />
and other climate change-related threats will<br />
be set out in the revised Scottish <strong>Climate</strong><br />
<strong>Change</strong> <strong>Programme</strong>.<br />
• summers could be up to 40 per cent drier;<br />
and<br />
1 www.ukcip.org.uk/scenarios/
146<br />
Scotland<br />
The review of the Scottish <strong>Climate</strong><br />
<strong>Change</strong> <strong>Programme</strong><br />
8. A formal review of the Scottish <strong>Programme</strong><br />
was launched at the same time as the <strong>UK</strong><br />
Government’s review of the <strong>UK</strong> <strong>Programme</strong> in<br />
September 2004. The aim of the review was to<br />
consider the scope for strengthening existing<br />
measures and introducing new policies to reduce<br />
Scottish greenhouse gas emissions and adapt to<br />
the unavoidable impacts of climate change. The<br />
Executive received almost 400 responses, which<br />
are summarised in Scottish <strong>Climate</strong> <strong>Change</strong><br />
<strong>Programme</strong> Review: Analysis of Consultation<br />
Responses 2 . A Scottish stakeholder group was<br />
also established and met periodically during the<br />
review.<br />
2005. The Strategy is built around action to<br />
address the well-being of people in Scotland,<br />
supporting thriving communities, protecting<br />
Scotland’s natural heritage and resources and<br />
making a global contribution. The Strategy<br />
provides a framework for a range of existing and<br />
planned policies, strategies and programmes,<br />
including the Scottish <strong>Climate</strong> <strong>Change</strong><br />
<strong>Programme</strong>. It sets out cross-cutting proposals<br />
on education and learning, communication and<br />
governance and identifies actions that can be<br />
taken by public bodies, businesses, individuals<br />
and the community and voluntary sectors to<br />
address sustainable development concerns,<br />
including climate change.<br />
Renewables<br />
Scottish Share<br />
9. One of the key aims of the review of the Scottish<br />
<strong>Programme</strong> was to assess to what extent<br />
Scotland makes an equitable contribution to <strong>UK</strong><br />
commitments on climate change, in those areas<br />
of policy in which the Executive has direct<br />
responsibility.<br />
10. The ‘Scottish Share’ concept was announced<br />
by the Minister for Environment and Rural<br />
Development at a <strong>Climate</strong> Leaders’ Summit held<br />
in Montreal in parallel with the 11th Conference<br />
of the Parties on 5-6 December 2005. The<br />
Scottish Share quantifies the amount of carbon<br />
savings that Scotland has to deliver through its<br />
devolved policies to match savings from all<br />
devolved policies in the <strong>UK</strong> <strong>Climate</strong> <strong>Change</strong><br />
<strong>Programme</strong> on a per capita basis. Details of the<br />
Scottish Share and further development of the<br />
overall approach will be included in the revised<br />
Scottish <strong>Climate</strong> <strong>Change</strong> <strong>Programme</strong>.<br />
Scottish Sustainable Development<br />
Strategy<br />
12. Promotion of renewable energy is devolved to the<br />
Executive. Scottish Ministers are committed<br />
to promoting energy from a wide range of<br />
renewable sources, and have a target that<br />
40 per cent of electricity generated in Scotland<br />
as a proportion of demand should come from<br />
renewable sources by 2020. This equates to<br />
around 6GW of installed capacity, although<br />
Ministers have made clear that this is not<br />
regarded as a cap.<br />
13. Much of the developer activity at present (driven<br />
by the Renewables Obligation Scotland/ROS) is<br />
focused on onshore wind. However, the Forum<br />
for Renewable Energy Development in Scotland<br />
has produced reports aimed at expanding the<br />
biomass and marine energy sectors. Scottish<br />
Ministers recently announced their intention to<br />
provide more support to wave and tidal power<br />
by amending the ROS, and further work and<br />
consultation on this option is currently under<br />
preparation. Plans to provide additional support<br />
to biomass heat and power projects are also<br />
being advanced, whilst the Executive continues<br />
to provide support to small and micro scale<br />
renewables through its Scottish Community and<br />
Household Renewables Initiative 4 .<br />
11. The Scottish Sustainable Development Strategy<br />
Choosing Our Future 3 was published at the end of<br />
2 www.scotland.gov.uk/Topics/Environment/<strong>Climate</strong>-<strong>Change</strong>/16327/SCCPReview<br />
3 www.scotland.gov.uk/Publications/2005/12/1493902/39032<br />
4 www.est.org.uk/schri/
Scotland<br />
147<br />
European Marine Energy Centre<br />
Among the first of its kind in Europe, the<br />
European Marine Energy Centre in Orkney<br />
provides testing facilities for commercial-scale<br />
wave devices and in the near future it will also<br />
provide tidal testing facilities. The £5m Centre,<br />
which has been operational since October 2003<br />
and was opened officially in August 2004, hosts<br />
a four berth wave testing facility (2 kilometres<br />
offshore) and a data centre in Stromness. Work<br />
is underway on the creation of a five berth<br />
tidal testing facility.<br />
It is hoped that the facility will become a world<br />
leader in the development, testing,<br />
accreditation and environmental monitoring of<br />
devices for the marine energy industry and will<br />
help to stimulate the creation of green jobs in<br />
Scotland. A Marine Energy Group report,<br />
published in 2004, suggested that up to 7000<br />
jobs could be supported in both direct and<br />
indirectly related industries.<br />
joined-up approach for energy efficiency<br />
interventions. The strategy will cover the<br />
domestic, business, transport, and public sectors.<br />
CHP<br />
15. Policy on Combined Heat and Power is reserved<br />
to the <strong>UK</strong> Government. CHP electrical capacity in<br />
Scotland in 2004 was 773 megawatts of energy,<br />
13.8 per cent of the <strong>UK</strong> total.<br />
IPPC<br />
16. Implementation of the Integrated Pollution<br />
Prevention and Control Directive (96/61/EC) is<br />
devolved and has been implemented in Scotland<br />
through the Pollution Prevention and Control<br />
(Scotland) Regulations 2000 (PPC). IPPC includes<br />
energy efficiency requirements that are designed to<br />
minimise pollution arising from the consumption<br />
of energy in industrial processes. Each installation<br />
requires a PPC permit issued by the Scottish<br />
Environment Protection Agency (SEPA). These<br />
include conditions also encouraging energy to be<br />
used efficiently in the industrial process.<br />
EU emissions trading scheme<br />
Energy efficiency<br />
17. The EU ETS is a devolved matter. The Executive<br />
worked closely with the <strong>UK</strong> Government to have<br />
the Scheme up and running uniformly across the<br />
<strong>UK</strong> by 1 January 2005. Over 1000 <strong>UK</strong> installations<br />
– accounting for over 46 per cent of <strong>UK</strong> carbon<br />
dioxide emissions – are involved in the first phase<br />
of the scheme (2005-2007). Over 100 of these are<br />
based in Scotland. The Executive continues to<br />
work closely with the <strong>UK</strong> Government on<br />
arrangements for the second phase.<br />
14. Overall energy policy is reserved to the <strong>UK</strong><br />
Government while the Executive is responsible<br />
under the Scotland Act 1998 for “the<br />
encouragement of energy efficiency other than by<br />
prohibition or regulation”. The Executive plans<br />
to publish an energy efficiency strategy for<br />
Scotland during <strong>2006</strong>. This will create a more<br />
Support for businesses<br />
18. The Carbon Trust works with businesses and the<br />
public sector in the <strong>UK</strong> to support them in<br />
strategies to cut emissions of carbon dioxide, and<br />
to reduce climate change. In 2004-5, the Trust
148<br />
Scotland<br />
carried out around 600 on-site energy audits in<br />
Scotland, identifying potential carbon savings of<br />
0.07 MtC, representing financial savings of<br />
around £16m. Up to March 2005, it had also<br />
reached 34 partnership agreements with<br />
organisations in both the public and private sector<br />
producing an estimated 0.02 MtC of carbon<br />
savings and financial savings of around £8m.<br />
19. Loan Action Scotland provides interest free loans<br />
from £5,000 to £50,000 to Scottish Small and<br />
Medium Sized enterprises (SMEs) for investments<br />
that reduce energy consumption. These loans are<br />
repayable over a maximum of five years. As well<br />
as reducing energy consumption and carbon<br />
emissions, the scheme directly increases the<br />
profitability of Scottish SMEs by reducing their<br />
energy bills.<br />
Green jobs strategy<br />
20. Resource efficiency is devolved and the Executive<br />
published Going for green growth: a green<br />
jobs strategy for Scotland 5 in June 2005. The<br />
Strategy highlights the wealth of business and<br />
employment opportunities arising from the global<br />
shift towards a sustainable future, especially<br />
in sectors specialising in renewable energy<br />
and cleaner technologies, including carbon<br />
sequestration, waste management and recycling.<br />
Waste management<br />
21. Waste policy in Scotland is generally a devolved<br />
matter although taxation, including the landfill tax,<br />
is reserved. The National Waste Plan (NWP) and 11<br />
constituent Area Waste Plans were published in<br />
February 2003 and established the direction of the<br />
Executive’s policies for sustainable waste<br />
management to 2020. The aim of the plans is to<br />
minimise the impact of waste on the environment,<br />
both locally and globally, and improve resource<br />
efficiency in Scotland. Targets include recycling and<br />
composting 25 per cent of municipal waste by<br />
<strong>2006</strong>, 30 per cent by 2008 and 55 per cent by<br />
2020. A Strategic Waste Fund was established in<br />
2001 to assist local authorities in meeting these<br />
targets. Implementation of the NWP will lead to a<br />
significant reduction in landfill of municipal waste,<br />
from around 90 per cent to 30 per cent and<br />
subsequent reduction in methane gas emissions.<br />
Transport<br />
22. The National Transport Strategy (NTS) will be<br />
launched in <strong>2006</strong>. Over the coming year the<br />
Strategy will provide the opportunity for the<br />
Executive to consider its transport policies and<br />
their alignment with its climate change and<br />
sustainable development goals. The NTS will be<br />
based on the Executive’s aim for transport as set<br />
out in the 2004 White Paper, Scotland’s Transport<br />
Future, for example to promote economic<br />
growth, social inclusion, health and protection of<br />
the environment through a safe, integrated and<br />
effective transport system. The Executive’s<br />
environmental objective for transport is to<br />
“protect our environment and improve health by<br />
building and investing in public transport and<br />
other types of efficient and sustainable transport<br />
which minimise emissions and consumption of<br />
resources and energy”.<br />
23. The NTS will offer the opportunity to start a<br />
wider debate on environmental issues and<br />
provide an ideal forum to seek the views of<br />
stakeholders on targets and indicators. In the<br />
meantime the Executive is addressing the issue<br />
of transport impacts on the environment and<br />
transport emissions in a number of ways ranging<br />
from initiatives aimed at promoting modal shift<br />
such as the funding of Step<strong>Change</strong> 6 location<br />
specific pilot projects, School Travel Co-ordinators<br />
and CyclingScotland 7 , to its Partnership<br />
Agreement 8 commitment to introducing Green<br />
Travel Plans and directing 70 per cent of<br />
investment to public transport over the period<br />
of the Executive’s long-term investment plan.<br />
5 Going for green growth: A green jobs strategy for Scotland: http://www.scotland.gov.uk/Publications/2005/06/1693437/34386<br />
6 www.stepchangescotland.org/<br />
7 www.cyclingscotland.org/<br />
8 www.scotland.gov.uk/library5/government/pfbs-00.asp
Scotland<br />
149<br />
Edinburgh CityCarClub<br />
Edinburgh CityCarClub is the largest in Britain,<br />
operated by Smart Moves with the support of<br />
the City of Edinburgh Council. It offers an<br />
alternative to traditional car ownership through<br />
pay-as-you-drive car hire. Members have local<br />
access to a car when they need one and only<br />
pay for the time it is in use and the miles<br />
driven. Cars are parked in reserved parking<br />
spaces, close to homes or workplaces and can<br />
be booked on-line or by telephone. All vehicles<br />
are serviced and maintained by the club, which<br />
means members do not have the expense or<br />
bother of dealing with servicing, repairs,<br />
insurance, MOTs, road tax and cleaning.<br />
City Car Club cites research showing that each<br />
car in a car club typically replaces five privately<br />
owned vehicles. Fewer cars = less carbon<br />
dioxide emissions, less congestion and also<br />
quieter, cleaner, safer streets.<br />
Biofuels<br />
24. The Executive recognises the environmental<br />
benefits of biofuels and has encouraged and<br />
supported the construction of Scotland’s first<br />
large-scale biodiesel plant by the Argent Group<br />
near Motherwell through a Regional Selective<br />
Assistance grant of £1.2m. The plant became<br />
operational in early 2005 and reached full<br />
production levels at the end of the 2005. It also<br />
supports development work at <strong>UK</strong> level on the<br />
promotion and uptake of alternative and cleaner<br />
vehicle technology and fuels such as the<br />
Powering Future Vehicles Strategy 9 and is involved<br />
in developments at the <strong>UK</strong> level related to the<br />
recently announced introduction of a Renewable<br />
Transport Fuel Obligation (RTFO).<br />
and Marketing Grant schemes support the use of<br />
Scottish produce and therefore local employment.<br />
This cuts down on imports that can have an<br />
impact on food miles and transportation.<br />
Aviation<br />
26. The impact of transport on the environment is<br />
not only a Scottish issue but also a <strong>UK</strong> and an<br />
international one. The Executive, therefore,<br />
strongly supports – subject to specific concerns<br />
being addressed regarding the unique nature of air<br />
services in the Highlands and Islands – the <strong>UK</strong><br />
Government in seeking the inclusion of the<br />
aviation sector in the EU emissions trading scheme.<br />
Energy efficiency in households<br />
27. There has been significant growth in energy<br />
consumption in the residential sector. This issue<br />
will therefore be the focus for the energy<br />
efficiency strategy to be published in <strong>2006</strong>. The<br />
Energy Saving Trust (EST) is one of the leading<br />
organisations working with the Executive to<br />
identify climate change interventions within the<br />
household sector. The Executive is providing direct<br />
funding of around £8m in the year 2005-6 for<br />
the EST’s work in Scotland. In 2004-5 EST advised<br />
90,000 clients in Scotland on energy efficiency<br />
matters. It is estimated that in 2005-6 EST<br />
programmes should produce lifetime savings of<br />
194,000 tonnes of carbon equivalent.<br />
Food transportation<br />
25. The Executive understands the need to reduce<br />
unnecessary food miles and better understand<br />
issues around food transportation. The Processing<br />
9 www.dft.gov.uk/stellent/groups/dft_roads/documents/page/ dft_roads_506885.hcsp
150<br />
Scotland<br />
Fuel poverty<br />
28. Policy to combat fuel poverty is devolved to the<br />
Executive. Fuel poverty in Scotland has more than<br />
halved between 1996 and 2002, from 738,000<br />
to 286,000 households. Since 2001, over £140m<br />
has been made available to the Central Heating<br />
programme which has provided central heating<br />
systems to over 56,000 homes. Research on the<br />
first year of the programme showed that of the<br />
people who were fuel poor, nearly nine out of<br />
ten were lifted out of fuel poverty after receiving<br />
measures. The Executive has also so far devoted<br />
£64m to the Warm Deal, insulating over 218,000<br />
homes – nearly one-tenth of all of Scotland’s<br />
housing stock.<br />
Agriculture<br />
29. Agriculture policy is devolved to the Executive.<br />
The Common Agriculture Policy Reform<br />
introduced cross compliance 10 and the<br />
requirement for farmers to maintain their land in<br />
Good Agricultural and Environmental Condition<br />
(GAEC). These became requirements for receipt<br />
of the new Single Farm Payment in 2005. Much<br />
of GAEC relates to soil protection issues and<br />
measures to preserve and enhance levels of<br />
organic matter in soils. About 70 per cent of<br />
Scottish land is managed according to GAEC.<br />
measures which will contribute to a reduction in<br />
emissions by encouraging more extensive land<br />
use practices. Advice is provided to farmers<br />
through various means, including the Prevention<br />
of Environmental Pollution from Agricultural<br />
Activity (PEPFAA) Code and the Farm Soils Plan<br />
which include recommendations for techniques<br />
to reduce greenhouse gas emissions and<br />
encourage energy efficiency.<br />
31. The Executive has funded a range of research<br />
projects to understand the role of agriculture and<br />
other rural land uses on greenhouse gas<br />
emissions, for example how fertiliser use in<br />
Scotland 11 contributes to climate change.<br />
A model to simulate carbon and nitrogen<br />
dynamics in organic soils and help predict the<br />
response to land use change will be published<br />
in 2007.<br />
Scottish soils<br />
32. Policy in this area is devolved to the Executive.<br />
A commitment has already been made by the<br />
Executive in the Rural Implementation Plan of the<br />
Scottish Biodiversity Strategy 12 to ‘develop soil<br />
management strategies/policies which will<br />
promote conservation and enhancement of<br />
biodiversity interests’ by 2007.<br />
30. Agri-environment schemes such as the Rural<br />
Stewardship Scheme (RSS) include a number of<br />
33. Recognising the importance of evidence when<br />
considering a more strategic approach towards<br />
soil protection, the Executive is currently involved<br />
in a number of research projects that will provide<br />
10Cross compliance is a series of standards that farmers need to meet in order to receive their subsidy payment in full.<br />
11www.scotland.gov.uk/Resource/Doc/30701/0007033.pdf<br />
12www.scotland.gov.uk/Publications/2004/05/19366/37239
Scotland<br />
151<br />
evidence on the state of and threats to Scottish<br />
soils. At the same time, the Executive is an active<br />
member of the <strong>UK</strong> Soil Indicators Consortium<br />
which aims to develop soil indicators and a soil<br />
monitoring scheme in order to broaden the<br />
knowledge base on the overall state of soils.<br />
Scottish soil policies are currently informing the<br />
<strong>UK</strong>’s input to the negotiation of the EU Soil<br />
Thematic Strategy. The EU Strategy will in turn be<br />
an important factor in the development of the<br />
Scottish soil policy framework.<br />
Forestry<br />
34. Forestry policy is entirely devolved to the<br />
Executive. Forestry makes a net contribution to<br />
reducing atmospheric carbon dioxide by carbon<br />
uptake in growing biomass, and through forest<br />
vegetation and soils. A further contribution is<br />
made when wood fuel substitutes fossil fuels,<br />
and where timber and wood products substitute<br />
for energy-intensive materials such as concrete<br />
and steel.<br />
35. Through Forestry Commission Scotland (FCS),<br />
the Executive promotes woodland creation in<br />
appropriate situations through the Scottish<br />
Forestry Increase Grants Scheme. This work aims<br />
to increase the accessibility of woodland creation<br />
grants via their incorporation into Land<br />
Management Contracts, which from 2007 will<br />
become the primary vehicle in Scotland for<br />
supporting land management. A review of the<br />
Scottish Forestry Strategy is underway; climate<br />
change mitigation will be recognised as a key<br />
issue for Scotland’s 1.35m hectare forest estate.<br />
Public sector<br />
36. Scottish local authorities, the Health Boards, and<br />
Scottish Water spend over £100m a year on<br />
energy. The Central Energy Efficiency Fund (CEEF)<br />
is a revolving loan fund started in June 2004 to<br />
promote improved energy efficiency throughout<br />
the public sector by providing interest free loans<br />
to fund the installation of energy saving<br />
measures. The Executive has allocated £20m,<br />
with £15m available to local authorities, £4m to<br />
the health sector, and £1m to Scottish Water. This<br />
scheme is directly financing projects that deliver<br />
energy, cost and carbon savings.<br />
37. The Executive recognises that it must lead by<br />
example in tackling its own corporate<br />
contribution to climate change. The Greening<br />
Government policy sets out objectives and targets<br />
for improving the environmental performance of<br />
the Executive’s own operations. These include, for<br />
example, the energy consumption of its estate,<br />
vehicle use, waste arising and recycling, and<br />
factoring in environmental considerations to the<br />
procurement of goods and services. The<br />
Executive’s electricity contract enables the<br />
procurement of 100 per cent carbon-free energy<br />
attributed to hydro-electric and wind power<br />
generation, and an 80 per cent climate change<br />
levy exemption.<br />
38. The Executive reports annually on progress<br />
against its environmental objectives and targets.<br />
This work also includes the development of<br />
environmental management systems across its<br />
estate and the continuing ISO14001 accreditation<br />
of its largest building.<br />
Performance of the NHS Scotland<br />
estate<br />
39. In line with Executive climate change<br />
commitments, NHSScotland had, between<br />
1989-90 and 2004, reduced its carbon dioxide<br />
emissions by 37.6 per cent. Its target to reduce<br />
energy consumption by 22.5-30 per cent between<br />
1985-86 and 2000-01 was surpassed, with a total<br />
reduction of 34 per cent achieved. In 2000, NHS<br />
Scotland committed to a national target to further<br />
reduce energy consumption by 2 per cent each<br />
year by 2010. If achieved, this target will be<br />
equivalent to a total saving of almost 50 per cent<br />
in energy consumption by 2010 against the 1990<br />
Kyoto base year. An update on other key public<br />
bodies will be provided in the new Scottish<br />
<strong>Climate</strong> <strong>Change</strong> <strong>Programme</strong>.
152<br />
Scotland<br />
Planning<br />
Building Regulations<br />
36. The town and country planning system is a<br />
devolved matter. In Scotland, the integration of<br />
climate change considerations into land use<br />
planning is dealt with in a wide range of<br />
Executive planning publications. Firstly, it is<br />
recognised as a key issue and driver of change<br />
in the National Planning Framework. Secondly,<br />
Scottish Planning Policy (SPP)1 – The Planning<br />
System 13 recognises the Executive’s wider<br />
commitment to tackling climate change and<br />
acknowledges that burning fossil fuel is the<br />
biggest single contributor to global warming.<br />
Thirdly, more specific references are included in<br />
the policy and advice on individual planning<br />
issues, notably SPP3 Housing, National Planning<br />
Policy Guideline (NPPG)6 Renewable Energy<br />
(under review), SPP7 Flooding, NPPG 10 Waste<br />
Management and NPPG 13 Coastal Planning 14 .<br />
37. Regarding emissions reductions, the Scottish<br />
Planning Policy 17 Planning for Transport 15 and<br />
the associated planning advice note published in<br />
August 2005, incorporate a wide number of<br />
broader Executive policy objectives in the<br />
planning policy, including those related to climate<br />
change. In turn, planning authorities take the<br />
Executive’s policy and advice into account in the<br />
preparation of their structure and local plans, and<br />
in the determination of planning applications.<br />
This is reinforced by requirements for Strategic<br />
Environmental Assessments (see below) for plans<br />
and Environmental Impact Assessments for<br />
projects, to consider any significant effects on<br />
climatic factors.<br />
38. The current energy standards for buildings were<br />
introduced in March 2002. These standards apply<br />
when new buildings are constructed and existing<br />
buildings are altered and/or extended. The<br />
improvements made represent a 25 per cent<br />
saving in energy terms over the previous set of<br />
standards. The revised Scottish Building<br />
Regulations, which came into force in May 2005,<br />
currently have the most demanding levels of<br />
thermal insulation for buildings (including<br />
conservatories) in the <strong>UK</strong>.<br />
Strategic Environmental Assessment<br />
39. Strategic Environmental Assessment (SEA) is a<br />
devolved matter. In Scotland and also <strong>UK</strong> wide,<br />
regulations implementing SEA came into force<br />
in July 2004. The Environmental Assessment<br />
(Scotland) Bill (SEA Bill) was passed in the Scottish<br />
Parliament on 9 November 2005 and extends the<br />
scope of Strategic Environmental Assessment<br />
beyond the requirements of the EU Directive, to<br />
cover all public sector strategies, plans and<br />
programmes.<br />
Monitoring and reporting<br />
40. Details of monitoring and reporting arrangements<br />
will be included in the revised Scottish <strong>Climate</strong><br />
<strong>Change</strong> <strong>Programme</strong>.<br />
13www.scotland.gov.uk/library5/planning/spp1-00.asp<br />
14www.scotland.gov.uk/library5/planning/spp3-00.asp<br />
15www.scotland.gov.uk/Publications/2005/08/16154406/44078
CHAPTER TWO<br />
Northern Ireland<br />
153<br />
Northern Ireland is committed to:<br />
• Implement a package of policies and<br />
programmes to mitigate climate change<br />
and contribute to the <strong>UK</strong> emission<br />
reduction targets.<br />
• Focus effort on further reducing the<br />
emissions intensity of electricity generation<br />
and improving energy efficiency in homes,<br />
businesses and the public sector.<br />
• Invest in research and development on<br />
renewable technologies, support and<br />
incentivise market uptake to reduce reliance<br />
on fossil fuels.<br />
• Undertake research and engage with<br />
stakeholders to raise awareness and<br />
understanding of the potential impacts of<br />
predicted changes in climate and assist<br />
organisations in preparing for these changes.<br />
Introduction<br />
1. Northern Ireland is fully committed to<br />
implementing policies and programmes to reduce<br />
greenhouse gas emissions, to help contribute to<br />
the <strong>UK</strong>’s Kyoto target and domestic goal. <strong>Climate</strong><br />
<strong>Change</strong> and energy is a priority area for Northern<br />
Ireland. Work is also progressing on assessing the<br />
implications of climate change for Northern<br />
Ireland as the basis for developing adaptation<br />
policies. Northern Ireland’s Sustainable<br />
Development Strategy, due to be published this<br />
year, will provide a cross-cutting strategic<br />
direction and framework for the Northern Ireland<br />
Administration to direct policy and decisionmaking<br />
and encourage a co-ordinated and<br />
co-operative approach to sustainable<br />
development.<br />
Greenhouse gas emissions inventory<br />
and projections<br />
2. Because of its small size and limited industrial<br />
base, Northern Ireland accounts for a relatively<br />
small proportion of the <strong>UK</strong>’s greenhouse gas<br />
emissions. In 2003, the latest year for which<br />
disaggregated data is available, greenhouse gas<br />
emissions accounted for three per cent of the<br />
<strong>UK</strong> total.<br />
3. Total greenhouse gas emissions in 2003 were<br />
3.5 per cent below the 1990 base year. While<br />
there has been improvement, the reduction is not<br />
as marked as in the <strong>UK</strong> as a whole. This partly<br />
reflects the different sector mix, the smaller<br />
industrial base in Northern Ireland, a larger<br />
agriculture sector, and historically low availability<br />
of natural gas. The largest reductions have taken<br />
place in the residential, and energy supply<br />
sectors, whereas emissions in the business and<br />
transport sectors continue to grow. The<br />
breakdown by sector for 2003 is shown below.<br />
While there are no disaggregated emission<br />
reduction targets for the devolved<br />
administrations, specific energy efficiency targets<br />
apply in a number of sectors in Northern Ireland<br />
and progress on achieving these is monitored.<br />
The impacts of climate change in<br />
Northern Ireland<br />
4. The Department of the Environment (DOE) in<br />
Northern Ireland has taken forward a number of<br />
initiatives to promote understanding and<br />
awareness of climate change impacts. Much of<br />
this work has been developed in co-ordination<br />
with the <strong>UK</strong> <strong>Climate</strong> Impacts <strong>Programme</strong> (<strong>UK</strong>CIP).<br />
A comprehensive report on Implications of<br />
<strong>Climate</strong> <strong>Change</strong> for Northern Ireland: Informing<br />
Strategy Development 16 , published in 2002 by the<br />
Scotland and Northern Ireland Forum for<br />
Environmental Research (SNIFFER), examined the<br />
likely impacts of climate change across a wide<br />
range of sectors. The key impacts identified<br />
include potentially adverse effects on public<br />
health, the likelihood of more accidents and<br />
damage from extreme weather events and<br />
threats to vulnerable eco-systems.<br />
5. The DOE has recently commissioned SNIFFER to<br />
provide an updated report on the implications of<br />
climate change for Northern Ireland. This study<br />
16www.ukcip.org.uk/resources/publications/documents/ Northern_Ireland.pdf
154<br />
Northern Ireland<br />
Northern Ireland and <strong>UK</strong> greenhouse gas emissions by sector in 2003<br />
Sector Greenhouse Gas Emissions (MtC) 1 % <strong>Change</strong> Northern Ireland as<br />
1990 2003 1990-2003 % of <strong>UK</strong> 2 (2003)<br />
Business 0.46 0.60 +30 2<br />
Waste Management 0.10 0.06 -44 2<br />
Industrial Process 0.20 0.05 -75 1<br />
Transport 0.94 1.28 +36 4<br />
Residential 1.14 0.90 -20 4<br />
Energy Supply 1.51 1.39 -8 2<br />
Agriculture 1.38 1.35 -3 11<br />
Land Use <strong>Change</strong> Emission 0.32 0.27 -16 7<br />
Public 0.08 0.04 -55 1<br />
Total Emissions 6.14 5.94 -3.4 3<br />
Land Use <strong>Change</strong> 3 : Removal** -0.22 -0.22 2 5<br />
Total Net Emissions 5.92 5.71 -3.5 3<br />
Notes:<br />
1 Base year and 2003 emission figures taken from the Greenhouse Gas Inventories for England, Scotland, Wales and Northern Ireland 1990-2003 (Baggott et<br />
al., 2005). The emissions estimates for Scotland, Wales and Northern Ireland inventories are subject to greater uncertainty than the consolidated <strong>UK</strong> estimates.<br />
2 <strong>UK</strong> figures exclude unallocated emissions. This affects energy supply and transport (where emissions due to military transport, fishing and domestic aviation<br />
are unallocated).<br />
3 Land use change removals is a sink and, therefore, removes carbon. Thus, the percentage change between 1990 and 2003 (in column 3) has therefore been<br />
shown as a positive to reflect the fact that the capacity of the sink has increased.<br />
will incorporate a risk assessment and will<br />
recommend adaptation strategies for the key<br />
impacts. This work is due to be completed by the<br />
end of <strong>2006</strong> and its results will help to inform<br />
Northern Ireland’s input to the <strong>UK</strong> Adaptation<br />
Policy Framework.<br />
6. The DOE’s Environment and Heritage Service<br />
maintains a database on 13 indicators of climate<br />
change including rainfall, temperature, and the<br />
responsive behaviour of birds and insects.<br />
A report on <strong>Climate</strong> <strong>Change</strong> Indicators for<br />
Northern Ireland 17 published in 2004, indicated<br />
that since 1840, nine of the fifteen warmest<br />
years recorded have occurred since 1990. It also<br />
pointed to evidence of:<br />
• average temperatures increasing;<br />
• an increase in the growing season;<br />
• number of snow days decreasing; and<br />
• swallows and butterflies being sighted<br />
progressively earlier.<br />
7. The database will be updated annually and will<br />
form the basis of ongoing monitoring of climate<br />
change impacts in Northern Ireland.<br />
8. To promote awareness of climate change, the<br />
Environment and Heritage Service issued a<br />
guidance booklet 18 for public bodies on climate<br />
change impacts in Northern Ireland, with<br />
information on how climate change will impact<br />
across sectors and on the delivery of key public<br />
services. It includes checklists for public<br />
authorities in assessing their vulnerability to<br />
climate change.<br />
9. DOE’s Planning Service recently completed a<br />
public consultation on a draft Planning Policy<br />
Statement (PPS15) on Planning & Flood Risk.<br />
PPS15 seeks to reduce flood risks to people,<br />
property and the environment and adopts a<br />
precautionary approach to decision-making,<br />
taking account of climate change and<br />
acknowledging the wider sustainability objectives<br />
of the Northern Ireland Administration.<br />
Publication of the final PPS is anticipated by<br />
April <strong>2006</strong>.<br />
17www.ehsni.gov.uk/pubs/publications/ccicover2.pdf<br />
18A summary of the possible impacts can be found at: http://www.ehsni.gov.uk/pubs/publications/guidanceweb.pdf
Northern Ireland<br />
155<br />
Northern Ireland Energy Study 2002<br />
10. In order to establish a robust baseline for its<br />
work in Northern Ireland, the Carbon Trust, in<br />
partnership with Invest Northern Ireland,<br />
undertook a major scoping study into the use<br />
of energy in Northern Ireland during 2002.<br />
The purpose was to reconcile a variety of data<br />
sources across the main energy supply and<br />
energy demand sub-sectors. Published in October<br />
2003, the Northern Ireland Energy Study 2002 19<br />
remains a valuable and authoritative cross sector<br />
view of the Northern Ireland energy landscape.<br />
11. Building on the baseline established by the study,<br />
the Northern Ireland Vision Study 20 set out to<br />
determine how Northern Ireland could best<br />
achieve the deep carbon cuts required to deliver<br />
on the <strong>UK</strong> Government’s national emission<br />
reduction targets. The Vision Study recognises<br />
that the Northern Ireland of 2050 is likely to be<br />
very different to today, and that high growth<br />
rates may be less realisable as climate change<br />
impacts become more evident. The study<br />
produced an Initial Action Plan 21 to help initiate<br />
change, while still striving to develop a vibrant<br />
and prosperous economy. The ten-point Vision<br />
Study Action Plan sets out immediate actions,<br />
building options for the future, and cross cutting<br />
actions.<br />
Energy supply<br />
12. There have been a number of developments in<br />
the power generation sector in Northern Ireland<br />
in recent years that have contributed to a<br />
significant decline in emissions from electricity<br />
generation. The Belfast West coal fired power<br />
station closed in 2002 and a new combined cycle<br />
gas turbine (CCGT) was opened at Ballylumford<br />
in 2003. Another CCGT plant was commissioned<br />
in July 2005 at Coolkeeragh near Londonderry.<br />
This switch from coal and oil stations to more<br />
efficient gas-fired stations has had a positive<br />
impact on carbon dioxide emissions. In 2003, the<br />
Energy Supply sector contributed 31 per cent of<br />
carbon dioxide emissions in Northern Ireland.<br />
This is expected to decline further due to<br />
structural changes in the generation industry and<br />
due to a number of sectors participating in the<br />
EU emissions trading scheme.<br />
13. Northern Ireland’s electricity and gas markets are<br />
no longer isolated but are inter-connected into<br />
national and EU networks. In the next decade<br />
there will be an expansion of the gas network<br />
beyond the greater Belfast area. A multi-million<br />
pound project is currently underway involving the<br />
construction of a gas pipeline from Dublin to<br />
Antrim, the South-North pipeline, which will link<br />
with another new pipeline from near<br />
Carrickfergus to Londonderry, the North-West<br />
pipeline. This will result in the roll-out of gas to<br />
towns along the path of the new transmission<br />
network.<br />
14. The introduction of natural gas into the Greater<br />
Belfast area since 1996 has brought significant<br />
environmental benefits as customers have<br />
switched from oil and coal to the more efficient<br />
fuel. By 2004, emissions of carbon dioxide had<br />
fallen by 0.30 MtC as a result of this change.<br />
The South-North and North-West pipelines are<br />
expected to reduce carbon dioxide emissions by<br />
some 0.11 MtC per annum.<br />
15. The vision and challenges of the 2003 Energy<br />
White Paper are reflected in the Strategic Energy<br />
Framework for Northern Ireland published in June<br />
2004 by the Department of Enterprise Trade and<br />
Investment (DETI). Key targets are:<br />
19www.thecarbontrust.co.uk/carbontrust/about/publications/ NI_2003_Energy_Study.pdf<br />
20www.thecarbontrust.co.uk/carbontrust/about/publications/CTC520.pdf<br />
21www.thecarbontrust.co.uk/carbontrust/about/publications/CTC501.pdf
156<br />
Northern Ireland<br />
• by 2012 at least 12 per cent of electricity<br />
consumed in Northern Ireland must be from<br />
indigenous renewable energy sources, at least<br />
15 per cent of which must be generated by a<br />
renewable source other than wind power; and<br />
• to achieve a 1 per cent reduction in electricity<br />
consumption in Northern Ireland in each year<br />
from 2007 to 2012.<br />
16. The latter target is challenging in the context of<br />
a 2 per cent per annum growth rate in<br />
consumption in recent years. DETI is leading a<br />
working group to co-ordinate actions to deliver<br />
this target and to develop an effective framework<br />
with agreed strategic objectives for energy<br />
efficiency.<br />
Renewable energy<br />
17. The main driver for increasing the use of<br />
renewable energy is the Northern Ireland<br />
Renewables Obligation (NIRO) which was<br />
introduced on 1 April 2005. The NIRO operates<br />
alongside the Renewables Obligation in the <strong>UK</strong>.<br />
Renewable generating capacity is now around<br />
120 megawatts, a threefold increase over that<br />
delivered under the Non-Fossil Fuel Obligation<br />
schemes of the late 1990s.<br />
18. On the demand side, the percentage of electricity<br />
consumed in Northern Ireland from renewable<br />
energy sources is currently around 6 per cent<br />
with indigenous renewables generation having<br />
doubled over the past 2 years, representing over<br />
50 per cent of renewables consumption. There<br />
are currently 15,000 consumers using renewable<br />
energy electricity and every school, library and<br />
the majority of hospitals are supplied with<br />
renewable energy.<br />
19. The main non-fossil resource available in Northern<br />
Ireland for electricity production is wind energy,<br />
mainly onshore but also with a significant<br />
offshore potential. This produces electricity at the<br />
lowest cost of all the renewable options. There<br />
are currently ten wind farms supplying the grid as<br />
well as commercial scale wind turbines installed<br />
to serve specific businesses. Large-scale wind<br />
powered projects are expected to make the<br />
largest contribution to electricity generation from<br />
renewables over the next decade. The<br />
deployment of small-scale wind powered systems<br />
is also being promoted in disadvantaged rural<br />
areas through the Wind Energy for Rural<br />
Businesses Project. This is a EU funded<br />
programme which provides financial support to<br />
rural businesses to meet their energy costs<br />
through the installation of small scale (20kw)<br />
wind turbines.<br />
20. There is already considerable interest in the<br />
growing and utilisation of Short Rotation Coppice<br />
willow biomass. Over the longer term, it is<br />
anticipated that biomass, solar power, wave and<br />
tidal power will provide an increasing<br />
contribution to renewable energy as technologies<br />
are developed and their potential is realised.<br />
<strong>Change</strong>s in the Common Agriculture Policy and<br />
implementation of the EC Nitrates Directive<br />
should provide an incentive for farm<br />
diversification into energy crops, and the<br />
development of renewable energy solutions for<br />
the disposal of livestock manure and residues.<br />
Research work in these areas is ongoing.<br />
21. The Department of Agriculture and Rural<br />
Development in Northern Ireland has been<br />
leading an inter-departmental group to examine<br />
the potential for renewable energy production<br />
from the agri-food and forestry sectors to<br />
contribute to Northern Ireland’s wider renewables<br />
obligations and to provide economic<br />
opportunities for rural communities in Northern<br />
Ireland. To inform this work, a wide ranging study<br />
was undertaken to investigate the potential<br />
market for, and economic and environmental<br />
sustainability of, small-scale imbedded heat and<br />
power and heat only systems in the rural<br />
economy. The potential of bio-fuel crops to<br />
provide energy for transportation was also<br />
addressed. Draft policy recommendations were<br />
issued for public consultation in September 2005;<br />
a policy position and action plan will follow.
Northern Ireland<br />
157<br />
• building market capacity through providing<br />
infrastructure and supply chain development –<br />
with a focus on bio-energy and energy crops;<br />
and<br />
• underpinning knowledge and raising<br />
awareness.<br />
Tidal power generation<br />
In December 2005, Marine Current Turbines<br />
Ltd, one of the world’s leading developers of<br />
tidal stream energy, announced that it had<br />
chosen Strangford Lough as a test bed for the<br />
development of clean, renewable electricity<br />
using tidal power generation. Strangford<br />
Lough has one of the strongest currents in the<br />
<strong>UK</strong> and provides an ideal location for the<br />
company to test a pre-commercial device.<br />
If successful, this could have considerable<br />
potential for harnessing the tidal resource off<br />
the North East Antrim Coast. The pilot project<br />
which is planned to commence in the autumn<br />
<strong>2006</strong> will be closely monitored, also in relation<br />
to assessing any potential environmental<br />
impacts of the technology on the Lough itself.<br />
26. In February <strong>2006</strong> a £59m Environment and<br />
Renewable Energy funding package was<br />
launched to enhance and accelerate the<br />
development and deployment of renewables over<br />
the next two years. It will support actions in four<br />
broad programmes:<br />
• research and demonstration – including<br />
flagship projects in energy from waste and<br />
biomass;<br />
• accelerated deployment of renewables and<br />
energy efficiency – mainly capital projects<br />
including a focus on public buildings and<br />
households;<br />
27. Awareness of the benefits of renewable energy<br />
for both domestic and industrial users is being<br />
championed throughout Northern Ireland by<br />
Action Renewables 22 – a joint initiative<br />
established in 2003 between the DETI and the<br />
Viridian Group. The key objectives are to increase<br />
awareness of renewable energy amongst the<br />
general public and to create a renewable energy<br />
installer academy, in partnership with Sustainable<br />
Energy Ireland, which will improve the quality of<br />
small-scale renewable energy installations and<br />
increase market competitiveness throughout<br />
Northern Ireland and the six border counties of<br />
the Republic of Ireland.<br />
CHP<br />
28. Policy for Combined Heat and Power is devolved<br />
to the Northern Ireland Administration. Northern<br />
Ireland has a CHP capacity of approximately 2 per<br />
cent of the installed electricity generating<br />
capacity compared with the <strong>UK</strong> figure of 7.6 per<br />
cent. There are two main factors contributing to<br />
this gap. Firstly, Northern Ireland has a relatively<br />
low industrial/manufacturing base and secondly,<br />
the limited availability of natural gas in Northern<br />
Ireland. Despite these drawbacks Northern Ireland<br />
has performed well in other ways with twice as<br />
many CHP plants, on a per capita basis, in the<br />
non-industrial sectors as the rest of the <strong>UK</strong>.<br />
In 2005 Northern Ireland had 68 CHP schemes<br />
with a total electricity generating capacity of<br />
33.1 MW.<br />
29. A small group of stakeholders is currently<br />
considering a revised CHP strategy for Northern<br />
Ireland in parallel with the transposition of the EU<br />
Cogeneration Directive. Consultations are also<br />
underway with the Republic of Ireland with a<br />
22www.actionrenewables.org/
158<br />
Northern Ireland<br />
view to ensuring that any CHP policy might,<br />
where possible, also align on an all island basis.<br />
IPPC<br />
30. Implementation of the Integrated Pollution<br />
Prevention and Control Directive (96/61/EC) is<br />
devolved and has been implemented in Northern<br />
Ireland through the Pollution Prevention and<br />
Control Regulations (Northern Ireland) 2003<br />
(PPC). Each installation requires a PPC permit<br />
issued by the DOE’s Environment and Heritage<br />
Service. Some 60 industrial installations have<br />
been permitted under PPC in Northern Ireland so<br />
far and around 250 installations in total will be<br />
subject to IPPC controls by the end of 2007.<br />
EU emissions trading scheme<br />
Compressed air systems<br />
Over the past two years the Carbon Trust<br />
commissioned seventy specialist energy surveys<br />
looking solely at compressed air systems in<br />
Northern Ireland businesses. Between them the<br />
local businesses surveyed were spending<br />
around £7.6m annually on electricity to<br />
generate, treat, and distribute compressed air.<br />
As a result of the Carbon Trust intervention,<br />
annual savings of £2.3m (31 per cent) and<br />
26,400 tCO 2<br />
were identified for a one-off<br />
investment cost of £3m, and an overall simple<br />
payback of 16 months. Within 12 months of<br />
receipt of the survey reports, these businesses<br />
had implemented recommendations with<br />
annual savings of £1.5m and 17,000 tCO 2<br />
, and<br />
plans for further investment to realise<br />
additional savings.<br />
31. There are currently 28 industrial plants in<br />
Northern Ireland participating in the EU Emissions<br />
Trading Scheme, from a wide range of sectors<br />
including power generation, food and drink,<br />
and cement manufacturing.<br />
Support for businesses<br />
32. Over the past three years the Carbon Trust has<br />
been working successfully in partnership with<br />
Northern Ireland businesses and the public sector<br />
through energy surveys, interest free loans to<br />
fund energy saving projects, Enhanced Capital<br />
Allowances/Energy Technology List 23 , design<br />
advice and training events. It has developed a<br />
comprehensive suite of design guidance<br />
documentation and has put in place an<br />
unparalleled range of skills transfer mechanisms<br />
to support local construction professionals. A key<br />
Northern Ireland-specific concept is the Low<br />
Carbon Design Initiative. This was launched in<br />
2003 and seeks to ensure that the new<br />
generation of buildings are of a world class<br />
standard with respect to low energy/carbon<br />
design.<br />
Waste management<br />
33. The Northern Ireland Landfill Allowances Scheme,<br />
introduced in April 2005, provides the mechanism<br />
for reducing biodegradable municipal waste<br />
(BMW) sent to landfill. The targets are to reduce<br />
landfilling of BMW to 75 per cent of 1995 levels<br />
by 2010, to 50 per cent of 1995 levels by 2013<br />
and to 35 per cent of 1995 levels by 2020.<br />
Northern Ireland has a deficit of waste<br />
management infrastructure due to historical<br />
reliance on landfill as the cheapest option for<br />
waste disposal. Northern Ireland’s revised Waste<br />
Management strategy, due for publication in<br />
Spring <strong>2006</strong>, will focus on the provision and<br />
funding of the physical infrastructure necessary<br />
to deliver the EU Landfill Directive targets.<br />
Transport<br />
34. Road transport emissions in Northern Ireland<br />
continue to increase. This is now the second<br />
largest source of carbon dioxide emissions,<br />
comprising around 27 per cent of the Northern<br />
Ireland carbon dioxide emissions in 2003. This<br />
23www.eca.gov.uk/etl/
Northern Ireland<br />
159<br />
contribution is likely to increase as road traffic<br />
continues to grow.<br />
35. An integral feature of Northern Ireland’s Regional<br />
Development Strategy is the Regional<br />
Transportation Strategy 2002-2012 (RTS) which<br />
provides a framework for the future planning,<br />
funding and delivery of land-based transportation<br />
throughout Northern Ireland. A major aim of the<br />
RTS is to start a strategic move away from a<br />
transport system that is dominated by car use<br />
towards a more balanced and integrated system<br />
in which walking, cycling and public transport will<br />
be more viable and attractive options.<br />
36. Walking and cycling are being encouraged by the<br />
provision of specifically designed physical<br />
measures, including the construction of additional<br />
footways, cycle lanes and cycle parking stands.<br />
Rail infrastructure and services have improved<br />
with the introduction of new trains. The first<br />
phase of the Belfast “Metro” high frequency<br />
network bus service, introduced in February<br />
2005, has improved passenger access, comfort<br />
and convenience.<br />
37. Land use planning is key to determining travel<br />
behaviour. Planning Policy Statement 13 on<br />
Transportation and Land Use was published in<br />
March 2005 to provide strategic policy guidance<br />
and advice on the integration of transportation<br />
and land use. Planning Policy Statement 3 on<br />
Access, Movement and Parking translates the<br />
strategic guidance on these issues into detailed<br />
operational policies. Both planning policy<br />
statements introduce an assessment of the<br />
potential transport impacts of the proposed<br />
development and seek for the first time to<br />
integrate transport policy and planning.<br />
38. The Department for Regional Development’s<br />
Travelwise scheme is being promoted within the<br />
Northern Ireland Civil Service to encourage staff<br />
to rely less on private cars and to make greater<br />
use of car sharing, cycling and public transport.<br />
Conversion of fleet vehicles to more<br />
environmentally friendly alternatives and or fuels<br />
is another goal.<br />
39. In rural areas, where passenger numbers are low,<br />
alternatives to conventional bus services include<br />
community-based initiatives and the use of<br />
smaller vehicles. The Rural Transport Fund<br />
provides grant aid to support these initiatives.<br />
Households<br />
40. The inventory of greenhouse gas emissions<br />
indicates that the household sector in Northern<br />
Ireland contributes around 20 per cent of<br />
Northern Ireland’s carbon dioxide emissions.<br />
This amounts to 4 per cent of <strong>UK</strong> domestic<br />
emissions, which is slightly higher than what<br />
would be expected from the population size<br />
(3 per cent of the <strong>UK</strong> population). A contributory<br />
factor is the limited availability of natural gas for<br />
home heating resulting in higher consumption of<br />
oil and coal, although the latter is on the decline<br />
due to central heating conversions.<br />
41. In partnership with public, private and voluntary<br />
sector organisations to improve energy efficiency<br />
in the housing stock and to tackle fuel poverty, a<br />
wide range of programmes and initiatives are<br />
being promoted by the Northern Ireland<br />
Administration. The Northern Ireland Housing<br />
Executive invests around £40m per annum on<br />
heating conversions, double-glazing and<br />
insulation works. The Housing Executive’s policy is<br />
that natural gas should be the fuel of choice for<br />
domestic heating where supply is available. As a<br />
result of these measures and fuel switching in the<br />
private sector there have been significant changes<br />
in the domestic fuel mix in the eight years<br />
between 1996 and 2004, with solid fuel declining<br />
from 40 per cent to 8 per cent. Oil has risen from<br />
36 per cent to 65 per cent and natural gas has<br />
risen from zero to 8 per cent. The 2004 interim<br />
House Condition Survey indicated a 17.2 per cent<br />
improvement in energy efficiency from 1996 to<br />
2004. The associated carbon dioxide savings are<br />
of the order of 0.55 MtC per annum.<br />
42. In partnership with other agencies, the Housing<br />
Executive is also piloting a range of renewable<br />
technologies on “hard to heat” homes which are<br />
defined as properties with solid walls, off the gas
160<br />
Northern Ireland<br />
network. The installations include solar PV panels<br />
(photovoltaic), solar water heating, solar air<br />
heating, wind turbine, ground source heat pumps<br />
and a prototype high efficiency oil-condensing<br />
boiler. A partnership-funded micro CHP trial<br />
involving around 50 homes, across all tenures, is<br />
also underway with 17 installations to date. The<br />
trial will be used to assess the effectiveness of the<br />
technologies and will also be used to help<br />
stimulate the market.<br />
Energy efficiency<br />
43. During 2004-05, support for the domestic and<br />
non-commercial elements of the Energy Efficiency<br />
<strong>Programme</strong> came from DETI as part of a package<br />
of measures to reduce electricity costs. The much<br />
smaller commercial element of the programme<br />
continues to be funded through a levy on all<br />
electricity customers.<br />
Fuel poverty<br />
46. Northern Ireland has the highest level of fuel<br />
poverty in the United Kingdom. In November<br />
2004, the Department for Social Development<br />
launched the Ending Fuel Poverty, A Strategy for<br />
Northern Ireland 24 which aims to eliminate fuel<br />
poverty in vulnerable households and the social<br />
rented sector by 2010 and in non-vulnerable<br />
households by 2016. A Fuel Poverty Advisory<br />
Group was established in April 2005 to monitor<br />
and review the strategy and to promote a<br />
partnership approach to tackling fuel poverty.<br />
Since 2001 over 4,600 owner-occupiers have<br />
received central heating and over 16,000 have<br />
received cavity wall and/or loft insulation under<br />
the Warm Homes Scheme.<br />
Agriculture<br />
44. The Northern Ireland Authority for Energy<br />
Regulation set the framework for the programme<br />
with the Energy Saving Trust fulfilling the role of<br />
evaluating, assessing and auditing schemes.<br />
Seventeen individual energy efficiency schemes<br />
were implemented by Northern Ireland Electricity<br />
with an investment of £3.72m, providing whole<br />
house energy efficiency solutions for over 1,700<br />
homes throughout Northern Ireland and<br />
delivering 340 GWh of energy. The schemes are<br />
estimated to deliver carbon savings of 100,332<br />
tonnes.<br />
45. Prior to April 2005, there were three Energy<br />
Efficiency Advice Centres (EEACs) funded by the<br />
Energy Saving Trust in Northern Ireland with<br />
offices in Belfast, Londonderry and Enniskillen.<br />
The Energy Saving Trust is currently piloting the<br />
concept of a Sustainable Energy Network with<br />
the creation of separate Sustainable Energy<br />
Centres (SECs) in three areas of the <strong>UK</strong>, one of<br />
which is in Northern Ireland.<br />
47. Northern Ireland’s important agricultural sector<br />
currently contributes around 22 per cent of<br />
Northern Ireland’s total greenhouse gas<br />
emissions. In 2003 agriculture contributed 91 per<br />
cent of Northern Ireland’s methane emissions and<br />
88 per cent of nitrous oxide emissions. Methane<br />
emissions have declined by 4 per cent from 1990,<br />
while nitrous oxide emissions have fallen by 10<br />
per cent.<br />
48. The current Northern Ireland Rural Development<br />
<strong>Programme</strong> comprises a range of agrienvironment<br />
schemes including the Countryside<br />
Management Scheme (CMS), the Environmentally<br />
Sensitive Area (ESA) Scheme and the Organic<br />
Farming Scheme. Some 30 per cent of Northern<br />
Ireland’s 28,000 farm businesses currently<br />
participate in this agri-environment programme.<br />
This is expected to rise to 50 per cent by mid-<br />
<strong>2006</strong>. CMS and ESA participants are required to<br />
adopt environmentally friendly farming practices<br />
such as ungrazed grass margins or the<br />
introduction of tree-planted margins.<br />
24www.dsdni.gov.uk/ending_fuel_poverty_-_a_strategy_for_ni.pdf
Northern Ireland<br />
161<br />
Forestry<br />
Public sector<br />
49. Forest policy is currently under review in Northern<br />
Ireland with an emphasis on forest expansion and<br />
a commitment to encourage afforestation. Grant<br />
aid incentives are provided to complement the<br />
reform of the Common Agricultural Policy and to<br />
maximise the potential for the forestry sector to<br />
contribute to sustainable development. The<br />
Department of Agriculture and Rural<br />
Development’s consultation paper, Options for<br />
Forestry (DARD, 2004 27 ), recognised the value of<br />
trees in removing carbon dioxide from the<br />
atmosphere and indicated that the Forest Service<br />
would work with others to pursue opportunities<br />
for carbon sequestration.<br />
50. The Forest Service has operated a Challenge Fund<br />
for Short Rotation Coppice Energy Crops since<br />
August 2004 to encourage the establishment of<br />
short rotation willow coppice for renewable<br />
energy generation. To date, 200 hectares have<br />
been planted with an additional 350 hectares<br />
already agreed or in the planning stage. The Fund<br />
operates under the umbrella of the current Rural<br />
Development Regulation running from 2000 to<br />
<strong>2006</strong>. Support is expected to be extended into<br />
the successor programme from 2007 to 2013.<br />
51. The Department of Finance and Personnel (DFP)<br />
in Northern Ireland has overall responsibility for<br />
the promotion of energy efficiency in public<br />
sector bodies. While this is a devolved matter,<br />
Ministers have agreed to work towards the<br />
national targets in the Sustainable Development<br />
Framework for the Government Estate. The DFP<br />
has developed a customised software programme<br />
for recording and analysing the energy<br />
performance of all buildings occupied by<br />
Northern Ireland public bodies. The system<br />
enables energy performance to be compared with<br />
nationally accepted benchmarks.<br />
52. The DFP manages a Central Energy Efficiency<br />
Fund to finance energy efficiency improvements<br />
in the public sector. Since natural gas became<br />
available in 1996, some 125 government<br />
buildings in Northern Ireland have been<br />
converted to natural gas as the fuel of choice.<br />
This conversion programme has secured a 20,000<br />
tonne reduction of carbon dioxide emissions over<br />
the eight years to 2004. Similar action has been<br />
taken by many other public bodies including<br />
District Councils, Health Trusts, Education and<br />
Library Boards, and the Police Service of Northern<br />
Ireland. Since 2001, there has been a steady<br />
Balcas combined heat and power plant and wood pellet production<br />
Balcas Timber, one of the largest saw mills in the British Isles, based near Enniskillen in County Fermanagh,<br />
obtained grant aid from the <strong>UK</strong> Government’s Department of Trade and Industry’s Bio energy Capital Grant<br />
Scheme to support a £10m investment in the development of a wood fired combined heat and power (CHP)<br />
generator in tandem with a wood pellet production facility.<br />
The plant uses 180,000 tonnes of surplus wood chip and sawdust, produced as a co-product of Balcas sawn<br />
timber production, to provide its own power requirements (saving the company up to £1,000,000 per year<br />
in electricity costs) as well as producing heat for timber drying kilns and the production of pellets. The<br />
company has succeeded in securing deals with<br />
two major power stations in England which will<br />
purchase the pellets for co-firing. The fuel also<br />
has great potential as a renewable energy<br />
alternative to wind for small-scale commercial<br />
and domestic use. With a target pellet<br />
production of 50,000 tonnes per year, this is one<br />
of the largest plants of this nature in Europe.<br />
25www.forestserviceni.gov.uk/home.htm
162<br />
Northern Ireland<br />
increase in the amount of green electricity<br />
purchased. Central Government departments<br />
currently purchase around 11,000,000 kWh of<br />
green electricity annually, representing some<br />
30 per cent of their electricity requirements.<br />
53. The DFP and the Northern Ireland Strategic<br />
Investment Board are jointly undertaking a<br />
strategic review of accommodation needs for the<br />
Northern Ireland Government estate (Workplace<br />
2010). This will ensure that only buildings in the<br />
top quartile of energy performance are procured.<br />
The review also seeks to reduce the number of<br />
buildings occupied by departments and to make<br />
better and more efficient use of space. This will<br />
achieve efficiencies in energy use and further<br />
reduce emissions. As a result of the<br />
improvements in energy efficiency, the normalised<br />
carbon dioxide performance of the Northern<br />
Ireland public sector has shown an improvement<br />
from 141 kgCO 2<br />
/m 2 in 1989-90 to 80 kgCO 2<br />
/m 2<br />
in 1999-2000 to 72 kgCO 2<br />
/m 2 in 2003-04.<br />
Energy efficiency in the public sector<br />
The proposed new library at Queen’s University<br />
will recover and use waste heat generated by<br />
its computer centre to heat the rest of the<br />
building using ground water heating/cooling<br />
and heat pump technology.<br />
Omagh College of Further and Higher<br />
Education has installed a biomass boiler which<br />
feeds into an under-floor heating system to<br />
heat the industrial wing of it new campus.<br />
The Environment and Renewable Energy Fund<br />
will provide means for a biomass heat network<br />
to supply the heating needs for several of the<br />
buildings in the Stormont Estate. If this is based<br />
on a CHP system, it is estimated that this<br />
network will be capable of meeting around<br />
40 per cent of the electrical demand for those<br />
buildings.<br />
Public procurement<br />
54. The Northern Ireland Government is committed<br />
to taking action towards sustainable procurement<br />
and using the power of procurement spend to<br />
transform markets and influence the supply<br />
chain, for example by increasing the amount of<br />
energy bought from renewable sources, by<br />
buying from suppliers who have established<br />
environmental credentials, and through “green”<br />
specifications. In addition, the DOE is currently<br />
piloting an Environmental Management Scheme<br />
for potential roll-out to the Northern Ireland Civil<br />
Service (NICS) as a whole.<br />
Building Regulations<br />
55. Part F of the Northern Ireland Building<br />
Regulations on minimum standards for<br />
conservation of fuel and power is being<br />
amended. The revision will have the effect of<br />
reducing carbon dioxide emissions from those<br />
buildings to which these regulations apply by up<br />
to 40 per cent. The amendment will also<br />
incorporate a number of the requirements under<br />
the EU Energy Performance of Buildings Directive.<br />
Monitoring and reporting<br />
56. Progress with these policies will be monitored as<br />
part of the roll-out of the Sustainable<br />
Development Implementation Plan. In an attempt<br />
to mainstream sustainable development across<br />
the Northern Ireland administration, the DOE is<br />
considering the development of a revised<br />
integrated impact assessment process. Efforts to<br />
change consumer behaviour and raise public<br />
awareness of climate change issues will be taken<br />
forward through the Sustainable Development<br />
Communication Strategy.
CHAPTER THREE<br />
Wales<br />
163<br />
The Welsh Assembly Government is committed<br />
to working with the <strong>UK</strong> Government, the<br />
other devolved administrations, the statutory,<br />
voluntary sector and business partners in<br />
Wales, and the community at large to tackle<br />
the threat of climate change.<br />
Introduction<br />
1. The Welsh Assembly Government recognises that<br />
climate change is one of the most important<br />
issues facing the world at the beginning of the<br />
21st Century. The Environment Strategy for<br />
Wales and its accompanying action plan<br />
which are due to be published in early <strong>2006</strong><br />
will provide details of further actions to be<br />
taken to address climate change. Scoping work<br />
has been carried out in each ministerial portfolio<br />
on how climate change mitigation and adaptation<br />
relates to current policies and programmes and<br />
will inform future policy choices.<br />
Greenhouse gas emissions inventory<br />
and projections<br />
2. In 2003, the latest year for which disaggregated<br />
data is available, Wales accounted for just over 2<br />
per cent of the <strong>UK</strong> total (disaggregated figures<br />
for 2004 will be available later in the year). This is<br />
3.2 per cent below the level in Wales for the<br />
1990 base year. Emissions of greenhouse gases in<br />
Wales in 2003 were 0.54 million tonnes lower<br />
than in 1990. A breakdown by sector follows:<br />
3. Industrial greenhouse gas emissions still account<br />
for a third of Wales’ total emissions. This is not<br />
unexpected as Wales has a much larger<br />
manufacturing sector than the <strong>UK</strong> average, with<br />
a strong heavy industry component. Nevertheless<br />
Wales has tremendous natural potential for<br />
renewable and alternative energy and has already<br />
set a target that by 2010; 4 TWh of its electricity<br />
demand will be generated from renewable<br />
energy sources. This is expected to make a<br />
contribution to the <strong>UK</strong>’s long-term aspiration to<br />
reduce carbon dioxide emissions by some 60 per<br />
cent emissions by around 2050.<br />
Wales and <strong>UK</strong> Greenhouse gas emissions by sector in 2003<br />
Sector Greenhouse Gas Emissions (MtC) 1 % <strong>Change</strong> Wales as % of<br />
1990 2003 1990-2003 <strong>UK</strong> 2 (2003)<br />
Business 3.21 2.85 -11.2 2.7<br />
Waste Management 0.38 0.15 -61.9 1.3<br />
Industrial Process 0.79 0.69 -12.2 3.5<br />
Transport 1.70 1.81 6.4 1.4<br />
Residential 1.12 1.30 16 1.5<br />
Energy Supply 473.40 4.95 4.6 2.3<br />
Agriculture 1.75 1.55 -11.4 3.3<br />
Land Use <strong>Change</strong> Emission 0.37 0.33 -10.8 2.2<br />
Public 0.23 0.13 -41.8 1.2<br />
Total Emissions 142.80 1375.00 -3.6 2.1<br />
Land Use <strong>Change</strong> 3 : Removal** -0.46 -37.00 -20.7 2.3<br />
Total Net Emissions 13.82 13.38 -3.2 2.1<br />
Notes:<br />
1 Base year and 2003 emission figures taken from the Greenhouse Gas Inventories for England, Scotland, Wales and Northern Ireland 1990-2003 (Baggott et<br />
al., 2005). The emissions estimates for Scotland, Wales and Northern Ireland inventories are subject to greater uncertainty than the consolidated <strong>UK</strong> estimates.<br />
2 <strong>UK</strong> figures exclude unallocated emissions. This affects energy supply and transport (where emissions due to military transport, fishing and domestic aviation<br />
are unallocated).<br />
3 Land use change removals is a sink and, therefore, removes carbon. Thus, the percentage change between 1990 and 2003 (in column 3) has therefore been<br />
shown as a positive to reflect the fact that the capacity of the sink has increased.
164<br />
Wales<br />
The impacts of climate change in<br />
Wales<br />
4. 150,000 residential properties, many commercial<br />
and industrial developments and other key<br />
infrastructure like power generation, transport<br />
links and schools as well as important<br />
environmental sites are situated on land at risk<br />
from flooding. Around half a million people live<br />
and work on flood plains and over £8bn worth of<br />
assets are at risk. The Environment Strategy for<br />
Wales will set out the Welsh Assembly<br />
Government’s strategic response to climate<br />
change, building on actions already underway in<br />
key sectors.<br />
• thermal discomfort in buildings and health<br />
problems in summer, including heat-related<br />
deaths linked to high air pollution.<br />
<strong>Climate</strong> change is predicted to have some local<br />
advantages, but these depend on the scale and<br />
rate of change of climate:<br />
• a longer growing season, and potential<br />
opportunities for agricultural diversification;<br />
• less cold-weather transport disruption<br />
balanced by greater disruption from storms;<br />
• reduced demand for winter heating; and<br />
• less cold weather related illness.<br />
The Environment Strategy for Wales<br />
5. The <strong>UK</strong> <strong>Climate</strong> <strong>Change</strong> Impact <strong>Programme</strong> has<br />
produced scenarios for changes in Wales over the<br />
period up to 2080. The potential negative<br />
impacts in Wales of the changes suggested by<br />
these scenarios include increased risk of:<br />
• river and coastal flooding and erosion;<br />
• pressure on sewer systems;<br />
• winter storm damage and coastal erosion;<br />
• habitat and species loss, for example in<br />
uplands and wetlands;<br />
• changes to the landscape;<br />
• summer water shortages and low stream<br />
flows (coupled with higher demand);<br />
• subsidence in prone areas; and<br />
6. The Environment Strategy for Wales will set the<br />
vision for the Environment in Wales through to<br />
2025. The consultation on the Strategy, Our<br />
Environment – Our Future – Your Views 26 ,<br />
contained climate change as a central theme and<br />
recognised that it has major implications for the<br />
Welsh Assembly Government’s policy agenda. The<br />
consultation ended on 3 October 2005. Around<br />
200 written responses were received, many of<br />
which commented on action to tackle climate<br />
change. The Environment Strategy will be<br />
supported by an action plan to deliver the<br />
vision set out in the Strategy.<br />
Sustainable Development Action Plan<br />
7. Wales has a legal obligation to have a Sustainable<br />
Development (SD) Scheme and build sustainable<br />
development into all policies and practices. The<br />
present SD Action Plan runs from 2004 to 2007.<br />
Addressing climate change is one of the key<br />
themes and is supported by commitments to<br />
mitigating the effects of climate change. As a<br />
result, various initiatives have been put in place<br />
since 2004, which are supported by national and<br />
area-specific commitments in the Welsh Assembly<br />
Government’s Wales Spatial Plan, People, Places,<br />
Futures. These are:<br />
26www.wlga.gov.uk/uploads/publications/978.pdf
Wales<br />
165<br />
• the Energy Route Map to be published in<br />
<strong>2006</strong> will set out the objective for a clean<br />
energy agenda, including the development of<br />
renewable energy. Clear targets for producing<br />
4 TWh (approximately 10 per cent) of energy<br />
from renewable sources by 2010 and 7 TWh<br />
by 2020 are already in place. A project has<br />
been commissioned to investigate the benefits<br />
and barriers to promoting the uptake of<br />
alternative fuels in Wales, such as biofuels,<br />
biogas, natural gas and hydrogen;<br />
• community renewables and innovative energy<br />
projects have been developed through a<br />
number of community projects and funded<br />
through the Objective 1 programme 29 .<br />
Additional funds have been secured to ensure<br />
that the work of the Carbon Trust in Wales<br />
can continue to support the uptake of energy<br />
efficiency practices;<br />
• research is in progress to develop guidelines<br />
on land-use for conservation of carbon stocks<br />
in soils. The guidelines will then be considered<br />
for implementation under the CAP reform and<br />
agri-environment policy;<br />
• a two-year contract from 2005 to 2007 is in<br />
place to supply all Assembly street lighting<br />
with 100 per cent green energy, as part of the<br />
Wales Street-lighting Energy Purchase<br />
consortium; and<br />
• a study has been commissioned to explore the<br />
feasibility of offsetting the carbon generated<br />
by road scheme.<br />
Consequently, because of transmission costs,<br />
consumers in south Wales pay some of the<br />
highest electricity prices in Great Britain. There is<br />
a relatively poor electricity transmission<br />
infrastructure in mid Wales.<br />
9. The Welsh Assembly Government is keen to<br />
encourage the development of small-scale<br />
renewable energy generation in Wales. This<br />
includes:<br />
• small hydro projects – these are already<br />
substantially developed in Wales. In addition<br />
smaller schemes have become viable as a<br />
result of the Renewables Obligation;<br />
• photovoltaic (PV) and micro wind – it is<br />
expected that the uptake of these<br />
technologies will increase in the future as they<br />
continue to advance and economy of scale<br />
will be making them more economical;<br />
• biomass and biofuels – will continue to be<br />
important as the results of studies and<br />
demonstration projects are being evaluated;<br />
and<br />
10. On large scale renewables, as well as looking<br />
to generate 800MW from new large windfarms<br />
being built in accordance with the TAN 8<br />
planning guidance, the Welsh Assembly<br />
Government believes the time is now right to<br />
further investigate building proposals, including<br />
the major environmental impacts, for a major<br />
low-carbon energy-generating Severn Barrage.<br />
Energy supply<br />
8. The Welsh energy policy faces the challenge of<br />
fuelling an internationally competitive economy<br />
while maintaining the highest environmental<br />
standards and mitigating climate change.<br />
Although Wales is a net exporter of electricity,<br />
there is a significant north-south divide in energy<br />
generation. Electricity is exported from the<br />
concentration of generating stations in north<br />
Wales while in south Wales a significant<br />
proportion of electricity is imported.<br />
27www.defra.gov.uk/rural/structure/obj1.htm
166<br />
Wales<br />
CHP<br />
11. Health estates in Wales have increased selfgeneration<br />
of CHP electricity by 11.7 per cent<br />
over the 2004-05 period. This accounts for 8 per<br />
cent of their total electricity requirement.<br />
Opportunities for micro CHP will feature in<br />
the Wales micro-generation strategy which<br />
is expected to be issued for consultation in<br />
Spring <strong>2006</strong>.<br />
12. The Welsh Assembly Government and Forestry<br />
Commission Wales administer the £7m Wood<br />
Energy Business Scheme which provides: (1)<br />
appropriate projects with capital grants to<br />
facilitate the installation and operation of<br />
woodfuel powered heating and power<br />
generation plants; and (2) equipment for initial<br />
processing of roundwood into chip and pellet<br />
form. In addition, clean energy technology<br />
development will be encouraged by collaboration<br />
between the Welsh Energy Research Centre<br />
(WERC) and the higher education sector in Wales.<br />
Households<br />
13. The Welsh Housing Quality Standard sets a<br />
minimum energy rating (SAP) 28 for social housing,<br />
requiring that the heating in the whole dwelling<br />
should be at comfortable level and reasonably<br />
economical in normal weather conditions. Social<br />
landlords must also take all cost-effective<br />
opportunities to upgrade the thermal and<br />
ventilation performance of dwellings.<br />
Development Quality Requirements (DQR) are the<br />
published design standards for all new housing<br />
built by Registered Social Landlords in Wales<br />
when using a Social Housing Grant. DQR requires<br />
that all housing must be built to an EcoHomes<br />
rating standard of ‘good’.<br />
14. Companies supplying gas or electricity have been<br />
actively promoting their Energy Efficiency<br />
Commitment (EEC) programmes to customers in<br />
Wales. The Welsh Assembly Government also<br />
works with the Energy Saving Trust and the<br />
Welsh Local Government Association to assist<br />
local authorities to meet their targets under the<br />
Home Energy Conservation Act and Policy<br />
Agreements. The Energy Saving Trust leads<br />
activity on domestic sector energy efficiency in<br />
Wales. Advice is offered to individual households<br />
and social landlords through the Energy Efficiency<br />
Advice Centres in Wales and the Welsh Local<br />
Government Association. The Welsh Assembly<br />
Government’s Energy Saving Wales portal<br />
website 29 , which was launched as a portal<br />
website in December 2005 will provide links to<br />
organisations with information, advice and<br />
support on energy efficiency and small scale<br />
renewable energy projects.<br />
Support to businesses<br />
15. The Welsh Assembly Government encourages<br />
businesses to take up the opportunities that low<br />
carbon technology offers. The Welsh<br />
Development Agency’s Environmental Goods and<br />
Services (EGS) scheme supports businesses<br />
engaged in environmental legislation market<br />
activities such as clean energy. The Welsh<br />
Assembly Government also sponsors the Carbon<br />
Trust in Wales. Their direct support services have<br />
helped Welsh organisations identify potential cost<br />
savings of around £11.5m, equating to 144,500<br />
tonnes of carbon dioxide emissions.<br />
EU emissions trading scheme<br />
16. The Welsh Assembly Government supports the<br />
EU ETS scheme and will be working closely with<br />
the <strong>UK</strong> Government to ensure that the second<br />
phase of the scheme recognises and addresses<br />
the specific needs of businesses based in Wales<br />
while delivering emissions savings.<br />
IPPC<br />
17. From 1 January <strong>2006</strong>, the Welsh Assembly<br />
Government became responsible for<br />
implementing the Integrated Pollution Prevention<br />
and Control Directive (96/61/EC) in Wales.<br />
28Standard Assessment Procedure<br />
29www.energysavingwales.org.uk/index.cfm?alias=about
Wales<br />
167<br />
Fuel poverty<br />
18. The 2004 Living in Wales survey indicated that in<br />
2004, the overall number of households living in<br />
fuel poverty in Wales was 130,000 or 11 per cent<br />
of all Welsh households. The Home Energy<br />
Efficiency Scheme (HEES) , the main programme<br />
to tackle fuel poverty in Wales has assisted over<br />
50,000 households since 2000.<br />
Waste management<br />
19. In June 2002, the Welsh Assembly Government<br />
published Wise about Waste: the National Waste<br />
Strategy for Wales, which sets down policies and<br />
targets for waste management across all waste<br />
streams. The Strategy seeks to ensure that Wales<br />
will meet its obligations under both <strong>UK</strong> and<br />
European legislation and its duty to promote<br />
sustainable development set in the Government<br />
of Wales Act 1998. Recycling and composting<br />
have increased from an historic base of 3 per<br />
cent to 5 per cent in 2004-05 to 19.4 per cent<br />
with targets of 25 per cent in <strong>2006</strong>-07 and<br />
40 per cent in 2009-10.<br />
<strong>Programme</strong>. This will assist them to become more<br />
resource efficient thus using fewer materials and<br />
less energy. Businesses are also being encouraged<br />
to use recycled materials through an industrial<br />
symbiosis programme to identify partners whose<br />
waste they can use as a raw material and are also<br />
being encouraged to reduce the amount of<br />
hazardous waste they produce and the<br />
hazardousness of that waste.<br />
Transport<br />
21. The Transport (Wales) Act <strong>2006</strong> sets the context<br />
for the development of a Wales Transport<br />
Strategy (WTS) and places a statutory<br />
requirement on the Welsh Assembly Government<br />
to develop a Transport Strategy. The WTS will<br />
replace the existing Transport Framework for<br />
Wales. The new Strategy will cover the<br />
period up to 2030 and a draft for<br />
consultation will be published in early<br />
summer <strong>2006</strong>. One of the over-arching<br />
objectives will be to reduce the impact of<br />
transport on climatic change, air and noise<br />
quality, water pollution, biodiversity, landscape<br />
and townscape. The WTS will include<br />
a Sustainable Distribution Strategy, which is<br />
being developed in consultation with the Wales<br />
Freight Group.<br />
22. A new Welsh Transport Appraisal Guidance<br />
(WELTAG) is also being developed and will be<br />
published later this year. WELTAG will be used to<br />
appraise the strategies developed by the WTS,<br />
including examination of the Strategic<br />
Environmental Assessment (SEA) requirements.<br />
On completion of the WTS, schemes and<br />
measures to support the strategies will be<br />
explored.<br />
20. The Welsh Assembly Government has made<br />
substantial financial resources available to local<br />
authorities to support delivery of the waste<br />
strategy, £93m over the three years to 2007-08.<br />
The Welsh Assembly Government has also<br />
allocated £9.5m support for businesses over three<br />
years to 2007-08 under the Materials Action<br />
Farming<br />
23. Making farming more sustainable is at the heart<br />
of “Farming for the Future”, the Welsh strategy<br />
for the agricultural industry. One of the concerns<br />
of the Welsh Assembly Government is to ensure<br />
that the carbon contents of soils in Wales are
168<br />
Wales<br />
conserved and enhanced. Current estimates of<br />
the carbon store are 350-480MtC, however there<br />
is recent evidence that this has decreased<br />
significantly over the past 25 years. Research is<br />
ongoing to understand better the land<br />
management methods to conserve soil carbon.<br />
24. The Rural Development Plan for Wales,<br />
covering the 2007-2013 programming period,<br />
will be published at the end of the year and<br />
will be a key tool to support the agri-environment<br />
agenda within the farming community.<br />
Forestry<br />
25. Forestry policy is entirely devolved to the Welsh<br />
Assembly Government. The Forestry Commission<br />
Wales acts as the Assembly’s department of<br />
forestry. Woodlands for Wales sets the Welsh<br />
Assembly Government policy for trees and<br />
woodlands. Much work has been undertaken by<br />
Coed Cymru 30 to develop products from Welsh<br />
hardwoods and softwoods, which both enhance<br />
the life of the forest carbon store and are a useful<br />
substitute for more energy intensive materials.<br />
Public sector<br />
26. The Sustainable Development Action Plan<br />
committed the Welsh Assembly Government to<br />
putting in place an Environmental Management<br />
System to be accredited to Green Dragon<br />
Environmental Standard 31 Level 5 by <strong>2006</strong>. Good<br />
progress has been made towards this goal. Level<br />
4 was achieved in 2005 and actions have been<br />
taken to achieve Level 5 in early <strong>2006</strong>. The<br />
Welsh Assembly Government is also<br />
committed to purchasing green electricity<br />
and currently procures approximately 90 per cent<br />
of its supplies from renewable sources. It will be<br />
looking to procure 100 per cent of its electricity<br />
supplies from renewable sources by 2010. Under<br />
the current round of Policy Agreements, local<br />
authorities have committed to reducing carbon<br />
dioxide emissions from Council buildings. The<br />
Carbon Trust’s Carbon Management service helps<br />
large organisations to assess how to combat the<br />
risks and take advantage of the opportunities<br />
associated with climate change.<br />
Education<br />
27. The Eco-schools project in Wales, supported by The<br />
Welsh Assembly Government, the Countryside<br />
Council for Wales and Awareness Wales, currently<br />
involves 1,100 schools in Wales though the target<br />
is to increase this to 1,700 by 2007. The Ecoschools<br />
programme encourages pupils to engage<br />
with environmental and sustainable development<br />
issues and so reduce the environmental impact<br />
of the school. Schools can also work towards<br />
obtaining the Eco-schools European Green Flag<br />
award, which is the national standard for parks<br />
and green spaces in England and Wales.<br />
128 schools have achieved this to date.<br />
NHS Estate<br />
28. The performance of health estates is improving,<br />
for example, absolute carbon dioxide emissions<br />
have been reduced by 7.5 per cent compared<br />
with the previous year’s figures and 3 per cent<br />
compared with the base year figures. There is<br />
increasing use of green electricity by Trusts, with<br />
North West Wales, Pontypridd & Rhondda, North<br />
East Wales and Gwent all supplementing their<br />
electrical demand, in part, from green electricity.<br />
The amount of self-generated CHP electricity has<br />
increased by 11.7 per cent over this period and<br />
accounts for 8 per cent of the total electricity<br />
requirement.<br />
Planning<br />
29. Planning Policy Wales, published in March 2002,<br />
sets out the Welsh Assembly Government’s<br />
planning policies and is supplemented by a series<br />
of technical advice notes (TANs), some of which<br />
are of particular relevance to climate change.<br />
30Coed Cymru is an all Wales initiative to promote the management of broadleaf woodlands and the use of locally grown hardwood timber.<br />
31www.greendragonems.com/
SECTION<br />
5Annexes
170<br />
ANNEX A<br />
Emissions projections<br />
Carbon dioxide<br />
1. Projections of the <strong>UK</strong>’s emissions of carbon<br />
dioxide are largely derived from the DTI Energy<br />
Model. This is a set of interlocking sub-models of<br />
the <strong>UK</strong> energy market including final user energy<br />
sectors and the electricity supply sector. It is a top<br />
down demand model, based on econometrically<br />
estimated relationships between energy demand,<br />
energy supply, economic activity and energy<br />
prices and a bottom–up supply side model. The<br />
demand side comprises over 150 equations<br />
linking historic fuel demand for residential,<br />
transport, industry, service and agriculture sectors.<br />
The supply side comprises data on every major<br />
power producer and other energy producing<br />
industries. The sector classification and the<br />
principal source of energy statistics is the Digest<br />
of <strong>UK</strong> Energy Statistics (D<strong>UK</strong>ES) 1 . The DTI model<br />
makes projections based on prospects for fossil<br />
fuel prices, economic growth and demographics.<br />
2. Rather than producing a single forecast, the<br />
projections provide a view of possible future<br />
levels of emissions and composition of energy<br />
demand based on agreed assumptions of world<br />
energy prices. This results in different scenarios<br />
within the umbrella of overall projected <strong>UK</strong><br />
economic growth. Even then, considerable<br />
uncertainties remain. These are discussed further<br />
in Annex B.<br />
3. Energy and emissions projections which informed<br />
the <strong>Climate</strong> <strong>Change</strong> <strong>Programme</strong> 2000 were<br />
published in November 2000 in Energy Paper 68.<br />
The exercise to provide updated energy and<br />
emissions projections began in April 2003 and<br />
Updated Energy Projections (UEP) are now<br />
published periodically. The UEP exercise includes<br />
significant improvements to the DTI model in<br />
several sectors. Key assumptions have been<br />
updated and revised and have been incorporated<br />
in the baseline. It also now includes all current<br />
government environmental policy measures as<br />
most recently evaluated, as described below.<br />
Baseline with measures projections underpinning<br />
the <strong>Climate</strong> <strong>Change</strong> <strong>Programme</strong> review were<br />
published in UEP 21, in February <strong>2006</strong> 2 .<br />
4. Government policies and measures introduced<br />
since the Kyoto Protocol was negotiated, and<br />
since the publication of the <strong>Climate</strong> <strong>Change</strong><br />
<strong>Programme</strong> in 2000, are now incorporated within<br />
the baseline projections. Thus, for example, the<br />
demand response to the climate change levy is<br />
incorporated in the projections, as is the impact<br />
of the Renewables Obligation, which is assumed<br />
in the DTI energy projections to raise the share of<br />
renewables in electricity supply to around 8 per<br />
cent by 2010. The level of carbon saving from the<br />
policy measure incorporated in the baseline has<br />
been determined during the re-evaluation process<br />
undertaken during the Summer of 2005. A table<br />
setting out the carbon savings associated with<br />
each policy included in the baseline projections is<br />
included in Section 2.<br />
5. The UEP projections provide two central scenarios<br />
based on HM Treasury projections of economic<br />
growth combined with two variations on<br />
assumptions of world fossil fuel price projections.<br />
The two central price variations provide relative<br />
price situations that would indicate either gas or<br />
<strong>UK</strong> carbon dioxide emission projections by scenario, 1990 to 2020, MtC 3<br />
1990 1995 2000 2004 2010 2015 2020<br />
Central favouring coal 160.6 150.1 148.7 148.8 144.6 149.3 147.3<br />
Central favouring gas 160.6 150.1 148.7 148.8 144.9 148.4 144.6<br />
Average of central projections 160.6 150.1 148.7 148.8 144.8 148.8 145.9<br />
LULUCF emissions and removals 0.8 0.3 -0.1 -0.6 -0.5 0.1 0.7<br />
Total CO 2<br />
emissions and removals 161.4 150.4 148.6 148.3 144.3 149.0 146.6<br />
<strong>Change</strong> from 1990 emissions for row above -6.8% -7.9% -8.2% -10.6% -7.8% -9.2%<br />
Note: the percentage changes and emission estimates may differ slightly due to rounding.<br />
1 See www.dti.gov.uk/energy/inform/dukes/dukes2005/index.shtml<br />
2 www.dti.gov.uk/energy/sepn/UEP_Feb<strong>2006</strong>.pdf<br />
3 Historical CO 2<br />
emissions and CO 2<br />
energy projections in the table are based on the greenhouse gas inventory published in 2005 which agrees with the<br />
inventory published in <strong>2006</strong> (used elsewhere in the programme) to about 0.01 per cent for total CO 2<br />
emissions on average over the period 1990 to 2003,<br />
with individual years differing by up to about 0.4 per cent. The energy projections will be updated to be based on the inventory published in <strong>2006</strong>. The LULUCF<br />
emissions are taken from the inventory published in <strong>2006</strong>.
Emissions projections<br />
171<br />
coal as more economic within the electricity<br />
generating sector. Alternative scenarios providing<br />
a longer-term view of either high or low fossil<br />
fuel prices are also provided but not reported<br />
here. The table below shows how the average of<br />
the two central scenarios from the DTI model<br />
combines with the central land use, land use<br />
change and forestry (LULUCF) emission scenarios<br />
developed by the Centre for Ecology and<br />
Hydrology under contract to <strong>Defra</strong>. This provides<br />
the total <strong>UK</strong> carbon dioxide projections used<br />
within this <strong>Programme</strong>. The CEH projections<br />
are described further under Annex F.<br />
Other greenhouse gases projections<br />
6. The emissions projections of the other<br />
greenhouse gases covered by the Kyoto Protocol<br />
– methane, nitrous oxide, hydrofluorocarbons,<br />
perfluorocarbons and sulphur hexafluoride – were<br />
produced by ENTEC 4 under contract to <strong>Defra</strong> and<br />
are broadly consistent with the assumptions<br />
underlying the projections of carbon dioxide<br />
emissions published by the DTI. The projections<br />
have been developed for thirteen different sectors<br />
and sub-sectors based on a range of different<br />
sources, including consultation with experts and<br />
stakeholders from Government departments,<br />
industry and other organisations; technical<br />
literature; and incorporating results of studies<br />
undertaken for <strong>Defra</strong>.<br />
7. Projections are calculated using simple<br />
spreadsheet models that calculate emissions<br />
based on forecast activity statistics, emissions<br />
factors and various other sector specific<br />
assumptions for each of the main sources of<br />
emissions. Greenhouse gas emission projections<br />
are disaggregated by sector and are calculated for<br />
each year from 2005 to 2020. These are then<br />
aggregated to provide an estimate of total<br />
projected emissions. The spreadsheets have been<br />
constructed so as to provide transparency in the<br />
assumptions and approaches used and also for<br />
ease of updating.<br />
8. Methodologies and assumptions used to<br />
generate the projections are documented in the<br />
spreadsheets and accompanying report.<br />
Probabilistic modelling of the range of uncertainty<br />
associated with the total emissions for each gas<br />
has also been undertaken to calculate the<br />
confidence range for the projections.<br />
9. As with the projections for carbon dioxide, the<br />
non-CO 2<br />
projections are based on a ‘with<br />
measures’ scenario, which takes into account<br />
currently adopted and implemented policies and<br />
measures. Central estimates for sector projections<br />
are aggregated to calculate the best estimate for<br />
the total emissions.<br />
10. The table below summarises the methodologies<br />
used to estimate projections of non-carbon<br />
dioxide gases, broken down by sector. Annexes D<br />
to F provide more details of the emissions of each<br />
gas and the methodologies used to derive them<br />
including uncertainty ranges associated with the<br />
central estimates reported in the <strong>Programme</strong>.<br />
11. Projections are checked by comparing trends in<br />
actual historic emissions against future emission<br />
estimates. If there is a significant deviation<br />
between the trend in historic data and future<br />
emission estimates, projection methodologies and<br />
assumptions are revised accordingly.<br />
12. In certain sectors, projection methodologies are<br />
verified by using a combination of bottom up<br />
and top down information. For example, the<br />
methodology that derives estimates of future<br />
emissions of hydrofluorocarbons is based on<br />
detailed disaggregated projections on a sector<br />
by sector basis. This is a bottom up approach.<br />
The outputs from this model have been<br />
checked against historic sales information for<br />
hydrofluorocarbons, where available – a top<br />
down approach. Consequently, the model has<br />
been verified by comparing projected emissions<br />
to actual sales information for the fluids<br />
concerned.<br />
4 This technical report will be available following publication of the <strong>Programme</strong>. The non-CO 2<br />
projections have been updated for consistency with the greenhouse<br />
gas inventory published in <strong>2006</strong>.
172<br />
Emissions projections<br />
Methodologies for non-carbon dioxide projections<br />
Sector Gas Methodology<br />
Agriculture Methane Projections are consistent with the approach adopted in the <strong>UK</strong><br />
Greenhouse Gas Inventory, 1990 to 2004 5 , incorporating forecasts of<br />
livestock numbers (from <strong>Defra</strong>) and expectations for changes in body<br />
mass per cow and milk production per head (<strong>Defra</strong>).<br />
Nitrous oxide<br />
Projections are consistent with the approach adopted in the <strong>UK</strong><br />
Greenhouse Gas Inventory, 1990 to 2004, incorporating forecast changes<br />
in inorganic nitrogen-based fertiliser use (Agricultural Industries Federation).<br />
Fuel combustion Methane & The DTI updated energy projections (UEP 21) have been incorporated<br />
Nitrous oxide into a model consistent with that used to calculate CH4 and N 2<br />
O emissions<br />
for the <strong>UK</strong> Greenhouse Gas Inventory, 1990 to 2004. DTI industrial growth<br />
forecasts are used to estimate emissions from the manufacturing and<br />
construction sectors and from metal production.<br />
Gas distribution Methane Projections are based on reductions in leakage expected through an<br />
ongoing replacement programme for cast iron gas mains (low<br />
pressure pipes).<br />
Coal mining Methane Projections are based on DTI estimates of future <strong>UK</strong> mined coal<br />
production, using the approach currently adopted in the <strong>UK</strong><br />
Greenhouse Gas Inventory, 1990 to 2004.<br />
Abandoned coal mines Methane Projections are based on an emission of 0.74 per cent of the<br />
estimated methane reserve of closed collieries per year 6 . Methane<br />
reserve estimates are based on detailed plans of abandoned mine<br />
workings and take into account the likely effects of rising water in the<br />
workings due to flooding. Calculations allow for a higher expected<br />
rate of emissions a few years after closure of individual collieries.<br />
Some mitigation of emissions has also been assumed for collieries<br />
closing in future. Projections are consistent with DTI estimates of<br />
future colliery closure.<br />
Oil & Gas Methane Projections are based on estimates provided by United Kingdom<br />
Offshore Operators Association (<strong>UK</strong>OOA) and verified by comparison<br />
with forecast offshore oil and gas production.<br />
Transport Methane & Road – Emission projections are based on projections of vehicle km<br />
Nitrous oxide traveled, provided by the Department for Transport and AEA<br />
Technology, and emissions factors for each of the ‘Euro’ standards<br />
comprising the vehicle fleet.<br />
Civil aviation – Emission projections are based on assumed growth in<br />
passenger demand (Aviation White Paper) 7 .<br />
Navigation – Emission projections are based on information from<br />
Department for Transport on expected growth (assuming emissions<br />
proportional to activity).<br />
Railways – Emission projections are based on the assumption that<br />
changes in rail activity influence emissions proportionately. The data<br />
was provided by the Department for Transport and the Strategic Rail<br />
Authority.<br />
Landfill Methane Estimates developed by Golder Associates 8 based on municipal solid<br />
waste arisings generated from the Local Authority Waste Recycling<br />
Recovery and Disposal Model.<br />
Wastewater handling Methane Based on expected change in sewage sludge production and<br />
projected changes in population developed by Government<br />
Actuary’s Department.<br />
Chemical industry Nitrous oxide Projected emissions from adipic and nitric acid manufacture are<br />
calculated based on knowledge of abatement techniques applied at<br />
relevant sites and projected future abatement achievable.<br />
5 <strong>UK</strong> Greenhouse Gas Inventory, 1990 to 2004, to be published in April <strong>2006</strong>, will be available at www.naei.co.uk/reports.php<br />
6 Development of a Methodology for Estimating Methane Emissions from Abandoned Coal Mines in the <strong>UK</strong>, IMC White Young Green, 2005.<br />
7 www.dft.gov.uk/stellent/groups/dft_aviation/documents/page/dft_aviation_031516.pdf<br />
8 <strong>UK</strong> Landfill Methane Emissions: Evaluation and Appraisal of Waste Policies and Projections to 2050, Golder Associates, November 2005.
Emissions projections<br />
173<br />
Methodologies for non-carbon dioxide projections – continued<br />
Sector Gas Methodology<br />
Industrial, business, HFCs, PFCs, Based on projections developed by AEA Technology in 2003 and<br />
residential SF 6<br />
updated in 2004 9 . Mainly based on production trends and assumed<br />
trends in emission factors.<br />
Mineral Products Methane Projections based on site-specific forecasts, developed in discussion with<br />
operators.<br />
Overall uncertainty<br />
13. Uncertainty ranges for each greenhouse gas,<br />
including carbon dioxide, were combined<br />
probabilistically to determine the overall<br />
uncertainty range for total greenhouse gas<br />
emissions and projections presented in the<br />
<strong>Programme</strong>. For this exercise, the probabilistic<br />
range of baseline emissions from energy use<br />
was consistent with the Average of central<br />
projections scenario.<br />
14. This analysis suggests that in 2010, <strong>UK</strong> emissions<br />
of greenhouse gases will be between 16 per cent<br />
and 22 per cent below 1990 levels, with the<br />
central scenario about 19 per cent below. The<br />
range takes into account macroeconomic,<br />
sectoral and modeling uncertainties. Overall<br />
therefore, the Kyoto target would be delivered<br />
on the basis of the policies included in the<br />
projections. The additional policies set out in this<br />
<strong>Programme</strong> could further reduce <strong>UK</strong> emissions of<br />
greenhouse gases to between 20 per cent and<br />
26 per cent below 1990 levels by 2010, with the<br />
central scenario about 23 per cent below.<br />
9 Emissions and projections of HFCs, PFCs and SF 6<br />
for the <strong>UK</strong> and Constituent Countries, AEA Technology plc, June 2004.
174<br />
ANNEX B<br />
Carbon dioxide<br />
Key facts<br />
• Carbon dioxide is the most important<br />
greenhouse gas. It contributed 85 per cent<br />
to the <strong>UK</strong>’s total greenhouse gas emissions<br />
in 2004.<br />
• CO 2<br />
emissions are estimated to have fallen<br />
by 5.6 per cent between 1990 and 2004.<br />
• Emissions are projected to continue falling<br />
to 10.6 per cent below 1990 levels by 2010,<br />
on the basis of existing measures only, with<br />
an uncertainty range of about ±6 per cent.<br />
1. Section 2 of the <strong>Programme</strong> outlines the policies<br />
and measures that are being put in place to<br />
reduce carbon dioxide emissions. This Annex<br />
provides a more detailed breakdown of inventory<br />
trends and projections.<br />
Carbon dioxide emissions by source, 1990 to 2020, MtC<br />
MtC<br />
180<br />
160<br />
140<br />
120<br />
100<br />
80<br />
60<br />
40<br />
20<br />
0<br />
<strong>UK</strong> carbon dioxide emissions 1990 to 2020, MtC<br />
170<br />
160<br />
1990 2000<br />
Transport<br />
Industry<br />
Services<br />
Residential<br />
Refineries<br />
Power stations<br />
2010 2020<br />
Emissions trends and projections<br />
2. In 1990, anthropogenic emissions of the six<br />
greenhouse gases from the <strong>UK</strong> were about 209<br />
MtC. Carbon dioxide made up around 77 per<br />
cent of this total. Annual emissions of carbon<br />
dioxide fell by about 5.6 per cent between 1990<br />
and 2004. Emissions are projected to continue<br />
falling to 10.6 per cent below 1990 levels by<br />
2010, on the basis of existing policies and<br />
measures only.<br />
MtC<br />
150<br />
140<br />
130<br />
120<br />
1990 1995 2000 2005 2010 2015 2020<br />
Central estimate<br />
Low (95%, probabilistic)<br />
High (95%, probabilistic)<br />
3. The table below provides a more detailed sectoral<br />
breakdown of carbon dioxide projections<br />
compared to the information provided in Section<br />
2, chapter 1 of the <strong>Programme</strong>.<br />
4. The uncertainty range indicated in the figure<br />
above will be about ±6 per cent in 2010,<br />
increasing to ±7 per cent by 2020. The range<br />
arises from an estimate of the uncertainty<br />
introduced by the energy modelling process,<br />
corresponding to the full range of emission<br />
scenarios produced by DTI 10 . A description of<br />
sensitivities in key assumptions can be found in<br />
chapter 8 of the DTI paper.<br />
10www.dti.gov.uk/energy/sepn/UEP_Feb <strong>2006</strong>.pdf
Carbon dioxide<br />
175<br />
Carbon dioxide emissions by source 1990 to 2020, MtC 11<br />
Sector 1990 1995 2000 2004 2010 2015 2020<br />
Power stations 55.6 44.6 42.4 46.5 41.2 42.8 39.6<br />
Refineries 5.0 5.6 4.7 4.8 5.7 5.7 5.7<br />
Residential 21.3 21.7 23.3 23.9 20.7 21.0 21.1<br />
Services 7.1 7.5 7.2 6.4 6.4 6.7 7.7<br />
Industry 34.8 33.5 33.4 32.2 32.4 33.1 31.6<br />
Road Transport 29.9 30.3 31.7 32.6 34.6 35.8 36.2<br />
Off-road 3.5 3.5 3.5 3.5 1.4 1.4 1.4<br />
Other transport 3.4 2.9 2.8 3.1 2.3 2.4 2.5<br />
LULUCF (net) 0.8 0.3 -0.1 -0.5 -0.5 0.1 0.7<br />
Total CO 2<br />
emissions by sources minus<br />
total removals by sinks 161.5 149.9 149.0 152.5 144.3 149.0 146.6<br />
<strong>Change</strong> from 1990 levels for row above -7.2% -7.7% -5.6% -10.6% -7.8% -9.2%<br />
Note: the percentage changes and emission estimates may differ slightly due to rounding.<br />
11Actual historical data for 2004 are used in this table in place of 2005 projections.
176<br />
ANNEX C<br />
Methane<br />
Key facts<br />
Methane emissions by source 1990 to 2020, MtC<br />
30<br />
• Methane contributed about 7 per cent to<br />
total <strong>UK</strong> greenhouse gas emissions in 2004.<br />
• Methane emissions are estimated to have<br />
fallen by about 50 per cent between 1990<br />
and 2004 and are projected to continue<br />
falling to about 57 per cent below 1990<br />
levels by 2010.<br />
MtC<br />
25<br />
20<br />
15<br />
10<br />
5<br />
• Waste and coal mining contributed most to<br />
the overall reduction in methane emission<br />
levels.<br />
1. Methane has a global warming potential (GWP)<br />
21 times that of carbon dioxide over a 100-year<br />
time horizon 12 . However, due to a relatively short<br />
turnover rate in the atmosphere of 12 years,<br />
reductions in total emissions result in rapid<br />
reduction in atmospheric concentration.<br />
0<br />
Methane emissions, 1990 to 2020, MtC<br />
30<br />
25<br />
1990<br />
(base year)<br />
2000<br />
Wastewater treatment<br />
Fuel combustion<br />
Offshore oil and gas<br />
Natural gas distribution<br />
2010 2020<br />
Coal mining<br />
Agriculture<br />
Waste<br />
Emissions trends and projections<br />
2. In 1990, emissions of methane from the <strong>UK</strong> were<br />
25.1 MtC, contributing 12 per cent to total <strong>UK</strong><br />
greenhouse gas emissions in that year. The major<br />
sources were landfill waste, agriculture, natural<br />
gas distribution and coal mining. Annual<br />
emissions fell by 50 per cent between 1990 and<br />
2004 and are expected to continue to fall to<br />
about 57 per cent of 1990 emissions by 2010.<br />
MtC<br />
20<br />
15<br />
10<br />
5<br />
0<br />
1990 1995 2000 2005 2010 2015 2020<br />
Central estimate<br />
Low (95%, probabilistic)<br />
High (95%, probabilistic)<br />
3. The table below shows <strong>UK</strong> methane emissions by<br />
source. There are still large uncertainties in many<br />
of the source estimates but these have been<br />
reduced significantly in key sectors because of<br />
research commissioned by the Government. For<br />
each of the key sectors, high and low estimates of<br />
the projected emissions were derived. These were<br />
assumed to form the upper and lower bounds of<br />
a triangular distribution of the projected<br />
emissions. These high and low estimates were<br />
generally derived from expert judgement about<br />
the data inputs, the modelling approach and the<br />
historical variability in the data. Monte Carlo<br />
Analysis was used in order to derive a probability<br />
12Please see Annex H for more information on GWP.
Methane<br />
177<br />
density function associated with the total<br />
projected emissions for methane. The range of<br />
projected emissions representing the 95th<br />
percentile is presented here.<br />
4. Landfills are the dominant source of methane in<br />
the waste sector, contributing 98 per cent of<br />
national methane emissions from that sector in<br />
1990. Methane emissions from landfill sites are<br />
estimated to have been 10.4 MtC in 1990 and are<br />
projected to fall to 3.4 MtC by 2010. The national<br />
methane assessment model estimate of methane<br />
emissions has been revised to take account of<br />
improvements to the gas collection efficiency and<br />
oxidation factors 13 .<br />
5. Methane emissions from abandoned coal mines<br />
were 0.3 MtC in 1990 based on a new estimating<br />
method developed for <strong>Defra</strong> 14 . Annual emissions<br />
decreased to 0.25 MtC in 2004 but are expected<br />
to rise again by 2010 due to colliery closures. For<br />
the first time in 2005 the <strong>UK</strong> greenhouse gas<br />
inventory contained emissions estimates for<br />
abandoned mine methane.<br />
6. Based on the latest assessment of likely future<br />
emissions from each sector and the effect of<br />
planned policies and measures, annual emissions<br />
of methane are expected to decrease by 57 per<br />
cent below 1990 levels to around 10.8 MtC<br />
in 2010.<br />
Methane emissions by source 1990 to 2020, MtC 15<br />
Sector 1990 1995 2000 2004 2010 2015 2020<br />
Waste 10.4 9.3 6.1 3.8 3.4 3.1 2.8<br />
Agriculture 5.9 5.7 5.5 5.1 4.4 4.4 4.4<br />
Coal mining 5.0 3.4 1.9 1.3 1.0 0.8 0.7<br />
Natural gas distribution 2.2 2.0 1.8 1.3 1.1 1.0 0.9<br />
Offshore oil and gas 0.6 0.6 0.4 0.3 0.3 0.1 0.1<br />
Fuel combustion 0.7 0.5 0.4 0.4 0.3 0.3 0.3<br />
Wastewater treatment 0.2 0.2 0.2 0.2 0.2 0.2 0.2<br />
Other 0.1 0.1 0.0 0.0 0.0 0.0 0.0<br />
Total 25.1 21.8 16.3 12.5 10.8 10.0 9.5<br />
<strong>Change</strong> from 1990 levels -13.1% -34.9% -50.1% -57.0% -60.0% -62.1%<br />
Note: the percentage changes and emission estimates may differ slightly due to rounding.<br />
13<strong>UK</strong> Landfill Methane Emissions: Evaluation and Appraisal of Waste Policies and Projections to 2050, Golder Associates, November 2005<br />
14Development of a Methodology for Estimating Methane Emissions from Abandoned Coal Mines in the <strong>UK</strong>, White Young Green 2005.<br />
15Actual historical data for 2004 are used in this table in place of 2005 projections.
178<br />
ANNEX D<br />
Nitrous oxide<br />
1. Nitrous oxide has a global warming potential 310<br />
times that of carbon dioxide over a 100-year time<br />
horizon. The main source of emissions in the <strong>UK</strong><br />
is now agricultural soils because emissions from<br />
industrial processes, particularly fugitive nitrous<br />
oxide emissions from adipic acid manufacture,<br />
have been significantly reduced due to<br />
introduction of abatement equipment.<br />
Emissions trends and projections<br />
2. In 1990, anthropogenic emissions of nitrous oxide<br />
from the <strong>UK</strong> were 18.6 MtC. Annual emissions<br />
fell 40.4 per cent between 1990 and 2004.<br />
Projected nitrous oxide emissions in 2010 are<br />
11.0 MtC, a decrease of 41.2 per cent on<br />
1990 levels.<br />
Nitrous oxide emissions by source 1990 to 2020, MtC<br />
MtC<br />
Key facts<br />
• Nitrous oxide contributed almost 6 per cent<br />
to total <strong>UK</strong> greenhouse gas emissions in 2004.<br />
• N 2<br />
O emissions are estimated to have fallen by<br />
about 40 per cent between 1990 and 2004<br />
and are projected to be about 41 per cent<br />
below 1990 levels by 2010.<br />
• Large reductions in emissions from industrial<br />
processes contributed most to this fall.<br />
20<br />
18<br />
16<br />
14<br />
12<br />
10<br />
8<br />
6<br />
4<br />
2<br />
0<br />
1990<br />
(base year)<br />
2000<br />
Transport<br />
Waste<br />
Fuel combustion<br />
2010 2020<br />
Industrial processes<br />
Agriculture<br />
Nitrous oxide emissions, 1990 to 2020, MtC<br />
MtC<br />
20<br />
19<br />
18<br />
17<br />
16<br />
15<br />
14<br />
13<br />
12<br />
11<br />
10<br />
1990 1995 2000<br />
Central estimate<br />
Low (95%, probabilistic)<br />
High (95%, probabilistic)<br />
2005 2010 2015 2020<br />
3. The table below shows <strong>UK</strong> nitrous oxide<br />
emissions by source. There are large uncertainties<br />
in many of the source estimates but these have<br />
been reduced significantly in key sectors because<br />
of Government research. For each of the key<br />
sectors, high and low estimates of the projected<br />
emissions were derived. These were assumed to<br />
form the upper and lower bounds of a triangular<br />
distribution of the projected emissions. These<br />
high and low estimates were generally derived<br />
from expert judgement about data inputs, the<br />
modelling approach and the historical variability<br />
in the data. Monte Carlo Analysis was used in<br />
order to derive a probability density function<br />
associated with the total projected emissions for<br />
nitrous oxide. The range of projected emissions<br />
representing the 95th percentile is presented<br />
here. The central and low projections are close in<br />
this case because the uncertainty in the rates of<br />
application of nitrogenous fertiliser is skewed.<br />
4. Estimates of nitrous oxide emissions from<br />
agricultural soils are currently under review,<br />
though this is unlikely to have a significant effect<br />
on the overall trend of nitrous oxide emissions.
Nitrous oxide<br />
179<br />
Nitrous oxide emissions by source 1990 to 2020, MtC 16<br />
Sector 1990 1995 2000 2004 2010 2015 2020<br />
Agriculture 8.7 8.3 7.9 7.2 7.0 6.9 6.9<br />
Industrial processes 8.0 5.2 1.7 1.1 1.1 1.1 1.1<br />
Fuel combustion 1.2 1.0 0.9 0.9 0.9 0.9 0.8<br />
Waste 0.3 0.3 0.3 0.3 0.4 0.4 0.4<br />
Transport 0.4 0.7 1.2 1.5 1.6 1.7 1.8<br />
Other 0.0 0.0 0.0 0.0 0.0 0.0 0.0<br />
Total 18.6 15.5 12.1 11.1 11.0 11.0 11.0<br />
<strong>Change</strong> from 1990 levels -16.6% -35.3% -40.4% -41.2% -40.9% -41.0%<br />
Note: the percentage changes and emission estimates may differ slightly due to rounding.<br />
16Actual historical data for 2004 are used in this table in place of 2005 projections.
180<br />
ANNEX E<br />
HFCs, PFCs and SF 6<br />
Key facts<br />
• The fluorinated gases (F-gases) together<br />
contributed 1.6 per cent to total <strong>UK</strong><br />
greenhouse gas emissions in 2004.<br />
• F-gas emissions fell by 40 per cent between<br />
the 1995 base year and 2004 and are<br />
projected to be 33 per cent below 1995 levels<br />
by 2010.<br />
1. Though relatively small as a proportion of total<br />
emissions, emissions of the fluorinated gases –<br />
hydrofluorocarbons (HFCs), perfluorocarbons<br />
(PFCs) and sulphur hexafluoride (SF 6<br />
) – are<br />
significant for climate change as they have high<br />
global warming potentials (see annex H) and<br />
usage particularly of HFCs is expected to grow in<br />
some sectors in the near future.<br />
Emissions trends and projections<br />
2. The Kyoto Protocol allows for either 1990 or<br />
1995 to be used as the base year for measuring<br />
emissions of HFCs, PFCs and SF 6<br />
. The <strong>UK</strong> has<br />
chosen to use 1995 as the baseline.<br />
3. Historical and projected emissions are shown<br />
graphically as low, central and high estimates.<br />
Uncertainties in the combined total <strong>UK</strong> f-gas<br />
emissions were derived from individual sector<br />
uncertainty estimates using an iterative Monte<br />
Carlo Analysis. Uncertainties were calculated<br />
as two standard deviations from the mean,<br />
corresponding to a 95 per cent confidence<br />
interval. Manufacturers and their representatives<br />
provided most of the data. Stakeholder<br />
workshops involving industry, NGOs and<br />
producers of alternative refrigerants and other<br />
interested parties helped to refine the emissions<br />
and projections, and reduce some of the<br />
uncertainties.<br />
Emissions of HFCs, PFCs and SF 6<br />
, 1990 to 2020, MtC<br />
MtC<br />
<strong>UK</strong> emissions of HFCs, 1995 to 2020, MtC<br />
MtC<br />
6.0<br />
5.5<br />
5.0<br />
4.5<br />
4.0<br />
3.5<br />
3.0<br />
2.5<br />
2.0<br />
1.5<br />
1990 1995 2000<br />
4.5<br />
4.0<br />
3.5<br />
3.0<br />
2.5<br />
2.0<br />
1.5<br />
1.0<br />
0.5<br />
0.0<br />
Central estimate<br />
Low (95%, probabilistic)<br />
High (95%, probabilistic)<br />
1995<br />
(base year)<br />
2000<br />
Fire fighting<br />
Solvents<br />
HFC-23 from HCFC-22<br />
manufacture and<br />
fugitive losses from HFC<br />
manufacture<br />
2005 2010 2015 2020<br />
2010 2020<br />
Metered dose inhalers<br />
General aerosols<br />
Foam<br />
Refrigeration/<br />
air conditioning<br />
Notes:*from HCFC-22 manufacture and fugitive losses from HFC<br />
manufacture.
181<br />
HFCs, PFCs and SF 6<br />
<strong>UK</strong> emissions of PFCs, 1995 to 2020, MtC<br />
MtC<br />
<strong>UK</strong> emissions of SF 6<br />
, 1995 to 2020, MtC<br />
MtC<br />
0.14<br />
0.12<br />
0.10<br />
0.08<br />
0.06<br />
0.04<br />
0.02<br />
0.00<br />
0.6<br />
0.5<br />
0.4<br />
0.3<br />
0.2<br />
0.1<br />
0.0<br />
1995<br />
(base year)<br />
1995<br />
(base year)<br />
Electronics<br />
Other SF6 uses<br />
2000<br />
Refrigeration/air conditioning<br />
Other PFC emissions<br />
2000<br />
2010 2020<br />
Aluminium smelting<br />
Electronics<br />
2010 2020<br />
Electrical insulation<br />
Magnesium smelting<br />
HFCs<br />
6. In 1995, emissions of hydrochlorofluorocarbons<br />
(HFCs) from the <strong>UK</strong> were 4.2 MtC with the major<br />
source, representing about 90 per cent of HFC<br />
emissions, being fugitive emissions of HFC-23<br />
from the manufacture of the refrigerant HCFC-<br />
22. Other sources of HFC emissions are<br />
refrigeration/air conditioning; foam blowing;<br />
general aerosols; metered dose inhalers; solvent<br />
cleaning; and firefighting.<br />
7. HFCs were virtually unused in many of these<br />
sectors before 1990 but since then, consumption<br />
has risen in response to the phase out of<br />
chlorofluorocarbons (CFCs) and HCFCs under<br />
the Montreal Protocol.<br />
8. HFC emissions are expected to fall by 36 per cent<br />
from 1995 to 2010, mainly due to a substantial<br />
fall in HFC-23 emissions from HCFC-22<br />
manufacturing plants. Emissions from end use<br />
markets such as aerosols, refrigeration and foam<br />
blowing are projected to increase significantly<br />
compared to 1995. However, expected reduced<br />
levels of leakage and increased use of alternative<br />
fluids in these markets limit the magnitude of<br />
increases in HFC emissions.<br />
PFCs<br />
4. In 1995, emissions of fluorinated gases from the<br />
<strong>UK</strong> were 4.7 MtC, contributing 2.4 per cent of<br />
total <strong>UK</strong> greenhouse gas emissions in that year.<br />
Annual emissions fell by about 40 per cent<br />
between 1995 and 2004 and are expected to be<br />
33.4 per cent below 1995 levels by 2010. Details<br />
of major sources for each fluorinated gas are<br />
given below.<br />
5. The projections are to be updated to take<br />
account of additional abatement action affecting<br />
HFC-23 emissions and use of SF 6<br />
in the nonferrous<br />
metal industry, which may together<br />
reduce emission by between 0.3 and 0.4 MtC/yr<br />
in 2010 below the level shown in the figures.<br />
9. <strong>UK</strong> emissions of PFCs were 0.1 MtC in 1995. PFC<br />
emissions are expected to decrease by around<br />
41.6 per cent of 1995 level by 2010 mainly due<br />
to improved control of aluminium smelters and<br />
improved fluid recovery in the electronics industry.<br />
SF 6<br />
10. SF 6<br />
is used in four main markets: electrical<br />
insulation; magnesium smelting; electronics; and<br />
training shoes. SF 6<br />
emissions from these end use<br />
markets are estimated to have been 0.34 MtC in<br />
1995 and are expected to remain approximately<br />
the same in 2010.
182<br />
HFCs, PFCs and SF 6<br />
HFC, PFC, SF 6<br />
emissions by market sector 1990 to 2020, MtC 17<br />
Sector 1990 1995 2000 2004 2010 2015 2020<br />
(Base year)<br />
HFCs<br />
Refrigeration/air conditioning 0.000 0.254 1.101 1.376 1.233 1.124 0.912<br />
Foam (excluding OCF) 18 0.000 0.000 0.017 0.139 0.237 0.282 0.324<br />
General aerosols (including OCF) 19 0.000 0.156 0.368 0.344 0.448 0.469 0.491<br />
Metered dose inhalers 0.000 0.000 0.244 0.390 0.380 0.335 0.316<br />
HFC-23 from HCFC-22 manufacture and<br />
fugitive losses from HFC manufacture 3.102 3.813 0.730 0.077 0.274 0.274 0.274<br />
Solvents 0.000 0.000 0.001 0.009 0.029 0.029 0.029<br />
Fire fighting 0.000 0.001 0.017 0.079 0.102 0.114 0.128<br />
Total HFC emissions 3.102 4.225 2.478 2.415 2.703 2.627 2.474<br />
PFCs<br />
Electronics 0.010 0.022 0.049 0.026 0.019 0.023 0.029<br />
Aluminium smelting 0.363 0.078 0.070 0.042 0.033 0.033 0.033<br />
Other PFC emissions 0.009 0.026 0.007 0.029 0.022 0.024 0.025<br />
Refrigeration/air conditioning 0.000 0.002 0.009 0.000 0.000 0.000 0.000<br />
Total PFC emissions 0.382 0.128 0.136 0.096 0.073 0.080 0.086<br />
SF 6<br />
Magnesium smelting 0.116 0.116 0.298 0.106 0.202 0.202 0.202<br />
Electrical insulation 0.163 0.219 0.170 0.142 0.138 0.138 0.135<br />
Other SF 6<br />
uses 0.000 0.000 0.016 0.056 0.010 0.000 0.000<br />
Electronics 0.002 0.003 0.006 0.003 0.004 0.005 0.007<br />
Total SF 6<br />
emissions 0.281 0.338 0.490 0.307 0.354 0.345 0.344<br />
Total <strong>UK</strong> emissions of HFCs, PFCs and SF 6<br />
3.765 4.691 3.104 2.515 3.130 3.052 2.904<br />
<strong>Change</strong> from base year for row above -33.8% -46.4% -33.3% -34.9% -38.1%<br />
Note: the percentage changes and emission estimates may differ slightly due to rounding.<br />
17Actual historical data for 2004 are used in this table in place of 2005 projections.<br />
18OCF – One Component Foams.<br />
19OCF – One Component Foams.
ANNEX F<br />
Carbon sequestration<br />
183<br />
• The largest carbon pools in the <strong>UK</strong> are soils<br />
which store about 6 billion tonnes of carbon<br />
Land use in the United Kingdom<br />
• The <strong>UK</strong> was a net source of emissions from<br />
land use, land use change and forestry<br />
(LULUCF) in 1990<br />
• Projections indicate the <strong>UK</strong> will become a<br />
small net sink of 0.5 MtC from LULUCF<br />
activities by 2010<br />
Forestland<br />
Grassland<br />
Cropland<br />
Settlements<br />
Other Land<br />
1. Under the UNFCCC and the Kyoto Protocol, the<br />
<strong>UK</strong> is committed to protecting and enhancing<br />
sinks. The Kyoto Protocol also gives a limited<br />
allowance for forestry activities to be used to help<br />
meet emission reduction commitments. This<br />
Annex explains how the <strong>UK</strong> is approaching<br />
international negotiations on the use of sinks<br />
and about the current trends in emissions from<br />
land use change.<br />
2. The latest information on land use in the United<br />
Kingdom comes from a Countryside Survey<br />
conducted in 1998 20 . The use of land was<br />
estimated by classification of surveyed locations<br />
into one of 21 Broad Habitats or dense urban<br />
use. These classes can be combined into five of<br />
those recommended in the IPCC Good practice<br />
Guidance of Land Use, Land-Use <strong>Change</strong> and<br />
Forestry, namely Forest Land, Cropland,<br />
Grassland, Settlements and Other Land. The land<br />
that would be within the IPCC Wetland type is<br />
included in Grassland or Other Land. Using the<br />
IPCC classes the chart below shows how land in<br />
the United Kingdom is used. The main classes are<br />
grassland (54 per cent) and Cropland (22 per<br />
cent). About 12 per cent of Great Britain is<br />
wooded. Settlements occupy 9 per cent of land,<br />
including gardens and urban parks leaving 4 per<br />
cent of the <strong>UK</strong> in the IPCC Other Land class for<br />
example rock, open water and beaches.<br />
3. Soil is the largest carbon pool in the <strong>UK</strong>, which<br />
stores about 6 billion tonnes of carbon 21 . About<br />
3 billion tonnes of this total are stored in peats<br />
and other organic soils which are found mainly<br />
in Scotland and which cover about 30 per cent<br />
of the <strong>UK</strong>’s total land area. The biomass in<br />
woodlands contain some 90 million tonnes of<br />
carbon, 30 million tonnes of which are stored in<br />
conifers and some 60 million tonnes in broad<br />
leaves and mixed woodland.<br />
Inventory and projections<br />
4. The <strong>UK</strong>’s annual greenhouse gas inventory<br />
includes categories covering LULUCF, in<br />
accordance with the IPCC’s 2003 Good Practice<br />
Guidance for LULUCF. The methods used to<br />
estimate emissions from these categories have<br />
been reported in the scientific literature 22 and are<br />
kept under review. The methodologies are<br />
described in the <strong>UK</strong>’s National Inventory Reports<br />
(e.g. Baggott et al 2005).<br />
Ranges in future land use change<br />
MtC<br />
3.0<br />
2.5<br />
2.0<br />
1.5<br />
1.0<br />
0.5<br />
0.0<br />
-0.5<br />
-1.0<br />
-1.5<br />
-2.0<br />
1990 1995 2000<br />
Low Mid High<br />
2005 2010 2015 2020<br />
20Countryside Survey 1990, 1993, Barr et al: Main Report, DOE, London; Northern Ireland Countryside Survey, 1997, Cooper et al, EHS, Belfast.<br />
21The figure included carbon stored in litter, which is dead plant matter lying on top of the soil.<br />
22Cannell et al, National Inventories of Terrestrial Carbon Sources and Sinks: The <strong>UK</strong> Experience, Climatic <strong>Change</strong>, vol 42, pp505-530, 1999.
184<br />
Carbon sequestration<br />
Greenhouse gas emissions and removals from land use, land use change and forestry, on a) UNFCCC basis and b) Kyoto Protocol (KP) basis, MtC 23<br />
Convention Reporting bases<br />
Gas 1990 1995 2000 2004 2010 2015 2020<br />
Carbon dioxide 0.795 0.282 -0.120 -0.530 -0.455 0.124 0.653<br />
Methane 0.004 0.003 0.005 0.005 0.004 0.003 0.003<br />
Nitrous oxide 0.0004 0.0003 0.0005 0.0005 0.0004 0.0003 0.0003<br />
Total greenhouse gas emissions by sources<br />
minus removals by sinks 0.799 0.285 -0.114 -0.524 -0.451 0.128 0.656<br />
Kyoto Protocol Reporting bases<br />
Gas 1990 1995 2000 2004 2010 2015 2020<br />
Carbon dioxide<br />
Afforestation & Reforestation 0.008 -0.076 -0.388 -0.586 -0.843 -0.978 -1.179<br />
Deforestation 0.046 0.061 0.100 0.102 0.104 0.106 0.104<br />
Methane 0.004 0.003 0.005 0.005 0.004 0.003 0.003<br />
Nitrous oxide 0.0004 0.0003 0.0005 0.0005 0.0004 0.0003 0.0003<br />
Total greenhouse gas removals by Afforestation<br />
and Reforestation less emissions by<br />
Deforestation mandatory under Article 3.3 of the<br />
Kyoto Protocol. (-ve is net removal). 0.058 -0.011 -0.282 -0.479 -0.735 -0.869 -1.072<br />
Removals associated with forest<br />
management under Article 3.4 of the<br />
Kyoto Protocol 0.37 0.37 0.37 0.37<br />
Under Kyoto Protocol Article 3.7,<br />
Total Emissions in 1990 due to Deforestation<br />
(added to base year emissions for KP reporting) 0.1<br />
Carbon dioxide emissions and removals from LULUCF 1990 to 2020 MtC, on UNFCCC reporting basis 24<br />
1990 1995 2000 2004 2010 2015 2020<br />
Removals (to forestland) (a) -3.328 -3.804 -3.765 -4.446 -2.935 -2.140 -1.387<br />
Including removals due to land<br />
afforested since 1990 (b) 0.008 -0.076 -0.388 -0.586 -0.843 -0.978 -1.179<br />
Net Emissions from other land use<br />
change and management (c) 4.123 4.086 3.645 3.916 2.479 2.264 2.039<br />
Total emissions minus total removals 0.795 0.282 -0.120 -0.530 -0.455 0.124 0.653<br />
Notes:<br />
(a) Includes carbon accumulated in forests by woody biomass, soils, litter and changes in the quantity of forest products from timber grown in the <strong>UK</strong>;<br />
(b) Entries for woodlands planted from 1990 exclude increasing pool of carbon in timber products;<br />
(c) Sum of source and sink terms due to transitions between land use categories and emissions due to specific land management, includes measures.<br />
5. The estimates for forest carbon sinks in the<br />
greenhouse gas inventory are based largely on<br />
data from the Forestry Commission, which has<br />
undertaken inventories of woodlands in Great<br />
Britain at 15-20 year intervals since 1924. The<br />
most recent inventory, was carried out between<br />
1995 and 2000. Further woodland inventories<br />
will be carried out as part of a 10-year rolling<br />
programme, planned to start in <strong>2006</strong>. Annual<br />
planting and felling data is used to update<br />
information on the size and age structure of the<br />
national forest estate between the periodic<br />
inventories. This information, together with data<br />
derived from the growth characteristics of <strong>UK</strong><br />
forests (so-called ‘yield classes’) is used in a<br />
dynamic carbon accounting model to estimate<br />
annual uptake and storage of atmospheric<br />
carbon by trees. Growth characteristics are kept<br />
under review through a national system of<br />
mensuration plots and associated yield models.<br />
23Actual historical data for 2004 are used in this table in place of 2005 projections.<br />
24Actual historical data for 2004 are used in this table in place of 2005 projections.
Carbon sequestration<br />
185<br />
This information will be used to keep the carbon<br />
accounting model up to date.<br />
6. Estimates of land use change emissions rely on<br />
separate land use change matrices for Scotland,<br />
and for England and Wales. These matrices are<br />
derived from surveys on land use conducted in<br />
1947, 1980, 1984, 1990 and 1998. The matrices<br />
show the pattern of land use change between<br />
different categories of land which have been<br />
grouped into the broad land types of Grassland,<br />
Cropland, Forest Land, Settlements and Other<br />
Land. <strong>Change</strong>s in carbon density for the types of<br />
land undergoing transition are estimated from<br />
soil survey data and used in a dynamic model to<br />
estimate annual gains and losses of carbon<br />
associated with the transitions in the matrix.<br />
7. The tables above summarises the main trends in<br />
<strong>UK</strong> sources and sinks from land use change and<br />
forestry, with disaggregations by greenhouse gas.<br />
The data is consistent with the <strong>UK</strong> Greenhouse<br />
Gas emissions inventory published in <strong>2006</strong> 25 . The<br />
difference between UNFCCC and Kyoto Protocol<br />
reporting bases in table 1 lies in which<br />
components of the LULUCF sector are counted<br />
within the total carbon dioxide estimates. The<br />
Convention basis includes all human-induced<br />
changes to land-based carbon stocks, ie total<br />
emissions minus total removals from the LULUCF<br />
sector. The Kyoto reporting basis includes LULUCF<br />
emissions and removals associated with<br />
mandatory activities under Art 3.3 of the Kyoto<br />
Protocol – afforestation plus reforestation minus<br />
deforestation since 1990. In addition, since the<br />
<strong>UK</strong> has chosen to account for forest management<br />
under Art 3.4 of the Kyoto Protocol, the Kyoto<br />
table also indicates removals up to the level of<br />
the cap agreed for the <strong>UK</strong> as part of the<br />
Marrakesh Accords, since the actual uptake by<br />
forests is projected to exceed the cap in all years.<br />
A small base year allowance of 0.1 MtC related<br />
to deforestation emissions is added to the <strong>UK</strong><br />
base year because land use change and forestry<br />
was a net source of emissions in the base year.<br />
This is in accordance with the provisions of the<br />
second sentence of Art 3.7 of the Kyoto Protocol,<br />
and subsequent COP decisions.<br />
8. New forests and woodlands have been planted at<br />
rates between 12,000 and 21,000 hectares per<br />
year across the <strong>UK</strong> since 1990 as a result of<br />
government policy implemented by the Forestry<br />
Commission and the Northern Ireland Forest<br />
Service. The Government and the devolved<br />
administrations are committed to expanding the<br />
<strong>UK</strong>’s woodland area. The projections for the<br />
forest sink shown in the above table assume that<br />
future policies will continue to produce new<br />
planting at rates of between 12,000 and 30,000<br />
hectares per year, and that existing planting will<br />
be replaced after felling. Row (a) in the last table<br />
includes the continuing uptake by trees planted<br />
before 1990 and still growing, as well as more<br />
recent planting. Row (b) shows only the effect of<br />
expanding the forest area due to planting since<br />
1990, to illustrate how taking account of forestry<br />
activities under Article 3.3 of the Kyoto Protocol<br />
might help the <strong>UK</strong> meet its commitments.<br />
9. Estimated emissions from land use change in row<br />
(c) are mainly a result of agricultural<br />
intensification and urbanisation under the pattern<br />
of land use change before the mid-1980s. In the<br />
more recent land use change matrix, these trends<br />
are moderated or reversed, reflecting the effect<br />
of agri-environmental policies to protect and<br />
enhance the countryside and de-intensify<br />
conventional farming practices. These policies<br />
include Environmentally Sensitive Areas,<br />
Countryside Stewardship, Nitrate Vulnerable<br />
Zones, Woodland Grant and Farm Woodland<br />
Premium Schemes, the Organic Farming Scheme<br />
and the Tir Gofal agri-environment scheme for<br />
Wales. The ranges in the figure above show the<br />
uncertainty in knowledge of future land use<br />
change, either where the changes cause more<br />
change (higher emissions estimate) or less change<br />
(lower emissions line) compared to the<br />
continuation of recent land use changes.<br />
10. The ranges in the figure are determined by the<br />
assumptions made about expansion of the forest<br />
area and the other land use changes reflected in<br />
the land use change matrix. They do not show<br />
the full range of uncertainties, which would also<br />
include methodological uncertainties linked to soil<br />
carbon densities in addition to the uncertainty in<br />
25<strong>UK</strong> Greenhouse Gas Inventory, 1990 to 2004, April <strong>2006</strong>, NETCEN.
186<br />
Carbon sequestration<br />
future rates of change in land use included here.<br />
<strong>Defra</strong> has supported recent work, reported in the<br />
scientific literature, suggesting that losses of<br />
carbon from the upper layers of <strong>UK</strong> soils may be<br />
greater than previously estimated 26 . The causes of<br />
the estimated losses and the fate of the carbon<br />
are under investigation and these results are not<br />
reflected in the inventory or the projections.<br />
26Bellamy et al: Carbon losses from all soils across England and Wales 1978-2003, Nature, vol 437, 245, 8 Sept 2005.
ANNEX G<br />
Carbon capture and geological storage<br />
187<br />
• Carbon dioxide capture and storage (CCS)<br />
consists of separation of carbon dioxide<br />
from industrial and energy-related sources,<br />
transport to a storage location, and longterm<br />
isolation from the atmosphere.<br />
• Storage in properly selected geological<br />
formations can store carbon dioxide with<br />
high probability over very long periods of<br />
time and is part of the portfolio of mitigation<br />
options that can contribute to stabilising<br />
concentrations of greenhouse gases in the<br />
atmosphere.<br />
• Direct injection into the deep ocean would<br />
not isolate the CO 2<br />
from the atmosphere<br />
indefinitely and would have unknown<br />
impacts on marine ecosystems. It cannot<br />
therefore be regarded as a mitigation option.<br />
1. The potential of carbon dioxide capture and<br />
storage (CCS) as a mitigation option was<br />
highlighted in 2005 including in the <strong>UK</strong>’s Carbon<br />
Abatement Technology strategy 27 , the G8<br />
Communiqué 28 and in the IPCC Special report<br />
on CCS 29 .<br />
3. Current evidence suggests that the cost of<br />
capture and storage of carbon dioxide from new<br />
power plants is around $40-60 per tonne of<br />
carbon dioxide, which can be expected to fall as<br />
the technology matures. This is comparable with<br />
other major abatement options, and suggests<br />
that the technology could have a major role in<br />
mitigating emissions. The rate of deployment is<br />
constrained by uncertainties over economics (cost<br />
of capture technologies, and emissions trading<br />
eligibility) and legal status of subsea-bed storage<br />
under the London and OSPAR Conventions,<br />
which are designed to protect the marine<br />
environment. These issues are being addressed<br />
by the <strong>UK</strong> through active participation in the<br />
negotiations under the marine treaties and the<br />
UNFCCC, cooperation with the EU via the EU<br />
<strong>Climate</strong> <strong>Change</strong> <strong>Programme</strong>, membership of the<br />
Carbon Sequestration Leadership Forum and the<br />
North Sea Basin Task Force, assistance with<br />
development by IPCC of emissions inventory<br />
methodologies relevant to CCS, and considering<br />
possible requirements for domestic regulation.<br />
The IPCC Special Report provides confidence in<br />
the permanence of storage in appropriately<br />
selected and managed geological reservoirs.<br />
2. Storage of carbon dioxide in deep geological<br />
formations, onshore or offshore, uses many of<br />
the same technologies that have been developed<br />
by the oil and gas industry. Three industrial-scale<br />
storage projects, which include direct injection of<br />
carbon dioxide into geological formations, are in<br />
operation in the world: the Sleipner project in the<br />
Norwegian sector of the North Sea, the Weyburn<br />
enhanced oil recovery project in Canada, and the<br />
In Salah project in a gas field in Algeria; more<br />
projects worldwide are at different stages of<br />
development. The <strong>UK</strong>’s Carbon Abatement<br />
Technology Strategy identified CCS along with<br />
improved efficiency in existing power generation<br />
as the two key technologies for reducing carbon<br />
dioxide emissions from fossil fuel use.<br />
27www.dti.gov.uk/energy/coal/cfft/cct/pub/catreportlinked.pdf<br />
28www.fco.gov.uk/Files/kfile/PostG8_Gleneagles_Communique,0.pdf<br />
29www.ipcc.ch/activity/ccsspm.pdf
188<br />
ANNEX H<br />
List of greenhouse gases<br />
Greenhouse gas Lifetime (years) 100 years global<br />
warming potential<br />
Carbon dioxide 50-200 1<br />
Methane 12.23 21<br />
Nitrous oxide 120 310<br />
HFC-23 264 11,700<br />
HFC-32 5.6 650<br />
HFC-41 3.7 150<br />
HFC-43-10mee 17.1 1,300<br />
HFC-125 32.6 2,800<br />
HFC-134 10.6 1,000<br />
HFC-134a 14.6 1,300<br />
HFC-152a 1.5 140<br />
HFC-143 3.8 300<br />
HFC-143a 48.3 3,800<br />
HFC-227ea 36.5 2,900<br />
HFC-236fa 209 6,300<br />
HFC-245ca 6.6 560<br />
Chloroform 0.51 4<br />
Methylene chloride 0.46 9<br />
Sulphur hexafluoride 3,200 23,900<br />
Perfluoromethane 50,000 6,500<br />
Perfluorethane 10,000 9,200<br />
Perfluoropropane 2,600 7,000<br />
Perfluorobutane 2,600 7,000<br />
Perfluoropentane 4,100 7,500<br />
Perfluorohexane 3,200 7,400<br />
Perfluorocyclobutane 3,200 8,700<br />
Trifluoroiodomethane
List of greenhouse gases<br />
189<br />
3. To compute the carbon equivalent of the<br />
emission of any gas, multiply its emission by the<br />
GWP and by 12/44, the ratio of the atomic<br />
weights of carbon and carbon dioxide. Thus, for<br />
example, an emission of 1 tonne of HFC-134 is<br />
equivalent to 1 x 1000 x 12/44 = 273 tonnes<br />
of carbon.<br />
4. The GWPs given in the table were published in<br />
the IPCC’s Second Assessment Report and are<br />
sometimes referred to as 1995 IPCC GWP values.<br />
These are the values agreed for use in reporting<br />
to the UNFCCC and the Kyto Protocol. IPCC’s<br />
Third Assessment Report published updated<br />
values that differ to some extent, these are<br />
shown in Section 1.
190<br />
ANNEX I<br />
Review of the 2000 <strong>Climate</strong> <strong>Change</strong> <strong>Programme</strong><br />
1. In the 2000 <strong>Climate</strong> <strong>Change</strong> <strong>Programme</strong>, the<br />
Government made a commitment to review both<br />
the <strong>Programme</strong> and its progress towards the<br />
Kyoto target and national goal in 2004. The<br />
review was launched on 15 September 2004 with<br />
the remit to look at how existing policies were<br />
performing and the range of measures that could<br />
be put in place in the future. In December 2004<br />
the Government launched a public consultation<br />
which ran from 8 December 2004 to March<br />
2005. Some of the questions asked were whether<br />
the existing measures were working, how they<br />
might be improved and whether any of them<br />
should be dropped. The Government also asked<br />
for ideas for new policies and measures that<br />
would ensure progress towards the 2010<br />
national goal.<br />
2. Around 300 responses were received. The<br />
majority of the responses were from business,<br />
including the energy supply industry and NGOs.<br />
A significant number of respondents stated that<br />
the evidence on climate change was stronger<br />
than ever and many also stated that the <strong>Climate</strong><br />
<strong>Change</strong> <strong>Programme</strong> needed to be more strategic,<br />
more joined-up and or/higher priority. A<br />
significant number of respondents felt that<br />
existing measures were not effective in reducing<br />
emissions of greenhouse gases and that the<br />
<strong>Programme</strong> needed to be stronger on adaptation<br />
to climate change. The consultation received over<br />
200 suggestions for additional policies.<br />
4. The evaluation of existing policies and appraisal<br />
of possible new policies that could be<br />
continued/adopted were carried out in<br />
accordance with the Treasury Green Book<br />
guidelines. Cost-benefit and cost-effectiveness<br />
analysis was carried out for both the evaluation<br />
of existing measures and the appraisal of possible<br />
new policies 32 . In addition an assessment of each<br />
policy’s impact on innovation, competitiveness,<br />
security of supply, fuel poverty and air quality<br />
was also carried out. The evaluation synthesis<br />
report can be found at: www.defra.gov.uk/<br />
environment/climatechange/pubs/ukccp/index.htm.<br />
There will be an appraisal synthesis report to<br />
accompany the evaluation synthesis report,<br />
containing summary information about all of<br />
the policies appraised as part of the <strong>Climate</strong><br />
<strong>Change</strong> <strong>Programme</strong>.<br />
3. The evaluation of existing policies in the 2000<br />
<strong>Climate</strong> <strong>Change</strong> <strong>Programme</strong> was mainly carried<br />
out by external consultants, following Green<br />
Book guidance, while appraisals were a mixture<br />
of in-house and external analysis. All the<br />
evaluations and appraisals were presented to the<br />
IAG for discussion. In addition to Government<br />
departments, the IAG included representatives<br />
from Ofgem, the Carbon Trust, the Energy Saving<br />
Trust, the Environment Agency and the<br />
Sustainable Development Commission.<br />
32The cost effectiveness analysis presents each policy in terms of the cost per tonne of carbon saved whilst the cost-benefit analysis shows each policy in terms<br />
of its net present value (all the benefits minus all the costs).
Glossary of terms<br />
191<br />
ACEA<br />
European Automobile Manufacturers Association<br />
BIC<br />
British Irish Council<br />
BSF<br />
Building Schools for the Future<br />
CO 2<br />
Carbon dioxide<br />
CAP<br />
Common Agricultural Policy<br />
CAT<br />
Carbon Abatement Technology<br />
CCA<br />
<strong>Climate</strong> change agreements<br />
CCP<br />
<strong>Climate</strong> <strong>Change</strong> <strong>Programme</strong><br />
CCS<br />
Carbon Capture and Sequestration<br />
CDM<br />
Clean Development Mechanism<br />
CFC<br />
Chlorofluorocarbon<br />
CHP<br />
Combined Heat and Power<br />
CCL<br />
<strong>Climate</strong> change levy<br />
CMM<br />
Coal mine methane<br />
CPA<br />
Comprehensive Performance Assessment<br />
CSF<br />
Catchment Sensitive Farming<br />
CSS<br />
Countryside Stewardship<br />
CT<br />
Carbon Trust<br />
DEFRA<br />
Department for Environment, Food and Rural Affairs<br />
DfT<br />
Department for Transport<br />
DPs<br />
Direct Participants<br />
DTI<br />
Department of Trade and Industry<br />
DVLA<br />
Driver and Vehicle Licensing Agency<br />
DWPA<br />
Diffuse Water Pollution from Agriculture<br />
ECA<br />
Enhanced Capital Allowance<br />
ECS<br />
Energy Crops Scheme<br />
EEACs<br />
Energy Efficiency Advice Centres<br />
EEC<br />
Energy Efficiency Commitment<br />
EIA<br />
Environmental Impact Assessment<br />
ELS<br />
Entry Level Stewardship<br />
ESA<br />
Environmentally Sensitive Area<br />
EST<br />
Energy Saving Trust<br />
ESWG<br />
Energy Services Working Group<br />
ETS<br />
Emissions Trading Scheme<br />
EU<br />
European Union<br />
EU ETS<br />
EU emissions trading scheme<br />
FWPS<br />
Farm Woodland Premium Scheme<br />
GDP<br />
Gross Domestic Product<br />
GW<br />
Gigawatts<br />
G8 Group of 8<br />
HA<br />
Hectare
192<br />
Glossary of terms<br />
HCFC<br />
Hydrochlorofluorocarbon<br />
HECA<br />
Home Energy Conservation Act<br />
HFC<br />
Hydrofluorocarbon<br />
HLS<br />
Higher Level Stewardship<br />
HMT<br />
Her Majesty’s Treasury<br />
ICAO<br />
International Civil Aviation Organisation<br />
IEA<br />
International Energy Agency<br />
IPCC<br />
Intergovernmental Panel on <strong>Climate</strong> <strong>Change</strong><br />
IPPC<br />
Integrated Pollution Prevention and Control<br />
JAMA<br />
Japanese Automobile Manufacturers Association<br />
JI<br />
Joint Implementation<br />
KAMA<br />
Korean Automobile Manufacturers Association<br />
KP<br />
Kyoto Protocol<br />
LA<br />
Local authority<br />
LCPD<br />
Large Combustion Plant Directive<br />
LNG<br />
Liquefied Natural Gas<br />
MCHP<br />
Micro-CHP<br />
MtC<br />
Million tonnes of carbon equivalent<br />
MW<br />
Megawatt<br />
N 2<br />
O<br />
Nitrous oxide<br />
NAO<br />
National Audit Office<br />
NAP<br />
National Allocation Plan<br />
NEAT<br />
NHS Environmental Assessment Tool<br />
NHSIS<br />
NHS in Scotland<br />
NO x<br />
Nitrogen oxides<br />
NVZ<br />
Nitrate Vulnerable Zone<br />
ODPM<br />
Office of the Deputy Prime Minister<br />
Ofgem<br />
Office of Gas and Electricity Regulation<br />
PFC<br />
Perfluorocarbon<br />
PM<br />
Particulate Matter<br />
PPC<br />
Pollution Prevention and Control<br />
PPS22 Planning Policy Statement 22<br />
RDA<br />
Regional Development Agency<br />
RDR<br />
Rural Development Regulation<br />
RO<br />
Renewables Obligation<br />
SCCP<br />
Scottish <strong>Climate</strong> <strong>Change</strong> <strong>Programme</strong><br />
SD<br />
Sustainable development<br />
SEPA<br />
Scottish Environment Protection Agency<br />
SF 6<br />
Sulphur hexafluoride<br />
SO 2<br />
Sulphur dioxide<br />
STEP<br />
School Turnkey Energy <strong>Programme</strong>
Glossary of Terms<br />
193<br />
TIWG<br />
<strong>UK</strong>ETS<br />
<strong>UK</strong>CIP<br />
UNFCCC<br />
VED<br />
WAG<br />
Transmission Issues Working Group<br />
<strong>UK</strong> Emissions Trading Scheme<br />
<strong>UK</strong> <strong>Climate</strong> Impacts <strong>Programme</strong><br />
United Nations Framework Convention on <strong>Climate</strong> <strong>Change</strong><br />
Vehicle Excise Duty<br />
Welsh Assembly Government<br />
Printed in the <strong>UK</strong> for the Stationery Office Limited<br />
on behalf of the Controller of Her Majesty's Stationery Office<br />
185031 03/06 19798<br />
Printed on material containing 80% post-consumer waste and 20% Elemental Chlorine Free pulp
Published by TSO (The Stationery Office) and available from:<br />
Online<br />
www.tsoshop.co.uk<br />
Mail,Telephone, Fax & E-mail<br />
TSO<br />
PO Box 29, Norwich, NR3 1GN<br />
Telephone orders/General enquiries: 0870 600 5522<br />
Fax orders: 0870 600 5533<br />
E-mail: book.orders@tso.co.uk<br />
Textphone 0870 240 3701<br />
TSO Shops<br />
123 Kingsway, London,WC2B 6PQ<br />
020 7242 6393 Fax 020 7242 6394<br />
68-69 Bull Street, Birmingham B4 6AD<br />
0121 236 9696 Fax 0121 236 9699<br />
9-21 Princess Street, Manchester M60 8AS<br />
0161 834 7201 Fax 0161 833 0634<br />
16 Arthur Street, Belfast BT1 4GD<br />
028 9023 8451 Fax 028 9023 5401<br />
18-19 High Street, Cardiff CF10 1PT<br />
029 2039 5548 Fax 029 2038 4347<br />
71 Lothian Road, Edinburgh EH3 9AZ<br />
0870 606 5566 Fax 0870 606 5588<br />
ISBN 0-10-167642-5<br />
TSO Accredited Agents<br />
(see Yellow Pages)<br />
and through good booksellers<br />
9 780101 676427