UK Climate Change Programme 2006 - JNCC - Defra
UK Climate Change Programme 2006 - JNCC - Defra
UK Climate Change Programme 2006 - JNCC - Defra

Create successful ePaper yourself
Turn your PDF publications into a flip-book with our unique Google optimized e-Paper software.
Energy supply<br />
33<br />
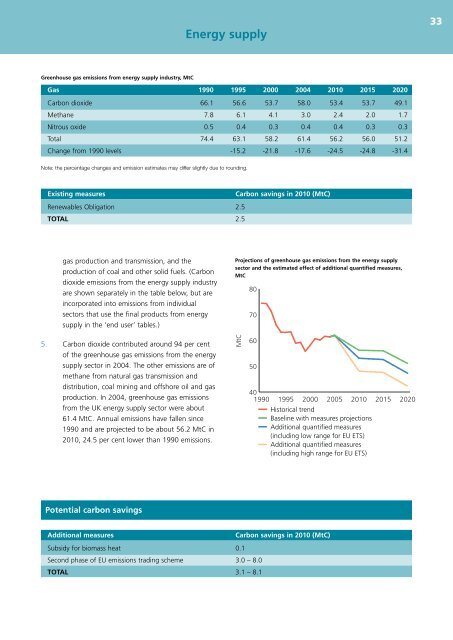
Greenhouse gas emissions from energy supply industry, MtC<br />
Gas 1990 1995 2000 2004 2010 2015 2020<br />
Carbon dioxide 66.1 56.6 53.7 58.0 53.4 53.7 49.1<br />
Methane 7.8 6.1 4.1 3.0 2.4 2.0 1.7<br />
Nitrous oxide 0.5 0.4 0.3 0.4 0.4 0.3 0.3<br />
Total 74.4 63.1 58.2 61.4 56.2 56.0 51.2<br />
<strong>Change</strong> from 1990 levels -15.2 -21.8 -17.6 -24.5 -24.8 -31.4<br />
Note: the percentage changes and emission estimates may differ slightly due to rounding.<br />
Existing measures<br />
Carbon savings in 2010 (MtC)<br />
Renewables Obligation 2.5<br />
TOTAL 2.5<br />
gas production and transmission, and the<br />
production of coal and other solid fuels. (Carbon<br />
dioxide emissions from the energy supply industry<br />
are shown separately in the table below, but are<br />
incorporated into emissions from individual<br />
sectors that use the final products from energy<br />
supply in the ‘end user’ tables.)<br />
Projections of greenhouse gas emissions from the energy supply<br />
sector and the estimated effect of additional quantified measures,<br />
MtC<br />
80<br />
70<br />
5. Carbon dioxide contributed around 94 per cent<br />
of the greenhouse gas emissions from the energy<br />
supply sector in 2004. The other emissions are of<br />
methane from natural gas transmission and<br />
distribution, coal mining and offshore oil and gas<br />
production. In 2004, greenhouse gas emissions<br />
from the <strong>UK</strong> energy supply sector were about<br />
61.4 MtC. Annual emissions have fallen since<br />
1990 and are projected to be about 56.2 MtC in<br />
2010, 24.5 per cent lower than 1990 emissions.<br />
MtC<br />
60<br />
50<br />
40<br />
1990<br />
1995<br />
2000<br />
2005<br />
2010<br />
Historical trend<br />
Baseline with measures projections<br />
Additional quantified measures<br />
(including low range for EU ETS)<br />
Additional quantified measures<br />
(including high range for EU ETS)<br />
2015<br />
2020<br />
Potential carbon savings<br />
Additional measures<br />
Carbon savings in 2010 (MtC)<br />
Subsidy for biomass heat 0.1<br />
Second phase of EU emissions trading scheme 3.0 – 8.0<br />
TOTAL 3.1 – 8.1