UK Climate Change Programme 2006 - JNCC - Defra
UK Climate Change Programme 2006 - JNCC - Defra
UK Climate Change Programme 2006 - JNCC - Defra

You also want an ePaper? Increase the reach of your titles
YUMPU automatically turns print PDFs into web optimized ePapers that Google loves.
62<br />
Transport<br />
make and on the other hand help people make<br />
more informed travel choices, which will benefit<br />
both them and the environment.<br />
5. And in making a significant contribution to<br />
meeting the Government’s long-term emissions<br />
reduction goals there will also be opportunities<br />
for the transport sector and for <strong>UK</strong> industry, with<br />
the potential to benefit from domestic and global<br />
demand for innovative products and services<br />
geared towards greener transport.<br />
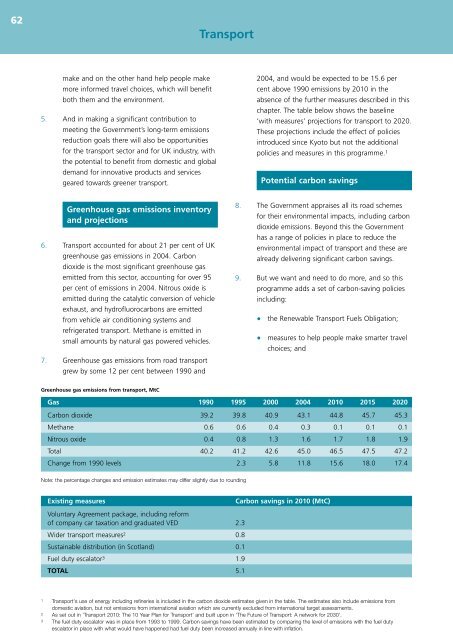
2004, and would be expected to be 15.6 per<br />
cent above 1990 emissions by 2010 in the<br />
absence of the further measures described in this<br />
chapter. The table below shows the baseline<br />
‘with measures’ projections for transport to 2020.<br />
These projections include the effect of policies<br />
introduced since Kyoto but not the additional<br />
policies and measures in this programme. 1<br />
Potential carbon savings<br />
Greenhouse gas emissions inventory<br />
and projections<br />
6. Transport accounted for about 21 per cent of <strong>UK</strong><br />
greenhouse gas emissions in 2004. Carbon<br />
dioxide is the most significant greenhouse gas<br />
emitted from this sector, accounting for over 95<br />
per cent of emissions in 2004. Nitrous oxide is<br />
emitted during the catalytic conversion of vehicle<br />
exhaust, and hydrofluorocarbons are emitted<br />
from vehicle air conditioning systems and<br />
refrigerated transport. Methane is emitted in<br />
small amounts by natural gas powered vehicles.<br />
7. Greenhouse gas emissions from road transport<br />
grew by some 12 per cent between 1990 and<br />
8. The Government appraises all its road schemes<br />
for their environmental impacts, including carbon<br />
dioxide emissions. Beyond this the Government<br />
has a range of policies in place to reduce the<br />
environmental impact of transport and these are<br />
already delivering significant carbon savings.<br />
9. But we want and need to do more, and so this<br />
programme adds a set of carbon-saving policies<br />
including:<br />
• the Renewable Transport Fuels Obligation;<br />
• measures to help people make smarter travel<br />
choices; and<br />
Greenhouse gas emissions from transport, MtC<br />
Gas 1990 1995 2000 2004 2010 2015 2020<br />
Carbon dioxide 39.2 39.8 40.9 43.1 44.8 45.7 45.3<br />
Methane 0.6 0.6 0.4 0.3 0.1 0.1 0.1<br />
Nitrous oxide 0.4 0.8 1.3 1.6 1.7 1.8 1.9<br />
Total 40.2 41.2 42.6 45.0 46.5 47.5 47.2<br />
<strong>Change</strong> from 1990 levels 2.3 5.8 11.8 15.6 18.0 17.4<br />
Note: the percentage changes and emission estimates may differ slightly due to rounding<br />
Existing measures<br />
Carbon savings in 2010 (MtC)<br />
Voluntary Agreement package, including reform<br />
of company car taxation and graduated VED 2.3<br />
Wider transport measures 2 0.8<br />
Sustainable distribution (in Scotland) 0.1<br />
Fuel duty escalator 3 1.9<br />
TOTAL 5.1<br />
1 Transport's use of energy including refineries is included in the carbon dioxide estimates given in the table. The estimates also include emissions from<br />
domestic aviation, but not emissions from international aviation which are currently excluded from international target assessments.<br />
2 As set out in 'Transport 2010: The 10 Year Plan for Transport' and built upon in 'The Future of Transport: A network for 2030'.<br />
3 The fuel duty escalator was in place from 1993 to 1999. Carbon savings have been estimated by comparing the level of emissions with the fuel duty<br />
escalator in place with what would have happened had fuel duty been increased annually in line with inflation.