UK Climate Change Programme 2006 - JNCC - Defra
UK Climate Change Programme 2006 - JNCC - Defra
UK Climate Change Programme 2006 - JNCC - Defra

You also want an ePaper? Increase the reach of your titles
YUMPU automatically turns print PDFs into web optimized ePapers that Google loves.
170<br />
ANNEX A<br />
Emissions projections<br />
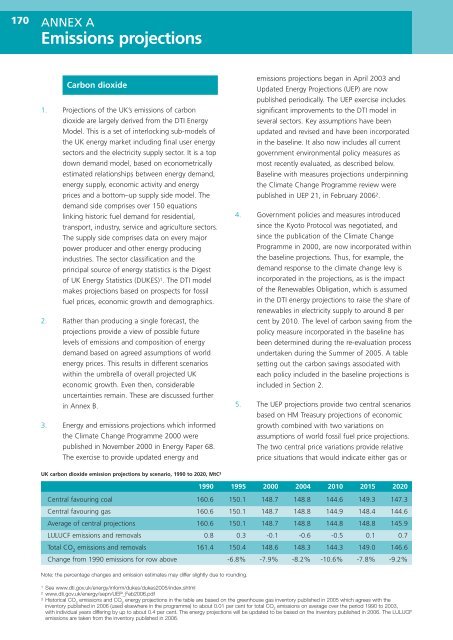
Carbon dioxide<br />
1. Projections of the <strong>UK</strong>’s emissions of carbon<br />
dioxide are largely derived from the DTI Energy<br />
Model. This is a set of interlocking sub-models of<br />
the <strong>UK</strong> energy market including final user energy<br />
sectors and the electricity supply sector. It is a top<br />
down demand model, based on econometrically<br />
estimated relationships between energy demand,<br />
energy supply, economic activity and energy<br />
prices and a bottom–up supply side model. The<br />
demand side comprises over 150 equations<br />
linking historic fuel demand for residential,<br />
transport, industry, service and agriculture sectors.<br />
The supply side comprises data on every major<br />
power producer and other energy producing<br />
industries. The sector classification and the<br />
principal source of energy statistics is the Digest<br />
of <strong>UK</strong> Energy Statistics (D<strong>UK</strong>ES) 1 . The DTI model<br />
makes projections based on prospects for fossil<br />
fuel prices, economic growth and demographics.<br />
2. Rather than producing a single forecast, the<br />
projections provide a view of possible future<br />
levels of emissions and composition of energy<br />
demand based on agreed assumptions of world<br />
energy prices. This results in different scenarios<br />
within the umbrella of overall projected <strong>UK</strong><br />
economic growth. Even then, considerable<br />
uncertainties remain. These are discussed further<br />
in Annex B.<br />
3. Energy and emissions projections which informed<br />
the <strong>Climate</strong> <strong>Change</strong> <strong>Programme</strong> 2000 were<br />
published in November 2000 in Energy Paper 68.<br />
The exercise to provide updated energy and<br />
emissions projections began in April 2003 and<br />
Updated Energy Projections (UEP) are now<br />
published periodically. The UEP exercise includes<br />
significant improvements to the DTI model in<br />
several sectors. Key assumptions have been<br />
updated and revised and have been incorporated<br />
in the baseline. It also now includes all current<br />
government environmental policy measures as<br />
most recently evaluated, as described below.<br />
Baseline with measures projections underpinning<br />
the <strong>Climate</strong> <strong>Change</strong> <strong>Programme</strong> review were<br />
published in UEP 21, in February <strong>2006</strong> 2 .<br />
4. Government policies and measures introduced<br />
since the Kyoto Protocol was negotiated, and<br />
since the publication of the <strong>Climate</strong> <strong>Change</strong><br />
<strong>Programme</strong> in 2000, are now incorporated within<br />
the baseline projections. Thus, for example, the<br />
demand response to the climate change levy is<br />
incorporated in the projections, as is the impact<br />
of the Renewables Obligation, which is assumed<br />
in the DTI energy projections to raise the share of<br />
renewables in electricity supply to around 8 per<br />
cent by 2010. The level of carbon saving from the<br />
policy measure incorporated in the baseline has<br />
been determined during the re-evaluation process<br />
undertaken during the Summer of 2005. A table<br />
setting out the carbon savings associated with<br />
each policy included in the baseline projections is<br />
included in Section 2.<br />
5. The UEP projections provide two central scenarios<br />
based on HM Treasury projections of economic<br />
growth combined with two variations on<br />
assumptions of world fossil fuel price projections.<br />
The two central price variations provide relative<br />
price situations that would indicate either gas or<br />
<strong>UK</strong> carbon dioxide emission projections by scenario, 1990 to 2020, MtC 3<br />
1990 1995 2000 2004 2010 2015 2020<br />
Central favouring coal 160.6 150.1 148.7 148.8 144.6 149.3 147.3<br />
Central favouring gas 160.6 150.1 148.7 148.8 144.9 148.4 144.6<br />
Average of central projections 160.6 150.1 148.7 148.8 144.8 148.8 145.9<br />
LULUCF emissions and removals 0.8 0.3 -0.1 -0.6 -0.5 0.1 0.7<br />
Total CO 2<br />
emissions and removals 161.4 150.4 148.6 148.3 144.3 149.0 146.6<br />
<strong>Change</strong> from 1990 emissions for row above -6.8% -7.9% -8.2% -10.6% -7.8% -9.2%<br />
Note: the percentage changes and emission estimates may differ slightly due to rounding.<br />
1 See www.dti.gov.uk/energy/inform/dukes/dukes2005/index.shtml<br />
2 www.dti.gov.uk/energy/sepn/UEP_Feb<strong>2006</strong>.pdf<br />
3 Historical CO 2<br />
emissions and CO 2<br />
energy projections in the table are based on the greenhouse gas inventory published in 2005 which agrees with the<br />
inventory published in <strong>2006</strong> (used elsewhere in the programme) to about 0.01 per cent for total CO 2<br />
emissions on average over the period 1990 to 2003,<br />
with individual years differing by up to about 0.4 per cent. The energy projections will be updated to be based on the inventory published in <strong>2006</strong>. The LULUCF<br />
emissions are taken from the inventory published in <strong>2006</strong>.