Contingency Table Example - Automobile Maintence Data.pdf
Contingency Table Example - Automobile Maintence Data.pdf
Contingency Table Example - Automobile Maintence Data.pdf

Create successful ePaper yourself
Turn your PDF publications into a flip-book with our unique Google optimized e-Paper software.
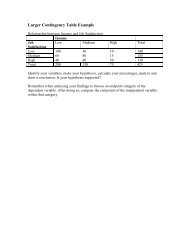
<strong>Contingency</strong> <strong>Table</strong> Construction and Analysis<br />
<strong>Automobile</strong> Maintenance <strong>Data</strong>, Berrysville, 2002<br />
<strong>Automobile</strong><br />
Maintenance<br />
<strong>Automobile</strong><br />
None<br />
Regularly<br />
Total<br />
Breakdowns<br />
Scheduled<br />
No breakdown 72 194 266<br />
Breakdown 78 56 134<br />
Total 150 250 400<br />
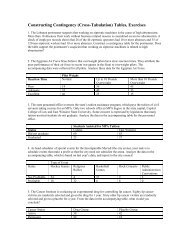
The city council of Berrysville, California, has been under considerable pressure to economize.<br />
Last year, the council passed an ordinance authorizing an experimental program for the<br />
maintenance of city-owned vehicles. The bill stipulates that, for 1 year, a random sample of 150<br />
of the city’s 400 automobiles will receive no preventative maintenance and will simply be driven<br />
until they break down. The other 250 automobiles will receive regularly scheduled preventative<br />
maintenance. The council is interested in whether the expensive program of preventive<br />
maintenance actually reduces the number of breakdowns. After a year under the experimental<br />
maintenance program, the city council was presented with the data in <strong>Table</strong> 15.12, which<br />
summarizes the number of automobile breakdowns under the no maintenance and preventative<br />
maintenance conditions. Analyze the data for the city council, and help them by making a<br />
recommendation regarding whether the program should be continued (and/or expanded) or<br />
terminated.<br />
Step 1: Determine which variable is independent and which is dependent and state as a<br />
hypothesis<br />
Independent _________________ Dependent _________________<br />
Hypothesis:<br />
Step 2: Calculate percentages within the categories of the independent variable<br />
<strong>Automobile</strong> Maintenance <strong>Data</strong>, Berrysville, 2002<br />
Dependent Variable:<br />
Independent Variable:<br />
Ind Var<br />
Category:<br />
Ind Var<br />
Category:<br />
Dep Var<br />
Category:<br />
Dep Var<br />
Category:<br />
(___ / ___) x 100 = _____% (___ / ___) x 100 = _____%<br />
(___ / ___) x 100 = _____% (___ / ___) x 100 = _____%<br />
Total (n = ) _____% (n = ) _____%<br />
Step 3: Compare percentages for one of the categories of the dependent variable.
<strong>Contingency</strong> <strong>Table</strong> Construction and Analysis<br />
<strong>Automobile</strong> <strong>Maintence</strong> <strong>Data</strong>, Berrysville, 2002<br />
<strong>Automobile</strong><br />
Maintenance<br />
<strong>Automobile</strong><br />
None Regularly Scheduled Total<br />
Breakdowns<br />
No breakdown 72 194 266<br />
Breakdown 78 56 134<br />
Total 150 250 400<br />
The city council of Berrysville, California, has been under considerable pressure to economize.<br />
Last year, the council passed an ordinance authorizing an experimental program for the<br />
maintenance of city-owned vehicles. The bill stipulates that, for 1 year, a random sample of 150<br />
of the city’s 400 automobiles will receive no preventative maintenance and will simply be driven<br />
until they break down. The other 250 automobiles will receive regularly scheduled preventative<br />
maintenance. The council is interested in whether the expensive program of preventive<br />
maintenance actually reduces the number of breakdowns. After a year under the experimental<br />
maintenance program, the city council was presented with the data in <strong>Table</strong> 15.12, which<br />
summarizes the number of automobile breakdowns under the no maintenance and preventative<br />
maintenance conditions. Analyze the data for the city council, and help them by making a<br />
recommendation regarding whether the program should be continued (and/or expanded) or<br />
terminated.<br />
Step 1: Determine which variable is independent and which is dependent and state as a hypothesis<br />
It’s pretty obvious that automobile maintenance is expected to affect the number of breakdowns.<br />
Therefore, “maintenance” is the IV and “breakdowns” is the DV. Hypothesis: the greater the<br />
level of maintenance, the less the rate of breakdowns.<br />
Step 2: Calculate percentages within the categories of the independent variable<br />
<strong>Automobile</strong> Maintenance <strong>Data</strong>, Berrysville, 2002<br />
Dependent Variable:<br />
<strong>Automobile</strong> Breakdowns<br />
Dep Var<br />
Category: No Breakdown<br />
Dep Var<br />
Category: Breakdown<br />
Independent Variable: <strong>Automobile</strong> Maintenance<br />
Ind Var<br />
Category: None<br />
Ind Var<br />
Category: Regularly Scheduled<br />
(72 / 50) x 100 = 48% (194 / 250) x 100 = 77.6%<br />
(78 / 150) x 100 = 52% (56 / 250) x 100 = 22.4%<br />
Total (n = 150) 100% (n = 250) 100%<br />
Step 3: Compare percentages for one of the categories of the dependent variable.<br />
Although more that half (52%) of the automobiles that received no maintenance broke down<br />
during the 1-year experimental program, only 22.4% of the automobiles that received regularly<br />
schedule maintenance did so. This is a difference of 29.6%. Thus, automobile maintenance<br />
appears to make nearly a 30% difference in the rate of breakdowns. The data support the<br />
hypothesis. Recommendation: terminate the program.