Density functional theory for chemical engineering: From capillarity ...
Density functional theory for chemical engineering: From capillarity ...
Density functional theory for chemical engineering: From capillarity ...

You also want an ePaper? Increase the reach of your titles
YUMPU automatically turns print PDFs into web optimized ePapers that Google loves.
on the intermolecular <strong>for</strong>ces but also on the capillary waves of<br />
the interface. Using an effective interface Hamiltonian derived<br />
from DFT and a Gaussian approximation <strong>for</strong> distortion of the<br />
planar density profile, Mecke and Dietrich 125 predicted that the<br />
surface tension first declines with surface-wave vector q, attains<br />
a minimum, and then grows as q 2 <strong>for</strong> large q. In other<br />
words, a negative correction must be applied to the surface<br />
tension if the interface shows a large curvature. Because of the<br />
reduction in surface tension, the interface de<strong>for</strong>mation becomes<br />
more likely at small-length scales. This prediction contradicts<br />
results from a conventional capillary-wave model but has been<br />
confirmed by experimental results from X-ray surface scattering.<br />
126 In most cases, the capillary wave has a more significant<br />
influence on the density profiles than on the surface tension.<br />
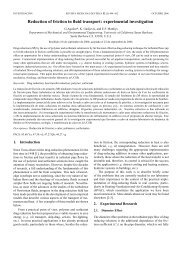
Figure 7. (A) A new scaling relation between the surface<br />
pressure () and the bulk concentration of n-<br />
dodecyl pentaoxyethylene glycol ether (C12E5)<br />
at the air–water interface; (B) surface area per<br />
C12E5 molecule vs. bulk concentration of the<br />
surfactant from SANS/ellipsometry measurements<br />
(points) and from DFT (lines) (reproduced<br />
from Stoyanov et al. 124 ).<br />
In (A) Y 2/5 2/5 0 , where subscript “0” denotes an<br />
arbitrary reference point, c stands <strong>for</strong> molar concentration<br />
(M).<br />
where K s is the elastic constant of the chain molecule, <br />
represents the local volume fraction of the surfactant, is the<br />
Flory parameter, and v solv is the solvent molecular volume.<br />
Based on Eq. 18, Stoyanov et al. showed that the surface<br />
pressure, defined as the difference between the interfacial tensions<br />
without and with surfactant molecules, p ,<br />
follows the scaling relation 124<br />
2/5 2k BT<br />
5 3/5 ln c (19)<br />
Gas Adsorption and Materials Characterization<br />
Gas adsorption is a broad subject relevant to numerous<br />
industrial applications ranging from natural gas recovery, fuel<br />
storage, and CO 2 sequestration to sensors <strong>for</strong> <strong>chemical</strong> warfare<br />
agents and to the treatment of lung diseases. 127 As proposed by<br />
the IUPAC Commission on Colloid and Surface Chemistry, the<br />
equilibrium behavior of gas adsorption at a solid substrate can<br />
be classified into six basic types depending on the strength of<br />
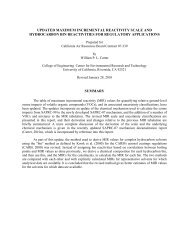
gas–substrate interactions and on the pore size. Figure 8 schematically<br />
shows adsorption isotherms according to the IUPAC<br />
classification. 128 Type I is typical <strong>for</strong> gas adsorption in microporous<br />
materials such as activated carbon and zeolites with<br />
pore size 2 nm. Types II and III correspond to adsorption in<br />
macroporous or on nonporous materials with strong and weak<br />
fluid–surface attractions, respectively. Types IV and V are<br />
typical <strong>for</strong> mesoporous materials (with pore size between 2 and<br />
50 nm) with strong and weak surface attractions; both exhibit<br />
a hysteresis loop in adsorption and desorption. Type VI applies<br />
to systems with strong surface–gas interactions and when the<br />
temperature is near the triple point of the adsorbate.<br />
Classical DFT provides a state-of-the-art technique <strong>for</strong> modeling<br />
gas adsorption at the molecular level. It enables calculations<br />
not only of adsorption isotherms but also of the detailed<br />
inhomogeneous density profiles of gas molecules and of surface<br />
phase transitions. 129,130 Unlike conventional semiempirical<br />
theories such as Langmuir, Brunauer–Emmett–Teller (BET),<br />
and Kelvin equations, and numerous variations and extensions<br />
where [(18/25)w 2 K s (mv 0 ) 5 ] 1/3 and w (1 2)k B T/v solv ;<br />
m and v 0 are the number of segments and the segment volume<br />
of the surfactant molecule, respectively; and c is the surfactant<br />
molar concentration. Figure 7A shows the surface pressure as<br />
a function of the bulk surfactant concentration derived from<br />
Eq. 19. The agreement of <strong>theory</strong> with experiment is truly<br />
remarkable, bearing in mind the simplicity of the theoretical<br />
model. Figure 7B shows the predicted surface area per surfactant<br />
molecule as a function of surfactant concentration. The<br />
theoretical predictions are again in good agreement with experimental<br />
data from small-angle neutron scattering (SANS)<br />
and ellipsometry measurements.<br />
Capillary waves<br />
The vapor–liquid and liquid–liquid interfaces are presumed<br />
planar in all the above discussions. However, in general, both<br />
interfacial density profiles and surface tension depend not only<br />
Figure 8. IUPAC classifications of gas adsorption isotherms.<br />
Here P 0 stands <strong>for</strong> the gas saturation pressure. [Color figure<br />
can be viewed in the online issue, which is available at<br />
www.interscience.wiley.com.]<br />
1178 March 2006 Vol. 52, No. 3<br />
AIChE Journal