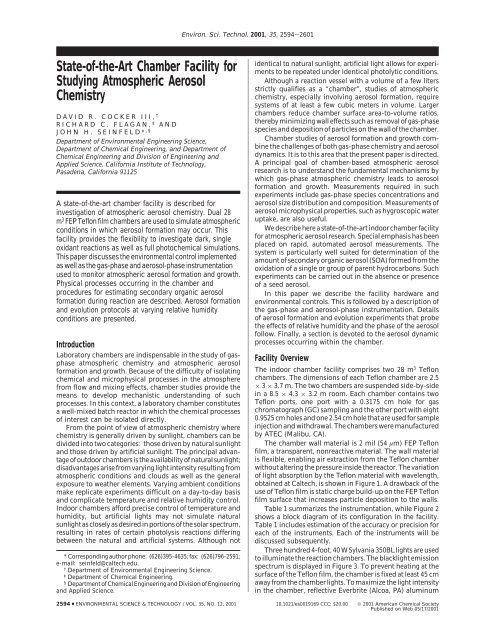
State-of-the-Art Chamber Facility for Studying Atmospheric Aerosol ...
State-of-the-Art Chamber Facility for Studying Atmospheric Aerosol ...
State-of-the-Art Chamber Facility for Studying Atmospheric Aerosol ...

Create successful ePaper yourself
Turn your PDF publications into a flip-book with our unique Google optimized e-Paper software.
Environ. Sci. Technol. 2001, 35, 2594-2601<br />
<strong>State</strong>-<strong>of</strong>-<strong>the</strong>-<strong>Art</strong> <strong>Chamber</strong> <strong>Facility</strong> <strong>for</strong><br />
<strong>Studying</strong> <strong>Atmospheric</strong> <strong>Aerosol</strong><br />
Chemistry<br />
DAVID R. COCKER III, †<br />
RICHARD C. FLAGAN, ‡ AND<br />
JOHN H. SEINFELD* ,§<br />
Department <strong>of</strong> Environmental Engineering Science,<br />
Department <strong>of</strong> Chemical Engineering, and Department <strong>of</strong><br />
Chemical Engineering and Division <strong>of</strong> Engineering and<br />
Applied Science, Cali<strong>for</strong>nia Institute <strong>of</strong> Technology,<br />
Pasadena, Cali<strong>for</strong>nia 91125<br />
A state-<strong>of</strong>-<strong>the</strong>-art chamber facility is described <strong>for</strong><br />
investigation <strong>of</strong> atmospheric aerosol chemistry. Dual 28<br />
m 3 FEP Teflon film chambers are used to simulate atmospheric<br />
conditions in which aerosol <strong>for</strong>mation may occur. This<br />
facility provides <strong>the</strong> flexibility to investigate dark, single<br />
oxidant reactions as well as full photochemical simulations.<br />
This paper discusses <strong>the</strong> environmental control implemented<br />
as well as <strong>the</strong> gas-phase and aerosol-phase instrumentation<br />
used to monitor atmospheric aerosol <strong>for</strong>mation and growth.<br />
Physical processes occurring in <strong>the</strong> chamber and<br />
procedures <strong>for</strong> estimating secondary organic aerosol<br />
<strong>for</strong>mation during reaction are described. <strong>Aerosol</strong> <strong>for</strong>mation<br />
and evolution protocols at varying relative humidity<br />
conditions are presented.<br />
Introduction<br />
Laboratory chambers are indispensable in <strong>the</strong> study <strong>of</strong> gasphase<br />
atmospheric chemistry and atmospheric aerosol<br />
<strong>for</strong>mation and growth. Because <strong>of</strong> <strong>the</strong> difficulty <strong>of</strong> isolating<br />
chemical and microphysical processes in <strong>the</strong> atmosphere<br />
from flow and mixing effects, chamber studies provide <strong>the</strong><br />
means to develop mechanistic understanding <strong>of</strong> such<br />
processes. In this context, a laboratory chamber constitutes<br />
a well-mixed batch reactor in which <strong>the</strong> chemical processes<br />
<strong>of</strong> interest can be isolated directly.<br />
From <strong>the</strong> point <strong>of</strong> view <strong>of</strong> atmospheric chemistry where<br />
chemistry is generally driven by sunlight, chambers can be<br />
divided into two categories: those driven by natural sunlight<br />
and those driven by artificial sunlight. The principal advantage<br />
<strong>of</strong> outdoor chambers is <strong>the</strong> availability <strong>of</strong> natural sunlight;<br />
disadvantages arise from varying light intensity resulting from<br />
atmospheric conditions and clouds as well as <strong>the</strong> general<br />
exposure to wea<strong>the</strong>r elements. Varying ambient conditions<br />
make replicate experiments difficult on a day-to-day basis<br />
and complicate temperature and relative humidity control.<br />
Indoor chambers af<strong>for</strong>d precise control <strong>of</strong> temperature and<br />
humidity, but artificial lights may not simulate natural<br />
sunlight as closely as desired in portions <strong>of</strong> <strong>the</strong> solar spectrum,<br />
resulting in rates <strong>of</strong> certain photolysis reactions differing<br />
between <strong>the</strong> natural and artificial systems. Although not<br />
* Corresponding author phone: (626)395-4635; fax: (626)796-2591;<br />
e-mail: seinfeld@caltech.edu.<br />
†<br />
Department <strong>of</strong> Environmental Engineering Science.<br />
‡<br />
Department <strong>of</strong> Chemical Engineering.<br />
§<br />
Department <strong>of</strong> Chemical Engineering and Division <strong>of</strong> Engineering<br />
and Applied Science.<br />
identical to natural sunlight, artificial light allows <strong>for</strong> experiments<br />
to be repeated under identical photolytic conditions.<br />
Although a reaction vessel with a volume <strong>of</strong> a few liters<br />
strictly qualifies as a “chamber”, studies <strong>of</strong> atmospheric<br />
chemistry, especially involving aerosol <strong>for</strong>mation, require<br />
systems <strong>of</strong> at least a few cubic meters in volume. Larger<br />
chambers reduce chamber surface area-to-volume ratios,<br />
<strong>the</strong>reby minimizing wall effects such as removal <strong>of</strong> gas-phase<br />
species and deposition <strong>of</strong> particles on <strong>the</strong> wall <strong>of</strong> <strong>the</strong> chamber.<br />
<strong>Chamber</strong> studies <strong>of</strong> aerosol <strong>for</strong>mation and growth combine<br />
<strong>the</strong> challenges <strong>of</strong> both gas-phase chemistry and aerosol<br />
dynamics. It is to this area that <strong>the</strong> present paper is directed.<br />
A principal goal <strong>of</strong> chamber-based atmospheric aerosol<br />
research is to understand <strong>the</strong> fundamental mechanisms by<br />
which gas-phase atmospheric chemistry leads to aerosol<br />
<strong>for</strong>mation and growth. Measurements required in such<br />
experiments include gas-phase species concentrations and<br />
aerosol size distribution and composition. Measurements <strong>of</strong><br />
aerosol microphysical properties, such as hygroscopic water<br />
uptake, are also useful.<br />
We describe here a state-<strong>of</strong>-<strong>the</strong>-art indoor chamber facility<br />
<strong>for</strong> atmospheric aerosol research. Special emphasis has been<br />
placed on rapid, automated aerosol measurements. The<br />
system is particularly well suited <strong>for</strong> determination <strong>of</strong> <strong>the</strong><br />
amount <strong>of</strong> secondary organic aerosol (SOA) <strong>for</strong>med from <strong>the</strong><br />
oxidation <strong>of</strong> a single or group <strong>of</strong> parent hydrocarbons. Such<br />
experiments can be carried out in <strong>the</strong> absence or presence<br />
<strong>of</strong> a seed aerosol.<br />
In this paper we describe <strong>the</strong> facility hardware and<br />
environmental controls. This is followed by a description <strong>of</strong><br />
<strong>the</strong> gas-phase and aerosol-phase instrumentation. Details<br />
<strong>of</strong> aerosol <strong>for</strong>mation and evolution experiments that probe<br />
<strong>the</strong> effects <strong>of</strong> relative humidity and <strong>the</strong> phase <strong>of</strong> <strong>the</strong> aerosol<br />
follow. Finally, a section is devoted to <strong>the</strong> aerosol dynamic<br />
processes occurring within <strong>the</strong> chamber.<br />
<strong>Facility</strong> Overview<br />
The indoor chamber facility comprises two 28 m 3 Teflon<br />
chambers. The dimensions <strong>of</strong> each Teflon chamber are 2.5<br />
× 3 × 3.7 m. The two chambers are suspended side-by-side<br />
in a 8.5 × 4.3 × 3.2 m room. Each chamber contains two<br />
Teflon ports, one port with a 0.3175 cm hole <strong>for</strong> gas<br />
chromatograph (GC) sampling and <strong>the</strong> o<strong>the</strong>r port with eight<br />
0.9525 cm holes and one 2.54 cm hole that are used <strong>for</strong> sample<br />
injection and withdrawal. The chambers were manufactured<br />
by ATEC (Malibu, CA).<br />
The chamber wall material is 2 mil (54 µm) FEP Teflon<br />
film, a transparent, nonreactive material. The wall material<br />
is flexible, enabling air extraction from <strong>the</strong> Teflon chamber<br />
without altering <strong>the</strong> pressure inside <strong>the</strong> reactor. The variation<br />
<strong>of</strong> light absorption by <strong>the</strong> Teflon material with wavelength,<br />
obtained at Caltech, is shown in Figure 1. A drawback <strong>of</strong> <strong>the</strong><br />
use <strong>of</strong> Teflon film is static charge build-up on <strong>the</strong> FEP Teflon<br />
film surface that increases particle deposition to <strong>the</strong> walls.<br />
Table 1 summarizes <strong>the</strong> instrumentation, while Figure 2<br />
shows a block diagram <strong>of</strong> its configuration in <strong>the</strong> facility.<br />
Table 1 includes estimation <strong>of</strong> <strong>the</strong> accuracy or precision <strong>for</strong><br />
each <strong>of</strong> <strong>the</strong> instruments. Each <strong>of</strong> <strong>the</strong> instruments will be<br />
discussed subsequently.<br />
Three hundred 4-foot, 40 W Sylvania 350BL lights are used<br />
to illuminate <strong>the</strong> reaction chambers. The blacklight emission<br />
spectrum is displayed in Figure 3. To prevent heating at <strong>the</strong><br />
surface <strong>of</strong> <strong>the</strong> Teflon film, <strong>the</strong> chamber is fixed at least 45 cm<br />
away from <strong>the</strong> chamber lights. To maximize <strong>the</strong> light intensity<br />
in <strong>the</strong> chamber, reflective Everbrite (Alcoa, PA) aluminum<br />
2594 9 ENVIRONMENTAL SCIENCE & TECHNOLOGY / VOL. 35, NO. 12, 2001 10.1021/es0019169 CCC: $20.00 © 2001 American Chemical Society<br />
Published on Web 05/17/2001
TABLE 1. Instrumentation Summary<br />
instrument<br />
measures<br />
LDL/<br />
range<br />
accuracy<br />
flow<br />
rate<br />
(LPM)<br />
dedicated/<br />
alternating<br />
gas chromatograph reactive organic gas (ROG) 1 ppb a 2% 0.4 alternating<br />
flame ionization detector HP 5890 series II<br />
chemiluminescent NO x analyzer NO, NO 2 5 ppb 7% 0.7 alternating<br />
Thermoenvironmental Instruments Model 42<br />
ozone ozone 1 ppb 4% 1.0 alternating<br />
Dasibi Environemental<br />
hygrometer (capicatance probe) temperature 5-95% 0.50% c alternating<br />
Vaisala HMP 233 relative humidity -20 °C to50°C 0.1 °C<br />
condensation particle counter TSI 3010 CPC volume concentration 0.01 particles/cm 3 1% d 1.0 dedicated<br />
scanning electrical mobility size distribution and 25-700 nm b 0.3% e 2.75 dedicated<br />
spectrometer number concentration 1% e<br />
tandem differential mobility analyzer hygroscopic growth factor 1.003 (0.003 e 2.75 alternating<br />
portable spectroradiometer Licor - 1800 light spectrum 280-850 nm 0.1 nm N/A N/A<br />
gas chromatograph mass spectrometer<br />
HP GCD<br />
ROG/gas-phase oxidation<br />
products<br />
1 ppt a 5% 5.0 dedicated<br />
a<br />
Will be a function <strong>of</strong> hydrocarbon. b As currently configured. c In series with ozone and NO x instruments. d 500-30 000 cm -3 as configured.<br />
e<br />
Measured precision.<br />
FIGURE 1.<br />
Absorption spectrum <strong>for</strong> 2 mil FEP Teflon film.<br />
FIGURE 3. Light spectrum <strong>of</strong> Sylvania 350BL lights from Carter et<br />
al. (1). Solid line represents Sylvania 350BL; dashed line is solar<br />
light intensity at zenith angle ) 0; dotted line is solar light intensity<br />
at zenith angle ) 60. All three plots are normalized to have <strong>the</strong><br />
same integrated NO 2 photolysis rate.<br />
FIGURE 2. Block diagram <strong>of</strong> gas- and aerosol-phase instrumentation.<br />
*<br />
Tekmar refers to a Tenax-TA sampling tube which is later introduced<br />
to a GCD via a <strong>the</strong>rmal desorption system.<br />
sheeting (reflectance > 95%) covers all four walls, <strong>the</strong> ceiling,<br />
and <strong>the</strong> floor <strong>of</strong> <strong>the</strong> enclosure.<br />
A Licor 1800 portable spectroradiometer is used to monitor<br />
<strong>the</strong> light spectrum emitted by <strong>the</strong> blacklights. The photolysis<br />
rate <strong>of</strong> NO 2 is estimated by steady-state actinometry, in which<br />
NO 2 is injected into a clean chamber and irradiated, and <strong>the</strong><br />
resulting NO, NO 2, and ozone mixing ratios are measured.<br />
The photolysis rate constant, k 1, is <strong>the</strong>n estimated as k 1 )<br />
k 3[O 3][NO]/[NO 2] where [O 3], [NO], and [NO 2] are concentrations<br />
and k 3 (cm 3 /molecule/min) is <strong>the</strong> rate constant <strong>of</strong><br />
NO and ozone reaction. The measured k 1 value (corrected<br />
<strong>for</strong> dark ozone plus NO reaction in <strong>the</strong> sampling lines) in <strong>the</strong><br />
chamber at full light intensity is 1.5 min -1 , about three times<br />
that <strong>of</strong> natural sunlight at Pasadena, CA at a solar zenith<br />
angle <strong>of</strong> 0° on a clear day.<br />
The artificial light produced by <strong>the</strong> blacklights is not<br />
representative <strong>of</strong> <strong>the</strong> entire ground-level solar light spectrum.<br />
A comparison <strong>of</strong> <strong>the</strong> relative light intensity <strong>of</strong> a typical<br />
fluorescent blacklight to ground-level solar radiation is given<br />
in Figure 3 (1). The ultraviolet irradiation produced by <strong>the</strong><br />
blacklight lamps corresponds to <strong>the</strong> wavelengths <strong>for</strong> maximum<br />
NO 2 photolysis. However, <strong>the</strong> longer wavelengths that<br />
photolyze some organic compounds such as methyl glyoxal,<br />
in <strong>the</strong> range <strong>of</strong> 450-550 nm, are not emitted by <strong>the</strong> blacklight<br />
lamps. An extensive discussion <strong>of</strong> light sources and absorption<br />
cross sections <strong>for</strong> aldehydes and carbonyls is found in<br />
Carter et al. (1). Table 1 <strong>of</strong> Carter et. al (1) shows <strong>the</strong> relative<br />
rate <strong>of</strong> photolysis <strong>for</strong> several photolyzing species in <strong>the</strong><br />
chamber when comparing blacklights to solar radiation. The<br />
blacklights used in <strong>the</strong> Caltech chamber are <strong>the</strong> same as<br />
those described in Carter et. al (1). It is important to note<br />
that <strong>the</strong> irradiation produced by blacklight lamps varies with<br />
manufacturer.<br />
VOL. 35, NO. 12, 2001 / ENVIRONMENTAL SCIENCE & TECHNOLOGY 9 2595
Compressed house air is <strong>for</strong>ced through a series <strong>of</strong> packed<br />
bed scrubbers containing activated charcoal, silica gel, Purafil<br />
(Purafil Inc., GA), and molecular sieve, followed by a filter<br />
to produce dry, particle- and hydrocarbon-free air. This<br />
system supports flow rates in excess <strong>of</strong> 300 LPM producing<br />
particle-free air with NO x, ozone, water vapor, and hydrocarbon<br />
levels below detection limits. A Millipore deionized<br />
water system produces 18.2 MΩ‚cm (25 °C) water containing<br />
less than 0.02 EU/mL pyrogens, 2-5 ppb TOC, < 0.1 ppb<br />
silicates, < 0.1 ppb heavy metals, < 1 cfu/mL microorganisms,<br />
and 1 particle larger than 0.2 µm/mL <strong>for</strong> use as a solvent in<br />
aerosol seed generation and <strong>for</strong> chamber humidification.<br />
A 52.8 kW heat exchanger controls <strong>the</strong> temperature <strong>of</strong> <strong>the</strong><br />
insulated room housing <strong>the</strong> instrumentation and Teflon<br />
chambers. The temperature can be set from 18 °C to50°C<br />
with <strong>the</strong> chamber lights on and 15 °C to50°C with <strong>the</strong><br />
chamber lights <strong>of</strong>f. Temperature drift during an experiment<br />
rarely exceeds ( 0.5 °C with a transient in temperature <strong>of</strong><br />
less than 1 °C <strong>for</strong> <strong>the</strong> time immediately following <strong>the</strong><br />
blacklights being turned on. Heat generated by <strong>the</strong> blacklights<br />
is dispersed throughout <strong>the</strong> room using eight four-room (14.2<br />
m 3 min -1 ) circulating fans. The instrumentation and sampling<br />
lines must be maintained at <strong>the</strong> chamber temperature to<br />
prevent perturbation <strong>of</strong> <strong>the</strong> sample during measurement so<br />
<strong>the</strong> instruments are located within <strong>the</strong> controlled temperature<br />
environment. The duration <strong>of</strong> <strong>the</strong> experiment ranges from<br />
30 min to 24 h.<br />
A 1500 W immersion heater submersed in >18.2 MΩ‚cm<br />
water in a 60 cm tall, 7.5 cm diameter glass cylinder fitted<br />
with a Teflon cap generates water vapor <strong>for</strong> chamber<br />
humidification. The steam passes through 2.5 cm diameter<br />
Teflon tubing into <strong>the</strong> chamber at a rate sufficient to achieve<br />
a relative humidity <strong>of</strong> 50% in approximately 40 min. A Vaisala<br />
(HMP233) capacitance meter measures relative humidity and<br />
temperature with stated temperature accuracy <strong>of</strong> (0.1% and<br />
RH accuracy <strong>of</strong> (0.5%. The water vapor addition does not<br />
introduce detectable particles or hydrocarbons into <strong>the</strong><br />
chamber.<br />
System Preparation<br />
Thoroughly flushing <strong>the</strong> chamber with at least 10 chamber<br />
volumes <strong>of</strong> clean air over 24 h prior to <strong>the</strong> start <strong>of</strong> an<br />
experiment reduces ozone, NO x, hydrocarbons, and particle<br />
concentrations below <strong>the</strong> detection limits <strong>of</strong> <strong>the</strong> instrumentation.<br />
Periodically <strong>the</strong> chamber walls are fur<strong>the</strong>r cleaned by<br />
baking under blacklights at 50 °C while flushing with clean<br />
air.<br />
Reactant Injection. Microliter syringes are used to<br />
measure and inject known volumes <strong>of</strong> liquid hydrocarbons<br />
(boiling point < 240 °C) into a 250 mL glass bulb. Gently<br />
heating <strong>the</strong> glass bulb with a heat gun vaporizes <strong>the</strong><br />
hydrocarbon into an ultrapure air stream. The vapors pass<br />
through a FEP Teflon transfer line and a stainless steel port<br />
<strong>for</strong> injection into <strong>the</strong> chambers. Compounds with bp > 240<br />
°C must be injected immediately adjacent to <strong>the</strong> injection<br />
port to minimize wall losses <strong>of</strong> <strong>the</strong> hydrocarbons be<strong>for</strong>e <strong>the</strong>y<br />
reach <strong>the</strong> chamber.<br />
Certified mixtures <strong>of</strong> gas-phase compounds in N 2 are<br />
introduced into <strong>the</strong> chamber using a mass-flow controller<br />
(Sierra Instruments Inc., CA) to maintain <strong>the</strong> flow-rate <strong>for</strong> a<br />
set period <strong>of</strong> time. The gas is <strong>the</strong>n flushed into <strong>the</strong> chamber<br />
with ultrapure air through a FEP Teflon line and stainless<br />
steel port.<br />
Seed Generation. <strong>Aerosol</strong> growth experiments frequently<br />
employ inorganic electrolyte seed aerosol. A stainless steel<br />
constant-rate atomizer (2) generates <strong>the</strong> seed aerosol from<br />
a 0.005 M solution <strong>of</strong> salt in ultrapure water. Dry (effloresced)<br />
aerosols are produced by passing <strong>the</strong> aerosol through a heated<br />
line and a Nafion diffusion dryer. Wet, deliquesced aerosol<br />
are injected by maintaining <strong>the</strong> RH <strong>of</strong> <strong>the</strong> injection line and<br />
FIGURE 4.<br />
Seed particle generation system.<br />
<strong>the</strong> chamber above <strong>the</strong> efflorescence RH <strong>of</strong> <strong>the</strong> salt. In each<br />
case, <strong>the</strong> seed aerosol is mixed, in a heat exchanger fitting,<br />
with air that has been passed through a 210 Po coated tube to<br />
eliminate <strong>the</strong> charge produced during atomization. The seed<br />
generation apparatus is shown in Figure 4.<br />
Gas-Phase Instrumentation<br />
A Hewlett-Packard 5890 series II Plus gas chromatograph<br />
(GC) equipped with a flame ionization detector (FID)<br />
monitors gas-phase hydrocarbon concentrations in <strong>the</strong><br />
chamber. The GC employs a six-port gas injection valve <strong>for</strong><br />
direct injection onto <strong>the</strong> GC column, DB-5 (J&W Scientific,<br />
CA) 60 m × 0.32 mm. A pump pulls <strong>the</strong> sample from <strong>the</strong><br />
chamber through a 10 mL stainless steel sample loop at a<br />
rate <strong>of</strong> 0.4 LPM.<br />
GC/FID measurements are taken every 11 min, alternating<br />
from one chamber to <strong>the</strong> o<strong>the</strong>r. The estimated uncertainty<br />
<strong>of</strong> <strong>the</strong> measurement is (2%. A hexafluorobenzene (C 6F 6)<br />
tracer provides an internal standard <strong>for</strong> <strong>the</strong> GC measurements<br />
and serves as an indicator <strong>of</strong> air leaks in <strong>the</strong> chamber. This<br />
stable tracer does not react with hydroxyl radical, nitrate<br />
radical, or ozone at an appreciable rate. To calibrate <strong>the</strong><br />
GC/FID <strong>for</strong> <strong>the</strong> parent hydrocarbon and C 6F 6, <strong>the</strong> parent<br />
hydrocarbons and C 6F 6 in a methylene chloride diluent are<br />
injected into a small Teflon chamber that is <strong>the</strong>n filled with<br />
clean air at 5 LPM to a volume <strong>of</strong> 50 L. A minimum <strong>of</strong> three<br />
calibration measurements at each <strong>of</strong> four different concentrations<br />
is fit with a straight-line regression through zero.<br />
A HP GCD (gas chromatograph with electron impact<br />
ionization, mass spectrometric detection) measures concentrations<br />
<strong>of</strong> vapor-phase hydrocarbons on samples collected<br />
downstream <strong>of</strong> a filter on Tenax TA adsorbent packed<br />
stainless steel tubes at a 5 LPM flow rate. A Tekmar-<br />
Dohrmann desorber instrument with cyr<strong>of</strong>ocusing capabilities<br />
injects <strong>the</strong>se samples into <strong>the</strong> GC column <strong>for</strong> gas-phase<br />
oxidation product identification and quantification <strong>of</strong> hydrocarbons<br />
that are difficult to introduce to <strong>the</strong> GC/FID<br />
through a conventional gas injection valve.<br />
NO, NO 2, and NO x mixing ratios are tracked using a<br />
Thermo Environmental Instruments Inc. (MA) Model 42<br />
chemiluminescent NO-NO 2-NO x analyzer. The analyzer<br />
continuously samples at a flow rate <strong>of</strong> 0.7 LPM, alternating<br />
between <strong>the</strong> chambers in ten-minute intervals. The instrument<br />
is calibrated weekly using a certified cylinder <strong>of</strong> NO.<br />
The accuracy <strong>of</strong> <strong>the</strong> measurement is (7%.<br />
A Dasibi Environmental (CA) nondispersive ultraviolet<br />
ozone analyzer monitors <strong>the</strong> chamber ozone concentration.<br />
The ozone analyzer samples at a rate <strong>of</strong> 1 LPM, pulling from<br />
alternating sides <strong>of</strong> <strong>the</strong> chamber in ten-minute intervals. The<br />
stated accuracy <strong>of</strong> <strong>the</strong> ozone instrument is (4%.<br />
2596 9 ENVIRONMENTAL SCIENCE & TECHNOLOGY / VOL. 35, NO. 12, 2001
FIGURE 6.<br />
Condensation particle counter dilution system.<br />
FIGURE 5. Automated scanning electrical mobility spectrometer.<br />
Pressure transducers monitored by computer; solenoid proportional<br />
control valves controlled by computer.<br />
<strong>Aerosol</strong> Instrumentation<br />
The aerosol instrumentation <strong>for</strong> <strong>the</strong> chamber includes a<br />
scanning electrical mobility spectrometer (SEMS), a tandem<br />
differential mobility analyzer (TDMA), and a condensation<br />
particle counter (CPC). Combined, <strong>the</strong>se devices measure<br />
particle size distribution, aerosol number concentration, and<br />
<strong>the</strong> hygroscopic nature <strong>of</strong> <strong>the</strong> chamber aerosol. Duplicate<br />
aerosol-phase instruments continuously (except <strong>for</strong> <strong>the</strong><br />
TDMA) sample from each side <strong>of</strong> <strong>the</strong> chamber at an average<br />
flow rate <strong>of</strong> 5.1 LPM.<br />
Size Distribution Measurements. Particle size distributions<br />
and total number concentrations are obtained every<br />
60 s using two scanning electrical mobility spectrometers<br />
(SEMS) (3), one <strong>for</strong> each side <strong>of</strong> <strong>the</strong> chamber (Figure 5). Each<br />
SEMS is equipped with a TSI model 3077 85 Kr neutralizer, a<br />
TSI model 3081 long column cylindrical differential mobility<br />
analyzer (DMA), and a TSI model 3760 condensation particle<br />
counter (CPC). The DMAs operate with sheath and excess<br />
flows <strong>of</strong> 2.5 LPM and sample inlet and classified aerosol outlet<br />
flows <strong>of</strong> 0.25 LPM. Raising <strong>the</strong> DMA column voltage<br />
exponentially from -30Vto-7000 V enables measurement<br />
<strong>of</strong> <strong>the</strong> mobility spectrum <strong>of</strong> <strong>the</strong> aerosol over <strong>the</strong> mobility<br />
diameter range, 25-700 nm.<br />
The volumetric flow rates and <strong>the</strong> potential applied to <strong>the</strong><br />
inner rod <strong>of</strong> <strong>the</strong> DMA must be controlled precisely <strong>for</strong> accurate<br />
mobility measurements. A Bertan (NY) 602C that has been<br />
modified <strong>for</strong> linear output from -10Vto-10 000 V provides<br />
<strong>the</strong> rod potential. Laminar flow meters, consisting <strong>of</strong> a<br />
differential pressure transducer (Dwyer, IN, model 600-2)<br />
that measure <strong>the</strong> pressure drop across a laminar flow element,<br />
monitor <strong>the</strong> volumetric flow rates. Fifty milliliter jars filled<br />
with silica gel isolate <strong>the</strong> pressure transducers from potentially<br />
humid flows. The measured pressure drop is proportional to<br />
<strong>the</strong> volumetric flow rate. Solenoid proportional control valves<br />
(MKS model 248A) are used to adjust <strong>the</strong> flow rates on <strong>the</strong><br />
particle-free flows, while <strong>the</strong> flow rates <strong>of</strong> all DMA flows are<br />
measured. This arrangement eliminates variable particle<br />
losses associated with aerosol passage through valves at<br />
different settings, while still ensuring precise flow settings.<br />
A personal computer (PC) using Labview s<strong>of</strong>tware actively<br />
controls <strong>the</strong> volumetric flow rates and DMA voltage. An analog<br />
input board, a PC-LMP-16 PNP (National Instruments, Texas),<br />
monitors <strong>the</strong> flow rate, <strong>the</strong> column voltage (after a 2000:1<br />
voltage divider), and <strong>the</strong> 3760 CPC counts. A digital/analog<br />
(D/A) output board, a PCI-6713 (National Instruments, TX),<br />
controls <strong>the</strong> solenoid valves and <strong>the</strong> high voltage supply.<br />
S<strong>of</strong>tware based proportional-integral-derivative (PID) control<br />
adjusts <strong>the</strong> three valves controlling <strong>the</strong> four DMA flows at a<br />
rate <strong>of</strong> 100 Hz, enabling flow rate control to (0.2%. A logratio<br />
amplifier (Burr-Brown model JP100) operated in antilog<br />
configuration, exponentiates <strong>the</strong> linear, 12-bit precision<br />
analog voltage to drive <strong>the</strong> high voltage supply over <strong>the</strong> entire<br />
DMA range (10-10000 V) with a precision <strong>of</strong> (0.5%. The<br />
sampling line and SEMS system temperatures are maintained<br />
within 0.2 °C <strong>of</strong> <strong>the</strong> chamber temperature to prevent<br />
evaporation <strong>of</strong> or condensation on <strong>the</strong> aerosol during<br />
sampling. The sheath flow passes through a Teflon filter<br />
(CPPK Gelman) to minimize perturbations to <strong>the</strong> RH and<br />
gas-phase hydrocarbon species concentrations so that <strong>the</strong><br />
aerosol passing through <strong>the</strong> DMA column will remain at<br />
equilibrium with <strong>the</strong> surrounding gas-phase.<br />
A data inversion routine converts <strong>the</strong> count versus time<br />
data obtained from <strong>the</strong> SEMS by <strong>the</strong> PC to a size distribution<br />
and number concentration (4). The inversion routine accounts<br />
<strong>for</strong> <strong>the</strong> diffusional broadening <strong>of</strong> <strong>the</strong> DMA transfer<br />
functions, mixing-induced delays in counting particles by<br />
<strong>the</strong> CPC, <strong>the</strong> transmission efficiency <strong>of</strong> <strong>the</strong> aerosol stream<br />
through <strong>the</strong> sampling line and SEMS, and <strong>the</strong> charging<br />
efficiency <strong>of</strong> <strong>the</strong> neutralizer.<br />
We have examined <strong>the</strong> reproducibility and stability <strong>of</strong> <strong>the</strong><br />
SEMS measurement by continuously monitoring mobility<br />
classified (to eliminate solute particles) 198 nm polystyrene<br />
latex (PSL) spheres <strong>for</strong> 64 h. The diameter reported fluctuated<br />
by (0.5 nm over <strong>the</strong> entire duration <strong>of</strong> this test. Currently<br />
<strong>the</strong>re is no calibration standard <strong>for</strong> volume concentration so<br />
only <strong>the</strong> precision <strong>for</strong> such measurement is added. After<br />
correcting <strong>for</strong> atomizer output drift using a parallel CPC to<br />
monitor <strong>the</strong> particle concentration variability in <strong>the</strong> aerosol<br />
volume concentration measurement was found to be less<br />
than 1%.<br />
Number Concentration. Independent particle number<br />
concentrations are recorded using TSI model 3010 condensation<br />
particle counters to corroborate <strong>the</strong> DMA concentrations<br />
and to aid in estimating particle wall losses. Particle<br />
coincidence in <strong>the</strong> CPC was minimized by splitting <strong>the</strong> aerosol<br />
stream from <strong>the</strong> chamber, filtering 80% <strong>of</strong> <strong>the</strong> flow, and mixing<br />
<strong>the</strong> two streams so that only 1/5 <strong>of</strong> <strong>the</strong> aerosol stream reaches<br />
<strong>the</strong> CPC. This extends <strong>the</strong> measurement range <strong>of</strong> <strong>the</strong> CPC up<br />
to approximately 50 000 particles cm -3 . Figure 6 illustrates<br />
<strong>the</strong> CPC system.<br />
Hygroscopicity Measurements. The tandem differential<br />
mobility analyzer (TDMA) provides a measure <strong>of</strong> <strong>the</strong> hygroscopic<br />
behavior <strong>of</strong> an aerosol. Figure 7 illustrates <strong>the</strong><br />
experimental system based upon <strong>the</strong> original design <strong>of</strong> Rader<br />
VOL. 35, NO. 12, 2001 / ENVIRONMENTAL SCIENCE & TECHNOLOGY 9 2597
FIGURE 7. Tandem differential mobility analyzer system. Pressure transducers monitored by computer; solenoid proportional control valves<br />
controlled by computer.<br />
and McMurry (5). It consists <strong>of</strong> two TSI 3081 long column<br />
cylindrical DMAs, a laminar flow environmental chamber,<br />
a 210 Po stainless steel neutralizer (<strong>Aerosol</strong> Dynamics, CA),<br />
and a TSI Model 3760A CPC. Flow rates <strong>of</strong> 2.5LPM are used<br />
<strong>for</strong> both <strong>the</strong> sheath and excess flows and 0.25LPM <strong>for</strong> both<br />
polydisperse and monodisperse flows. The ratio <strong>of</strong> <strong>the</strong><br />
diameter <strong>of</strong> humidified aerosol to that <strong>of</strong> classified aerosol,<br />
G f ) D p (humidified)/D p (dry), defines a measure <strong>of</strong> <strong>the</strong> water<br />
uptake <strong>of</strong> an aerosol known as <strong>the</strong> hygroscopic growth factor.<br />
The first DMA in <strong>the</strong> TDMA system operates at constant<br />
voltage to extract particles in a narrow size range from a<br />
polydisperse aerosol sample. This classified aerosol <strong>the</strong>n<br />
passes through a flow straightening tube be<strong>for</strong>e entering at<br />
<strong>the</strong> center <strong>of</strong> a humidification tube. Humid air enters coaxially<br />
to <strong>the</strong> sample. The 1003 mm length <strong>of</strong> <strong>the</strong> 47 mm diameter<br />
humidification tube is sufficient to ensure fully developed<br />
flow and a uni<strong>for</strong>m distribution <strong>of</strong> water vapor across <strong>the</strong><br />
tube. Centerline particle injection minimizes variations in<br />
<strong>the</strong> residence time, typically 10 s. An aerosol sample extracted<br />
from <strong>the</strong> centerline <strong>of</strong> <strong>the</strong> humidification tube <strong>the</strong>n passes<br />
through a second DMA that is operated in scanning mode,<br />
i.e., as a SEMS, to measure <strong>the</strong> particle size distribution after<br />
humidification. Additional measurements made without<br />
humidification (bypassing <strong>the</strong> humidification tube) provide<br />
<strong>the</strong> data needed to calculate <strong>the</strong> growth factor. Both size<br />
distributions are fitted to log-normal distributions to facilitate<br />
calculation <strong>of</strong> G f.<br />
To minimize perturbations in <strong>the</strong> particle size during<br />
TDMA measurements, <strong>the</strong> temperature <strong>of</strong> <strong>the</strong> sampling lines<br />
and <strong>the</strong> entire TDMA instrument are maintained within (0.2<br />
°C <strong>of</strong> <strong>the</strong> chamber temperature. The sheath flow <strong>for</strong> <strong>the</strong> first<br />
DMA is taken from <strong>the</strong> chamber and filtered with a Gelman<br />
CPPK filter to minimize RH fluctuations and maintain <strong>the</strong><br />
chamber gas-phase organic composition in <strong>the</strong> system.<br />
Excess air from DMA1 is filtered and humidified by passing<br />
through a heated flask saturator containing ultrapure water<br />
and <strong>the</strong>n through a condenser that controls <strong>the</strong> total gasphase<br />
water concentration. Sheath air <strong>for</strong> <strong>the</strong> second DMA<br />
is filtered and taken from <strong>the</strong> laminar flow reactor to once<br />
again maintain RH and organic concentrations surrounding<br />
<strong>the</strong> particles. Flow and sizing calibrations account <strong>for</strong> <strong>the</strong><br />
excess water-vapor volume added by humidification between<br />
<strong>the</strong> first and second DMA.<br />
The system RH is controlled to within (0.5% by a feedback<br />
loop between a digital hygrometer (Vaisala HMP233) and a<br />
refrigerated bath that controls <strong>the</strong> condenser temperature.<br />
A Labview-based PID controller maintains <strong>the</strong> flow within<br />
(0.5%. The larger uncertainty in flow rate results from<br />
simultaneous control <strong>of</strong> eight flows with five valves, compared<br />
to four flows with three valves in <strong>the</strong> SEMS. The data inversion<br />
process corrects <strong>for</strong> diffusional broadening in <strong>the</strong> transfer<br />
function, particle transmission efficiency, charging efficiency,<br />
and mixing effects in <strong>the</strong> CPC (4). A full scan takes 60 s. A<br />
typical size distribution is shown in Figure 8.<br />
The TDMA was used to measure <strong>the</strong> hygroscopic G f <strong>of</strong> <strong>the</strong><br />
well-characterized salts, ammonium nitrate and ammonium<br />
bisulfate. Details <strong>of</strong> <strong>the</strong>se measurements and <strong>the</strong>ir comparison<br />
to literature values and <strong>the</strong>rmodynamic <strong>the</strong>ory <strong>for</strong><br />
<strong>the</strong>se salts are reported in Cocker et. al (6).<br />
2598 9 ENVIRONMENTAL SCIENCE & TECHNOLOGY / VOL. 35, NO. 12, 2001
FIGURE 8. Sample TDMA size distribution spectrum. Left curve is<br />
output <strong>of</strong> second DMA <strong>for</strong> dry (NH 4) 2SO 4 seed particles classified<br />
to 136 nm by first DMA at RH ) 0%. Right curve is output <strong>of</strong> second<br />
DMA <strong>for</strong> dry (NH 4) 2SO 4 seed particles classified to 136 nm by first<br />
DMA at RH ) 85%.<br />
<strong>Aerosol</strong> Formation and Evolution Experiments<br />
In <strong>the</strong> absence <strong>of</strong> seed particles, aerosol may <strong>for</strong>m by<br />
homogeneous nucleation. The number <strong>of</strong> particles that<br />
results depends strongly upon <strong>the</strong> operating conditions.<br />
Moreover, <strong>the</strong> concentration is uncertain since nucleation<br />
produces particles that are, at least initially, too small to<br />
detect. For quantitative measurements <strong>of</strong> aerosol yield, we<br />
<strong>the</strong>re<strong>for</strong>e turn to seeded chamber studies. As described below,<br />
<strong>the</strong> aerosol yield varies depending on whe<strong>the</strong>r <strong>the</strong> seed<br />
particles are dry or not.<br />
Dry Nucleation. In experiments per<strong>for</strong>med without seed<br />
particles and at low relative humidity, aerosol <strong>for</strong>ms when<br />
a gas-phase organic product accumulates to a sufficient<br />
supersaturation to induce homogeneous nucleation. Condensation<br />
and subsequent absorption <strong>of</strong> oxidation products<br />
leads to particles that are 100% organic in composition. The<br />
quantity <strong>of</strong> aerosol produced in this case, estimated from<br />
<strong>the</strong> final aerosol volume after accounting <strong>for</strong> wall losses,<br />
provides a measure <strong>of</strong> <strong>the</strong> SOA <strong>for</strong>mation potential in a clean,<br />
dry environment. TDMA measurements <strong>of</strong> <strong>the</strong> chamber<br />
aerosol produced in <strong>the</strong> absence <strong>of</strong> seed particles reveals <strong>the</strong><br />
hygroscopic nature <strong>of</strong> <strong>the</strong> pure organic oxidation products.<br />
Humid Nucleation. In experiments per<strong>for</strong>med at elevated<br />
RH, but without seed particles, aerosol also <strong>for</strong>ms by<br />
nucleation, but subsequent particle growth involves partitioning<br />
<strong>of</strong> both water and organic products into <strong>the</strong> aerosol.<br />
Used in conjunction with a dry nucleation experiment, <strong>the</strong><br />
humid nucleation experiment allows one to explore <strong>the</strong> effects<br />
<strong>of</strong> <strong>the</strong> presence <strong>of</strong> water on gas-particle conversion. The SOA<br />
yield <strong>of</strong> <strong>the</strong> wet nucleation experiments can be corrected <strong>for</strong><br />
water uptake by estimating <strong>the</strong> water fraction as that obtained<br />
from TDMA analysis <strong>of</strong> dry nucleation particles. The SOA<br />
yield in <strong>the</strong> humid system can be calculated and compared<br />
to <strong>the</strong> dry nucleation experiments after accounting <strong>for</strong> wall<br />
losses.<br />
Dry Seed, Dry Conditions. In experiments per<strong>for</strong>med with<br />
sufficiently high concentrations <strong>of</strong> water-free inorganic seed<br />
particles in a dry chamber, <strong>the</strong> seed particles suppress<br />
nucleation and ensure that <strong>the</strong> chamber aerosol lies within<br />
<strong>the</strong> size range <strong>of</strong> <strong>the</strong> instrumentation throughout <strong>the</strong><br />
experiment. SOA production commences when a sufficient<br />
supersaturation <strong>of</strong> oxidation products accumulates to induce<br />
<strong>the</strong> condensation onto <strong>the</strong> dry seed surface producing an<br />
initial organic layer. Fur<strong>the</strong>r aerosol growth occurs by<br />
absorption <strong>of</strong> reaction products into <strong>the</strong> organic layer. The<br />
resulting aerosol contains both inorganic and organic species.<br />
With a nonvolatile seed aerosol, <strong>the</strong> total suspended inorganic<br />
aerosol volume changes only by particle depositions onto<br />
<strong>the</strong> chamber walls. There<strong>for</strong>e, <strong>the</strong> organic aerosol yield can<br />
be computed from <strong>the</strong> total aerosol produced less <strong>the</strong> initial<br />
amount <strong>of</strong> inorganic material present after correction <strong>for</strong><br />
wall losses. Comparison <strong>of</strong> <strong>the</strong> results <strong>of</strong> <strong>the</strong>se experiments<br />
to those <strong>of</strong> dry nucleation experiments allows one to estimate<br />
<strong>the</strong> influence <strong>of</strong> a dry, inert nonreactive surface on gas-particle<br />
partitioning.<br />
Dry Seed, Elevated Relative Humidity. These experiments<br />
add <strong>the</strong> influence <strong>of</strong> water vapor to <strong>the</strong> previous experiments.<br />
To keep <strong>the</strong> seed particles dry, <strong>the</strong> RH in <strong>the</strong>se experiments<br />
cannot exceed <strong>the</strong> deliquescence RH <strong>of</strong> <strong>the</strong> inorganic salt<br />
comprising <strong>the</strong> seed particles. <strong>Aerosol</strong> growth takes place<br />
when a sufficient supersaturation <strong>of</strong> oxidation products leads<br />
to <strong>the</strong> production <strong>of</strong> an initial organic layer. Fur<strong>the</strong>r aerosol<br />
growth occurs as water and organic material partition into<br />
<strong>the</strong> organic or organic-water phase. The resulting aerosol<br />
contains inorganic material, organic material, and, possibly,<br />
water. Several investigations have noted that <strong>the</strong> deliquescence<br />
RH <strong>of</strong> <strong>the</strong> inorganic salt is unperturbed by organic<br />
coatings (7). If, <strong>the</strong>re<strong>for</strong>e, <strong>the</strong> inorganic core <strong>of</strong> <strong>the</strong> aerosol<br />
remains dry, SOA yield can be measured as <strong>the</strong> final aerosol<br />
volume less <strong>the</strong> initial seed volume and water content (all<br />
corrected <strong>for</strong> wall losses). Water content is again measured<br />
independently by TDMA analysis ei<strong>the</strong>r using dry aerosol<br />
from dry nucleation or from dry seed, low RH experiments.<br />
Care must be taken to ensure that <strong>the</strong> aerosol is dry when<br />
injected and is never exposed to RH higher than <strong>the</strong> particle<br />
deliquescence RH. The state <strong>of</strong> <strong>the</strong> seed aerosol is verified<br />
prior to <strong>the</strong> start <strong>of</strong> an experiment through TDMA analysis<br />
at an RH above <strong>the</strong> seed deliquescence RH. A G f value lower<br />
than that <strong>for</strong> a dry seed aerosol indicates that <strong>the</strong> seed is not<br />
dry.<br />
Aqueous Seed, Elevated Relative Humidity. In this case,<br />
experiments are per<strong>for</strong>med at elevated RH with deliquesced<br />
(wet) seed aerosol. Generation <strong>of</strong> such aerosol requires that<br />
at no point does <strong>the</strong> RH surrounding <strong>the</strong> aerosol drop below<br />
its efflorescence RH. The state <strong>of</strong> <strong>the</strong> aerosol can be verified<br />
by TDMA measurements <strong>of</strong> <strong>the</strong> hygroscopic growth factor<br />
<strong>of</strong> <strong>the</strong> particles. The water content <strong>of</strong> <strong>the</strong> inorganic seed can<br />
be estimated based on <strong>the</strong>rmodynamic <strong>the</strong>ory (8). Oxidation<br />
products may partition into <strong>the</strong> aqueous phase or into a<br />
separate organic phase. The amount <strong>of</strong> water in <strong>the</strong> aerosol<br />
may ei<strong>the</strong>r increase or decrease during growth. Because <strong>the</strong><br />
final aerosol water content cannot be independently determined,<br />
<strong>the</strong> total aerosol yield, including water and organic<br />
material, is reported.<br />
<strong>Aerosol</strong> Dynamics<br />
A major goal <strong>of</strong> <strong>the</strong> aerosol chamber experiments we have<br />
described is to determine <strong>the</strong> aerosol <strong>for</strong>mation potential <strong>of</strong><br />
ei<strong>the</strong>r a single compound or a mixture. To do this, one must<br />
estimate <strong>the</strong> mass <strong>of</strong> aerosol produced over <strong>the</strong> course <strong>of</strong> an<br />
experiment. Figure 9 shows a typical set <strong>of</strong> data, including<br />
<strong>the</strong> hydrocarbon disappearance, <strong>the</strong> amount <strong>of</strong> suspended<br />
aerosol volume, and <strong>the</strong> number distribution <strong>of</strong> particles.<br />
The reaction is considered finished when <strong>the</strong> aerosol volume<br />
(corrected <strong>for</strong> wall processes) is no longer changing. Several<br />
microphysical processes occurring in <strong>the</strong> chamber must be<br />
considered in order to estimate <strong>the</strong> amount <strong>of</strong> organic aerosol<br />
produced (9).<br />
The principal process that complicates <strong>the</strong> interpretation<br />
<strong>of</strong> measured aerosol data is loss <strong>of</strong> particles to <strong>the</strong> wall <strong>of</strong> <strong>the</strong><br />
chamber. To determine <strong>the</strong> total amount <strong>of</strong> aerosol mass<br />
generated, one must estimate <strong>the</strong> quantity <strong>of</strong> <strong>the</strong> aerosol lost<br />
to <strong>the</strong> chamber walls over <strong>the</strong> course <strong>of</strong> <strong>the</strong> experiment and<br />
add that to that measured <strong>of</strong> <strong>the</strong> end <strong>of</strong> <strong>the</strong> run. Particles<br />
deposit on <strong>the</strong> wall at a rate that is proportional to <strong>the</strong> particle<br />
concentrations and depends on particle size, leading to first-<br />
VOL. 35, NO. 12, 2001 / ENVIRONMENTAL SCIENCE & TECHNOLOGY 9 2599
FIGURE 9. Cyclohexene and organic aerosol mass as a function <strong>of</strong> time. <strong>Chamber</strong> initially seeded with ammonium sulfate. As <strong>the</strong><br />
cyclohexene concentration decreases with time, <strong>the</strong> organic aerosol mass increases correspondingly. The organic aerosol mass, ∆M o,<br />
is calculated from <strong>the</strong> change in aerosol size distribution (shown in insert) and accounts <strong>for</strong> wall deposition. ∆M o is <strong>the</strong> total aerosol<br />
mass produced during <strong>the</strong> experiment.<br />
TABLE 2. Characteristic Time Scales <strong>for</strong> Processes Occurring in <strong>the</strong> <strong>Chamber</strong> a<br />
process time constant typical chamber values<br />
<strong>for</strong>mation <strong>of</strong> condensable gas<br />
1<br />
2h<br />
τ F )<br />
k OH [OH]<br />
gas-particle transport (condensation)<br />
τ GP ) 1 + 8λ/RD p<br />
2πND p λc<br />
2 min<br />
particle-wall transport (wall deposition)<br />
1<br />
5h<br />
τ PW )<br />
(A c /V c )k MP<br />
gas-deposited particle transport<br />
(absorption to deposited aerosol)<br />
coagulation (no nucleation)<br />
coagulation (nucleation)<br />
1<br />
τ GD )<br />
R(A p /V c )k MG<br />
τ COAG ) 2<br />
K ii N<br />
τ COAG ) 2<br />
K ii N<br />
3.5 d<br />
3.1 d<br />
200sat10 7 particle cm -3 to<br />
56hat10 4 particle cm -3<br />
a<br />
If transport to particle . <strong>for</strong>mation <strong>of</strong> condensable gases; k OH ) 2 × 10 -11 cm 3 /molecule‚s, a typical first-order hydroxyl reaction rate constant;<br />
[OH] ) 7 × 10 6 molecule/cm 3 , concentration <strong>of</strong> hydroxyl radical; N ) 1 × 10 4 cm -3 , particle number concentration; D p ) 100 nm, particle diameter<br />
R)1.0, sticking probability; λ ) 65.1 nm, mean free path; c ) 600 m/s, velocity <strong>of</strong> semivolatile gas molecule; (A c/V c) ) 1.0 m -1 , chamber surface<br />
area-to-volume ratio; k MG ) 1.0 m/min, mass transfer coefficient <strong>for</strong> condensing species to particle adsorbed to chamber surface; k MP ) 1.5 × 10 -3<br />
m/min, mass transfer coefficient <strong>for</strong> particles to chamber surface; A p/V c ) 2 × 10 -4 , ratio <strong>of</strong> surface area <strong>of</strong> particles deposited on chamber wall<br />
to chamber volume; K ij <strong>for</strong> N ) 1 × 10 4 cm -3 , D p ) 100 nm (K ij is particle-particle collision frequency).<br />
order kinetics, i.e.<br />
dN(D p ,t)<br />
)-β(D<br />
dt<br />
p )N(D p ,t) (1)<br />
where β(D p) is <strong>the</strong> wall loss coefficient, N(D p,t) is <strong>the</strong> particle<br />
number concentration, and D p is <strong>the</strong> particle diameter (9).<br />
β values are estimated from particle number concentration<br />
versus time data <strong>for</strong> each experiment using <strong>the</strong> above<br />
equation. Values <strong>of</strong> β <strong>for</strong> typical particle sizes in our chamber<br />
range from 0.0015 to 0.003 min -1 . The observed decay in<br />
total number concentration provides an estimate <strong>of</strong> <strong>the</strong><br />
amount <strong>of</strong> aerosol lost to <strong>the</strong> wall over <strong>the</strong> course <strong>of</strong> an<br />
experiment. The only competing process that can confound<br />
this interpretation is particle-particle coagulation that also<br />
reduces <strong>the</strong> particle number concentration. In seeded<br />
experiments, at typical seed aerosol size (about 100 nm in<br />
diameter) and number concentrations (about 10 4 cm -3 ), <strong>the</strong><br />
time scale <strong>for</strong> coagulation is about 74 h; consequently,<br />
coagulation can be neglected as a cause <strong>of</strong> <strong>the</strong> decrease in<br />
<strong>the</strong> aerosol number concentration when seed aerosol is used.<br />
In <strong>the</strong> absence <strong>of</strong> seed aerosol, initial particle <strong>for</strong>mation<br />
occurs by nucleation. Typically, nucleation occurs in a brief<br />
burst that produces 10 4 -10 7 particles cm -3 . At number<br />
concentrations <strong>of</strong> 10 7 ,10 6 ,10 5 , and 10 4 particles cm -3 , <strong>the</strong><br />
time scale <strong>for</strong> coagulation is on <strong>the</strong> order <strong>of</strong> 200 s, 33 min,<br />
5.6 h, and 56 h, respectively. There<strong>for</strong>e, <strong>for</strong> large nucleation<br />
bursts, coagulation becomes a significant process to reduce<br />
2600 9 ENVIRONMENTAL SCIENCE & TECHNOLOGY / VOL. 35, NO. 12, 2001
time <strong>for</strong> diffusion to <strong>the</strong> wall <strong>of</strong> <strong>the</strong> present chamber is 1<br />
min. However, FEP Teflon film is nonabsorptive to most<br />
hydrocarbons; measured losses <strong>of</strong> C 6F 6 and m-xylene are<br />
0.001 h -1 (loss rate includes potential leaks).<br />
Acknowledgments<br />
This work was supported by <strong>the</strong> U.S. Environmental Protection<br />
Agency Center on Airborne Organics and U.S. Environmental<br />
Protection Agency Agreement CR827331-01-0.<br />
FIGURE 10. Illustration <strong>of</strong> different processes occurring within <strong>the</strong><br />
chamber. Pathways include <strong>the</strong> following: (1) condensation, (2)<br />
gas-phase wall adsorption, (3) gas-deposited particle transport, (4)<br />
particle-wall transport, and (5) coagulation.<br />
<strong>the</strong> number concentration. Because coagulation is a secondorder<br />
process, <strong>the</strong> rate <strong>of</strong> reduction in <strong>the</strong> number concentration<br />
by coagulation decreases much more rapidly than<br />
does particle loss to <strong>the</strong> walls.<br />
Table 2 gives characteristic times <strong>for</strong> chamber processes<br />
important in gas-to-particle conversion. Note that <strong>the</strong> only<br />
significant change in particle number concentration occurs<br />
through wall deposition processes (except when nucleation<br />
occurs). There<strong>for</strong>e, <strong>the</strong> number <strong>of</strong> particles in <strong>the</strong> chamber<br />
can be described by <strong>the</strong> first-order wall loss rate as N ) N oe -βt .<br />
As <strong>the</strong> mass transfer rate to suspended particles greatly<br />
exceeds that <strong>of</strong> those deposited on <strong>the</strong> wall, <strong>the</strong> amount <strong>of</strong><br />
organic material associated with each particle at <strong>the</strong> time <strong>of</strong><br />
deposition is assumed to be constant. Thus, <strong>the</strong> total organic<br />
material produced is estimated to be <strong>the</strong> sum <strong>of</strong> that still<br />
suspended in <strong>the</strong> aerosol phase plus that deposited to <strong>the</strong><br />
wall. The particle size increases due to condensation <strong>of</strong><br />
organic vapors (and any nucleation products). The final size<br />
<strong>of</strong> <strong>the</strong> particles less <strong>the</strong> initial size <strong>of</strong> <strong>the</strong> seed particles provides<br />
an estimate <strong>of</strong> <strong>the</strong> volume <strong>of</strong> organic material suspended in<br />
<strong>the</strong> chamber. Figure 10 illustrates <strong>the</strong> competing processes.<br />
Adsorption <strong>of</strong> gas-phase compounds on <strong>the</strong> wall might<br />
possibly decrease <strong>the</strong>ir concentrations since <strong>the</strong> characteristic<br />
Literature Cited<br />
(1) Carter, W. P. L.; Luo, D.; Malkina, I. L.; Pierce, J. A. Environmental<br />
chamber studies <strong>of</strong> atmospheric reactivities <strong>of</strong> volatile organic<br />
compounds. Effects <strong>of</strong> varying chamber and light source; Final<br />
report to National Renewable Energy Laboratory; 1995 (http://<br />
cert.ucr.edu/∼carter/absts.htm#explrept).<br />
(2) Liu, B. Y. H.; Lee, K. W. An aerosol generator <strong>of</strong> high stability.<br />
Am. Ind. Hyg. J. 1975, 861-865.<br />
(3) Wang, S. C.; Flagan, R. C. Scanning electrical mobility analyzer.<br />
J. <strong>Aerosol</strong> Sci. 1989, 8, 1485-1488.<br />
(4) Collins, D. R.; Flagan, R. C.; Seinfeld, J. H. Improved inversion<br />
<strong>of</strong> scanning DMA data. <strong>Aerosol</strong> Sci. Technol. 2001, In press.<br />
(5) Rader, D. J.; McMurry, P. H. Application <strong>of</strong> <strong>the</strong> tandem<br />
differential mobility analyzer to studies <strong>of</strong> droplet growth or<br />
evaporation. J. <strong>Aerosol</strong> Sci. 1986, 17, 771-787.<br />
(6) Cocker, D. R.; Clegg, S. L.; Flagan, R. C.; Seinfeld, J. H. The effect<br />
<strong>of</strong> water on gas-particle partitioning <strong>of</strong> secondary organic<br />
aerosol: I. R-pinene ozone system. Atmos. Environ. 2001, In<br />
press.<br />
(7) Cruz, C. N.; Pandis, S. N. Deliquescence and hygroscopic growth<br />
<strong>of</strong> mixed inorganic-organic atmospheric aerosol. Environ. Sci.<br />
Technol. 2000, 34, 4313-4319.<br />
(8) Nenes, A.; Pandis, S. N.; Pilinis, C. ISORROPIA: A new <strong>the</strong>rmodynamic<br />
equilibrium model <strong>for</strong> multiphase multicomponent<br />
inorganic aerosols. Aquat. Geochem. 1998, 4, 123-152.<br />
(9) Bowman, F. M.; Odum, J. R.; Seinfeld, J. H.; Pandis, S. N.<br />
Ma<strong>the</strong>matical model <strong>for</strong> gas-particle partitioning <strong>of</strong> secondary<br />
organic aerosols. Atmos. Environ. 1997, 31, 3921-3931.<br />
Received <strong>for</strong> review November 29, 2000. Revised manuscript<br />
received April 3, 2001. Accepted April 5, 2001.<br />
ES0019169<br />
VOL. 35, NO. 12, 2001 / ENVIRONMENTAL SCIENCE & TECHNOLOGY 9 2601