Global cost-benefit analysis of water supply and sanitation ... - SuSanA
Global cost-benefit analysis of water supply and sanitation ... - SuSanA
Global cost-benefit analysis of water supply and sanitation ... - SuSanA

You also want an ePaper? Increase the reach of your titles
YUMPU automatically turns print PDFs into web optimized ePapers that Google loves.
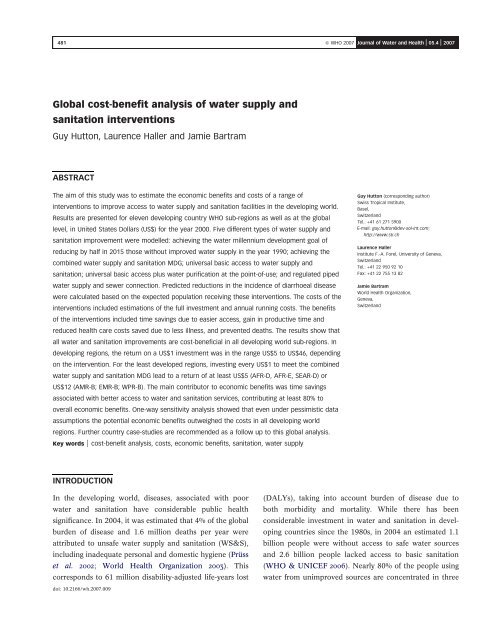
481 Q WHO 2007 Journal <strong>of</strong> Water <strong>and</strong> Health | 05.4 | 2007<br />
<strong>Global</strong> <strong>cost</strong>-<strong>benefit</strong> <strong>analysis</strong> <strong>of</strong> <strong>water</strong> <strong>supply</strong> <strong>and</strong><br />
<strong>sanitation</strong> interventions<br />
Guy Hutton, Laurence Haller <strong>and</strong> Jamie Bartram<br />
ABSTRACT<br />
The aim <strong>of</strong> this study was to estimate the economic <strong>benefit</strong>s <strong>and</strong> <strong>cost</strong>s <strong>of</strong> a range <strong>of</strong><br />
interventions to improve access to <strong>water</strong> <strong>supply</strong> <strong>and</strong> <strong>sanitation</strong> facilities in the developing world.<br />
Results are presented for eleven developing country WHO sub-regions as well as at the global<br />
level, in United States Dollars (US$) for the year 2000. Five different types <strong>of</strong> <strong>water</strong> <strong>supply</strong> <strong>and</strong><br />
<strong>sanitation</strong> improvement were modelled: achieving the <strong>water</strong> millennium development goal <strong>of</strong><br />
reducing by half in 2015 those without improved <strong>water</strong> <strong>supply</strong> in the year 1990; achieving the<br />
combined <strong>water</strong> <strong>supply</strong> <strong>and</strong> <strong>sanitation</strong> MDG; universal basic access to <strong>water</strong> <strong>supply</strong> <strong>and</strong><br />
<strong>sanitation</strong>; universal basic access plus <strong>water</strong> purification at the point-<strong>of</strong>-use; <strong>and</strong> regulated piped<br />
<strong>water</strong> <strong>supply</strong> <strong>and</strong> sewer connection. Predicted reductions in the incidence <strong>of</strong> diarrhoeal disease<br />
were calculated based on the expected population receiving these interventions. The <strong>cost</strong>s <strong>of</strong> the<br />
interventions included estimations <strong>of</strong> the full investment <strong>and</strong> annual running <strong>cost</strong>s. The <strong>benefit</strong>s<br />
<strong>of</strong> the interventions included time savings due to easier access, gain in productive time <strong>and</strong><br />
reduced health care <strong>cost</strong>s saved due to less illness, <strong>and</strong> prevented deaths. The results show that<br />
all <strong>water</strong> <strong>and</strong> <strong>sanitation</strong> improvements are <strong>cost</strong>-beneficial in all developing world sub-regions. In<br />
developing regions, the return on a US$1 investment was in the range US$5 to US$46, depending<br />
on the intervention. For the least developed regions, investing every US$1 to meet the combined<br />
<strong>water</strong> <strong>supply</strong> <strong>and</strong> <strong>sanitation</strong> MDG lead to a return <strong>of</strong> at least US$5 (AFR-D, AFR-E, SEAR-D) or<br />
US$12 (AMR-B; EMR-B; WPR-B). The main contributor to economic <strong>benefit</strong>s was time savings<br />
associated with better access to <strong>water</strong> <strong>and</strong> <strong>sanitation</strong> services, contributing at least 80% to<br />
overall economic <strong>benefit</strong>s. One-way sensitivity <strong>analysis</strong> showed that even under pessimistic data<br />
assumptions the potential economic <strong>benefit</strong>s outweighed the <strong>cost</strong>s in all developing world<br />
regions. Further country case-studies are recommended as a follow up to this global <strong>analysis</strong>.<br />
Key words | <strong>cost</strong>-<strong>benefit</strong> <strong>analysis</strong>, <strong>cost</strong>s, economic <strong>benefit</strong>s, <strong>sanitation</strong>, <strong>water</strong> <strong>supply</strong><br />
Guy Hutton (corresponding author)<br />
Swiss Tropical Institute,<br />
Basel,<br />
Switzerl<strong>and</strong><br />
Tel.: +41 61 271 5900<br />
E-mail: guy.hutton@dev-sol-int.com;<br />
http://www.sti.ch<br />
Laurence Haller<br />
Institute F.-A. Forel, University <strong>of</strong> Geneva,<br />
Switzerl<strong>and</strong><br />
Tel.: +41 22 950 92 10<br />
Fax: +41 22 755 13 82<br />
Jamie Bartram<br />
World Health Organization,<br />
Geneva,<br />
Switzerl<strong>and</strong><br />
INTRODUCTION<br />
In the developing world, diseases, associated with poor<br />
<strong>water</strong> <strong>and</strong> <strong>sanitation</strong> have considerable public health<br />
significance. In 2004, it was estimated that 4% <strong>of</strong> the global<br />
burden <strong>of</strong> disease <strong>and</strong> 1.6 million deaths per year were<br />
attributed to unsafe <strong>water</strong> <strong>supply</strong> <strong>and</strong> <strong>sanitation</strong> (WS&S),<br />
including inadequate personal <strong>and</strong> domestic hygiene (Prüss<br />
et al. 2002; World Health Organization 2003). This<br />
corresponds to 61 million disability-adjusted life-years lost<br />
(DALYs), taking into account burden <strong>of</strong> disease due to<br />
both morbidity <strong>and</strong> mortality. While there has been<br />
considerable investment in <strong>water</strong> <strong>and</strong> <strong>sanitation</strong> in developing<br />
countries since the 1980s, in 2004 an estimated 1.1<br />
billion people were without access to safe <strong>water</strong> sources<br />
<strong>and</strong> 2.6 billion people lacked access to basic <strong>sanitation</strong><br />
(WHO & UNICEF 2006). Nearly 80% <strong>of</strong> the people using<br />
<strong>water</strong> from unimproved sources are concentrated in three<br />
doi: 10.2166/wh.2007.009
482 Guy Hutton et al. | <strong>Global</strong> <strong>cost</strong>-<strong>benefit</strong> <strong>analysis</strong> <strong>of</strong> <strong>water</strong> <strong>supply</strong> <strong>and</strong> <strong>sanitation</strong> interventions Journal <strong>of</strong> Water <strong>and</strong> Health | 05.4 | 2007<br />
regions: sub-Saharan Africa, Eastern Asia <strong>and</strong> Southern<br />
Asia. In sub-Saharan Africa progress was made from 49%<br />
coverage in 1990 to 56% in 2004. For <strong>sanitation</strong> overall<br />
levels <strong>of</strong> use <strong>of</strong> improved facilities are far lower than for<br />
drinking-<strong>water</strong> - only 59% <strong>of</strong> the world population had<br />
access to any type <strong>of</strong> improved <strong>sanitation</strong> facility at home in<br />
2004 (from 49% in 1990) (WHO & UNICEF 2006).<br />
In order to increase the rate at which new populations<br />
have access to improved <strong>water</strong> <strong>supply</strong> <strong>and</strong> <strong>sanitation</strong><br />
services, further advocacy is needed at international <strong>and</strong><br />
national levels to increase the resource allocations to these<br />
services, <strong>and</strong> at population level to increase service uptake.<br />
In the current climate where poverty reduction strategies<br />
dominate the development agenda, the potential productivity<br />
<strong>and</strong> income effects <strong>of</strong> improved services is a<br />
significant argument to support further resource allocations<br />
to <strong>water</strong> <strong>supply</strong> <strong>and</strong> <strong>sanitation</strong>. While <strong>cost</strong>-effectiveness<br />
<strong>analysis</strong> is the method <strong>of</strong> choice for resource allocation<br />
decisions in the health sector (Tan-Torres Edejer et al.<br />
2003), at present <strong>cost</strong>-<strong>benefit</strong> <strong>analysis</strong> remains the form <strong>of</strong><br />
economic evaluation most useful for resource allocation<br />
between government-financed activities <strong>and</strong> within productive<br />
sectors (Hutton 2000; Curry & Weiss 1993; Layard<br />
& Glaister 1994). In this discussion it is important to<br />
distinguish between social <strong>cost</strong>-<strong>benefit</strong> <strong>analysis</strong>, which<br />
measures the overall welfare impact <strong>of</strong> interventions, <strong>and</strong><br />
financial <strong>cost</strong>-<strong>benefit</strong> <strong>analysis</strong>, which measures only<br />
the direct financial implications <strong>of</strong> an intervention. The<br />
former – social <strong>cost</strong>-<strong>benefit</strong> <strong>analysis</strong> – is advocated for use<br />
in government decisions as it is more comprehensive,<br />
reflecting an intervention’s overall impact on societal<br />
welfare.<br />
In essence, an economic evaluation compares the value<br />
<strong>of</strong> all the quantifiable <strong>benefit</strong>s gained due to a specific policy<br />
or intervention with the <strong>cost</strong>s <strong>of</strong> implementing the same<br />
intervention. If <strong>benefit</strong>s <strong>and</strong> <strong>cost</strong>s are expressed in a common<br />
monetary unit (such as US dollars), as in <strong>cost</strong>-<strong>benefit</strong> <strong>analysis</strong>,<br />
it is possible to estimate if the total <strong>benefit</strong> <strong>of</strong> an intervention<br />
exceeds the total <strong>cost</strong>, <strong>and</strong> the annual rate <strong>of</strong> return on the<br />
investment. While there are many criteria for allocating<br />
resources between different ministries <strong>and</strong> government<br />
programmes, the relative economic <strong>cost</strong>s <strong>and</strong> effects <strong>of</strong><br />
different programmes <strong>and</strong> interventions remains an important<br />
one (Drummond et al. 1997). Furthermore, by identifying<br />
who <strong>benefit</strong>s in welfare terms from development activities,<br />
<strong>cost</strong>-<strong>benefit</strong> <strong>analysis</strong> can assist in the development <strong>of</strong><br />
equitable but sustainable financing mechanisms. Ideally,<br />
both <strong>cost</strong>s <strong>and</strong> <strong>benefit</strong>s should be disaggregated by different<br />
government ministries, donors, private households, commercial<br />
enterprises, <strong>and</strong> so on. Therefore, <strong>cost</strong>-<strong>benefit</strong> <strong>analysis</strong><br />
should not only aim to provide information on economic<br />
efficiency, but also provide other policy-relevant information<br />
on who <strong>benefit</strong>s <strong>and</strong> therefore who may be willing to<br />
contribute to the financing <strong>of</strong> interventions.<br />
Despite the substantial amount <strong>of</strong> resources being<br />
allocated to <strong>water</strong> <strong>and</strong> <strong>sanitation</strong> activities worldwide,<br />
there are surprisingly few published economic evaluations<br />
<strong>of</strong> <strong>water</strong> <strong>and</strong> <strong>sanitation</strong> interventions (Hutton 2001). The<br />
grey literature is richer in different types <strong>of</strong> economic<br />
<strong>analysis</strong>, especially Development Banks (e.g. World Bank)<br />
through their process <strong>of</strong> project assessment before a project<br />
is financed. One global <strong>cost</strong>-<strong>benefit</strong> <strong>analysis</strong> was previously<br />
published by the World Health Organization, <strong>and</strong> those<br />
results have been revised for this present paper (Hutton &<br />
Haller 2004). A <strong>cost</strong>-effectiveness <strong>analysis</strong> <strong>of</strong> the same sets<br />
<strong>of</strong> interventions is published in this issue (Haller et al. 2007).<br />
METHODS<br />
Interventions<br />
The range <strong>of</strong> options available for improving <strong>water</strong> <strong>supply</strong><br />
<strong>and</strong> <strong>sanitation</strong> services is wide. The <strong>analysis</strong> presented in this<br />
paper was based on changes in <strong>water</strong> <strong>supply</strong> <strong>and</strong> <strong>sanitation</strong><br />
service levels. In this <strong>analysis</strong>, ‘improved’ <strong>water</strong> <strong>supply</strong> <strong>and</strong><br />
<strong>sanitation</strong> refer to low technology improvements:<br />
† ‘Improved’ <strong>water</strong> <strong>supply</strong> generally involves better physical<br />
access <strong>and</strong> the protection <strong>of</strong> <strong>water</strong> sources, including<br />
st<strong>and</strong> post, borehole, protected spring or well or<br />
collected rain <strong>water</strong>. Improvement does not mean that<br />
the <strong>water</strong> is necessarily safe, but rather that it meets<br />
minimum criteria for accessibility <strong>and</strong> measures are<br />
taken to protect the <strong>water</strong> source from contamination.<br />
† ‘Improved’ <strong>sanitation</strong> generally involves physically closer<br />
facilities, less waiting time, <strong>and</strong> safer disposal <strong>of</strong> excreta,<br />
including septic tank, simple pit latrine, or ventilated<br />
improved pit-latrine.
483 Guy Hutton et al. | <strong>Global</strong> <strong>cost</strong>-<strong>benefit</strong> <strong>analysis</strong> <strong>of</strong> <strong>water</strong> <strong>supply</strong> <strong>and</strong> <strong>sanitation</strong> interventions Journal <strong>of</strong> Water <strong>and</strong> Health | 05.4 | 2007<br />
There are also further improvements which make the <strong>water</strong><br />
or <strong>sanitation</strong> services safer, or more convenient:<br />
† Water disinfection at the point <strong>of</strong> use. In this study, the<br />
use <strong>of</strong> chlorine is examined.<br />
† Personal hygiene education.<br />
† Regulated <strong>water</strong> <strong>supply</strong> through a household connection,<br />
giving <strong>water</strong> that is safe for drinking, <strong>and</strong> sewer<br />
connection, where sewage is taken away for <strong>of</strong>f-site<br />
treatment <strong>and</strong> disposal.<br />
Based on these different improvements, five “interventions”<br />
were modelled in this study, by assuming a shift between<br />
different exposure scenarios (Prüss et al. 2002) (also see<br />
Haller et al. 2007):<br />
1. Water <strong>supply</strong> MDG: Halving the proportion <strong>of</strong> people<br />
who do not have access to improved <strong>water</strong> sources by<br />
2015, with priority given to those already with improved<br />
<strong>sanitation</strong>.<br />
2. Water <strong>supply</strong> <strong>and</strong> <strong>sanitation</strong> MDG: Halving the proportion<br />
<strong>of</strong> people who do not have access to improved<br />
<strong>water</strong> sources <strong>and</strong> improved <strong>sanitation</strong> facilities, by 2015<br />
(millennium development goal 7, target 10).<br />
3. Universal basic access: Increasing access to improved<br />
<strong>water</strong> <strong>and</strong> improved <strong>sanitation</strong> services to reach universal<br />
coverage by 2015.<br />
4. Universal basic access plus point <strong>of</strong> use treatment: Providing<br />
household <strong>water</strong> treatment using chlorine <strong>and</strong> safe<br />
storage vessels, on top <strong>of</strong> improved <strong>water</strong> <strong>and</strong> <strong>sanitation</strong><br />
services, to all by 2015. Although a recent review has shown<br />
the <strong>cost</strong>s <strong>and</strong> health effects <strong>of</strong> point-<strong>of</strong>-use treatment to<br />
vary considerably between filtration, chlorination, solar<br />
disinfection <strong>and</strong> flocculation/disinfection (Clasen 2006),<br />
chlorination was chosen as one <strong>of</strong> the simplest <strong>and</strong> lowest<br />
<strong>cost</strong> options, at US$0.66 per capita per year.<br />
5. Regulated piped <strong>water</strong> <strong>supply</strong> <strong>and</strong> sewer connection:<br />
Increasing access to regulated piped <strong>water</strong> <strong>supply</strong> <strong>and</strong><br />
sewage connection in house, to reach universal coverage<br />
by 2015.<br />
All the interventions were compared to the situation in<br />
1990, which was defined as the baseline year for the MDG<br />
targets. Therefore, account is taken <strong>of</strong> the proportion <strong>of</strong><br />
populations in each country who did not have access to<br />
‘improved’ <strong>water</strong> <strong>and</strong> <strong>sanitation</strong> services in the baseline year<br />
(WHO/UNICEF/JMP 2000). The time horizon chosen in<br />
this <strong>analysis</strong> is 2015, reflecting the Millennium Development<br />
Goal target year <strong>and</strong> the end <strong>of</strong> the International<br />
Decade ‘Water for Life’. Population projection until the<br />
year 2015 has been taken into account, using projected<br />
population growth rates by country from United Nations<br />
Statistics Division. Costs <strong>and</strong> <strong>benefit</strong>s are presented in terms<br />
<strong>of</strong> equivalent annual value, based on the assumption that<br />
the targets are met by the year 2015.<br />
Geographical focus<br />
The population <strong>of</strong> the globe was separated into subgroups <strong>of</strong><br />
countries on the basis <strong>of</strong> having similar rates <strong>of</strong> child <strong>and</strong><br />
adult mortality. This resulted in 11 developing country<br />
epidemiological sub-regions characterized by the WHO<br />
sub-regions: AFR-D <strong>and</strong> AFR-E (African Region); AMR-B<br />
<strong>and</strong> AMR-D (Region <strong>of</strong> the Americas); EMR-B <strong>and</strong> EMR-D<br />
(Eastern Mediterranean Region); EUR-B <strong>and</strong> EUR-C<br />
(European Region), SEAR-B <strong>and</strong> SEAR-D (South East<br />
Asia Region) <strong>and</strong> WPR-B (Western Pacific Region). The<br />
letters B, C <strong>and</strong> D reflect the mortality stratum <strong>of</strong> each<br />
sub-region (Appendix A). This study was conducted at the<br />
country level, <strong>and</strong> the results aggregated (weighted<br />
by country population size) to give the eleven developing<br />
country WHO sub-region averages.<br />
Cost measurement<br />
The <strong>cost</strong> <strong>analysis</strong> is an incremental <strong>cost</strong> <strong>analysis</strong>, with<br />
estimation <strong>of</strong> the <strong>cost</strong>s <strong>of</strong> extending coverage <strong>of</strong> <strong>water</strong><br />
<strong>supply</strong> <strong>and</strong> <strong>sanitation</strong> services to those currently not<br />
covered. Incremental <strong>cost</strong>s consist <strong>of</strong> all resources required<br />
to put in place <strong>and</strong> maintain the interventions, as well as<br />
other <strong>cost</strong>s that result from an intervention. These are<br />
separated by investment <strong>and</strong> recurrent <strong>cost</strong>s, reported in<br />
Haller et al. (2007). Investment <strong>cost</strong>s include: planning <strong>and</strong><br />
supervision, hardware, construction <strong>and</strong> house alteration,<br />
protection <strong>of</strong> <strong>water</strong> sources <strong>and</strong> education that accompanies<br />
an investment in hardware. Recurrent <strong>cost</strong>s include:<br />
operating materials to provide a service, maintenance <strong>of</strong><br />
hardware <strong>and</strong> replacement <strong>of</strong> parts, emptying <strong>of</strong> septic
484 Guy Hutton et al. | <strong>Global</strong> <strong>cost</strong>-<strong>benefit</strong> <strong>analysis</strong> <strong>of</strong> <strong>water</strong> <strong>supply</strong> <strong>and</strong> <strong>sanitation</strong> interventions Journal <strong>of</strong> Water <strong>and</strong> Health | 05.4 | 2007<br />
tanks <strong>and</strong> latrines, ongoing protection <strong>and</strong> monitoring <strong>of</strong><br />
<strong>water</strong> sources, <strong>and</strong> continuous education activities. For the<br />
more advanced intervention ‘regulated piped <strong>water</strong> <strong>supply</strong><br />
<strong>and</strong> sewer connection’, the <strong>cost</strong>s <strong>of</strong> <strong>water</strong> treatment <strong>and</strong><br />
distribution, sewer connection <strong>and</strong> sewage treatment, <strong>and</strong><br />
regulation <strong>and</strong> control <strong>of</strong> <strong>water</strong> <strong>supply</strong> are also included.<br />
For the initial investment <strong>cost</strong> <strong>of</strong> WS&S interventions,<br />
the main source <strong>of</strong> <strong>cost</strong> data inputs was the data collected<br />
for the <strong>Global</strong> Water Supply <strong>and</strong> Sanitation Assessment<br />
2000 Report (World Health Organization & UNICEF<br />
2000), which gave the investment <strong>cost</strong> per person covered<br />
in 3 major world regions (Africa, Latin America <strong>and</strong> the<br />
Caribbean, <strong>and</strong> Asia/Oceania), presented in Haller et al.<br />
(2007). The source <strong>of</strong> <strong>cost</strong> data for <strong>water</strong> purification using<br />
chlorination at the point <strong>of</strong> use was taken from a more<br />
recent study (Clasen 2006).<br />
The estimation <strong>of</strong> running <strong>cost</strong>s was, however, problematic<br />
due to lack <strong>of</strong> previous presentation <strong>of</strong> recurrent <strong>and</strong><br />
investment <strong>cost</strong>s in the peer-reviewed literature. Therefore,<br />
an internet search was conducted to identify expenditure<br />
statements (or budgets) <strong>of</strong> <strong>water</strong> <strong>and</strong> <strong>sanitation</strong> projects<br />
such as those <strong>of</strong> development banks, bilateral governmental<br />
aid agencies, <strong>and</strong> non-governmental organisations. The data<br />
extracted from this literature allowed estimations to be<br />
made <strong>of</strong> the annual per capita recurrent <strong>cost</strong>s as a<br />
proportion <strong>of</strong> the original annual investment <strong>cost</strong>s per<br />
capita, for different intervention <strong>and</strong> technology types. The<br />
recurrent <strong>cost</strong> data inputs are provided in Haller et al.<br />
(2007).<br />
protozoal <strong>and</strong> viral intestinal diseases. These diseases are<br />
transmitted by <strong>water</strong>, person-to-person contact, animal-tohuman<br />
contact, <strong>and</strong> food-borne <strong>and</strong> aerosol routes. As<br />
diarrhoea is the main disease burden from poor <strong>water</strong> <strong>and</strong><br />
<strong>sanitation</strong>, for which there is data for all regions on<br />
incidence rates <strong>and</strong> deaths (Murray & Lopez 2000; Prüss<br />
et al. 2002), the impact on diarrhoeal disease is used in this<br />
study as the principal health outcome measure with an<br />
economic burden. Therefore, including only infectious<br />
diarrhoea will lead to a systematic underestimation <strong>of</strong><br />
beneficial impact. The following two main outcomes are<br />
taken as being associated with diarrhoeal disease:<br />
† Reduction in incidence rates (cases reduced per year).<br />
† Reduction in the number <strong>of</strong> deaths (deaths averted<br />
per year)<br />
These were calculated by applying relative risks taken from<br />
a literature review (Prüss et al. 2002) which were converted<br />
to risk reduction when moving between different exposure<br />
scenarios (based on the current <strong>water</strong> <strong>supply</strong> <strong>and</strong> <strong>sanitation</strong><br />
coverage). For <strong>water</strong> treatment at the point <strong>of</strong> use, a more<br />
recent review <strong>of</strong> the literature was used to estimate the<br />
relative risk reduction using <strong>water</strong> chlorination, which<br />
yields a 37% reduction in diarrhoeal incidence (Clasen<br />
et al. 2006). Risk reductions are presented in Haller et al.<br />
(2007). The number <strong>of</strong> people in each exposure scenario<br />
were taken from coverage data collected for the <strong>Global</strong><br />
Water Supply <strong>and</strong> Sanitation Assessment 2000 Report<br />
(WHO & UNICEF 2000).<br />
Health effects<br />
Knowledge <strong>of</strong> the health effects <strong>of</strong> the five interventions is<br />
important not only for a <strong>cost</strong>-effectiveness <strong>analysis</strong>, but also<br />
for a <strong>cost</strong>-<strong>benefit</strong> <strong>analysis</strong> as some important economic<br />
<strong>benefit</strong>s depend on estimates <strong>of</strong> health effect. Over recent<br />
decades, compelling evidence has been gathered that<br />
significant <strong>and</strong> beneficial health impacts are associated<br />
with improving <strong>water</strong> <strong>supply</strong> <strong>and</strong> <strong>sanitation</strong> services (Fewtrell<br />
et al. 2005). The <strong>analysis</strong> has been restricted to<br />
infectious diarrhoea as it accounts for the main disease<br />
burden associated with poor <strong>water</strong>, <strong>sanitation</strong> <strong>and</strong> hygiene<br />
(Prüss et al. 2002). Infectious diarrhoea includes cholera,<br />
salmonellosis, shigellosis, amoebiasis, <strong>and</strong> other bacterial,<br />
Non-health <strong>benefit</strong>s<br />
There are many <strong>and</strong> diverse potential <strong>benefit</strong>s associated<br />
with improved <strong>water</strong> <strong>and</strong> <strong>sanitation</strong>, ranging from the<br />
easily identifiable <strong>and</strong> quantifiable to the intangible <strong>and</strong><br />
difficult to measure (Hutton 2001). A social <strong>cost</strong>-<strong>benefit</strong><br />
<strong>analysis</strong> should include all the important socio-economic<br />
<strong>benefit</strong>s <strong>of</strong> the different interventions included in the<br />
<strong>analysis</strong>, which includes both <strong>cost</strong> savings as well as<br />
additional economic <strong>benefit</strong>s resulting from the interventions,<br />
compared with a do-nothing scenario (that is,<br />
maintaining current conditions) (Sugden & Williams 1978;<br />
Curry & Weiss 1993; Layard & Glaister 1994; Drummond<br />
et al. 1997).
485 Guy Hutton et al. | <strong>Global</strong> <strong>cost</strong>-<strong>benefit</strong> <strong>analysis</strong> <strong>of</strong> <strong>water</strong> <strong>supply</strong> <strong>and</strong> <strong>sanitation</strong> interventions Journal <strong>of</strong> Water <strong>and</strong> Health | 05.4 | 2007<br />
Due to problems in measurement <strong>and</strong> valuation <strong>of</strong><br />
some <strong>of</strong> the economic <strong>benefit</strong>s arising from <strong>water</strong> <strong>supply</strong><br />
<strong>and</strong> <strong>sanitation</strong> interventions, the aim <strong>of</strong> this present study is<br />
not to include all the potential economic <strong>benefit</strong>s that may<br />
arise from the interventions, but to capture the most<br />
tangible <strong>and</strong> measurable <strong>benefit</strong>s. Some less tangible or<br />
less important <strong>benefit</strong>s were left out for three main reasons:<br />
the lack <strong>of</strong> relevant economic data available globally<br />
(Hutton 2001); the difficulty <strong>of</strong> measuring <strong>and</strong> valuing in<br />
economic terms some types <strong>of</strong> economic <strong>benefit</strong> (Hanley &<br />
Spash 1993; North & Griffin 1993; Field 1997); <strong>and</strong> the<br />
context-specific nature <strong>of</strong> some economic <strong>benefit</strong>s which<br />
would reduce their relevance for a global <strong>cost</strong>-<strong>benefit</strong><br />
<strong>analysis</strong> study.<br />
For ease <strong>of</strong> comprehension <strong>and</strong> interpretation <strong>of</strong><br />
findings, the <strong>benefit</strong>s <strong>of</strong> the <strong>water</strong> <strong>supply</strong> <strong>and</strong> <strong>sanitation</strong><br />
improvements were classified into three main types: (1)<br />
direct economic <strong>benefit</strong>s <strong>of</strong> avoiding diarrhoeal disease; (2)<br />
indirect economic <strong>benefit</strong>s related to health improvement;<br />
<strong>and</strong> (3) non-health <strong>benefit</strong>s related to <strong>water</strong> <strong>supply</strong> <strong>and</strong><br />
<strong>sanitation</strong> improvement. As a general rule, these <strong>benefit</strong>s<br />
were valued in monetary terms – in United States Dollars<br />
(US$) in the year 2000 – using conventional methods for<br />
economic valuation (Curry & Weiss 1993; Hanley & Spash<br />
1993; Field 1997). Details concerning the specific valuation<br />
approaches are described for each <strong>benefit</strong> below.<br />
(1) Direct economic <strong>benefit</strong>s <strong>of</strong> avoiding diarrhoeal<br />
disease<br />
The direct economic <strong>benefit</strong>s <strong>of</strong> health interventions consist<br />
partly <strong>of</strong> <strong>cost</strong>s averted due to the prevention or early<br />
treatment <strong>of</strong> disease, <strong>and</strong> thus lower rates <strong>of</strong> morbidity <strong>and</strong><br />
mortality. ‘Direct’ includes “the value <strong>of</strong> all goods, services<br />
<strong>and</strong> other resources that are consumed in the provision <strong>of</strong><br />
an intervention or in dealing with the side effects or other<br />
current <strong>and</strong> future consequences linked to it” (Gold et al.<br />
1996, page 179). In the case <strong>of</strong> preventive activities –<br />
including improvement <strong>of</strong> <strong>water</strong> <strong>supply</strong> <strong>and</strong> <strong>sanitation</strong><br />
services – the main <strong>benefit</strong>s (or <strong>cost</strong>s avoided) relate to<br />
the health care <strong>and</strong> non-health care <strong>cost</strong>s avoided due to<br />
fewer cases <strong>of</strong> diarrhoea. The savings associated with other<br />
<strong>water</strong>-based diseases are excluded as only diarrhoeal<br />
disease was included in this study.<br />
Costs saved due to less cases <strong>of</strong> diarrhoea may accrue to<br />
the health service (if there is no <strong>cost</strong> recovery), the patient (if<br />
<strong>cost</strong> recovery) <strong>and</strong>/or the employer <strong>of</strong> the patient (if the<br />
employer covers <strong>cost</strong>s related to sickness). On whom the<br />
<strong>cost</strong>s fall will depend on the status <strong>of</strong> the patient as well as the<br />
country the patient is seeking care in, due to variation<br />
between countries in payment mechanisms. In economic<br />
evaluation, what is most important is not who pays, but what<br />
are the overall use <strong>of</strong> resources, <strong>and</strong> their value. Therefore, in<br />
the current <strong>analysis</strong>, the health service direct <strong>cost</strong> <strong>of</strong><br />
outpatient visits <strong>and</strong> inpatient days are assumed to equal<br />
the economic value <strong>of</strong> these services.<br />
For the treatment <strong>of</strong> diarrhoea, unit <strong>cost</strong>s included the<br />
full health care <strong>cost</strong> (consultation <strong>and</strong> treatment), which<br />
varied by developing region according to region-specific<br />
unit <strong>cost</strong>s (Mulligan et al. 2005). The total <strong>cost</strong> savings were<br />
calculated by multiplying the health service unit <strong>cost</strong> by the<br />
number <strong>of</strong> cases averted, using assumptions about health<br />
service use per case. Due to lack <strong>of</strong> studies presenting data<br />
on the number <strong>of</strong> outpatient visits per case, it was assumed<br />
that 30% <strong>of</strong> cases <strong>of</strong> diarrhoea would visit a health facility<br />
once. The <strong>analysis</strong> assumes that 8.2% <strong>of</strong> diarrhoea cases<br />
seeking outpatient care are hospitalised (unpublished data,<br />
World Health Organization), with an average length <strong>of</strong> stay<br />
<strong>of</strong> 5 days each. Other forms <strong>of</strong> treatment seeking are<br />
excluded due to lack <strong>of</strong> information on health seeking<br />
behaviour for informal care or self-treatment <strong>and</strong> the<br />
associated <strong>cost</strong>s.<br />
Non-health sector direct <strong>cost</strong>s are mainly those that fall<br />
on the patient, <strong>cost</strong>s usually related to the visit to the health<br />
facility, such as transport <strong>cost</strong>s to health services, other visit<br />
expenses (e.g. food <strong>and</strong> drink) <strong>and</strong> the opportunity <strong>cost</strong>s <strong>of</strong><br />
time. The most tangible patient <strong>cost</strong> included was the<br />
transport <strong>cost</strong>, although there is a lack <strong>of</strong> data reported on<br />
average transport <strong>cost</strong>s. In the base case it was assumed that<br />
50% (range 0%2100%) <strong>of</strong> diarrhoeal cases seeking formal<br />
health care take some form <strong>of</strong> transport at US$0.50 per<br />
return journey, excluding other direct <strong>cost</strong>s associated with<br />
the journey. Other <strong>cost</strong>s associated with a visit to the health<br />
facility were also assumed such as food <strong>and</strong> drinks, <strong>and</strong><br />
added to transport <strong>cost</strong>s, giving US$0.50 per outpatient visit<br />
<strong>and</strong> US$2 per inpatient admission. Time <strong>cost</strong>s avoided <strong>of</strong><br />
treatment seeking are assumed to be included in the time<br />
gains related to health improvement.
486 Guy Hutton et al. | <strong>Global</strong> <strong>cost</strong>-<strong>benefit</strong> <strong>analysis</strong> <strong>of</strong> <strong>water</strong> <strong>supply</strong> <strong>and</strong> <strong>sanitation</strong> interventions Journal <strong>of</strong> Water <strong>and</strong> Health | 05.4 | 2007<br />
(2) Indirect economic <strong>benefit</strong>s related to health<br />
improvement<br />
A second type <strong>of</strong> <strong>benefit</strong> is the productivity effect <strong>of</strong><br />
improved health (Gold et al. 1996). These are traditionally<br />
split into two main types: gains related to lower morbidity<br />
<strong>and</strong> gains related to fewer deaths. In terms <strong>of</strong> the valuation<br />
<strong>of</strong> changes in time use for <strong>cost</strong>-<strong>benefit</strong> <strong>analysis</strong>, the<br />
convention is to value the time which would be spent ill<br />
at some rate that reflects the opportunity <strong>cost</strong> <strong>of</strong> time. It is<br />
argued that whatever is actually done with the time,<br />
whether spent in leisure, household production, or<br />
income-earning activities, the true opportunity <strong>cost</strong> <strong>of</strong><br />
time is the monetary amount which the person would<br />
earn if they were working (Curry & Weiss 1993). However,<br />
given that many <strong>of</strong> the averted diarrhoeal cases will not be<br />
<strong>of</strong> working age, the population is divided into three separate<br />
groups <strong>and</strong> their time valued differently: infants <strong>and</strong> nonschool<br />
age children (children , 5 years); school age<br />
children until 15; <strong>and</strong> adults (age 15 <strong>and</strong> over).<br />
For those <strong>of</strong> working age, the number <strong>of</strong> work days<br />
gained per case <strong>of</strong> diarrhoea averted is assumed to be 2 days<br />
per case. The value <strong>of</strong> time is taken as the Gross National<br />
Income (GNI) per capita in the year 2000, as it reflects the<br />
average economic value <strong>of</strong> a member <strong>of</strong> society for each<br />
country, <strong>and</strong> the information collected internationally on<br />
GNI per capita is more reliable than minimum wage rates.<br />
Also, from an equity perspective, it is appropriate to assign<br />
to all adults the same economic value <strong>of</strong> time, so that high<br />
income earners are not favored over low or non-income<br />
earning workers or men over women.<br />
For children <strong>of</strong> school age, the impact <strong>of</strong> illness is to<br />
prevent them from going to school, thus interrupting their<br />
education. It is assumed that each case <strong>of</strong> diarrhoea in<br />
children <strong>of</strong> school age results in 3 days <strong>of</strong>f school per case.<br />
Given the recognised importance <strong>of</strong> proper schooling for<br />
future productivity as well as the overall welfare <strong>of</strong> society,<br />
it is important to value explicitly the social <strong>and</strong> economic<br />
implications <strong>of</strong> children missing school due to ill health<br />
(Organisation for Economic Cooperation & Development<br />
2006). Hence, in the absence <strong>of</strong> established alternative<br />
methods for the valuation <strong>of</strong> children’s time, the <strong>analysis</strong><br />
gives children <strong>of</strong> school age the same value as for adults: the<br />
GNI per capita.<br />
For infants <strong>and</strong> children not <strong>of</strong> school age (under 5), it is<br />
likely that the carer <strong>of</strong> the child must spend more time<br />
caring for the child than is otherwise the case, or alternative<br />
child care arrangements must be made that impose an<br />
additional <strong>cost</strong>. The expected time ill per case <strong>of</strong> diarrhoea<br />
for a young child is assumed to be 5 days, which reflects the<br />
average <strong>of</strong> breast-fed infants (3.8 days) <strong>and</strong> formula-fed<br />
infants (6.2 days) in Mexico (Lopez-Alarcon et al. 1997). For<br />
the valuation <strong>of</strong> this illness time, it would not be wholly<br />
justifiable to give young child days a valuation <strong>of</strong> the full<br />
GNI per capita. However, in recognition <strong>of</strong> the opportunity<br />
<strong>cost</strong> <strong>of</strong> the child’s carer, who would have been doing other<br />
productive activities with the time they cared for the sick<br />
child, a daily value is taken at 50% <strong>of</strong> the GNI per capita.<br />
In terms <strong>of</strong> deaths avoided due to diarrhoea following<br />
improved <strong>water</strong> <strong>supply</strong> <strong>and</strong> <strong>sanitation</strong> services, the expected<br />
number is predicted from the health impact model as the<br />
number <strong>of</strong> diarrhoeal cases multiplied by the case fatality<br />
rate (unpublished data, World Health Organization). The<br />
convention in traditional <strong>cost</strong>-<strong>benefit</strong> <strong>analysis</strong> is to value<br />
these deaths avoided at the discounted income stream <strong>of</strong> the<br />
avoided death, from the age at which the person is expected<br />
to become productive (Suarez & Bradford 1993). Therefore,<br />
to predict the economic <strong>cost</strong>s <strong>of</strong> premature mortality, the<br />
study estimates the number <strong>of</strong> productive years left to each<br />
<strong>of</strong> the three major age categories (under 5, 5–14, <strong>and</strong> over<br />
15 years <strong>of</strong> age), then estimates the income that would be<br />
earned from averted fatalities, <strong>and</strong> discounts the income to<br />
the present time period at a discount rate <strong>of</strong> 3%. For those<br />
not yet in the workforce (those in the 0–4 <strong>and</strong> 5–15 age<br />
brackets), the current value for the future income stream is<br />
further discounted to take account <strong>of</strong> the lag before these<br />
individuals are assumed to be working. The value <strong>of</strong> time is<br />
taken as the GNI per capita for the year 2000.<br />
(3) Non-health <strong>benefit</strong>s related to <strong>water</strong> <strong>and</strong> <strong>sanitation</strong><br />
improvement<br />
One <strong>of</strong> the major <strong>and</strong> unarguable <strong>benefit</strong>s <strong>of</strong> <strong>water</strong> <strong>supply</strong><br />
<strong>and</strong> <strong>sanitation</strong> improvements, is the reduction in time<br />
expenditure (or time savings) associated with closer <strong>water</strong><br />
<strong>and</strong> <strong>sanitation</strong> facilities. Time savings occur due to, for<br />
example, the relocation <strong>of</strong> a well or borehole nearer<br />
populations, piped <strong>water</strong> <strong>supply</strong> to households, <strong>and</strong> closer
487 Guy Hutton et al. | <strong>Global</strong> <strong>cost</strong>-<strong>benefit</strong> <strong>analysis</strong> <strong>of</strong> <strong>water</strong> <strong>supply</strong> <strong>and</strong> <strong>sanitation</strong> interventions Journal <strong>of</strong> Water <strong>and</strong> Health | 05.4 | 2007<br />
access to latrines <strong>and</strong> less waiting time for public latrines.<br />
These time savings give either increased production or more<br />
leisure time, which have a welfare implication <strong>and</strong> therefore<br />
carry with them an economic value.<br />
Convenience time savings are estimated by assuming a<br />
daily time saving per individual for <strong>water</strong> <strong>supply</strong> <strong>and</strong><br />
<strong>sanitation</strong> services separately <strong>and</strong> multiplying by the GNI<br />
per capita to give the economic <strong>benefit</strong>. Different time<br />
saving assumptions for <strong>water</strong> are made based on whether<br />
the <strong>water</strong> is supplied to the house (household connection)<br />
or within the community. As this was a global <strong>analysis</strong>, the<br />
estimate <strong>of</strong> time savings per household could not take into<br />
account the different methods <strong>of</strong> delivery <strong>of</strong> interventions<br />
<strong>and</strong> the mix <strong>of</strong> rural/urban locations in different countries<br />
<strong>and</strong> regions, due to the very limited data available from the<br />
literature on time uses. Two separate published reviews<br />
have revealed largely different studies, which are presented<br />
in Table 1 (Dutta 2005; Cairncross & Valdmanis 2006). The<br />
results <strong>of</strong> these studies show that even for single countries<br />
there are considerable variations in access to the nearest<br />
<strong>water</strong> <strong>supply</strong> for households that haul their <strong>water</strong> from<br />
outside the house or compound area. For example, studies<br />
in India have shown average daily collection times per<br />
household to vary from 0.5 hours (Saksena et al. 1995) to 2.2<br />
hours (Mukherjee 1990). However, in no studies were <strong>water</strong><br />
<strong>supply</strong> access times found to be reported <strong>of</strong> under 0.5 hours<br />
per household per day.<br />
Therefore, given these wide variations in daily time spent<br />
accessing <strong>water</strong> from the international literature, as well as the<br />
expected enormous differences between settings in the<br />
developing world in <strong>water</strong> availability (current <strong>and</strong> future),<br />
based on the literature this study made general assumptions<br />
about time savings following <strong>water</strong> improvements for households<br />
that haul their <strong>water</strong> from outside the house or<br />
compound area. It was therefore assumed that, on average, a<br />
household gaining improved <strong>water</strong> <strong>supply</strong> saves 30 minutes<br />
per day (non-household source), <strong>and</strong> households receiving<br />
piped <strong>water</strong> save 90 minutes per household per day.<br />
For improved <strong>sanitation</strong>, no data were found in the<br />
literature review for an estimate <strong>of</strong> time saved per day due to<br />
less distant <strong>sanitation</strong> facilities <strong>and</strong> less waiting time. No<br />
data on time to access <strong>sanitation</strong> facilities were presented or<br />
discussed in the references or in the two published reviews<br />
cited above for <strong>water</strong> <strong>supply</strong> (Dutta 2005; Cairncross &<br />
Valdmanis 2006). Therefore, the present study made<br />
assumptions based on the need <strong>of</strong> individuals using<br />
unimproved <strong>sanitation</strong> facilities (open defecation, shared<br />
or public facilities) to make several visits per day to a private<br />
place outside the home, giving an estimated 30 minutes<br />
saved per person per day with improved <strong>sanitation</strong> facilities.<br />
Sensitivity <strong>analysis</strong><br />
Many <strong>of</strong> the data used in the model are uncertain. A few<br />
selected variables with the greatest impact on the results are<br />
presented in this paper using the technique <strong>of</strong> sensitivity<br />
<strong>analysis</strong>. These included the time gains per person due to<br />
better access; the value <strong>of</strong> time; diarrhoeal disease incidence;<br />
<strong>and</strong> intervention <strong>cost</strong>s.<br />
Given that the overall results were expected to be<br />
heavily determined by time savings, the time saving<br />
assumptions used in the sensitivity <strong>analysis</strong> for improved<br />
<strong>water</strong> access were the following: in the pessimistic scenario<br />
a time saving <strong>of</strong> one quarter <strong>of</strong> an hour was assumed per<br />
household for improved community access, with an average<br />
household size <strong>of</strong> 8 persons; in the optimistic scenario, one<br />
hour was saved per household per day for improved<br />
community access, in an average household <strong>of</strong> 4 persons.<br />
For <strong>sanitation</strong> access, the base case time saving per person<br />
was halved in the pessimistic scenario <strong>and</strong> increased by 50%<br />
in the optimistic scenario.<br />
A realistic variation should also be reflected for the<br />
value <strong>of</strong> time, given its key importance in this study as an<br />
economic <strong>benefit</strong>. An alternative lower bound value to the<br />
use <strong>of</strong> GNI per capita as the base case is proposed by WHO,<br />
based on an IMF study (Senhadji 2000). This study suggests<br />
that people, on average, adults value their time at roughly<br />
30% <strong>of</strong> the GNP per capita. In the optimistic scenario, the<br />
minimum wage was applied. World Bank data do not<br />
provide a minimum wage in all countries included in the<br />
present study. In general, in most countries where one<br />
exists, the minimum wage exceeds the GNI per capita. For<br />
countries without a minimum wage value, the WHO subregional<br />
average is applied.<br />
For diarrhoeal disease incidence, low <strong>and</strong> high values<br />
were based on halving <strong>and</strong> increasing by 50% the base case<br />
incidence rates, respectively. For intervention <strong>cost</strong>s, low<br />
<strong>and</strong> high <strong>cost</strong> values were substituted in the model based on
488 Guy Hutton et al. | <strong>Global</strong> <strong>cost</strong>-<strong>benefit</strong> <strong>analysis</strong> <strong>of</strong> <strong>water</strong> <strong>supply</strong> <strong>and</strong> <strong>sanitation</strong> interventions Journal <strong>of</strong> Water <strong>and</strong> Health | 05.4 | 2007<br />
Table 1 | Time <strong>and</strong> distance to nearest <strong>water</strong> source available from the literature<br />
Country Context Measured for Time or distance Reference p<br />
Burkina Faso 0.63 hours to nearest source (Nathan 1997)<br />
Ghana Rural Women 3 hours/day (Malmburg-Calvo 1994)<br />
Women 1.2 hours/day (Toye 1991)<br />
India Household 0.93 hours/day (Barnes & Sen 2003)<br />
National survey Woman 2.2 hours/day (Mukherjee 1990)<br />
Himalayan region Household 0.5 hours/day (Saksena et al. 1995)<br />
Women 1.23 hours to nearest source (Nathan 1997)<br />
Kenya Small town Household 10–30 minutes distance<br />
(median 15 minutes)<br />
Lesotho 10 villages Closer <strong>water</strong> <strong>supply</strong> saved<br />
adult women 0.5 hours/day<br />
(Whittington et al. 1990)<br />
(Feachem et al. 1978)<br />
Mali Sampara Women 1 hour/day (Dutta 2005)<br />
Nepal Women 1.15 hours/day (Kumar & Hotchkiss 1988)<br />
Women 0.67 hours to nearest source (Nathan 1997)<br />
Nigeria<br />
Up to 4–7 hours to nearest<br />
<strong>water</strong> source<br />
(Whittington et al. 1991)<br />
Sri Lanka .10% <strong>of</strong> women .1 km to nearest <strong>water</strong><br />
source<br />
(Mertens et al. 1990)<br />
Tanzania Makete (rural) Women 1.8 hours/day (Malmburg-Calvo 1994)<br />
Tanga (rural) Women 2.7 hours/day (Malmburg-Calvo 1994)<br />
Vietnam Household 0.6 hours/day (World Bank 2001)<br />
Zambia Rural Women 0.5 hours/day (Malmburg-Calvo 1994)<br />
Multi-country 23 African countries Household .0.5 hours/day for 44%<br />
<strong>of</strong> households<br />
UNICEF Multi-Indicator Cluster<br />
Survey, reported in (Cairncross<br />
& Valdmanis 2006)<br />
East Africa (Kenya,<br />
Tanzania <strong>and</strong> Ug<strong>and</strong>a)<br />
334 sites Household 622 metres (rural) <strong>and</strong><br />
204 metres (urban) to<br />
nearest <strong>water</strong> source<br />
(Thompson et al. 2003)<br />
East Africa<br />
Two rural masai<br />
communities<br />
Women 0.9 hours/day (Biran & Mace 2004)<br />
Girls 0.6 hours/day (Biran & Mace 2004)<br />
p References extracted from two reported literature reviews (Dutta 2005; Cairncross & Valdmanis 2006).
489 Guy Hutton et al. | <strong>Global</strong> <strong>cost</strong>-<strong>benefit</strong> <strong>analysis</strong> <strong>of</strong> <strong>water</strong> <strong>supply</strong> <strong>and</strong> <strong>sanitation</strong> interventions Journal <strong>of</strong> Water <strong>and</strong> Health | 05.4 | 2007<br />
the different sets <strong>of</strong> assumptions (ranges) shown in Haller<br />
et al. (2007). Ranges are provided on four input variables to<br />
estimating annualized intervention <strong>cost</strong>: (1) length <strong>of</strong> life <strong>of</strong><br />
hardware; (2) operation, maintenance, surveillance as %<br />
annual <strong>cost</strong>; (3) education as % annual <strong>cost</strong>; <strong>and</strong> (4) <strong>water</strong><br />
source protection as % annual <strong>cost</strong>.<br />
RESULTS<br />
Numbers <strong>of</strong> people reached<br />
Table 2 presents the number <strong>of</strong> people receiving improvements<br />
by WHO developing country sub-regions. Overall,<br />
693 million people in developing regions would receive<br />
improvements in <strong>water</strong> <strong>supply</strong> if the MDG for <strong>water</strong> was<br />
reached. This corresponds to 9.6% <strong>of</strong> the world’s predicted<br />
population <strong>of</strong> 7.2 billion in the year 2015. If both the <strong>water</strong><br />
<strong>and</strong> <strong>sanitation</strong> targets were met, an additional 20.6% <strong>of</strong> the<br />
world’s population would receive an improvement, which<br />
would be roughly 1.5 billion additional people compared to<br />
the <strong>water</strong> MDG alone. In bringing improved <strong>water</strong> <strong>and</strong><br />
<strong>sanitation</strong> to all those currently without improved <strong>water</strong> or<br />
<strong>sanitation</strong>, 3.1 billion <strong>of</strong> the world’s predicted population in<br />
2015 would be reached, or 42.6%. Roughly two-thirds <strong>of</strong> the<br />
population receiving point-<strong>of</strong>-use improvements are in two<br />
sub-regions – SEAR-D <strong>and</strong> WPR-B. By improving the<br />
quality <strong>of</strong> drinking <strong>water</strong> by <strong>water</strong> purification at the point<br />
<strong>of</strong> use, a further 3.3 billion people could be reached by 2015,<br />
summing to a total <strong>of</strong> 88% <strong>of</strong> the world’s population in<br />
2015.<br />
Predicted health impact<br />
Table 2 also presents the total number <strong>of</strong> diarrhoeal cases<br />
(in millions) averted under each <strong>of</strong> the five interventions<br />
modelled. Out <strong>of</strong> an estimated annual number <strong>of</strong> cases <strong>of</strong><br />
diarrhoea <strong>of</strong> 5.3 billion globally in developing countries,<br />
meeting the <strong>water</strong> MDG potentially prevents 155 million<br />
cases, increasing to 546 million cases prevented for the<br />
W&S MDG, <strong>and</strong> 903 million for universal access to <strong>water</strong><br />
<strong>supply</strong> <strong>and</strong> <strong>sanitation</strong>. When adding <strong>water</strong> purification at<br />
the point <strong>of</strong> use, an estimated 2.5 billion cases are prevented<br />
annually in the developing world, which is 47% <strong>of</strong> the<br />
annual number <strong>of</strong> cases <strong>of</strong> diarrhoea. When regulated piped<br />
<strong>water</strong> <strong>supply</strong> <strong>and</strong> sewer connection are provided, a further<br />
1.19 billion prevented cases, due mainly to better sewerage.<br />
Except for the <strong>water</strong> MDG intervention, in all other<br />
interventions more than 50% <strong>of</strong> the cases averted are in<br />
SEAR-B <strong>and</strong> WPR-B.<br />
In terms <strong>of</strong> cases avoided per capita, if the whole<br />
population disinfected their <strong>water</strong> at the point <strong>of</strong> use on top<br />
<strong>of</strong> improved <strong>water</strong> <strong>supply</strong> <strong>and</strong> <strong>sanitation</strong>, the gains would be<br />
as high as 0.65 cases averted per person in Africa, <strong>and</strong><br />
between 0.28 <strong>and</strong> 0.46 in all other developing country<br />
regions except EUR-B <strong>and</strong> EUR-C. Of these cases, globally<br />
around 50% are gained by the 0–4 age group.<br />
The number <strong>of</strong> deaths avoided due to less cases <strong>of</strong><br />
diarrhoea was estimated using case fatality rates for<br />
diarrhoea for each WHO world sub-region. The estimated<br />
number <strong>of</strong> lives saved in developing regions from meeting<br />
the <strong>water</strong> MDG is 125,000, increasing to 440,000 for <strong>water</strong><br />
<strong>and</strong> <strong>sanitation</strong> MDG combined. If the entire world’s<br />
population has access to improved <strong>water</strong> <strong>supply</strong> <strong>and</strong><br />
<strong>sanitation</strong>, about 730,000 lives could be saved per year.<br />
Roughly 53% <strong>of</strong> these avoided deaths are in SEAR-D <strong>and</strong><br />
WPR-B, <strong>and</strong> a further 33% in AFR-D <strong>and</strong> AFR-E.<br />
Treatment <strong>cost</strong>s saved due to less diarrhoea cases<br />
The potential annual health sector <strong>cost</strong>s saved in developing<br />
regions amount to an estimated US$500 million per year if<br />
the <strong>water</strong> MDG is met, rising to US$1.7 billion per year for<br />
the combined WS&S MDG <strong>and</strong> US$2.9 billion for<br />
universal basic access. In some <strong>of</strong> the least developed subregions<br />
(e.g. AFR, AMR, EMRO-D, DEAR-D) the per capita<br />
savings are at least US$0.12 for the <strong>water</strong> MDG, rising to at<br />
least US$0.40 for WS&S MDG, <strong>and</strong> more than US$0.60 for<br />
universal basic access. These results are closely linked to the<br />
avoided cases per capita predicted by the model, but also<br />
the <strong>cost</strong> saving assumptions used such as the ambulatory<br />
care <strong>and</strong> hospitalisation unit <strong>cost</strong>s, <strong>and</strong> the proportion <strong>of</strong><br />
cases admitted to hospital.<br />
The patient treatment <strong>and</strong> travel <strong>cost</strong>s saved are much<br />
lower than the health sector <strong>cost</strong>s saved. The global patient<br />
<strong>cost</strong> savings are estimated at US$46 million per annum for<br />
the <strong>water</strong> MDG, rising to US$160 million for the WS&S<br />
MDG. The patient <strong>cost</strong> savings per capita is negligible for
Table 2 | Population targeted <strong>and</strong> diarrhoeal disease burden averted, by intervention <strong>and</strong> world sub-region<br />
Africa<br />
The Americas<br />
Eastern<br />
Mediterranean Europe<br />
South <strong>and</strong> South-East<br />
Asia<br />
Western Pacific<br />
Variable AFR-D AFR-E AMR-B AMR-D EMR-B EMR-D EUR-B EUR-C SEAR-B SEAR-D WPR-B<br />
Total population, 2015 (million) 487 481 531 93 184 189 238 223 473 1,689 1,488<br />
Annual diarrhoea cases (million) 620 619 459 93 133 153 87 43 304 1,491 1,317<br />
Total number <strong>of</strong> people receiving interventions until 2015 (million population)<br />
Water MDG 96 116 40 11 10 13 18 2 47 109 219<br />
WS&S MDG 200 232 100 26 22 33 37 10 102 645 708<br />
WS&S Universal basic 227 279 127 29 32 40 50 17 123 1,073 998<br />
Universal basic þ Disinfected 487 481 531 93 184 189 238 223 473 1,689 1,673<br />
Regulated piped WS þ sewer connection 487 481 531 93 184 189 238 223 473 1,689 1,673<br />
Number <strong>of</strong> diarrhoea cases averted per year (thous<strong>and</strong> cases)<br />
Water MDG 28,082 27,695 9,091 3,153 1,001 3,213 1,056 108 7,477 26,092 42,584<br />
WS&S MDG 83,656 85,792 27,522 9,121 4,037 9,370 3,635 541 22,072 139,891 139,500<br />
WS&S Universal basic 117,381 126,288 44,458 13,120 6,968 14,347 6,112 1,021 32,597 262,732 255,753<br />
Universal basic þ Disinfected 303,531 308,518 197,666 42,726 53,761 65,617 35,929 16,669 132,961 717,064 648,574<br />
Regulated piped WS þ sewer connection 437,876 439,980 308,336 64,106 87,581 102,659 57,475 27,983 205,467 1,043,922 931,477<br />
490 Guy Hutton et al. | <strong>Global</strong> <strong>cost</strong>-<strong>benefit</strong> <strong>analysis</strong> <strong>of</strong> <strong>water</strong> <strong>supply</strong> <strong>and</strong> <strong>sanitation</strong> interventions Journal <strong>of</strong> Water <strong>and</strong> Health | 05.4 | 2007
491 Guy Hutton et al. | <strong>Global</strong> <strong>cost</strong>-<strong>benefit</strong> <strong>analysis</strong> <strong>of</strong> <strong>water</strong> <strong>supply</strong> <strong>and</strong> <strong>sanitation</strong> interventions Journal <strong>of</strong> Water <strong>and</strong> Health | 05.4 | 2007<br />
most countries for basic improvements in <strong>water</strong> <strong>and</strong><br />
<strong>sanitation</strong>, at under US$0.10 per capita, except for SEAR-<br />
D where universal basic access to <strong>water</strong> <strong>and</strong> <strong>sanitation</strong><br />
yields estimated <strong>benefit</strong>s <strong>of</strong> US$0.52 in that sub-region.<br />
However, although relatively insignificant, these <strong>benefit</strong>s<br />
could be important for households where the health<br />
<strong>benefit</strong>s <strong>of</strong> the interventions are enjoyed, especially households<br />
with children. This is especially true where patients<br />
have to travel long distances to the health facility, <strong>and</strong><br />
where public health facilities charge for their services or<br />
private health care is used.<br />
Days gained from less illness<br />
The number <strong>of</strong> days gained due to lower incidence <strong>of</strong><br />
diarrhoea in adults, children <strong>and</strong> infants varies considerably.<br />
The distribution <strong>of</strong> days <strong>of</strong> illness avoided, by subregion<br />
<strong>and</strong> by age group is illustrated in Figure 1 for the<br />
combined <strong>water</strong> <strong>supply</strong> <strong>and</strong> <strong>sanitation</strong> MDG. Under the<br />
assumption that 2 work days are lost per case <strong>of</strong> adult<br />
diarrhoea, the global gain is 89 million working days for the<br />
total working population aged 15–59 for the <strong>water</strong> MDG.<br />
For the WS&S MDG, the global gain rises to 310 million<br />
working days gained. 71% <strong>of</strong> these <strong>benefit</strong>s accrue to two<br />
world sub-regions WPR-B <strong>and</strong> SEAR-D. For universal<br />
access to WS&S, 550 million working days gained, which<br />
increases to 1.5 billion when <strong>water</strong> is purified at the point <strong>of</strong><br />
use. For children aged 5 to 14 years old, assuming an<br />
average <strong>of</strong> 3 days <strong>of</strong>f school per case <strong>of</strong> diarrhoea, the global<br />
gain is almost 76 million days per year for the <strong>water</strong> MDG,<br />
rising to over 264 million days per year for the WS&S<br />
MDG. 79% <strong>of</strong> these <strong>benefit</strong>s accrue to the four sub-regions<br />
AFR-D, AFR-E, SEAR-D <strong>and</strong> WPR-B. For universal access<br />
to WS&S, 435 million school days are gained, which<br />
increases to 1.3 billion when <strong>water</strong> is purified at the point <strong>of</strong><br />
use. The number <strong>of</strong> days gained for children under 5 due to<br />
averted cases <strong>of</strong> diarrhoea – at a gain per case <strong>of</strong> diarrhoea<br />
averted <strong>of</strong> 5 days – is 400 million days gained for the <strong>water</strong><br />
MDG, 1.4 billion for the WS&S MDG, <strong>and</strong> 2.3 billion for<br />
universal basic access, 6.8 billion for universal basic access<br />
<strong>and</strong> <strong>water</strong> purification at the point <strong>of</strong> use.<br />
Convenience time savings<br />
Table 3 shows the annual time gain by WHO sub-region<br />
associated with the improved accessibility <strong>of</strong> <strong>water</strong> <strong>supply</strong><br />
<strong>and</strong> <strong>sanitation</strong> facilities following from the five interventions.<br />
The annual number <strong>of</strong> hours gained from meeting the<br />
<strong>water</strong> MDG is estimated at just under 30 billion hours (or<br />
about 4 billion working days), increasing to 297 billion<br />
hours for the WS&S MDG (or about 40 billion working<br />
days). This shows that the greatest proportion <strong>of</strong> time gain<br />
from the combined WS&S MDG is from <strong>sanitation</strong><br />
interventions – i.e. the closer proximity <strong>of</strong> toilets or less<br />
waiting time for public facilities. For the developing regions<br />
that <strong>benefit</strong> the most, around 10 hours are gained per capita<br />
per year from meeting the <strong>water</strong> MDG when spread over<br />
the entire population, <strong>and</strong> 50 hours per capita from the<br />
WS&S MDG. Universal basic access to WS&S save around<br />
100 hours per capita per year, spread over the entire<br />
population. There is another big gain for all developing<br />
regions when moving from universal basic access to<br />
universal piped <strong>water</strong> <strong>supply</strong>, giving about 200 hours<br />
saved per capita per year. Figure 2 illustrates where the<br />
gains are distributed in developing world sub-regions, for<br />
the WS&S MDG, <strong>and</strong> shows that 70% <strong>of</strong> the global gains<br />
are in two sub-regions SEAR-D <strong>and</strong> WPR-B.<br />
Economic value <strong>of</strong> all <strong>benefit</strong>s together<br />
Figure 1 | Days <strong>of</strong> illness avoided due to meeting <strong>water</strong> <strong>and</strong> <strong>sanitation</strong> MDGs.<br />
The economic <strong>benefit</strong>s presented above are aggregated <strong>and</strong><br />
presented in Table 3 by WHO sub-region. The global value<br />
ranges from US$23 billion for the <strong>water</strong> MDG, to US$219<br />
billion for WS&S MDG, <strong>and</strong> upwards <strong>of</strong> US$400 billion for<br />
universal basic access. Figure 3 shows that WPR-B takes the<br />
largest share <strong>of</strong> total economic <strong>benefit</strong>s (36%), followed by
Table 3 | Convenience time savings <strong>and</strong> total economic <strong>benefit</strong>, by intervention <strong>and</strong> world sub-region<br />
Africa<br />
The Americas<br />
Eastern<br />
Mediterranean Europe<br />
South <strong>and</strong> South-East<br />
Asia<br />
Western Pacific<br />
Variable AFR-D AFR-E AMR-B AMR-D EMR-B EMR-D EUR-B EUR-C SEAR-B SEAR-D WPR-B<br />
Total population, 2015 (million) 487 481 531 93 184 189 238 223 473 1,689 1,488<br />
Convenience gains due to closer WS&S facilities (million hours per year)<br />
Water MDG 4,085 4,925 1,688 483 405 565 787 104 1,997 4,640 9,317<br />
WS&S MDG 23,121 26,101 12,735 3,131 2,624 4,211 4,220 1,520 12,089 102,508 98,678<br />
WS&S Universal basic 46,242 52,202 25,470 6,261 5,248 8,423 8,439 3,040 24,177 205,016 197,355<br />
Universal basic þ Disinfected 46,242 52,202 25,470 6,261 5,248 8,423 8,439 3,040 24,177 205,016 197,355<br />
Regulated piped WS þ sewer connection 107,853 106,603 57,345 14,042 25,061 30,593 24,544 12,916 105,983 292,445 201,231<br />
Total economic <strong>benefit</strong> (US$ million per year)<br />
Water MDG 983 1,314 4,211 405 489 395 771 80 1,047 1,359 4,276<br />
WS&S MDG 5,231 6,446 28,735 2,271 2,633 2,393 3,697 1,469 5,324 24,234 46,837<br />
WS&S Universal basic 9,935 12,302 56,835 4,405 5,203 4,652 7,357 2,937 10,512 48,243 93,405<br />
Universal basic þ Disinfected 12,560 15,531 65,658 5,287 7,495 6,359 8,299 3,357 12,329 54,104 98,461<br />
Regulated piped WS þ sewer connection 25,893 39,019 139,154 11,440 37,152 22,396 23,802 13,765 58,196 76,822 97,103<br />
492 Guy Hutton et al. | <strong>Global</strong> <strong>cost</strong>-<strong>benefit</strong> <strong>analysis</strong> <strong>of</strong> <strong>water</strong> <strong>supply</strong> <strong>and</strong> <strong>sanitation</strong> interventions Journal <strong>of</strong> Water <strong>and</strong> Health | 05.4 | 2007
493 Guy Hutton et al. | <strong>Global</strong> <strong>cost</strong>-<strong>benefit</strong> <strong>analysis</strong> <strong>of</strong> <strong>water</strong> <strong>supply</strong> <strong>and</strong> <strong>sanitation</strong> interventions Journal <strong>of</strong> Water <strong>and</strong> Health | 05.4 | 2007<br />
Figure 2 | Distribution (%) <strong>of</strong> convenience time savings from meeting the WS&S MDG<br />
target, by developing world sub-region.<br />
AMR-B (22%) <strong>and</strong> SEAR-D (19%). The African sub-regions<br />
together account for only 9% <strong>of</strong> the global economic <strong>benefit</strong><br />
due to the relative GNI per capita values, which were used<br />
to value convenience time savings, productivity impact <strong>of</strong><br />
improved health status <strong>and</strong> averted deaths. The relatively<br />
high share in AMR-B is due to the higher GNI per capita in<br />
that region (upward <strong>of</strong> US$4,000 per capita for the larger<br />
countries in the region such as Mexico <strong>and</strong> Brazil), <strong>and</strong><br />
large population size in AMR-B <strong>of</strong> 0.53 billion.<br />
The share <strong>of</strong> overall <strong>benefit</strong>s contributed by different<br />
categories <strong>of</strong> <strong>benefit</strong> is presented in Figure 4 for the WHO<br />
sub-region AFR-D, for the WS&S MDG. The results show<br />
that the value <strong>of</strong> time savings due to more convenient<br />
Figure 3 | Distribution (%) <strong>of</strong> global economic <strong>benefit</strong>s from meeting the WS&S MDG<br />
target, by developing world sub-region.<br />
Figure 4 | Distribution <strong>of</strong> economic <strong>benefit</strong>s for WS&S MDG target, by type <strong>of</strong> <strong>benefit</strong><br />
in AFR-D.<br />
services dominates the other <strong>benefit</strong>s, contributing 82% <strong>of</strong><br />
the overall economic <strong>benefit</strong>s, followed by value <strong>of</strong> averted<br />
deaths (9%), health sector <strong>cost</strong>s (4%) <strong>and</strong> value <strong>of</strong> morbidity<br />
giving more adult work days <strong>and</strong> children school days, <strong>and</strong><br />
less children , 5 sick days (5%).<br />
Intervention <strong>cost</strong>s<br />
Table 4 shows the estimated <strong>cost</strong>s <strong>of</strong> achieving the targets<br />
defined by the five interventions, by world sub-regions.<br />
Meeting the <strong>water</strong> MDG in developing regions has an<br />
annual <strong>cost</strong> <strong>of</strong> US$1.78 billion, while adding the <strong>sanitation</strong><br />
MDG leads to a significant <strong>cost</strong> increase at US$9.5 billion<br />
annually, giving a combined W&S MDG annual <strong>cost</strong> <strong>of</strong><br />
US$11.3 billion annually (figures reflect the year 2000).<br />
Universal access to W&S <strong>cost</strong>s twice the W&S MDG, at<br />
US$22.6 billion annually. Two reasons explain the significantly<br />
higher <strong>cost</strong> <strong>of</strong> <strong>sanitation</strong> compared to <strong>water</strong>: first, the<br />
higher annual per capita <strong>cost</strong> <strong>of</strong> improved <strong>sanitation</strong>, <strong>and</strong><br />
the lower current coverage compared to MDG targets. Two<br />
sub-regions – SEAR-D <strong>and</strong> WPR-B - dominate the global<br />
<strong>cost</strong>s <strong>of</strong> reaching the combined <strong>water</strong> <strong>and</strong> <strong>sanitation</strong> MDGs,<br />
with 64% <strong>of</strong> the <strong>cost</strong>s between them.<br />
By adding point <strong>of</strong> use <strong>water</strong> treatment, an additional<br />
US$4.2 billion is added annually, giving a total developing<br />
country <strong>cost</strong> <strong>of</strong> US$26.8 billion. This represents a relatively<br />
small addition to the annual <strong>cost</strong>s given the associated<br />
health <strong>and</strong> economic <strong>benefit</strong>s. However, piped regulated<br />
<strong>water</strong> <strong>supply</strong> <strong>and</strong> sewer connection, which involve a<br />
massive investment in hardware as well as running <strong>cost</strong>s,<br />
<strong>cost</strong>s US$136 billion annually in developing countries,
Table 4 | Annual intervention <strong>cost</strong>s <strong>and</strong> overall <strong>benefit</strong>-<strong>cost</strong> ratios, by intervention <strong>and</strong> world sub-region<br />
Africa<br />
The Americas<br />
Eastern<br />
Mediterranean Europe<br />
South <strong>and</strong> South-East<br />
Asia<br />
Western Pacific<br />
Variable AFR-D AFR-E AMR-B AMR-D EMR-B EMR-D EUR-B EUR-C SEAR-B SEAR-D WPR-B1<br />
Total population, 2015 (million) 487 481 531 93 184 189 238 223 473 1,689 1,488<br />
Annual <strong>cost</strong> to meet targets until 2015 (million US$)<br />
Water MDG 222 268 133 38 24 33 52 8 121 282 566<br />
WS&S MDG 947 1,074 631 157 100 163 186 71 466 3,628 3,621<br />
WS&S Universal basic 1,894 2,149 1,262 315 201 325 373 143 933 7,257 7,243<br />
Universal basic þ Disinfected 2,216 2,466 1,613 376 322 450 530 290 1,245 8,371 8,347<br />
Regulated piped WS þ sewer connection 12,528 12,201 11,765 2,320 3,275 4,054 4,602 4,206 12,164 35,074 32,767<br />
Benefit-Cost Ratio (US$ economic return on US$1 expenditure)<br />
Water MDG 4.4 4.9 31.6 10.6 20.1 12.1 14.7 10.4 8.6 4.8 7.6<br />
WS&S MDG 5.5 6.0 45.5 14.4 26.3 14.7 19.8 20.6 11.4 6.7 12.9<br />
WS&S Universal basic 5.2 5.7 45.0 14.0 25.9 14.3 19.7 20.6 11.3 6.6 12.9<br />
Universal basic þ Disinfected 5.7 6.3 40.7 14.1 23.3 14.1 15.7 11.6 9.9 6.5 11.8<br />
Regulated piped WS þ sewer connection 2.1 3.2 11.8 4.9 11.3 5.5 5.2 3.3 4.8 2.2 3.0<br />
494 Guy Hutton et al. | <strong>Global</strong> <strong>cost</strong>-<strong>benefit</strong> <strong>analysis</strong> <strong>of</strong> <strong>water</strong> <strong>supply</strong> <strong>and</strong> <strong>sanitation</strong> interventions Journal <strong>of</strong> Water <strong>and</strong> Health | 05.4 | 2007
495 Guy Hutton et al. | <strong>Global</strong> <strong>cost</strong>-<strong>benefit</strong> <strong>analysis</strong> <strong>of</strong> <strong>water</strong> <strong>supply</strong> <strong>and</strong> <strong>sanitation</strong> interventions Journal <strong>of</strong> Water <strong>and</strong> Health | 05.4 | 2007<br />
which represents an almost 5-fold <strong>cost</strong> increase from the<br />
lower technology interventions.<br />
Spread over the entire population <strong>of</strong> the developing<br />
world, the annual per capita <strong>cost</strong> is relatively insignificant,<br />
even in resource constrained settings. In meeting the <strong>water</strong><br />
MDG, an annual <strong>cost</strong> US$0.3 per capita would need to be<br />
invested, rising to US$1.86 for the W&S MDG, US$3.7 for<br />
universal basic access, <strong>and</strong> US$4.40 for universal basic<br />
access <strong>and</strong> point-<strong>of</strong>-use treatment. The per capita <strong>cost</strong><br />
varies between regions, with the highest per capita <strong>cost</strong>s in<br />
the African sub-regions (. US$0.56) for the <strong>water</strong> MDG,<br />
<strong>and</strong> for the combined W&S MDG the annual <strong>cost</strong> rises to<br />
over US$2 per capita in Africa, SEAR-D <strong>and</strong> WPR-B.<br />
Cost-<strong>benefit</strong> ratios<br />
Table 4 shows the <strong>benefit</strong>-<strong>cost</strong> ratios for developing country<br />
WHO sub-regions, taking into account all the <strong>cost</strong>s <strong>and</strong><br />
<strong>benefit</strong>s quantified in the <strong>analysis</strong>. The most important<br />
finding is that in all regions <strong>and</strong> for all five interventions, the<br />
<strong>benefit</strong>-<strong>cost</strong> ratio (BCR) is significantly greater than 1,<br />
recording values in developing regions <strong>of</strong> between 4 <strong>and</strong> 32<br />
for the <strong>water</strong> MDG, between 5 <strong>and</strong> 46 for the WS&S MDG<br />
<strong>and</strong> universal basic access, <strong>and</strong> between 5 <strong>and</strong> 41 for<br />
universal basic access with <strong>water</strong> disinfection at the point <strong>of</strong><br />
use. The <strong>benefit</strong>-<strong>cost</strong> ratio for regulated piped <strong>water</strong> <strong>supply</strong><br />
<strong>and</strong> sewer connection is considerably lower than the basic<br />
improvements, ranging between 2 <strong>and</strong> 12. This is explained<br />
by the fact that the intervention <strong>cost</strong>s are considerably<br />
higher, while the increase in economic <strong>benefit</strong>s such as<br />
health <strong>benefit</strong>s <strong>and</strong> time savings are more marginal.<br />
In AFR-D <strong>and</strong> AFR-E the <strong>benefit</strong>-<strong>cost</strong> ratio for the basic<br />
interventions ranges between 4.4 <strong>and</strong> 6.3; in WPR-B1 <strong>and</strong><br />
SEAR-D the <strong>cost</strong>-<strong>benefit</strong> ratios are slightly higher at<br />
between 4.8 <strong>and</strong> 12.9; <strong>and</strong> in AMR-D the <strong>benefit</strong>-<strong>cost</strong> ratios<br />
range between 10.6 <strong>and</strong> 14.4. The <strong>cost</strong>-<strong>benefit</strong> ratio tends to<br />
be higher in the more developed regions, mainly for the<br />
reason that the <strong>cost</strong> estimates may be underestimated for<br />
these regions <strong>and</strong> the value <strong>of</strong> time is considerably higher<br />
than in less developed regions. Hence, in the more<br />
developed regions such as EUR-B <strong>and</strong> AMR-B, the true<br />
<strong>benefit</strong>-<strong>cost</strong> ratios are likely to be lower than those reported.<br />
Sensitivity <strong>analysis</strong><br />
Although the base case results suggest all the interventions<br />
modelled to be <strong>cost</strong>-beneficial, even highly <strong>cost</strong>-beneficial, it<br />
is important to underst<strong>and</strong> how these results might change<br />
under different assumptions or input data values. Figures 5<br />
to 8 show the <strong>benefit</strong>-<strong>cost</strong> ratios under low <strong>and</strong> high<br />
assumptions for four key model variables separately, which<br />
were thought to play a determining role in the results:<br />
Figure 5 | Benefit-<strong>cost</strong> ratios under low <strong>and</strong> high convenience time gain assumptions, AFR-D.
496 Guy Hutton et al. | <strong>Global</strong> <strong>cost</strong>-<strong>benefit</strong> <strong>analysis</strong> <strong>of</strong> <strong>water</strong> <strong>supply</strong> <strong>and</strong> <strong>sanitation</strong> interventions Journal <strong>of</strong> Water <strong>and</strong> Health | 05.4 | 2007<br />
Figure 6 | Benefit-<strong>cost</strong> ratios under low <strong>and</strong> high time value assumptions, AFR-D.<br />
convenience time gain assumptions; value <strong>of</strong> time assumptions;<br />
diarrhoeal disease incidence assumptions; <strong>and</strong><br />
intervention <strong>cost</strong> assumptions. The Figs. show the <strong>benefit</strong><strong>cost</strong><br />
ratios to be highly sensitive to the input values in three<br />
<strong>of</strong> the four sensitivity analyses. The greatest impact is when<br />
a high intervention <strong>cost</strong> assumption is used, <strong>and</strong> also the<br />
alternative time gain <strong>and</strong> time value assumptions have<br />
considerable impact on the <strong>benefit</strong>-<strong>cost</strong> ratio. However, in<br />
none <strong>of</strong> the four one-way sensitivity analyses did the<br />
<strong>benefit</strong>-<strong>cost</strong> ratio become less than 1.0, which would have<br />
lead to a change in overall study conclusion. On the other<br />
h<strong>and</strong>, when two-way or multi-way sensitivity analyses are<br />
performed using pessimistic assumptions, thus combining<br />
different types <strong>of</strong> uncertainty, the <strong>benefit</strong>-<strong>cost</strong> ratio becomes<br />
less than 1.0. However, such an extreme <strong>analysis</strong> was not<br />
considered appropriate, as it would lead to a negative<br />
study conclusion that is not perhaps warranted by the actual<br />
level <strong>of</strong> uncertainty in the model variables. Furthermore,<br />
the sensitivity <strong>analysis</strong> was incomplete, in the sense that<br />
some types <strong>of</strong> uncertainty relating to variable inclusion<br />
could not be tested due to lack <strong>of</strong> data or complexity <strong>of</strong><br />
<strong>analysis</strong>. For example if some <strong>of</strong> the potential economic<br />
<strong>benefit</strong>s relating to home production or agricultural activities<br />
had been included for contexts where such <strong>benefit</strong>s are<br />
Figure 7 | Benefit-<strong>cost</strong> ratios under low <strong>and</strong> high diarrhoeal baseline incidence assumptions, AFR-D.
497 Guy Hutton et al. | <strong>Global</strong> <strong>cost</strong>-<strong>benefit</strong> <strong>analysis</strong> <strong>of</strong> <strong>water</strong> <strong>supply</strong> <strong>and</strong> <strong>sanitation</strong> interventions Journal <strong>of</strong> Water <strong>and</strong> Health | 05.4 | 2007<br />
Figure 8 | Benefit-<strong>cost</strong> ratios under low <strong>and</strong> high intervention <strong>cost</strong> assumptions, AFR-D.<br />
relevant, the <strong>benefit</strong>-<strong>cost</strong> ratios could have been considerably<br />
higher.<br />
DISCUSSION<br />
Interpretation <strong>of</strong> main findings<br />
In interpreting the impressive <strong>cost</strong>-<strong>benefit</strong> ratios presented<br />
in this study, an important caveat needs to be noted. The<br />
caveat relates to the fact that the study presented is a social<br />
<strong>and</strong> not a financial <strong>cost</strong>-<strong>benefit</strong> <strong>analysis</strong>. The measure <strong>of</strong><br />
economic <strong>benefit</strong> is social welfare in the broadest sense, <strong>and</strong><br />
focuses on a hypothetical although real set <strong>of</strong> <strong>benefit</strong>s, as<br />
opposed to tangible <strong>and</strong> financially measurable <strong>benefit</strong>s.<br />
A distinction is useful between the <strong>cost</strong>s <strong>and</strong> <strong>benefit</strong>s part <strong>of</strong><br />
the equation: the majority <strong>of</strong> <strong>cost</strong>s reflect financial <strong>cost</strong>s,<br />
although some non-financial <strong>cost</strong>s are included such as<br />
community time input. On the other h<strong>and</strong>, the <strong>benefit</strong>s<br />
reflect a range <strong>of</strong> expected financial as well as economic<br />
savings to the intervention beneficiaries, covering reduced<br />
<strong>cost</strong>s to the health service <strong>and</strong> patient in seeking health<br />
care, the value <strong>of</strong> the beneficiaries being able to continue<br />
their daily activities unimpeded, the economic value <strong>of</strong> less<br />
mortality, <strong>and</strong> the expected developmental <strong>benefit</strong>s related<br />
to less time being devoted to <strong>water</strong> haulage <strong>and</strong> time spent<br />
accessing toilets.<br />
Furthermore, valuation <strong>of</strong> welfare effects in monetary<br />
terms brings with it problems <strong>and</strong> can lead to inappropriate<br />
interpretation <strong>of</strong> the results, due to lack <strong>of</strong> agreement on<br />
appropriate valuation methodologies <strong>and</strong> due to lack <strong>of</strong><br />
evidence to support the underlying values some variables<br />
are assigned in the model. The potential impact on the<br />
results <strong>of</strong> some <strong>of</strong> these uncertainties has been examined in<br />
one-way sensitivity <strong>analysis</strong>; however, the fuller examination<br />
<strong>of</strong> all the uncertainties present in the model is a much<br />
greater task. For example, the value <strong>of</strong> time has many<br />
aspects which cannot be captured in a single alternative<br />
value (such as 30% <strong>of</strong> GNI per capita instead <strong>of</strong> 100%).<br />
There are such large differences, as shown in the literature,<br />
in how different individuals <strong>and</strong> sections <strong>of</strong> the population<br />
value their time (e.g. the presence <strong>of</strong> unemployment,<br />
underemployment or seasonal labour, which all affect an<br />
individual’s perspective on the value <strong>of</strong> their time), that a<br />
single global value clearly does not capture reality.<br />
A further aspect to consider in using the results <strong>of</strong> this<br />
study for policy decisions is the omission <strong>of</strong> variables in the<br />
<strong>analysis</strong>. At such a high level <strong>of</strong> aggregation – the WHO<br />
sub-regional level – the choice over the variables to be<br />
included needed to remain simple. A more comprehensive<br />
<strong>cost</strong>-<strong>benefit</strong> <strong>analysis</strong> would have included: the health<br />
impacts <strong>of</strong> improved WS&S other than diarrhoeal disease<br />
such as trachoma <strong>and</strong> vectors; the saved <strong>cost</strong>s <strong>of</strong> switching
498 Guy Hutton et al. | <strong>Global</strong> <strong>cost</strong>-<strong>benefit</strong> <strong>analysis</strong> <strong>of</strong> <strong>water</strong> <strong>supply</strong> <strong>and</strong> <strong>sanitation</strong> interventions Journal <strong>of</strong> Water <strong>and</strong> Health | 05.4 | 2007<br />
away from other more expensive <strong>water</strong> sources such as<br />
tanker trucks or vendor-supplied <strong>water</strong>; economic <strong>benefit</strong>s<br />
related to options for labour-saving devices <strong>and</strong> increased<br />
<strong>water</strong> access leading to home production possibilities<br />
<strong>and</strong> labour-saving devices; impact <strong>of</strong> <strong>water</strong> <strong>and</strong> <strong>sanitation</strong><br />
projects on agricultural productivity (irrigation, fertiliser);<br />
leisure activities; aesthetics; <strong>and</strong> non-use values associated<br />
with <strong>water</strong> <strong>supply</strong> <strong>and</strong> <strong>sanitation</strong> improvements. Non-use<br />
<strong>benefit</strong>s are divided into option value (the possibility that<br />
the person may want to use it in the future), existence value<br />
(the person values the fact that the environmental good<br />
exists, irrespective <strong>of</strong> use), <strong>and</strong> bequest value (the person<br />
wants future generations to enjoy it) (Hanley & Spash 1993;<br />
Georgiou et al. 1996; Field 1997). These various <strong>benefit</strong>s<br />
were excluded for reasons <strong>of</strong> lack <strong>of</strong> data on impact <strong>and</strong><br />
difficulties in making assumptions, difficulties in valuation,<br />
or because their <strong>benefit</strong> was expected to be small compared<br />
with other <strong>benefit</strong>s included.<br />
Financing considerations<br />
While <strong>cost</strong>-<strong>benefit</strong> <strong>analysis</strong> can be carried out to identify<br />
clearly all the beneficiaries <strong>and</strong> the (potential) financers <strong>of</strong><br />
development projects, the <strong>analysis</strong> does not provide<br />
answers to the question <strong>of</strong> who should pay or where the<br />
funding will come from. This represents a particular<br />
challenge to economic evaluation when health care interventions<br />
have non-health sector <strong>cost</strong>s <strong>and</strong> <strong>benefit</strong>s, as the<br />
objective <strong>of</strong> the health ministry – “to maximise health with<br />
a given budget” – may come into conflict with other<br />
societal objectives, including the maximisation <strong>of</strong> nonhealth<br />
related welfare. If all <strong>cost</strong>s <strong>and</strong> <strong>benefit</strong>s are included<br />
in a <strong>cost</strong>-<strong>benefit</strong> <strong>analysis</strong>, then a full <strong>analysis</strong> can be made <strong>of</strong><br />
financing options.<br />
One <strong>of</strong> the problems associated with identifying<br />
beneficiaries in order to identify those willing to pay for<br />
the <strong>cost</strong>s is that the main beneficiaries (patients, <strong>and</strong> the<br />
population more generally) do not always underst<strong>and</strong> the<br />
full <strong>benefit</strong>s until after the investment has taken place. For<br />
example, if a household does not underst<strong>and</strong> fully the links<br />
between <strong>water</strong> quality <strong>and</strong> health or between <strong>water</strong> source<br />
<strong>and</strong> household time expenditure, then improvement in<br />
<strong>water</strong> access <strong>and</strong> quality are unlikely to be undertaken for<br />
health or economic reasons. This is where the technique <strong>of</strong><br />
information sharing (Information, Education <strong>and</strong> Communication<br />
(IEC) or Behaviour Change Communication<br />
(BCC)) is crucial to influence the potential beneficiaries to<br />
be an agent for change, one aspect <strong>of</strong> which is to be willing<br />
to make a financial or an in-kind contribution (eg labour,<br />
materials). However, a constraint faced by households is<br />
that a large share <strong>of</strong> annual intervention <strong>cost</strong>s are incurred<br />
in the first year <strong>of</strong> the intervention (investment <strong>cost</strong>), while<br />
economic <strong>benefit</strong>s accrue over a longer time period. This<br />
raises the question about who is prepared to finance such<br />
an investment with <strong>benefit</strong>s that are hard to know in<br />
advance <strong>and</strong> that are long-term in nature. Furthermore,<br />
the availability <strong>of</strong> credit, especially in rural settings, is not<br />
easily available to make up the temporary gap in finances.<br />
These factors together lead to a type <strong>of</strong> ‘market failure’,<br />
where potential consumers <strong>of</strong> improved <strong>water</strong> <strong>and</strong> <strong>sanitation</strong><br />
facilities are not fully informed about the <strong>benefit</strong>s <strong>of</strong><br />
such a product, <strong>and</strong> where financing sources for such an<br />
investment are in short <strong>supply</strong>. The end result <strong>of</strong> this<br />
market failure is that private consumers have extremely<br />
limited options for financing the initial investment requirements<br />
<strong>of</strong> <strong>water</strong> <strong>supply</strong> <strong>and</strong> <strong>sanitation</strong> improvements<br />
up-front.<br />
There is one group <strong>of</strong> potential beneficiaries where the<br />
financing constraint is easier to overcome. Many households<br />
incur <strong>cost</strong>s for their existing <strong>supply</strong> <strong>of</strong> <strong>water</strong>, for<br />
example those who purchase their <strong>water</strong> (e.g. bottled <strong>water</strong><br />
or from a local <strong>water</strong> vendor or delivered by tanker truck)<br />
or those who treat their <strong>water</strong> by boiling or filtering it. In<br />
their case, when an alternative low-<strong>cost</strong> WS&S intervention<br />
is delivered, the <strong>cost</strong> saving from switching away from more<br />
expensive <strong>water</strong> options may lead to a net financial gain. In<br />
such cases, households need to be made aware <strong>of</strong> the<br />
opportunities for alternative low-<strong>cost</strong> WS&S interventions<br />
which will lead to a net welfare gain, including a potential<br />
financial saving.<br />
In terms <strong>of</strong> whether the health sector would be<br />
interested in financing the interventions, in most regions<br />
<strong>and</strong> for most interventions the health sector is unlikely to be<br />
interested or capable to pay a significant contribution to the<br />
overall <strong>cost</strong>s. This is because hardware interventions for<br />
WS&S are outside the core activity <strong>of</strong> a health ministry, but<br />
also because the real savings to the health sector are<br />
negligible in comparison to the annual intervention <strong>cost</strong>s, as
499 Guy Hutton et al. | <strong>Global</strong> <strong>cost</strong>-<strong>benefit</strong> <strong>analysis</strong> <strong>of</strong> <strong>water</strong> <strong>supply</strong> <strong>and</strong> <strong>sanitation</strong> interventions Journal <strong>of</strong> Water <strong>and</strong> Health | 05.4 | 2007<br />
shown in this <strong>analysis</strong>. Benefits <strong>of</strong> improving access to safe<br />
<strong>water</strong> <strong>and</strong> <strong>sanitation</strong> accrue mainly to households <strong>and</strong><br />
individuals. Compared to the potential <strong>cost</strong> savings<br />
reported in this study, it is unlikely that the health sector<br />
will ever be able to recover these <strong>cost</strong>s, as only a small<br />
proportion are marginal <strong>cost</strong>s directly related to the<br />
treatment <strong>cost</strong> <strong>of</strong> the health episode. In fact, as most health<br />
care <strong>cost</strong>s such as personnel <strong>and</strong> infrastructure are fixed<br />
<strong>cost</strong>s which do not change with patient throughput in the<br />
short-term, the real <strong>cost</strong> saving is probably insignificant. On<br />
the other h<strong>and</strong>, when considered from the social welfare<br />
angle, the reduced burden to the health system due to less<br />
patients presenting with diarrhoea will free up capacity in<br />
the health system to treat other patients. Furthermore, the<br />
health system can play a role in leveraging resources <strong>and</strong><br />
funds from other sectors or from financing agents, to fill<br />
financing gaps.<br />
The implication <strong>of</strong> these arguments is that there should<br />
exist a variety <strong>of</strong> financing sources for meeting the <strong>cost</strong>s <strong>of</strong><br />
<strong>water</strong> <strong>supply</strong> <strong>and</strong> <strong>sanitation</strong> improvements, depending on the<br />
income <strong>and</strong> asset base <strong>of</strong> the target populations, the<br />
availability <strong>of</strong> credit, the economic <strong>benefit</strong>s perceived by the<br />
various stakeholders, the budget freedom <strong>of</strong> government<br />
ministries, <strong>and</strong> the availability <strong>of</strong> non-governmental organisations<br />
to promote <strong>and</strong> finance <strong>water</strong> <strong>and</strong> <strong>sanitation</strong><br />
improvements. However, it is clear that the meagre budget<br />
<strong>of</strong> the health sector is insufficient to finance <strong>water</strong> <strong>supply</strong> <strong>and</strong><br />
<strong>sanitation</strong> improvements. On the other h<strong>and</strong>, it can play a key<br />
role in providing the ‘s<strong>of</strong>tware’ (education for behaviour<br />
change) alongside ‘hardware’ interventions, involving the<br />
close technical cooperation <strong>of</strong> the health sector.<br />
CONCLUSIONS<br />
This study has shown that there is a strong economic case for<br />
investing in improved <strong>water</strong> <strong>supply</strong> <strong>and</strong> <strong>sanitation</strong> services,<br />
when the expected <strong>cost</strong> per capita <strong>of</strong> different combinations <strong>of</strong><br />
<strong>water</strong> <strong>supply</strong> <strong>and</strong> <strong>sanitation</strong> improvement are compared with<br />
the expected economic <strong>benefit</strong>s per capita. Under base case<br />
assumptions the <strong>cost</strong>-<strong>benefit</strong> ratio is at least US$5 in economic<br />
<strong>benefit</strong> per US$1 invested, <strong>and</strong> even under pessimistic data<br />
assumptions in the one-way sensitivity <strong>analysis</strong>, the <strong>benefit</strong>s<br />
per dollar invested remained above the threshold <strong>of</strong> US$1 in<br />
most sub-regions. When potential <strong>benefit</strong>s that were omitted<br />
from the <strong>analysis</strong> are included, the economic case for<br />
investment in <strong>water</strong> <strong>supply</strong> <strong>and</strong> <strong>sanitation</strong> interventions<br />
becomes stronger, depending on the context. The annual<br />
<strong>cost</strong> <strong>of</strong> increasing access to basic improved <strong>water</strong> <strong>supply</strong> <strong>and</strong><br />
<strong>sanitation</strong> to all is under US$10 per person reached in all<br />
developing regions.<br />
While these findings make a strong case for investment<br />
in <strong>water</strong> <strong>supply</strong> <strong>and</strong> <strong>sanitation</strong> improvement, it should be<br />
recognised that many <strong>of</strong> the <strong>benefit</strong>s included in this<br />
<strong>analysis</strong> may not give actual financial <strong>benefit</strong>s. For the<br />
time gains calculated or the number <strong>of</strong> saved lives, these do<br />
not necessarily lead to more income-generation activities.<br />
Also, for the averted <strong>cost</strong>s <strong>of</strong> health care for diarrhoea cases,<br />
these savings to the health sector <strong>and</strong> the patient may not be<br />
realised as the greatest proportion <strong>of</strong> health care <strong>cost</strong>s are<br />
usually fixed <strong>cost</strong>s. On the other h<strong>and</strong>, it is clear that<br />
populations do appreciate time savings, such as the <strong>benefit</strong>s<br />
<strong>of</strong> more time spent at school for children, less effort in <strong>water</strong><br />
collection (especially women <strong>and</strong> children), less journey<br />
time for finding places to defecate, or more leisure time. In<br />
the recognition that these non-health <strong>and</strong> non-financial<br />
<strong>benefit</strong>s are important to take into account in a study on<br />
social welfare, this <strong>analysis</strong> has shown that these <strong>benefit</strong>s<br />
are potentially considerable <strong>and</strong> provide a strong argument<br />
for investment in improved <strong>water</strong> <strong>supply</strong> <strong>and</strong> <strong>sanitation</strong>.<br />
Further country case-studies are recommended as a follow<br />
up to this global <strong>analysis</strong>.<br />
ACKNOWLEDGEMENTS<br />
The authors would like to thank Tessa Tan-Torres <strong>and</strong><br />
David Evans <strong>of</strong> the Evidence <strong>and</strong> Information for Policy<br />
cluster (EIP), World Health Organization, for their comments<br />
on an earlier version <strong>of</strong> this paper. Also Annette<br />
Prüss-Üstun <strong>of</strong> the Department for the Protection <strong>of</strong> the<br />
Human Environment (PHE), World Health Organization,<br />
provided valuable input to this paper.<br />
DISCLAIMER<br />
J. Bartram is a staff member <strong>of</strong> the World Health<br />
Organization. He <strong>and</strong> the other authors alone are respon-
500 Guy Hutton et al. | <strong>Global</strong> <strong>cost</strong>-<strong>benefit</strong> <strong>analysis</strong> <strong>of</strong> <strong>water</strong> <strong>supply</strong> <strong>and</strong> <strong>sanitation</strong> interventions Journal <strong>of</strong> Water <strong>and</strong> Health | 05.4 | 2007<br />
sible <strong>of</strong> the views expressed in this publication <strong>and</strong> such<br />
views do not necessarily represent the decisions, policy or<br />
views <strong>of</strong> the World Health Organization.<br />
REFERENCES<br />
Barnes, D. & Sen, M. 2003 The impact <strong>of</strong> energy on women’s lives<br />
in rural India. IBRD/World Bank, Washington D.C., Available<br />
online at: http://www.esmap.org/filez/pubs/FinalIndiaforWeb.<br />
pdf.<br />
Biran, A. J. & Mace, R. 2004 Families <strong>and</strong> firewood: a comparative<br />
<strong>analysis</strong> <strong>of</strong> the <strong>cost</strong>s <strong>and</strong> <strong>benefit</strong>s <strong>of</strong> children in firewood<br />
collection <strong>and</strong> use in two rural communities in Sub-Saharan<br />
Africa. Human Ecology 32(1), 1–25, Available online at:<br />
http://www.springerlink.com/content/nj34p7x47n726r17/.<br />
Cairncross, S. & Valdmanis, V. 2006 Water <strong>supply</strong>, <strong>sanitation</strong> <strong>and</strong><br />
hygiene promotion. In Disease Control Priorities in Developing<br />
Countries, 2nd edition. (ed. D. Jamison, J. Breman, A. R.<br />
Measham, G. Alleyne, M. Claeson, D. B. Evans, P. Jha, A. Mills &<br />
P. Musgrove). Oxford University Press, New York, USA.<br />
Clasen, T. 2006 Household Water Treatment for the Prevention <strong>of</strong><br />
Diarrhoeal Disease. PhD Thesis. University <strong>of</strong> London,<br />
London School <strong>of</strong> Hygiene & Tropical Medicine.<br />
Clasen, T., Roberts, I., Rabie, T., Schmidt, W. & Cairncross, S. 2006<br />
Interventions to improve <strong>water</strong> quality for preventing<br />
diarrhoea. In The Cochrane Library. Update S<strong>of</strong>tware, Oxford,<br />
Issue 3.<br />
Curry, S. & Weiss, J. 1993 Project <strong>analysis</strong> in developing countries.<br />
MacMillan Press.<br />
Drummond, M. F., O’Brien, B., Stoddart, G. L. & Torrance, G. W.<br />
1997 Methods for the Economic Evaluation <strong>of</strong> Health Care<br />
Programmes. Oxford University Press, UK.<br />
Dutta, S. 2005 Energy as a key variable in eradicating extreme<br />
poverty <strong>and</strong> hunger: A gender <strong>and</strong> energy perspective on<br />
empirical evidence on MDG #1, DFID/ENERGIA project on<br />
Gender as a Key Variable in Energy Interventions. Draft<br />
version, September 2005.<br />
Feachem, R., Burns, E., Cairncross, S., Cronin, A., Cross, P. &<br />
Curtis, D. 1978 Water, health <strong>and</strong> development: an<br />
interdisciplinary evaluation. Tri-Med Books, London, UK.<br />
Fewtrell, L., Kaufmann, R., Kay, D., Enanoria, W., Haller, L. &<br />
Colford, J. M. Jr 2005 Water, <strong>sanitation</strong>, <strong>and</strong> hygiene<br />
interventions to reduce diarrhoea in less developed countries:<br />
a systematic review <strong>and</strong> meta-<strong>analysis</strong>. Lancet Infectious<br />
Diseases 5(1), 42–52.<br />
Field, B. C. 1997 Environmental Economics. McGraw-Hill, New York.<br />
Georgiou, S., Langford, I., Bateman, I. & Turner, R. K. 1996<br />
Determinants <strong>of</strong> individuals’ willingness to pay for reduction<br />
in environmental health risks: A case study <strong>of</strong> bathing <strong>water</strong><br />
quality. CSERGE Working Paper GEC 96–14.<br />
Gold, M. R., Siegel, J. E., Russell, L. B. & Weinstein, M. C. 1996<br />
Cost-effectiveness in Health <strong>and</strong> Medicine. Oxford University<br />
Press, UK.<br />
Haller, L., Hutton, G. & Bartram, J. 2007 Estimating the <strong>cost</strong>s <strong>and</strong><br />
health <strong>benefit</strong>s <strong>of</strong> <strong>water</strong> <strong>and</strong> <strong>sanitation</strong> improvements at global<br />
level. Journal <strong>of</strong> Water <strong>and</strong> Health 5(4),467–480.<br />
Hanley, N. & Spash, C. L. 1993 Cost-<strong>benefit</strong> Analysis <strong>and</strong> the<br />
Environment. Edward Elgar, Cheltenham, UK.<br />
Hutton, G. 2000 Considerations in evaluating the <strong>cost</strong>-effectiveness<br />
<strong>of</strong> environmental health interventions, Sustainable<br />
Development <strong>and</strong> Healthy Environments Cluster, World<br />
Health Organization. WHO/SDE/WSH/0010.<br />
Hutton, G. 2001 Economic evaluation <strong>and</strong> priority setting in <strong>water</strong><br />
<strong>and</strong> <strong>sanitation</strong> interventions. In Water Quality: Guidelines,<br />
St<strong>and</strong>ards <strong>and</strong> Health. Risk assessment <strong>and</strong> management for<br />
<strong>water</strong>-related infectious disease (ed. L. Fewtrell & J. Bartram)<br />
IWA Publishing, London.<br />
Hutton, G. & Haller, L. 2004, Evaluation <strong>of</strong> the non-health <strong>cost</strong>s<br />
<strong>and</strong> <strong>benefit</strong>s <strong>of</strong> <strong>water</strong> <strong>and</strong> <strong>sanitation</strong> improvements at global<br />
level, Report undertaken for the Evidence <strong>and</strong> Information for<br />
Policy Department, in collaboration with the Department for<br />
Protection <strong>of</strong> the Human Environment, World Health<br />
Organisation. WHO/SDE/WSH/0404.<br />
Kumar, S. & Hotchkiss, D. 1988 Consequences <strong>of</strong> deforestation for<br />
women’s time allocation, agricultural production, <strong>and</strong><br />
nutrition in hill areas <strong>of</strong> Nepal. International Food Policy<br />
Research Institute, Washington, D.C.<br />
Layard, R. & Glaister, S. 1994 Recent developments in <strong>cost</strong>-<strong>benefit</strong><br />
<strong>analysis</strong>. Cambridge University Press, UK.<br />
Lopez-Alarcon, M., Villalp<strong>and</strong>o, S. & Fajardo, A. 1997 Breastfeeding<br />
lowers the frequency <strong>and</strong> duration <strong>of</strong> acute respiratory<br />
infection <strong>and</strong> diarrhoea in infants under six months <strong>of</strong> age.<br />
Journal <strong>of</strong> Nutrition 127, 436–443.<br />
Malmburg-Calvo, C. 1994 Case study on the role <strong>of</strong> women in rural<br />
transport; access <strong>of</strong> women to domestic facilities, World Bank:<br />
Sub-Saharan Africa Transport Policy Program, Working Paper<br />
No. 11.<br />
Mertens, T., Fern<strong>and</strong>o, M., Marshall, T. F., Kirkwood, B. R.,<br />
Cairncross, S. & Radalowicz, A. 1990 Determinants <strong>of</strong> <strong>water</strong><br />
quality, availability <strong>and</strong> use in Kurunegala, Sri Lanka. Tropical<br />
Medicine <strong>and</strong> Parasitology 41(1), 89–97.<br />
Mukherjee, N. 1990 People, <strong>water</strong> <strong>and</strong> <strong>sanitation</strong>: what do they<br />
know, believe <strong>and</strong> do in rural India. National Drinking Water<br />
Mission, Government <strong>of</strong> India, New Delhi<br />
Mulligan, J., Fox-Rushby, J., Adam, T., Johns, B. & Mills, A. 2005<br />
Unit <strong>cost</strong>s <strong>of</strong> health care inputs in low <strong>and</strong> middle income<br />
regions, DCCP Working Paper No. 9. September 2003, revised<br />
June 2005.<br />
Murray, C. & Lopez, A. 2000 The <strong>Global</strong> Burden <strong>of</strong> Disease. World<br />
Health Organization, Harvard University.<br />
Nathan, D. 1997 Woodfuel interventions with a gender base. Wood<br />
Energy News 12(1), 19.<br />
North, J. & Griffin, C. 1993 Water source as a housing<br />
characteristic: Hedonic property valuation <strong>and</strong> willingness to<br />
pay for <strong>water</strong>. Water Resources Research 29(7), 1923–1929.<br />
Organisation for Economic Cooperation <strong>and</strong> Development 2006<br />
Economic valuation <strong>of</strong> environmental health risks to children.<br />
OECD, Paris.
501 Guy Hutton et al. | <strong>Global</strong> <strong>cost</strong>-<strong>benefit</strong> <strong>analysis</strong> <strong>of</strong> <strong>water</strong> <strong>supply</strong> <strong>and</strong> <strong>sanitation</strong> interventions Journal <strong>of</strong> Water <strong>and</strong> Health | 05.4 | 2007<br />
Prüss, A., Kay, D., Fewtrell, L. & Bartram, J. 2002 Estimating the<br />
global burden <strong>of</strong> disease from <strong>water</strong>, <strong>sanitation</strong>, <strong>and</strong> hygiene at<br />
the global level. Environmental Health Perspectives 110(5),<br />
537–542.<br />
Saksena, S., Prasad, R. & Joshi, V. 1995 Time allocation <strong>and</strong> fuel<br />
usage in three villages <strong>of</strong> the Gharwal Himalaya, India.<br />
Mountain Research <strong>and</strong> Development 15(1), 57–67.<br />
Senhadji, A. 2000 Sources <strong>of</strong> economic growth:an extensive<br />
accounting exercise, IMF institute. IMF staff papers 47,<br />
129–158.<br />
Suarez, R. & Bradford, B. 1993 The economic impact <strong>of</strong> the cholera<br />
epidemic in Peru: an application <strong>of</strong> the <strong>cost</strong>-if-illness<br />
methodology. Water <strong>and</strong> Sanitation for Health Project; WASH<br />
Field Report No. 415.<br />
Sugden, R. & Williams, A. 1978 Principles <strong>of</strong> Practical Cost-Benefit<br />
Analysis. Oxford University Press, UK.<br />
Tan-Torres Edejer, T., Baltussen, R., Adam, T., Hutubessy, R.,<br />
Acharya, A., Evans, D. B., Murray, C. J. L., Thompson, J.,<br />
Porras, I., Tumwine, J. K., Mujwahuzi, M. R., Katui-Katua, M.<br />
& Johnstone, N. 2003 Making Choices in Health: WHO Guide<br />
to Cost-Effectiveness Analysis. World Health Organization,<br />
Geneva.<br />
Thompson, J., Porras, I., Tumwine, J., Mujwahuzi, M., Katui-Katua,<br />
M., Johstone, N. & Wood, L. 2003 Drawers <strong>of</strong> <strong>water</strong> II: 30<br />
years <strong>of</strong> change in domestic <strong>water</strong> use <strong>and</strong> environmental<br />
health in East Africa. International Institute for Environment<br />
<strong>and</strong> Development, London.<br />
Toye, J. 1991 Ghana case study. In Aid <strong>and</strong> Power: The World Bank<br />
<strong>and</strong> Policy-Based Lending, Vol. 2, Case Studies (ed. P. Mosley,<br />
J. Harrigan & J. Toye). Routledge, London.<br />
Whittington, D., Lauria, D. T. & Mu, X. 1991 A study <strong>of</strong> <strong>water</strong><br />
vending <strong>and</strong> willingness to pay for <strong>water</strong> in Onitsha, Nigeria.<br />
World Development 19(2/3), 179–198.<br />
Whittington, D., Mu, X. & Roche, R. 1990 Calculating the value <strong>of</strong><br />
time spent collecting <strong>water</strong>: Some estimates for Ukunda,<br />
Kenya. World Development 1990(18), 2.<br />
WHO & UNICEF 2000 <strong>Global</strong> Water Supply <strong>and</strong> Sanitation<br />
Assessment 2000 Report. WHO, Geneva.<br />
WHO & UNICEF 2006 Meeting the MDG Water <strong>and</strong> Sanitation<br />
Target: The Urban <strong>and</strong> Rural Challenge <strong>of</strong> the Decade, WHO,<br />
Geneva <strong>and</strong> UNICEF, New York.<br />
WHO/UNICEF/JMP 2000 <strong>Global</strong> Water Supply <strong>and</strong> Sanitation<br />
Assessment 2000 Report, World Health Organization, United<br />
Nations Children’s Fund, Water Supply <strong>and</strong> Sanitation<br />
Collaborative Council.<br />
World Bank 2001 Project appraisal document on a proposed loan to<br />
the Socialist Republic <strong>of</strong> Vietnam for the Ho Chi Minh City<br />
environmental <strong>sanitation</strong> project. Urban Development Sector<br />
Unit, Vietnam Country Department <strong>of</strong> the World Bank.<br />
World Health Organization 2003 World Health Report.WHO,Geneva.
502 Guy Hutton et al. | <strong>Global</strong> <strong>cost</strong>-<strong>benefit</strong> <strong>analysis</strong> <strong>of</strong> <strong>water</strong> <strong>supply</strong> <strong>and</strong> <strong>sanitation</strong> interventions Journal <strong>of</strong> Water <strong>and</strong> Health | 05.4 | 2007<br />
APPENDIX A: WHO WORLD SUB-REGIONS<br />
Table A | Countries included in World Health Organization epidemiological sub-regions<br />
Region p Mortality stratum pp Countries<br />
AFR D Algeria, Angola, Benin, Burkina Faso, Cameroon, Cape Verde, Chad, Comoros, Equatorial<br />
Guinea, Gabon, Gambia, Ghana, Guinea, Guinea-Bissau, Liberia, Madagascar, Mali,<br />
Mauritania, Mauritius, Niger, Nigeria, Sao Tome And Principe, Senegal, Seychelles, Sierra<br />
Leone, Togo<br />
AFR E Botswana, Burundi, Central African Republic, Congo, Côte d’Ivoire, Democratic Republic Of<br />
The Congo, Eritrea, Ethiopia, Kenya, Lesotho, Malawi, Mozambique, Namibia, Rw<strong>and</strong>a,<br />
South Africa, Swazil<strong>and</strong>, Ug<strong>and</strong>a, United Republic <strong>of</strong> Tanzania, Zambia, Zimbabwe<br />
AMR B Antigua <strong>and</strong> Barbuda, Argentina, Bahamas, Barbados, Belize, Brazil, Chile, Colombia, Costa<br />
Rica, Dominica, Dominican Republic, El Salvador, Grenada, Guyana, Honduras, Jamaica,<br />
Mexico, Panama, Paraguay, Saint Kitts <strong>and</strong> Nevis, Saint Lucia, Saint Vincent <strong>and</strong> the<br />
Grenadines, Suriname, Trinidad <strong>and</strong> Tobago, Uruguay, Venezuela<br />
AMR D Bolivia, Ecuador, Guatemala, Haiti, Nicaragua, Peru<br />
EMR B Bahrain, Cyprus, Iran (Islamic Republic Of), Jordan, Kuwait, Lebanon, Libyan Arab<br />
Jamahiriya, Oman, Qatar, Saudi Arabia, Syrian Arab Republic, Tunisia, United Arab Emirates<br />
EMR D Afghanistan, Djibouti, Egypt, Iraq, Morocco, Pakistan, Somalia, Sudan, Yemen<br />
EUR B Albania, Armenia, Azerbaijan, Bosnia And Herzegovina, Bulgaria, Georgia, Kyrgyzstan,<br />
Pol<strong>and</strong>, Romania, Slovakia, Tajikistan, The Former Yugoslav Republic Of Macedonia,<br />
Turkey, Turkmenistan, Uzbekistan, Yugoslavia<br />
EUR C Belarus, Estonia, Hungary, Kazakhstan, Latvia, Lithuania, Republic <strong>of</strong> Moldova, Russian<br />
Federation, Ukraine<br />
SEAR B Indonesia, Sri Lanka, Thail<strong>and</strong><br />
SEAR D Bangladesh, Bhutan, Democratic People’s Republic Of Korea, India, Maldives, Myanmar,<br />
Nepal<br />
WPR B Cambodia, China, Lao People’s Democratic Republic, Malaysia, Mongolia, Philippines,<br />
Republic Of Korea, Viet Nam<br />
Cook Isl<strong>and</strong>s, Fiji, Kiribati, Marshall Isl<strong>and</strong>s, Micronesia (Federated States Of), Nauru, Niue,<br />
Palau, Papua New Guinea, Samoa, Solomon Isl<strong>and</strong>s, Tonga, Tuvalu, Vanuatu<br />
p AFR ¼ Africa Region; AMR ¼ Region <strong>of</strong> the Americas; EMR ¼ Eastern Mediterranean Region; EUR ¼ European Region; SEAR ¼ South East Asian Region; WPR ¼ Western Pacific<br />
Region.<br />
pp B ¼ low adult, low child mortality; C ¼ high adult, low child mortality; D ¼ high adult, high child mortality; E ¼ very high adult, high child mortality.<br />
Available online May 2007