City Sanitation Plan for Nashik - SuSanA
City Sanitation Plan for Nashik - SuSanA
City Sanitation Plan for Nashik - SuSanA

Create successful ePaper yourself
Turn your PDF publications into a flip-book with our unique Google optimized e-Paper software.
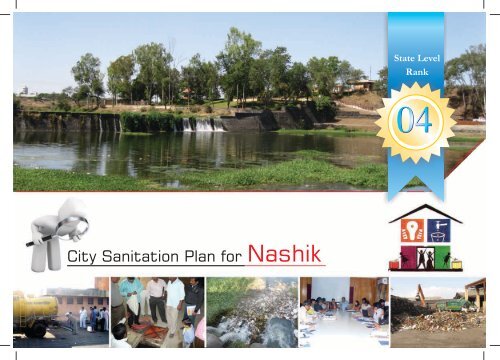
State Level<br />
Rank<br />
04<br />
<strong>City</strong> <strong>Sanitation</strong> <strong>Plan</strong> <strong>for</strong> <strong>Nashik</strong>
FOREWORD<br />
I am pleased to provide some introductory thoughts to this document, which arrives at an important turning point in the development of <strong>Nashik</strong> <strong>City</strong>. I would like to<br />
express my deep appreciation <strong>for</strong> the initiative and support given by GIZ in the preparation of the <strong>City</strong> <strong>Sanitation</strong> <strong>Plan</strong>. This document is a succinct overview of the<br />
<strong>City</strong> <strong>Sanitation</strong> <strong>Plan</strong> <strong>for</strong> <strong>Nashik</strong> <strong>City</strong> in order to recognize the stress areas in the sanitation sector and establish priorities in the intervention areas along the defined<br />
strategic guidelines.<br />
<strong>City</strong> <strong>Sanitation</strong> <strong>Plan</strong> is a 30-year strategic framework to deliver on the long-term vision we have set <strong>for</strong> the sanitation sector <strong>for</strong> <strong>Nashik</strong> <strong>City</strong>. This framework <strong>for</strong>ms the<br />
basis on which the city administration will work with stakeholders - including other government agencies, service providers and beneficiaries - in our common<br />
mission to overcome the vast gaps in sanitation services. The process culminating in this framework included in-depth research and wide-ranging consultation with<br />
city stakeholders. Building on the objectives set out in the National Urban <strong>Sanitation</strong> Policy of 2008, the technical team under GIZ conducted 6 months of data-driven<br />
research which resulted in the release of the preliminary draft ‘<strong>Nashik</strong> Status Report’ document <strong>for</strong> stakeholders’ comment in August 2010. A two-month period allowing <strong>for</strong> stakeholders’<br />
comment and consultation followed. Post validation of the data presented in the preliminary draft, the draft ‘<strong>City</strong> <strong>Sanitation</strong> <strong>Plan</strong>’ was released in June 2011 followed by stakeholder<br />
consultations and subsequent finalization of the strategic framework. Today, I can confidently say that all interested parties had a meaningful opportunity to contribute to the adopted<br />
framework.<br />
This document is not exclusive in the context of planning <strong>for</strong> the city because its <strong>for</strong>mulation has been synergized with the elements of <strong>Nashik</strong>’s <strong>City</strong> Development <strong>Plan</strong>. The strategic plan<br />
reflects the thoughts, feelings, ideas, and wants of the stakeholders of the city and moulds them along with the city’s purpose, mission, and regulations into an integrated document. The final<br />
section of this document will serve as a guide <strong>for</strong> implementing the process <strong>for</strong> the stakeholders. This document is not a static document as this can be quickly adjusted with additional scenarios<br />
that may occur. With this document, and with the community-defined commitments that lie behind it, we are enabled to establish a clear case <strong>for</strong> a strategic choice that presents itself in relation<br />
to a current or predicted transport gap; given the balanced view of the range of options available coupled with the timeframes within which each explicit strategic choice needs to be made.<br />
We consider the evolving agenda based on the document to be ambitious, but achievable. The framework is ambitious because it puts <strong>for</strong>ward an uncompromising vision of sanitation services<br />
which are in tune with the needs of our city and the real needs of community, whilst at the same time striving to come as close to financial self-sufficiency as possible. This means that sanitation<br />
sector must deliver improved basic services and better services to all users. Furthermore - since we are operating in a context of limited national resources – it also means that these objectives<br />
must be reached at the lowest possible system cost, that services must aim to be self-sustaining and that they must generate the necessary reinvestment to meet future customer requirements.<br />
Ambitious though these goals may be, they are achievable because the framework is based on current realities and judiciously <strong>for</strong>ecasted trends. It spells out the roles and sets clear targets <strong>for</strong><br />
government, private service providers and customers. The role of city administration is to put appropriate institutions in place and define clear rules to regulate investment and operations in an<br />
attempt to achieve the agreed goals <strong>for</strong> the sanitation sector.<br />
This strategic framework represents the first foundation of a new collective process which will breathe life into our long-term vision and strategy and will guide all our collective actions as we<br />
strive to meet the needs of the city and our community. Wide ownership of the process will ensure that the strategy remains dynamic and adaptable as it is continually enriched and enhanced<br />
by the experience of implementation. It is with a great deal of satisfaction that we declare this strategic framework to be the action agenda <strong>for</strong> the ‘<strong>Sanitation</strong> Sector’. This agenda is the basis on<br />
which the initiatives must be evaluated, especially by the most important stakeholder in the sanitation sector - the in<strong>for</strong>med and demanding customer.<br />
The <strong>for</strong>mal implementation of this agenda starts in earnest today with the release of this strategy document and continues <strong>for</strong> the next 30 years. Along the way we intend to address the national<br />
goals to which government is committed and meet the needs of the community we have chosen to prioritize.<br />
B.D. Sanap, (I.A.S)<br />
Commissioner<br />
<strong>Nashik</strong> Municipal Corporation
Part I: Introduction<br />
<strong>City</strong> <strong>Sanitation</strong> <strong>Plan</strong> <strong>for</strong> <strong>Nashik</strong><br />
1.1 : NASHIK<br />
The city of <strong>Nashik</strong> situated in the state of<br />
Maharashtra, is popularly known as the “Grape <strong>City</strong>”<br />
of India because of its many vineyards. The city is<br />
administrated by the <strong>Nashik</strong> Municipal Corporation<br />
(NMC) and is also the headquarters of the <strong>Nashik</strong><br />
District. <strong>Nashik</strong> has 108 wards within 6<br />
administrative zones making <strong>Nashik</strong> the third largest<br />
city in Maharashtra.<br />
<strong>Nashik</strong> is a part of the industrial and manufacturing<br />
triangle in Maharashtra along with Mumbai and<br />
Pune. It’s location on the banks of river Godavari<br />
makes it a major pilgrimage centre as well. Its fast<br />
growing population, religious importance and<br />
industrial orientation results in a significant<br />
sanitation problem in city.<br />
<strong>Nashik</strong> secured an over all sanitation score of 45.91<br />
out of 100 and has been ranked on 42nd out of the<br />
423 Indian cities evaluated in the sanitation ranking<br />
exercise carried out under the mandate of the<br />
National Urban <strong>Sanitation</strong> Policy (NUSP) through<br />
Ministry of Urban Development, Govt. of India. This<br />
score indicates the need <strong>for</strong> considerable<br />
improvements in the sanitary conditions of the city.<br />
As per NUSP's directions the NMC carried out a<br />
detailed assessment of the sanitary conditions in the<br />
city. Some of the pressing sanitary issues have been<br />
presented in Fig 1. This assessment was done in<br />
order to come up with a <strong>City</strong> <strong>Sanitation</strong> <strong>Plan</strong> to<br />
address the current concerns and plan <strong>for</strong> the future<br />
sanitary requirements thorough a participatory<br />
approach that takes into account factors such as<br />
cross-cutting issues, inclusivity of the urban poor,<br />
analysis of issues and solutions at ward level<br />
granularity, prioritisation of issues, and to come up<br />
with definite timelines <strong>for</strong> the implementation of<br />
solutions.<br />
1<br />
Open defecation / urination<br />
2<br />
Solid waste is not segregated at<br />
source<br />
3<br />
Pollution of the Godavari<br />
River due to open<br />
drains<br />
4<br />
Treated wastewater is<br />
neither reused nor recycled<br />
5<br />
Possibility of ground water pollution<br />
due to septic tanks<br />
Figure 1: <strong>Sanitation</strong> issues in <strong>Nashik</strong> <strong>City</strong><br />
Each city has been scored under 19 indicators which are<br />
divided into three categories:<br />
Output (50 points)<br />
Process (30 Points)<br />
Outcomes indicators (20 points)<br />
Based on the scores, the cities were classified thus:<br />
Category<br />
Points<br />
>33<br />
67-90<br />
4<br />
1<br />
Category<br />
2<br />
Points<br />
34-66<br />
91-100<br />
Figure 2: National Urban <strong>Sanitation</strong> Policy <strong>Sanitation</strong> Rating<br />
Score:<br />
45.91<br />
100<br />
5<br />
3<br />
NEED<br />
CONSIDERABLE<br />
IMPROVEMENT<br />
RANKED<br />
4th<br />
State Level Rank<br />
RANKED<br />
42nd<br />
out of 423 cities<br />
Figure 3: NUSP <strong>Sanitation</strong> Ranking <strong>for</strong> <strong>Nashik</strong>
Part I: Introduction<br />
<strong>City</strong> <strong>Sanitation</strong> <strong>Plan</strong> <strong>for</strong> <strong>Nashik</strong><br />
1.2 : NATIONAL URBAN SANITATION POLICY<br />
The Ministry of Urban Development, Government of India, issued a National Urban <strong>Sanitation</strong> Policy in 2008 with a vision to make all Indian cities and towns completely<br />
“sanitised, healthy and liveable”.<br />
The NUSP instructs states to come up with their own detailed state-level urban sanitation<br />
strategies and <strong>City</strong> <strong>Sanitation</strong> <strong>Plan</strong>s (CSP). It moots the idea of completely sanitised and opendefecation-free<br />
cities as its target, and the setting up of a multi-stakeholder <strong>City</strong> <strong>Sanitation</strong> Task<br />
Force to achieve this. The Policy gives significant emphasis on environmental considerations,<br />
public health implications, and reaching the underserved and urban poor. The policy suggests<br />
four funding options: funds directly from central and state governments; funds through<br />
existing funding schemes; funds via public-private partnerships; and funds from external<br />
funding agencies. The Policy directs that at least 20% of the funds should be earmarked<br />
towards servicing the urban poor. The GoI also plans to confer awards to the best per<strong>for</strong>ming<br />
cities, which is reminiscent of the Nirmal Gram Puraskar awards <strong>for</strong> villages <strong>for</strong> the same cause.<br />
SANITATION STATISTICS OF URBAN INDIA<br />
7.87% urban households do not have access to toilets and<br />
defecate in the open<br />
More than 37 % of the total human excreta generated is<br />
unsafely disposed<br />
Ensure safety of<br />
sanitation workers<br />
What a city<br />
needs to do,<br />
to become<br />
totally<br />
sanitised?<br />
Follow the National<br />
Urban <strong>Sanitation</strong><br />
Policy 2008,<br />
which instructs:<br />
Universal access to<br />
toilets <strong>for</strong> all, including<br />
urban poor<br />
Open-defecationfree<br />
city<br />
More than 60% of the country’s GDP is being lost due to<br />
public health and environmental costs due to unsafe<br />
sanitation<br />
75% of all surface water across India is being contaminated<br />
due to the discharge of untreated municipal wastewater<br />
The GOI had initiated a city sanitation rating exercise based on urban sanitation indicators.<br />
The aim of this exercise is to help cities prioritise areas of improvement vis-à-vis<br />
development and implement holistic CSP.<br />
Ensure reuse/recycle<br />
of treated waste water<br />
Eliminate of<br />
manual scavenging<br />
Ensure safe collection,<br />
treatment and disposal<br />
of all wastewater, solid<br />
waste, stormwater<br />
03
DIAGNOSTIC PHASE CONSULTATION/ANALYSIS FINALISATION OF OUTPUTS<br />
Part I: Introduction<br />
<strong>City</strong> <strong>Sanitation</strong> <strong>Plan</strong> <strong>for</strong> <strong>Nashik</strong><br />
1.3 : APPROACH AND METHODOLOGY<br />
The approach and methodology adopted <strong>for</strong> the<br />
development of CSP is depicted in Figure 4. The scope of<br />
work being:<br />
Formation of a <strong>City</strong> <strong>Sanitation</strong> Task Force (CTF)<br />
Carrying out a baseline review<br />
Supporting awareness-generation and a sanitation campaign<br />
Identifying technology options<br />
Enhancing capacity and knowledge management<br />
Formulating a <strong>City</strong> <strong>Sanitation</strong> <strong>Plan</strong><br />
CSP Focal Points:<br />
PLAN COMPONENTS<br />
Access to Toilets<br />
Waste water Management<br />
River Pollution and Storm Water Management<br />
Water Supply<br />
Solid Waste Management<br />
STRATEGIC SUPPORT PILLARS<br />
Governance and Institutional Framework<br />
Capacity Building<br />
Awareness Generation<br />
Financial Sustainability<br />
Sample:<br />
3210 households across<br />
107 wards<br />
Sample <strong>for</strong> urban poor:<br />
65 out of 104 listed slums<br />
Inception interaction<br />
Interaction with Local<br />
ULBs, GoI, State,<br />
Bilateral & multilateral<br />
agencies.<br />
Setting up <strong>City</strong>Task<br />
Force<br />
Crystallize range of<br />
solution<br />
Vision and Targets<br />
Technology Choices<br />
Institutional Framework<br />
Funding options<br />
Implementation Road<br />
map<br />
Baseline Research Focus<br />
Demographic, Spatial<br />
and socio-economic<br />
context<br />
Service level/Access<br />
Indicators<br />
Ongoing/Completed<br />
initiatives<br />
Intuitional<br />
understanding<br />
GIS / Thematic maps<br />
Database management<br />
systems<br />
Initiation of evaluation of options<br />
Technology options to bridge gaps<br />
Onsite & Offsite<br />
Shared vs stand-alone<br />
Pollution mitigation<br />
Investment/recurring costs<br />
Institutional Framework<br />
Components of behaviour change in<br />
ward level pilots<br />
Funding options<br />
Submission of Draft CSP<br />
Consultation with CTF<br />
and MouD<br />
Methodology<br />
ULB interactions/data<br />
collection<br />
States level interactions<br />
Gap filling surveys<br />
Situation Analysis<br />
Demographic/Spatial<br />
Issues<br />
<strong>Sanitation</strong> infrastructure<br />
/ access<br />
Policy/Institutional<br />
issues<br />
Financing<br />
Database management<br />
issues<br />
Availability of GIS maps<br />
FINALISATION<br />
OF CSP<br />
04<br />
Figure 4: <strong>City</strong> <strong>Sanitation</strong> Policy - Approach & Methodology
PART II: Input Variables: Population<br />
<strong>City</strong> <strong>Sanitation</strong> <strong>Plan</strong> <strong>for</strong> <strong>Nashik</strong><br />
Urban areas by nature are in a state of continuous evolution, and they undergo cyclical periods of natural growth, decline and revitalization over the course of time.<br />
Recognizing trends is a key element in ensuring the efficient long-term allocation of resources and a sound principle of land use planning.<br />
Population projections help in long-range planning and infrastructure investment by indicating the scope and scale of population change.<br />
1. GROWTH & PRESENT POPULATION<br />
1.6<br />
70%<br />
<strong>Nashik</strong> is the third-largest city in Maharashtra and one of the fastest growing cities<br />
in India.<br />
2051<br />
The population of <strong>Nashik</strong> city grew from 0.15 millions in 1951 to<br />
1.49 million in 2011<br />
The city attracts a floating population of 1 Lakh people (mostly pilgrims)<br />
daily<br />
Population (millions)<br />
1.4<br />
1.2<br />
1<br />
0.8<br />
0.6<br />
0.4<br />
0.2<br />
60%<br />
50%<br />
40%<br />
37.96%<br />
30%<br />
20%<br />
10%<br />
Decadal Growth Rate<br />
Population<br />
Decadal Growth<br />
Rate<br />
Years<br />
2041<br />
2031<br />
2026<br />
2021<br />
2016<br />
2011<br />
2001<br />
0<br />
2 4 6 8<br />
Population Projection (million)<br />
0<br />
1951 1961 19711981 1991 2001 2011<br />
Years<br />
2. POPULATION PROJECTIONS<br />
Source: CSP Report<br />
The population of <strong>Nashik</strong> is expected to grow from 1.08 million to 1.75, 2.6 and 3.75<br />
million by 2011, 2021 & 2031 respectively. Notably there are variations in population<br />
projections in various studies and DPRs. This variation in population projection has<br />
serious implications <strong>for</strong> future planning.<br />
0%<br />
Figure 5: <strong>Nashik</strong>’s Population and Decadal Growth Rate<br />
CSP Analysis<br />
Water Supply (DPR)<br />
Sewerage (DPR)<br />
<strong>City</strong> Development <strong>Plan</strong><br />
Source: CSP Report<br />
As per the 2011 census, <strong>Nashik</strong>’s urban poor population is 2.1 lakhs<br />
which is 14% of its total population in the same year<br />
Figure 6: <strong>Nashik</strong>’s Population Projection<br />
05
PART III: <strong>Sanitation</strong> Mapping<br />
<strong>City</strong> <strong>Sanitation</strong> <strong>Plan</strong> <strong>for</strong> <strong>Nashik</strong><br />
SANITATION COMPONENTS<br />
Does the city have access to toilets?<br />
06<br />
a) Access To Toilets<br />
What if I stay in an urban area?<br />
The survey revealed 73% of the respondents had in-house toilet facilities whereas 23% used public toilets, as<br />
presented in figure 7. This means, <strong>Nashik</strong> has a fairly good coverage in terms of sanitation, mostly via in-house<br />
toilets. The respondents without household toilets mostly used a community toilet complex. Due to <strong>Nashik</strong>’s good<br />
sanitation coverage, open defecation does not seem to be a widespread problem and is limited to low-income<br />
households and slum pockets which is a matter of concern.<br />
NMC area has 5,568 Public toilet seats, out of this majorly people use public toilet facility in commercial areas (35%)<br />
in comparison to residential (12 to 15%). This again indicates prevalence of individual toilets in residential areas<br />
and need of public toilets in commercial or public places.<br />
In terms of complaint redressal mechanism, NMC was found to be fairly good.<br />
What if I stay in an urban poor area?<br />
The status of toilets in slum areas, based on an independent mapping of 65 slums (74 toilet blocks), indicates that<br />
there are 62 slums which are located in close proximity to the city sewer lines whereas 18 slums are located near<br />
water bodies. Most of the settlements have access to community toilets and a few households have individual<br />
toilets (51 slums have access to toilet within the slum, 10 slums use a facility located outside the slum, 4 slums have<br />
no access to toilets). The access to toilet scenario <strong>for</strong> the urban poor is presented in figure 8. The average toilet to<br />
person ratio in the 51 slums with a toilet facility is 1:65.<br />
The physical conditions of the 74 toilet blocks were found to be less than satisfactory. Out of these toilet blocks, 15<br />
are maintained on a ‘pay and use’ basis mostly by private companies, and the rest are maintained by NMC. The<br />
amount a family pays monthly varies from ` 15 to 20 <strong>for</strong> this service.<br />
The issue of open defecation phenomenon was found to be prevalent in 13 slums (ward number 1, 2,<br />
8,10,11,59,69,76,94 and 96), mainly due to lack of the facility or poor maintenance of the existing toilet blocks.<br />
The ward wise availability of toilet facilities in <strong>Nashik</strong> is presented in figure 9.<br />
2%<br />
23%<br />
15%<br />
2%<br />
73%<br />
6%<br />
79%<br />
Toilets in<br />
house<br />
Public Toilets<br />
Common in<br />
>2 houses<br />
Open<br />
Defecation<br />
Source: CSP Report<br />
Figure 7: Distribution of Toilet Facility<br />
Access to<br />
toilets within<br />
slums<br />
Use facility<br />
outside the<br />
slum<br />
No access to<br />
Toilets<br />
Source: CSP Report<br />
Figure 8: Access To Toilets - Urban Poor
52<br />
53<br />
51<br />
82<br />
54<br />
83<br />
50<br />
25<br />
108<br />
24<br />
81<br />
55<br />
84<br />
56<br />
49<br />
80<br />
85<br />
101<br />
57<br />
79<br />
105<br />
86<br />
87<br />
48<br />
104<br />
107<br />
106<br />
26<br />
47<br />
78<br />
89<br />
58<br />
27<br />
59<br />
45<br />
44<br />
20<br />
60<br />
62<br />
64<br />
28<br />
19<br />
63<br />
29<br />
43<br />
61<br />
18<br />
42<br />
17<br />
9<br />
10<br />
41<br />
16<br />
65<br />
90<br />
88 36<br />
77<br />
38<br />
103<br />
102<br />
91<br />
92<br />
93<br />
100<br />
76<br />
30<br />
15<br />
11<br />
40<br />
31<br />
39<br />
66 Devlali Cantonment Area<br />
99<br />
14<br />
37<br />
75<br />
12<br />
67<br />
74<br />
94<br />
32<br />
95<br />
96<br />
73<br />
68<br />
98<br />
72<br />
35<br />
97<br />
13<br />
71<br />
33<br />
34<br />
69<br />
70<br />
PART III: <strong>Sanitation</strong> Mapping<br />
<strong>City</strong> <strong>Sanitation</strong> <strong>Plan</strong> <strong>for</strong> <strong>Nashik</strong><br />
120%<br />
100%<br />
80%<br />
60%<br />
40%<br />
20%<br />
0%<br />
-20%<br />
1 3 5 7 9 11 13 15 17 19 21 23 25 27 29 31 33 35 37 39 41 43 45 47 49 51 53 55 57 59 61 63 65 67 69 71 73 75 77 79 81 83 85 87 89 91 93 95 97 99 101 103 105 107<br />
Figure 9: Ward Wise availability of Toilet Facility<br />
Toilets in house Open Defecation Community Toilet Complexes Common <strong>for</strong> 2 or more houses<br />
MILITARY AREA<br />
What are the main issues that<br />
need to be addressed?<br />
Prevalence of open defecation in slums<br />
and around religious areas, and open<br />
urination in public places<br />
(Central Bus Stand, Ramkund Area)<br />
Figure 10 highlights open-defecationprone<br />
areas in the city.<br />
Strengths<br />
Wide coverage of individual toilets and<br />
good awareness on general hygiene are<br />
the strong points of <strong>Nashik</strong>’s sanitation<br />
plan. Proper planning and maintenance<br />
would help in solving the issues.<br />
5<br />
Vajreshar wadi, Shahu nagar, Wadar wadi,<br />
Dutta Nagar, Bharad wadi, Rahul wadi, Hira wadi,<br />
7<br />
Burudoha wadi, Sanjay Nagar, Mazdoor wadi,<br />
Sahjeevan Nagar, Kranti Nagar, Mangal wadi.<br />
21 5<br />
3<br />
4<br />
Indira Gandhi Nagar No. 2,<br />
Indira Nagar<br />
Shantinagar, Ramabai<br />
Ambedkar Nagar, Gautam<br />
Nagar Slum<br />
Open Defecation areas<br />
SATPUR DIVISION<br />
Satpur MIDC<br />
3<br />
SOLID WASTE<br />
DISPOSAL SITE<br />
23<br />
22<br />
NASHIK WEST<br />
DIVISION<br />
46<br />
4<br />
Ambad MIDC<br />
CIDCO DIVISION<br />
MILITARY AREA<br />
Figure 10: Open-defecation-prone areas in the city.<br />
1<br />
8<br />
6<br />
2<br />
3<br />
PANCHAWATI<br />
DIVISION<br />
NASHIK EAST DIVISION<br />
Devlali Cantonment Area<br />
5<br />
2<br />
6<br />
1<br />
4<br />
1<br />
NASHIKROAD DIVISION<br />
2<br />
6<br />
Vaidu Wadi,<br />
Vasant Dada<br />
Nagar<br />
Amrapali Nagar<br />
Indira Nagar,<br />
Prakash Ambedkar Nagar<br />
Hiwlewadi, Gadgil wadi,<br />
Naik wadi,<br />
Pendharkar Slum<br />
Jetwan Nagar<br />
Amrapali Nagar<br />
Indira Nagar,<br />
Prakash Ambedkar Nagar<br />
Hiwlewadi, Gadgil wadi,<br />
Naik wadi,<br />
Pendharkar Slum<br />
Jetwan Nagar<br />
07
PART III: <strong>Sanitation</strong> Mapping<br />
<strong>City</strong> <strong>Sanitation</strong> <strong>Plan</strong> <strong>for</strong> <strong>Nashik</strong><br />
SANITATION COMPONENTS<br />
How is the city’s waste water management system?<br />
08<br />
b) Wastewater Management<br />
There are two waste water management systems in <strong>Nashik</strong>: Off-site sanitation (through<br />
the sewerage system) and on-site sanitation (through septic tanks and soak pits). The<br />
diagrammatic representation of the city’s waste water management system is presented<br />
in figure 11.<br />
NMC’s sewerage system covers nearly 54% of its residential area. The town planning<br />
department has made septic tanks mandatory <strong>for</strong> getting building permissions in the city.<br />
About 80 to 85% of septic tanks and other individual toilets are connected to this network.<br />
These septic tanks are cleaned by the NMC on demand from the citizens. The statistics <strong>for</strong><br />
property-wise connection to this sewerage network, and division wise residential and<br />
commercial establishments that have soak pits are presented in figure 12 and 13<br />
respectively.<br />
In addition to the septic tanks, several households, located mainly in the New <strong>Nashik</strong><br />
zone, have soak pits – which are lined pits without a floor and that allow human waste to<br />
filter through alluvial sand be<strong>for</strong>e reaching the underground aquifer. The outlets of septic<br />
tanks are connected to the sewer networks, and the sewage disposal in this system is<br />
done at the pumping stations of the existing facility. Septage collected from the septic<br />
tanks by the vacuum suction trucks is disposed in the sewage pumping stations or into<br />
the sewers.<br />
<strong>Nashik</strong> has three Sewage Treatment <strong>Plan</strong>ts (STP) located at Tapovan, Chehedi and<br />
Panchak. The CPCB’s nation-wide assessment graded Tapovan and Chehedi as<br />
satisfactory facilities and Panchak as a good facility.<br />
URBAN POOR: Out of 74 toilet blocks,<br />
there are 17 connected to septic tanks and one to a<br />
biogas plant. This could be due to the non-availability of sewerage lines when the toilet<br />
blocks were built. But now, the city has a fairly good spread of sewerage networks and it<br />
has already been stated that 62 out of 65 slums are next to city sewer lines. It might be<br />
necessary to plug the outlet of these septic tanks directly to the city’s sewerage network.<br />
There are 18 slums that are located near water bodies.<br />
Property connected<br />
to sewer lines:<br />
268,271<br />
250,000<br />
200,000<br />
150,000<br />
100,000<br />
50,000<br />
0<br />
230,554<br />
24,878<br />
Residential<br />
426<br />
0<br />
Institutional /<br />
Government<br />
Connected to Sewer Line<br />
Secondary<br />
River<br />
37,291<br />
2,639<br />
Commercial<br />
Tertiary<br />
3 STPs located at<br />
Tapovan, Chehedi and<br />
Panchak<br />
0<br />
3,101<br />
Industrial<br />
With Soak Pits<br />
Source: CSP Report<br />
No. of Soak Pits<br />
12000<br />
10000<br />
8000<br />
6000<br />
4000<br />
2000<br />
0<br />
Septic Tank<br />
Primary<br />
Property connected<br />
to Septic<br />
tank:30,618<br />
Figure 11: Schematic Diagram of <strong>Nashik</strong>’s Sewerage System<br />
Figure 12: Property-wise Connections<br />
to Sewerage Network<br />
824<br />
514<br />
403<br />
559<br />
205<br />
134<br />
1243<br />
<strong>Nashik</strong> E <strong>Nashik</strong> W Panchavati New <strong>Nashik</strong> Satpur <strong>Nashik</strong> Rd<br />
2458<br />
4663<br />
9112<br />
Residential<br />
60% septic tanks are<br />
directly connected to<br />
sewer lines, rest are<br />
cleaned by NMC<br />
on demand<br />
2962<br />
4440<br />
Commercial<br />
Source: CSP Report<br />
Figure 13: Division Wise Residential &<br />
Commercial Establishment Having Soak Pits
PART III: <strong>Sanitation</strong> Mapping<br />
<strong>City</strong> <strong>Sanitation</strong> <strong>Plan</strong> <strong>for</strong> <strong>Nashik</strong><br />
Fact Sheet<br />
Wards 1, 2, 8, 10, 11, 12 and 13 continue<br />
disposing the sewage through open drains<br />
The highest proportion of sewage (30%)<br />
being let into open drains is from Ward 10<br />
Collection Efficiency<br />
Area with Piped network<br />
100%<br />
Households with individual<br />
connections<br />
Complaints Redress<br />
0%<br />
WW Collection Efficiency<br />
Cost Recovery<br />
WW Treatment Adequacy<br />
Reuse and Recycling<br />
Quality of WW Treatment<br />
Desired Level of Service<br />
Existing Level of Service<br />
Source: CSP Report<br />
Figure 14: Ward Status <strong>for</strong> Sewage Disposal<br />
Figure 15: Service Level Benchmarking For Wastewater<br />
Wards disposing 60% or more than 60% of sewage through sewer line<br />
Wards disposing more than 40% of sewage through septic tanks<br />
Wards disposing sewage through Open Drain<br />
09
PART III: <strong>Sanitation</strong> Mapping<br />
<strong>City</strong> <strong>Sanitation</strong> <strong>Plan</strong> <strong>for</strong> <strong>Nashik</strong><br />
What are the main issues that need to be addressed?<br />
Existing septic tanks could create potential risks of ground water pollution, and affect<br />
public health and utilisation of sewage treatment plants<br />
Approximately 60% of the properties have septic tanks of which 40% are further connected to the<br />
sewerage network. In the New <strong>Nashik</strong> Zone there are several households that also have soak pits. These<br />
septic tanks or soak pits are cleaned by NMC on a demand basis. NMC has six vehicles to de-sludge<br />
septic tanks from the city’s six zones, out of which only four vehicles are in condition, that indicates the<br />
need <strong>for</strong> additional vacuum suction vehicles on priority.<br />
The practice of providing sewerage connection through septic tanks could potentially lead to suboptimal<br />
waste water collection, STP infrastructure utilisation, and create a potential risk of ground water<br />
pollution<br />
Figure 16: Leakage from Septic Tank of Public Toilet<br />
Complex near Ramkund area<br />
Lack of in<strong>for</strong>mation on waste water volume flows and non-automated sewerage system]<br />
Significant variation with very low BOD levels were noticed <strong>for</strong> extended periods of time at the Tapovan and Chehedi STPs. The analysis of this<br />
variation in BOD levels is constrained due to non-functioning or non-availability of bulk meters at STPs, and lack of in<strong>for</strong>mation on volume of flows.<br />
Opportunity<br />
Limited ef<strong>for</strong>ts towards waste water<br />
recycling, reuse, and waste to<br />
energy conversion.<br />
Strength<br />
The city has good coverage of the<br />
sewerage network and a sound<br />
engineering department to address<br />
the concerns in this sector.<br />
10
54<br />
55<br />
84<br />
80<br />
85<br />
57<br />
79<br />
86<br />
105<br />
87<br />
104<br />
107<br />
106<br />
26<br />
103<br />
102<br />
47<br />
91<br />
78<br />
89<br />
92<br />
90<br />
58<br />
27<br />
93<br />
WALDEVI RIVER<br />
64<br />
61<br />
42<br />
17<br />
9<br />
41<br />
16<br />
30<br />
15<br />
65<br />
66<br />
99<br />
67<br />
94<br />
96<br />
72<br />
35<br />
PART III: <strong>Sanitation</strong> Mapping<br />
<strong>City</strong> <strong>Sanitation</strong> <strong>Plan</strong> <strong>for</strong> <strong>Nashik</strong><br />
SANITATION COMPONENTS<br />
How is the city’s rivers &<br />
drainage network?<br />
MILITARY AREA<br />
c) River Pollution and Storm<br />
Water Management<br />
1<br />
3<br />
4<br />
The city’s rivers are polluted mainly due to the<br />
discharge of untreated industrial effluents and<br />
domestic sewage, agriculture runoff, solid waste,<br />
and pilgrimage-related wastes.<br />
24<br />
GODAVARI RIVER<br />
7<br />
21<br />
8<br />
2<br />
6<br />
PANCHAWATI DIVISION<br />
5<br />
<strong>Nashik</strong> has two main industrial estates within the<br />
NMC area, Ambad and Satpur with 314 and 204<br />
industries respectively. Most of the large and<br />
medium scale industries have their own Effluent<br />
Treatment <strong>Plan</strong>ts. However, there are no Common<br />
Effluent Treatment <strong>Plan</strong>ts to treat the effluent from<br />
small industries and as a result these industries<br />
contribute to the point source pollution of water<br />
bodies, especially in River Godavari and Nasardi.<br />
The data on the quantity and nature of effluents<br />
discharged through various industries into these<br />
water bodies is not maintained.<br />
52<br />
25<br />
51<br />
50<br />
SATPUR DIVISION<br />
53<br />
82<br />
NASARDI RIVER<br />
83<br />
108<br />
81<br />
56<br />
49<br />
23<br />
10<br />
22<br />
11<br />
20 19<br />
18<br />
12<br />
45<br />
NASHIK WEST DIVISION<br />
46<br />
48<br />
NASARDI RIVER<br />
CIDCO DIVISION<br />
59<br />
28<br />
29<br />
44<br />
43<br />
60<br />
62<br />
63<br />
GODAVARI RIVER<br />
40<br />
NASARDI RIVER<br />
NASHIK EAST DIVISION<br />
13<br />
14<br />
31<br />
GODAVARI RIVER<br />
32<br />
39<br />
33<br />
37<br />
88 36<br />
77<br />
38<br />
68<br />
76<br />
Devlali Cantonment Area<br />
75<br />
73<br />
74<br />
34<br />
69<br />
NASHIKROAD DIVISION<br />
71<br />
95<br />
70<br />
In addition to industrial waste water, domestic<br />
wastewater is also directly discharged from slums,<br />
residential areas, and smaller drains into the<br />
sewerage network. In underserved areas yet to be<br />
connected, sewage directly enters the rivers at<br />
some places.<br />
The natural drainage network of the city is<br />
highlighted in the figure 17.<br />
100<br />
101<br />
MILITARY AREA<br />
Figure 17: Map Showing Natural Drainage Network in <strong>Nashik</strong><br />
WALDEVI RIVER<br />
Division Boundary<br />
Ward Boundary<br />
River<br />
Streams<br />
98<br />
97<br />
1<br />
LEGENDS<br />
DARNA RIVER<br />
Direction of flow of stream<br />
HILLY AREA<br />
CANTONMENT AREA<br />
CANTONMENT AREA<br />
11
PART III: <strong>Sanitation</strong> Mapping<br />
<strong>City</strong> <strong>Sanitation</strong> <strong>Plan</strong> <strong>for</strong> <strong>Nashik</strong><br />
Only 4% of the NMC area is covered by storm water drainage network. The lack of<br />
storm water drains and the blocking of natural drains and the dumping of garbage<br />
into existing drains causes water logging in several areas of the city. Water logging,<br />
especially during heavy, rains,<br />
affects the areas near the<br />
central bus stand, the railway<br />
station, the Ram Kund area,<br />
Canada Corner, and slums on<br />
<strong>Nashik</strong> Road.<br />
URBAN POOR<br />
In case of the slum’s storm water drainage and water logging situation, 19 out of<br />
65 slums have fully covered gutters, 11 have them totally underground, 13 have<br />
open gutters and 21 slums have partly covered gutters. But the physical condition<br />
reveals that only five slums have<br />
reported kuccha gutters while 42 are<br />
fully covered. The distribution of<br />
various types of gutters is also<br />
presented in figure 18. However,<br />
these gutters flood frequently,<br />
especially during the monsoons, and<br />
a key reason <strong>for</strong> that is the<br />
inadequate gradient of these gutters.<br />
21<br />
11<br />
1<br />
19<br />
13<br />
Covered<br />
Open<br />
Underground<br />
Partial Covered<br />
No Gutters<br />
12<br />
Figure 18: Slums with various types of<br />
gutters<br />
Figure 19: Polluted stretch of the Godavari River in <strong>Nashik</strong> city
PART III: <strong>Sanitation</strong> Mapping<br />
<strong>City</strong> <strong>Sanitation</strong> <strong>Plan</strong> <strong>for</strong> <strong>Nashik</strong><br />
What are the main issues that need to<br />
be addressed?<br />
River Godavari in the vicinity of <strong>Nashik</strong> faces<br />
severe risk of pollution from a combination of<br />
industrial and domestic sources along with<br />
agricultural run-off.<br />
Pollution hot spots and sources of pollution<br />
are marked in figure 21.<br />
Strength<br />
<strong>Nashik</strong>'s topography facilitates gravitationaly<br />
draining of storm water.<br />
Division Boundary<br />
Ward Boundary<br />
River<br />
Streams<br />
POSSIBLE SOURCES OF<br />
POLLUTION HOT SPOTS<br />
AGRICULTURAL AREA<br />
SLUMS/ RESIDENTIAL<br />
LEGEND<br />
INDUSTRIAL AREA<br />
1<br />
NO.<br />
A<br />
R<br />
Direction of flow of stream<br />
CANTONMENT AREA<br />
HILLY AREA<br />
AGRICULTURAL AREA<br />
SLUMS<br />
INDUSTRIAL AREA<br />
I<br />
Figure 20: Polluted Stretch of River Godavari at Ramkund area<br />
Figure 21: Map Showing Pollution Hot Spots and Possible Sources of Pollution in <strong>Nashik</strong><br />
13
PART III: <strong>Sanitation</strong> Mapping<br />
<strong>City</strong> <strong>Sanitation</strong> <strong>Plan</strong> <strong>for</strong> <strong>Nashik</strong><br />
SANITATION COMPONENTS<br />
How is the city’s water supply?<br />
d) Water Supply<br />
The city of <strong>Nashik</strong> receives piped water from two sources: Gangapur Dam headworks<br />
on river Godavari, which supplies water to almost 1.6 million residents in the NMC<br />
area and the head works on the river Darna, which services the <strong>Nashik</strong> Road area.<br />
<strong>Nashik</strong> has five water treatment plants at Shivajinagar (capacity 97 MLD), Bara<br />
Bunglow (capacity 81 MLD), Panchvati (capacity 71 MLD), Gandhinagar (capacity 26<br />
MLD), and <strong>Nashik</strong> road (capacity 73 MLD) to meet its treated water demand.<br />
The distribution network covers 1,440 km., which is about 71% of the road length<br />
within NMC and covers nearly 88% of the developed areas excluding slums. About<br />
10% of the population is not covered by municipal water supply, particularly in some<br />
wards on the outskirts of the city or in select slum pockets. NMC’s estimated gross per<br />
capita water supply is 149 LPCD based on the quantity of treated water put in the<br />
system, commercial water use, and system losses, which is higher than the 135 LPCD<br />
norms. Drinking water supply is intermittent and within a fixed time schedule <strong>for</strong> every<br />
zone and sub zone. NMC has 95% metered connections in its area. The Water Supply<br />
Department of NMC does not have any data on non revenue water. However the<br />
estimated figure is about 57% of the total treated water.<br />
Figure 22: Leaking public standpost<br />
0.2%<br />
1.4%<br />
0.1%<br />
9<br />
10<br />
57<br />
16<br />
URBAN POOR<br />
The survey revealed that out of 65 slums, 57 had public stand posts (PSP). The number<br />
of PSPs in each slum varied from 1 to 14 and in a few slums an average of 50 families<br />
were using a single PSP. There were also 11 slums that were fully covered with<br />
individual water connections. Also, 49 slums did not have any hand-pumps or borewells<br />
while 13 slums had one hand pump and 3 slums had 2 hand pumps each.<br />
There<strong>for</strong>e, slums presented a mixed picture, as shown in figure 24.<br />
NMC<br />
Groundwater<br />
98.3%<br />
Pvt Tanker<br />
Other<br />
No. of Slums having handpumps<br />
No. of slums having public stand post<br />
No. of slums without any individual<br />
connections<br />
No. of slums having 100% individual<br />
connections.<br />
14<br />
Figure 23: Source of Water Supply<br />
Figure 24: Water supply in slums
PART III: <strong>Sanitation</strong> Mapping<br />
<strong>City</strong> <strong>Sanitation</strong> <strong>Plan</strong> <strong>for</strong> <strong>Nashik</strong><br />
What are the main issues that need to be addressed?<br />
Non-Revenue Water (NRW) levels are high and<br />
needs urgent attention.<br />
NMC’s water supply system per<strong>for</strong>mance on coverage (91% of population served)<br />
and per capita supply (149-155 LPCD) is good. However, the amount of Non-<br />
Revenue Water (NRW) is very high at an estimated 57%. Even though 95% of the<br />
connections are metered, billing is not linked to volumetric supply due to a<br />
combination of faulty meters and irregular meter reading operations. Water supply<br />
coverage in slums is fairly extensive. Most slums (57 of the 65 slums surveyed) had<br />
at least one public stand post with a supply duration of four hours (two hours in the<br />
morning and two hours in the evening).<br />
However, only 11 of the 65 slums studied had individual water connections. While<br />
reported cost recovery and collection efficiency of NMC’s water supply system was<br />
72% and 92% respectively in 2008 and 2009, on-going projects could add to O&M<br />
cost burden.<br />
Figure 25: Group of water supply pipes near ITI signal<br />
Strength<br />
There is availability of raw water and good water supply.<br />
Weakness<br />
There is no comprehensive planning and monitoring of<br />
water supply system.<br />
15
PART III: <strong>Sanitation</strong> Mapping<br />
<strong>City</strong> <strong>Sanitation</strong> <strong>Plan</strong> <strong>for</strong> <strong>Nashik</strong><br />
SANITATION COMPONENTS<br />
How is the <strong>City</strong>’s Solid Waste Management?<br />
e) Solid Waste Management<br />
<strong>Nashik</strong> stands fairly well in the solid waste management sector. NMC estimates that<br />
the per capita solid waste generation in their area is over 300 gms per person per<br />
day. In 1996, NMC had introduced “GhantaGadi” (vehicles with bells) <strong>for</strong> door-to<br />
door-collection of waste. This system helped <strong>Nashik</strong> become a bin-free city<br />
successfully. NMC uses full-sized and mini-trucks, as well as tractor trailers to<br />
transport solid waste collected by the GhantaGadis to the waste disposal sites.<br />
reveals that 37.8% are easily compostable (short-term biodegradable) materials,<br />
19.50% are hard lignitic materials (long term biodegradable) while 16.20% are an<br />
assortment of textiles, plastic, rubber, etc (source: DPR on SWM, NMC). <strong>Nashik</strong> has<br />
a Municipal Solid Waste (MSW) facility established at Khatprakalp that has a variety<br />
of processing units.<br />
URBAN POOR<br />
It has been observed that most slums have specific dumping places where<br />
households regularly dump their garbage. This is due to a number of factors like the<br />
inadequate frequency of the GhantaGadis, the vehicles not reaching the interiors of<br />
the slum, not staying long enough, or there is no service provision at all. NMC<br />
arranges to periodically clear the garbage from these open spaces.<br />
The recent analysis of solid waste components collected within the NMC area<br />
Industry and Residential area<br />
Collection and transportation of waste through Ghanta Gadi<br />
MSW Pre-sorting Unit<br />
No segregation<br />
Bio-degradable waste<br />
Dry Waste<br />
Inert Waste<br />
Composting<br />
RDF <strong>Plan</strong>t<br />
(Capacity 150 TPD)<br />
Landfill Site<br />
(2 Hectare, capacity 75 TPD)<br />
16<br />
Figure 26: Schematic Representation of Solid Waste Management in <strong>Nashik</strong>.
PART III: <strong>Sanitation</strong> Mapping<br />
<strong>City</strong> <strong>Sanitation</strong> <strong>Plan</strong> <strong>for</strong> <strong>Nashik</strong><br />
Data Sheet <strong>for</strong> MSW<br />
Disposal<br />
25% of the city’s wards<br />
undertake (in different<br />
proportions) burning of solid<br />
waste to dispose their MSW<br />
Only 44% wards dispose<br />
their solid waste entirely via<br />
NMC’s GhantaGadis.<br />
44% wards are still<br />
practicing open dumping of<br />
solid waste disposal.<br />
Collection<br />
efficiency<br />
Complaints<br />
redressal<br />
Cost recovery-<br />
SWM<br />
Household level<br />
coverage<br />
100%<br />
0%<br />
Scientific Disposal<br />
of MSW<br />
Desired Level of Service<br />
Collection efficiency<br />
of MSW<br />
Segregation of MSW<br />
MSW recovery<br />
Existing Level of Service<br />
Figure 27: municipal solid waste facility in <strong>Nashik</strong>.<br />
Figure 28: Service Level Benchmarking For MSW<br />
The ward-wise detailed scenario <strong>for</strong> Municipal Solid Waste disposal is presented in figure 29<br />
105%<br />
100%<br />
95%<br />
90%<br />
85%<br />
80%<br />
75%<br />
1<br />
3<br />
5<br />
7<br />
9<br />
11<br />
13<br />
15<br />
17<br />
19<br />
21<br />
23<br />
25<br />
27<br />
29<br />
31<br />
33<br />
35<br />
37<br />
39<br />
41<br />
43<br />
45<br />
47<br />
49<br />
51<br />
53<br />
55<br />
57<br />
59<br />
61<br />
63<br />
65<br />
67<br />
69<br />
71<br />
73<br />
75<br />
77<br />
79<br />
81<br />
83<br />
85<br />
87<br />
89<br />
91<br />
93<br />
95<br />
97<br />
99<br />
101<br />
103<br />
105<br />
107<br />
NMC - Ghantagadi Dumped in open Burnt<br />
Figure 29: Disposal of MSW<br />
17
PART III: <strong>Sanitation</strong> Mapping<br />
<strong>City</strong> <strong>Sanitation</strong> <strong>Plan</strong> <strong>for</strong> <strong>Nashik</strong><br />
What are the main issues that need to be addressed?<br />
Lack of source segregation and limited waste recovery level<br />
NMC has abolished waste bins and introduced door-to-door collection through “ GhantaGadis” but it is constrained by<br />
the availability and number of vehicles. The current number of vehicles allows coverage only once a day, and in some<br />
areas once in two days. Further more, there is no segregation of waste at source because of which composting of<br />
biodegradable waste is not up to the mark.<br />
No vision <strong>for</strong> comprehensive solid waste management at city level, and very low O&M cost recovery<br />
Figure 30: GhantaGadi used <strong>for</strong> collection of waste<br />
<strong>Nashik</strong> has successfully become a dustbin-free city by implementing a door-to-door solid waste collection system. NMC started various small scale<br />
initiates such as composting, biomedical waste disposal, and waste to energy generation. However, there is more to achieve on a larger scale such as<br />
source segregation, composting, e-waste management, and waste to energy generation. There<strong>for</strong>e, a comprehensive approach is required to plan and<br />
implement these on-going initiatives <strong>for</strong> Municipal Solid Waste Management in <strong>Nashik</strong>.<br />
Presently, a user charge is not levied on solid waste management, but is collected as a conservancy tax as part of the property tax. This conservancy tax<br />
is not adequate to recover O&M charge completely.<br />
Weakness<br />
No segregation, high SWM costs of operation, no control<br />
over garbage thrown in open areas especially near slums,<br />
open drains and the Ram Kund area.<br />
Opportunities<br />
The scope of generating revenue from processing, and<br />
the scope <strong>for</strong> PPPs are under process.<br />
18
PART III: <strong>Sanitation</strong> Mapping<br />
<strong>City</strong> <strong>Sanitation</strong> <strong>Plan</strong> <strong>for</strong> <strong>Nashik</strong><br />
2. Governance and Institutional<br />
Frameworks<br />
NMC is an Urban Local Body (ULB) <strong>for</strong>med in<br />
November 1982. NMC operates under the legal<br />
framework provided by the Bombay Municipal<br />
Corporation Act 1948, under which the statutory<br />
responsibilities relating to sanitation services are<br />
vested with the NMC. There is, however, some<br />
sharing of responsibilities with various State-<br />
Government agencies.<br />
The institutional framework in <strong>Nashik</strong> <strong>for</strong> urban<br />
services at state and local levels includes statelevel<br />
agencies (i.e. Maharashtra Water Supply<br />
and <strong>Sanitation</strong> Department, Maharashtra Jeevan<br />
Prardhikaran, etc.) involved in urban governance<br />
and service provision, and city-level municipal<br />
organisation.<br />
Within NMC, there are detailed departmental<br />
responsibilities of service provision as well as an<br />
institutional structure <strong>for</strong> discharging their<br />
responsibilities. The adjacent table clearly<br />
signifies the overlapping and diffused<br />
accountability <strong>for</strong> sanitation within the<br />
corporation.<br />
Figure 31: <strong>City</strong> <strong>Sanitation</strong> Task Force meeting in<br />
<strong>Nashik</strong><br />
Services<br />
Water Supply<br />
a) Entire water supply system<br />
b) Tanker water supply<br />
c) Water quality testing<br />
d) Related to land reservation and allocation<br />
Waste-water management<br />
a) Sewage Treatment <strong>Plan</strong>ts<br />
b) Pumping Stations<br />
c) Sewerage Network<br />
d) Septic Tank<br />
e) Related to land reservation and allocation<br />
Storm Water Drainage<br />
Solid Waste Management<br />
a) Collection of MSW and transfer to<br />
MSW Processing plant<br />
b) Municipal Solid Waste Processing plant<br />
c) Related to land reservation and allocation<br />
Slums<br />
a) Provision of water supply, sewerage and<br />
MSW collection services<br />
b) Awareness, beneficiary identification<br />
c) BSUP scheme<br />
d) Implementation of government schemes<br />
(Except <strong>for</strong> BSUP)- civil works, construction<br />
works, provision of social amenities<br />
e) Related to land reservation and allocation<br />
<strong>Plan</strong>ning, Procurement,<br />
Design and Construction<br />
Water Supply Department<br />
Town <strong>Plan</strong>ning Department<br />
Sewerage Department<br />
Sewerage Department &<br />
Mechanical Department<br />
Sewerage Department<br />
Design and Construction<br />
done by Public Works<br />
Department<br />
Town <strong>Plan</strong>ning Department<br />
Sewerage Department<br />
a) Purchase of vehicles<br />
(Ghanta Gadis) by<br />
Mechanical Department<br />
Mechanical Department<br />
Town <strong>Plan</strong>ning Department<br />
For respective services as<br />
described above<br />
Slum department<br />
Projects Department<br />
Public Works Department<br />
<strong>Nashik</strong> Municipal Corporation<br />
Town <strong>Plan</strong>ning Department<br />
Operation & Maintenance<br />
Water Supply Department<br />
Maintenance of NMC owned Tankers by Mechanical Department<br />
Water Quality Testing by State government’s district laboratory<br />
Private operators/ contractors maintain the STPs under the<br />
monitoring of Mechanical Department<br />
Mechanical Department<br />
Sewerage Department<br />
a) Septic Tank Cleaning done by Health Department<br />
b) Septic Tank Cleaning vehicles are maintained by Mechanical<br />
Department<br />
c) O&Mofmunicipal owned septic tanks (<strong>for</strong> public toilet<br />
complexes) by Public Works Department<br />
Town <strong>Plan</strong>ning Department<br />
Sewerage Department<br />
a) Done by private operator and monitored by Health Department<br />
b) Maintenance of vehicles (Ghanta Gadis) by the vehicle supplier<br />
company <strong>for</strong> initial five years under the monitoring of<br />
Mechanical Department.<br />
Mechanical Department<br />
Town <strong>Plan</strong>ning Department<br />
For respective services as described above<br />
Slum department<br />
For respective services as described above<br />
Public Works Department <strong>Nashik</strong> Municipal Corporation<br />
Town <strong>Plan</strong>ning Department<br />
19
PART III: <strong>Sanitation</strong> Mapping<br />
<strong>City</strong> <strong>Sanitation</strong> <strong>Plan</strong> <strong>for</strong> <strong>Nashik</strong><br />
What are the main issues that need to be addressed?<br />
Diffused accountability, inadequate staffing, and lack of exposure to modern sanitation practices within the NMC<br />
Of the total posts in NMC 10 % posts are vacant, while in case of Class II category<br />
employment, around 13 % of the sanctioned posts are vacant. Similarly <strong>for</strong> Class III<br />
and Class IV employment, the percentage of vacant posts to sanctioned posts in the<br />
respective categories is 16% and 5%. In view of the large scale implementation of<br />
projects under Jawaharlal Nehru National Urban Renewal Mission (JNNURM),<br />
there is a spike in work load particularly among the Class I and II officials, where<br />
implementation of capital projects is being handled in addition to their O&M<br />
responsibilities. There is overlapping and diffused accountability <strong>for</strong> sanitation<br />
even within the NMC. As in the case of many ULBs, responsibility <strong>for</strong> sanitation is<br />
diffused across multiple departments. O&M of water supply and sewerage<br />
infrastructure is being handled by the engineering department. While solid waste<br />
management services are being handled by the public health department,<br />
procurement of vehicles is also handled by the engineering section. Public toilets<br />
are managed through private contracts which are inadequately monitored. The<br />
capital work of public toilets is done by the Public Works Department (PWD) while<br />
the O &M responsibility is with the Health Department. However, the repairs of<br />
public toilets are done by PWD. There appears to be no regulation and<br />
accountability in place <strong>for</strong> on-site sanitation. Regulatory and monitoring<br />
mechanisms <strong>for</strong> oversight on service delivery and tariff fixation are in place but are<br />
weak.<br />
20
PART III: <strong>Sanitation</strong> Mapping<br />
<strong>City</strong> <strong>Sanitation</strong> <strong>Plan</strong> <strong>for</strong> <strong>Nashik</strong><br />
3. Financial Sustainability<br />
How is the financial sustainability of NMC?<br />
Financial sustainability could be studied by assessing financial inflows (i.e. income: revenue, capital, extra-ordinary) and outflows (i.e. expenditure: revenue,<br />
capital, extra-ordinary) over a period of time.<br />
NMC had a Cumulative Annual Growth Rate (CAGR) of 19% in Revenue Income and a<br />
17.4% CAGR in Expenditure during 2004-09. Overall surplus grew at a CAGR of 56%. The<br />
share of capital expenditure in total expenditure increased from 28% to 58% (a CAGR of<br />
41%), indicating a significant increase in asset creation under JNNURM. NMC’s revenue<br />
income consists of tax incomes from own sources (octroi, property tax and others), nontax<br />
incomes from own sources (water charges and others) and revenue grants.<br />
NMC's collection efficiency of property and water tax is in the range of 67 to 77% and<br />
65% to 72% respectively during the FY05 to FY09.<br />
% of revenue income<br />
100%<br />
90%<br />
80%<br />
70%<br />
60%<br />
50%<br />
40%<br />
30%<br />
20%<br />
10%<br />
0%<br />
3% 1% 2% 2% 1%<br />
12% 12% 12%<br />
15% 15%<br />
81%<br />
86% 86% 86% 83%<br />
85% 87% 88% 90% 88%<br />
2004-05 2005-06 2006-07 2007-08 2008-09<br />
Total Tax Revenue<br />
Revenue Grants<br />
Figure 32: Composition of Revenue Income<br />
Total Non-Tax Revenue<br />
Octroi as a part of Total Tax Revenue<br />
Income from Taxes is<br />
clearly a major source<br />
of NMC’s Income<br />
Years<br />
Years<br />
2008-09<br />
207-08<br />
2006-07<br />
2005-06<br />
2004-05<br />
35,605<br />
37,596<br />
32,187<br />
32,882<br />
0 20,000 40,000 60,000 80,000<br />
In ` Lakhs<br />
50,233<br />
42,699<br />
61,143<br />
53,406<br />
50,149<br />
Figure 33 NMC: Total Income Vs Expenditure<br />
GoM has initiated measures to<br />
abolish Octroi tax starting with the D<br />
class ULBs and the same is also<br />
expected to be phased out from the<br />
NMC in near future. As octroi is the<br />
major source of revenue income, this<br />
move could impact its revenue<br />
adversely.<br />
65,357<br />
}Total Income exceeds<br />
Expenditure in every<br />
year<br />
Total Expenditure<br />
Total Income<br />
The Octroi tax alone accounted <strong>for</strong><br />
73% of the total revenue income in<br />
2008-09.<br />
Property Tax contributed 11% of<br />
Revenue Income in 2008-09 and<br />
growing at a CAGR of nearly15%<br />
during the period 2004-05 to 2008-09.<br />
21
PART III: <strong>Sanitation</strong> Mapping<br />
<strong>City</strong> <strong>Sanitation</strong> <strong>Plan</strong> <strong>for</strong> <strong>Nashik</strong><br />
% of expenditure<br />
100%<br />
90%<br />
80%<br />
70%<br />
60%<br />
50%<br />
40%<br />
30%<br />
20%<br />
10%<br />
0%<br />
2%<br />
15%<br />
84%<br />
4%<br />
4%<br />
17% 16%<br />
5%<br />
5%<br />
19% 19%<br />
80% 80% 76% 76%<br />
FY 06 FY 07 FY 08 FY 09 FY 10<br />
Financial Year (06-10)<br />
SWD-nalla and drainage repair Sewerage Water Supply<br />
Annual O&M<br />
expenditure on<br />
water supply<br />
constitutes<br />
nearly 80% of<br />
the total O&M<br />
expenditure.<br />
The O&M<br />
expenditure on<br />
Water<br />
Sewerage:<br />
SWD is 15:5:1.<br />
100% 4%<br />
4%<br />
14% 11%<br />
90%<br />
18% 14.43%<br />
6%<br />
7%<br />
80%<br />
6.27%<br />
40%<br />
35%<br />
6%<br />
70%<br />
33%<br />
36%<br />
60%<br />
34.89%<br />
5%<br />
36%<br />
5%<br />
50%<br />
4%<br />
6%<br />
40%<br />
4.99%<br />
5%<br />
30%<br />
52% 56%<br />
20%<br />
42% 41%<br />
35%<br />
39.42%<br />
10%<br />
0%<br />
Years 2004-05 2005-06 2006-07 2007-08 2008-09 Average<br />
Salary Pension O&M Others Interest<br />
% of revenue expenditure<br />
Figure 35: Composition of Revenue expenditure from FY 05 to FY 09<br />
Figure 34: O&MExpenditure Water, Sewerage and SWD<br />
NMC’s overall revenue expenditure grew at a CAGR of 11%<br />
during the period 2004 to 2009, slightly lower than<br />
Revenue Income CAGR of 13%.<br />
Administrative expenses and<br />
employee salaries accounted <strong>for</strong><br />
40% of the Revenue Expenditure and<br />
grew at nearly 14%.<br />
O&M cost recovery dipped from<br />
159% in 2002-03 to 48% in 2009-10,<br />
largely due toan 8-fold increase in<br />
the O&M expenditure while revenue<br />
(SBT) barely doubled.<br />
Expenditure in ` Lakhs<br />
250<br />
200<br />
150<br />
100<br />
50<br />
0<br />
FY03<br />
FY04<br />
FY05<br />
FY06<br />
FY07<br />
FY08<br />
FY09<br />
FY10<br />
Financial Year (03-10)<br />
150%<br />
100%<br />
50%<br />
Figure 36: Water supply system O&Mcost recovery<br />
0%<br />
Income as % of expenditure<br />
Water Benefit Tax<br />
(SBT)<br />
O&M Recovery<br />
Income as % of<br />
Expenditure<br />
NMC’s capital expenditure <strong>for</strong> water<br />
supply, sewerage, storm water drains, and<br />
divisional committee budget was Rs 14,970<br />
Lakh in 2009-2010. The CAGR <strong>for</strong> capex in water supply, sewerage, and<br />
storm water drains during the period was 69%, 8% and 251%<br />
respectively. The overall capex showed a CAGR of 43.4%.<br />
O & M cost recovery <strong>for</strong> water<br />
supply improved marginally from<br />
94% in 2002-03 to97% in 2009-10,<br />
with a dip during FY<br />
07and FY 08.<br />
Expenditure in ` Lakhs<br />
600<br />
400<br />
200<br />
0<br />
FY03<br />
FY04<br />
FY05<br />
FY06<br />
FY07<br />
FY08<br />
FY09<br />
FY10<br />
Financial Year (03-10)<br />
200%<br />
150%<br />
100%<br />
50%<br />
0%<br />
Income as % of expenditure<br />
Sewerage Benefit<br />
Tax (SBT)<br />
O&M Recovery<br />
Income as % of<br />
Expenditure<br />
22<br />
Figure 37 Sewerage system O&Mcost recovery
PART III: <strong>Sanitation</strong> Mapping<br />
<strong>City</strong> <strong>Sanitation</strong> <strong>Plan</strong> <strong>for</strong> <strong>Nashik</strong><br />
What are the main issues that need to be addressed?<br />
NMC’s financials could get severely constrained; Cost recovery levels in sewerage<br />
and solid waste are very low vis-à-vis prevailing O&M costs.<br />
Though the financial in<strong>for</strong>mation provided by NMC has facilitated a fairly detailed analysis of cost<br />
recovery in water supply and sewerage systems, an analysis of expenditure of other aspects of<br />
sanitation, such as toilet access, is constrained due to classification of expenditure under<br />
different heads. Similarly, there is very little in<strong>for</strong>mation available on costs of on-site sanitation<br />
incurred by citizens as the same is not <strong>for</strong>mally captured by NMC. With the implementation of a<br />
number of capital projects under JNNURM, a sharp rise in O&M costs can be expected. For<br />
instance, it is seen that O&M costs of sewerage networks have gone up eight-fold in the last five<br />
years and is expected to increase further with the construction of new STPs. Cost recovery in<br />
water supply and sewerage are at 72% and 48% respectively, while collection efficiency is<br />
reported at 92% and 72% in water supply respectively. Cost recovery in solid waste<br />
management is at a low of 35%.<br />
Strength<br />
Municipal finances indicate a revenue surplus<br />
Weakness<br />
There is over dependency on octroi, and low cost recovery<br />
and collection efficiency on taxes and user charges.<br />
23
PART IV: Strategies and Action <strong>Plan</strong><br />
<strong>City</strong> <strong>Sanitation</strong> <strong>Plan</strong> <strong>for</strong> <strong>Nashik</strong><br />
CITY-LEVEL GOALS:<br />
Identification of goals under the<br />
guidelines of NUSP and the<br />
accomplishment of the same<br />
would make <strong>Nashik</strong> ‘a completely<br />
sanitised city’.<br />
CITY-LEVEL KEY ISSUES:<br />
Critical issues are identified at<br />
ward level, zone level, and across<br />
various economic levels (urban &<br />
urban poor). The affected areas<br />
are characterized and prioritized<br />
<strong>for</strong> immediate intervention.<br />
RECOMMENDATION FOR KEY<br />
ISSUES:<br />
Focused recommendations to<br />
address each key issue are<br />
designed. These<br />
recommendations are given in<br />
terms of technology required,<br />
costing, institutional and<br />
governance enhancement,<br />
community awareness and<br />
inclusiveness.<br />
ACTION PLAN:<br />
Specific action plans are<br />
designed across the five plan<br />
components (access to toilets,<br />
wastewater management, river<br />
pollution and storm water<br />
management, water supply, solid<br />
waste management), and major<br />
strategic support components<br />
(governance and institutional<br />
frame work and financial<br />
sustainability). These action plans<br />
are packaged around five pillars<br />
of intervention.<br />
PILLARS OF<br />
INTERVENTION<br />
TECHNOLOGY<br />
FINANCE<br />
INSTITUTIONAL<br />
&<br />
GOVERNANCE<br />
CAPACITY<br />
ENHANCEMENT &<br />
COMMUNITY<br />
AWARENESS<br />
INCLUSIVENESS<br />
24
PART IV: Strategies and Action <strong>Plan</strong><br />
<strong>City</strong> <strong>Sanitation</strong> <strong>Plan</strong> <strong>for</strong> <strong>Nashik</strong><br />
The city sanitation plan recommends an action plan in two time horizons <strong>Plan</strong>ning Horizon spanning 30 years (2012-2041) and action horizon spanning 10 years (2012-21)<br />
<strong>Plan</strong>ning Horizon<br />
(30 years: 2012-2041)<br />
Action Horizon<br />
(10 years 2012-21)<br />
The <strong>Plan</strong>ning Horizon considers a period of 30 years from<br />
2012 to 2041, and involves planning <strong>for</strong> an Intermediate<br />
Stage (2021 or 10 years) and an Ultimate Stage (2041 or 30<br />
years). This Time Horizon is consistent with typical<br />
timeframes <strong>for</strong> planning infrastructure asset creation, and<br />
prepared of detailed project reports.<br />
The Action Horizon considers a period of 10 years from<br />
2012 to 2021 and is the time frame <strong>for</strong> the actions<br />
recommended. This Action Time Horizon is further divided<br />
into actions along Short Term – (3 years) Medium Term - (5<br />
years) and Long Term - (10 years).<br />
This document only indicates immediate required action in the following sectors, which will collectively help <strong>Nashik</strong> in becoming a fully sanitised city.<br />
Access to Toilets<br />
WasteWater<br />
Management<br />
CSP<br />
Water Supply<br />
River Pollution<br />
and Storm<br />
Water Management<br />
Solid Waste<br />
Management<br />
Governance and<br />
Institutional Framework<br />
Financial Sustainability<br />
25
PART IV: Strategies and Action <strong>Plan</strong><br />
<strong>City</strong> <strong>Sanitation</strong> <strong>Plan</strong> <strong>for</strong> <strong>Nashik</strong><br />
1: Access to Toilets<br />
<strong>Nashik</strong> has good coverage in terms of access to toilets but the major issue of concern<br />
is open defecation which is rare but prevalent in some urban poor areas. To eradicate<br />
this issue, NMC should initiate the following actions:<br />
Implement an inspection and monitoring protocol to ensure timely<br />
maintenance and consistent service delivery in existing public and<br />
community toilets<br />
Initiate development and implementation of a city-wide toilet development<br />
and rehabilitation plan to eliminate open defecation / urination within three<br />
years<br />
Implement bye-laws to levy fines <strong>for</strong> open defecation/urination and<br />
incorporate toilet specifications as part of building regulations, in consultation<br />
with the Government of Maharashtra (GoM)<br />
Initiate awareness campaigns to facilitate awareness, usage, and ownership<br />
of shared community toilet facilities at the levels of slums, communities and<br />
schools<br />
26<br />
Monetary requirements<br />
Based on a normative assessment, an estimated 2,531<br />
community toilet seats <strong>for</strong> slums and 500 public toilet<br />
seats <strong>for</strong> the floating population are needed in the<br />
medium term involving a capital investment of ` 20.88<br />
crore s. Recurring O&M cost is estimated at ` 13.71<br />
crores<br />
annually. However, assuming that 50% of the toilet complexes are managed<br />
on outsourced models, actual O&M cost burden on NMC is estimated to be at ` 6.9<br />
crore annually.<br />
Figure 38:Condition of community toilets
PART IV: Strategies and Action <strong>Plan</strong><br />
<strong>City</strong> <strong>Sanitation</strong> <strong>Plan</strong> <strong>for</strong> <strong>Nashik</strong><br />
2: WasteWater Management<br />
The issues requiring attention in this sector are: ground water pollution due to prevalence of septic tanks, lack of waste water in<strong>for</strong>mation and no reuse/recycle of waste<br />
water. To address these issues NMC should initiate following actions:<br />
I. To control ground water pollution due to prevalence of septic tanks:<br />
NMC should prepare a detailed action plan to progressively phase out septic tanks<br />
a) b) Carry out property-level assessment of prevalence of septic tanks and<br />
The phasing should start from the old city area with septic tanks which are<br />
older than 10 years. Then the septic tanks which are constructed during<br />
previous decade but are not functioning effectively will be phased out. The<br />
action plan should have provisions <strong>for</strong> people participation and awareness<br />
campaigns.<br />
collect necessary in<strong>for</strong>mation<br />
Two new vacuum suction trucks need to be purchased as the existing numbers of trucks are inadequate.<br />
Clarify and en<strong>for</strong>ce bye-laws <strong>for</strong> monitoring and regulation of on-site sanitation, in consultation with GoM.<br />
a) Monitoring will be done by the Health<br />
Department.<br />
b) c)<br />
Sanitary Inspectors will submit a monthly report<br />
to the department on the number of requests <strong>for</strong><br />
cleaning of septic tanks, amount collected, and<br />
citizens’ grievances.<br />
A provision should be made <strong>for</strong> fines/ penalties<br />
<strong>for</strong> improper disposal of septage.<br />
Based on normative assessment, the cost<br />
of provision and implementation of the<br />
above actions is estimated at ` 2.50 crores<br />
during 2011 to 2016.<br />
NEED<br />
Re-use and Recycling Cost Recovery Collection Efficiency % of area with<br />
piped network<br />
27
PART IV: Strategies and Action <strong>Plan</strong><br />
<strong>City</strong> <strong>Sanitation</strong> <strong>Plan</strong> <strong>for</strong> <strong>Nashik</strong><br />
II. To collect and maintain in<strong>for</strong>mation on wastewater, which will<br />
ultimately help in effective future planning<br />
Revise population estimates and projections based on the Census 2011<br />
population.<br />
Undertake technical improvements of the sewerage system to improve<br />
wastewater collection efficiency and optimise treatment per<strong>for</strong>mance.<br />
a) b) Initiate a Rapid Technical<br />
Purchase and install<br />
Electromagnetic Bulk Meters at<br />
STPs and sewage pumping<br />
stations to capture in<strong>for</strong>mation on<br />
wastewater flows effectively. Bulk<br />
meters should be compatible with<br />
the PLC-SCADA system to provide<br />
in<strong>for</strong>mation automatically.<br />
Assessment Study of the sewage<br />
at various places coming to STPs<br />
to understand trends in BOD<br />
levels.<br />
Capture baseline in<strong>for</strong>mation on septic tanks through a comprehensive<br />
household / property level water and sanitation survey<br />
Establish a wastewater quality monitoring protocol in coordination with<br />
MPCB<br />
III. To increase the reuse and recycling of wastewater which is of<br />
utmost importance, firstly to meet the water demands of an<br />
ever-increasing population, and secondly to conserve the<br />
available fresh water:<br />
Conduct a feasibility study <strong>for</strong> upgrading STPs and exploring various<br />
options to treat up to tertiary levels, and commission waste to energy<br />
plants.<br />
a) Treating waste water up to tertiary b)<br />
level, and reuse treated water <strong>for</strong><br />
non-potable requirements<br />
NMC has 400<br />
gardens in the<br />
city that are<br />
supplied with<br />
potable water or<br />
ground water.<br />
This could be<br />
replaced with<br />
recycled<br />
wastewater.<br />
Water<br />
requirement <strong>for</strong><br />
non-potable<br />
industrial<br />
application could<br />
be met by the<br />
tertiary treated<br />
water.<br />
Upgrading STPs and installation/<br />
rehabilitation of waste-to-energy<br />
plants at STPs through capture of<br />
methane from sewage.<br />
The energy so<br />
generated can<br />
be sufficient <strong>for</strong><br />
the daily need of<br />
STP operations<br />
and premises.<br />
The Panchak and<br />
Chehedi STPs<br />
have a gas<br />
collection system<br />
installed which<br />
needs to be<br />
properly operated<br />
by NMC.<br />
Based on normative assessment, the capital cost of implementing<br />
above actions is estimated at ` 12.5 crores during 2011 to 2016.<br />
The capital cost of implementing the above actions is estimated at<br />
` 65 crores during 2011 to 2016. The O &M expenditure of sewerage<br />
system in 2016 would be ` 36.41 crores.<br />
28
PART IV: Strategies and Action <strong>Plan</strong><br />
<strong>City</strong> <strong>Sanitation</strong> <strong>Plan</strong> <strong>for</strong> <strong>Nashik</strong><br />
3: River Pollution and storm water management<br />
Pollution of <strong>Nashik</strong>’s rivers, especially Godavari, is the main issue of concern in this sector. To address this issue, NMC should initiate the following actions:<br />
Conduct a Feasibility Study <strong>for</strong> upgrading STPs and exploring various options to treat up to tertiary levels, and commission waste to energy plants.<br />
a) Constitute a multi-stakeholder council<br />
comprising NMC, industrial areas, MPCB, and<br />
other stakeholders with support from GoM to<br />
oversee this program’s implementation.<br />
b) c)<br />
Compile, in collaboration with MIDC and MPCB,<br />
in<strong>for</strong>mation on wastewater flows into the river<br />
particularly from the industrial areas.<br />
Prepare a detailed project report on it.<br />
Implement a time-bound phased investment program to develop / rehabilitate a storm drain network in the city.<br />
The capital cost of implementing<br />
the above actions is estimated at ` 45<br />
crores during 2011 to 2016. In the<br />
long term, the recycling of<br />
wastewater and resell of water to<br />
industries, SEZs, and such on a<br />
revenue sharing basis can help in<br />
saving potable water and<br />
in turn the overall O&M cost.<br />
Figure 39: Polluted Stretch of River Godavary in <strong>Nashik</strong><br />
29
PART IV: Strategies and Action <strong>Plan</strong><br />
<strong>City</strong> <strong>Sanitation</strong> <strong>Plan</strong> <strong>for</strong> <strong>Nashik</strong><br />
4: Water Supply<br />
The water supply seems to be fairly well in the NMC region. The issue of concern in this sector is the high levels of NRW (non-revenue water) which affects the financial<br />
sustainability of the NMC. The action plan to address this issue is:<br />
NMC should improve baseline in<strong>for</strong>mation on water flows<br />
a) Install bulk meters at intake<br />
works, water treatment plants,<br />
pumping stations, and storage<br />
reservoirs.<br />
b) Initiate a drive to repair and c)<br />
maintain consumer meters.<br />
Consider implementing PLCbased<br />
SCADA system to<br />
improve the overall efficiency of<br />
monitoring intake works, WTPs<br />
and pumping stations.<br />
d) Conduct a Baseline Survey<br />
Build on the findings of the on-going water audit to launch a comprehensive city-wide NRW reduction program<br />
a) Prepare a DPR <strong>for</strong> a city-wide<br />
NRW reduction program<br />
b) Designate a NRW cell<br />
Illegal connections and faulty meters are the major reasons <strong>for</strong> a higher<br />
NRW. There<strong>for</strong>e, it is necessary <strong>for</strong> NMC, in consultation with GoM, to<br />
<strong>for</strong>mulate/en<strong>for</strong>ce a connection and disconnection policy.<br />
Based on a normative assessment, the capital cost of<br />
implementing the above actions and provisions is estimated<br />
at ` 109 crores during 2011 to 2016. Recurring O&M cost is<br />
estimated at ` 66 crores annually in 2016. In the long term,<br />
the recycling of waste water and reuse <strong>for</strong> gardening and<br />
other purposes can help in saving potable water and in turn<br />
the overall O&M cost.<br />
30<br />
Figure 40: Public stand post (PSP) in <strong>Nashik</strong>
PART IV: Strategies and Action <strong>Plan</strong><br />
<strong>City</strong> <strong>Sanitation</strong> <strong>Plan</strong> <strong>for</strong> <strong>Nashik</strong><br />
5: Solid Waste Management<br />
<strong>Nashik</strong>’s solid waste management issue includes absence of solid waste segregation (this affects the opportunity to undertake<br />
optimum processing of solid waste), and lack of comprehensive solid waste management vision.<br />
I. To address the absence of a solid waste segregation issue, NMC should undertake the following actions:<br />
Initiate segregation of waste at source in a phased manner<br />
a) NMC should select 4-5 pilot wards, undertake source segregation there <strong>for</strong> 2 b) Launch an awareness campaign<br />
months, then conduct a qualitative and quantitative analysis of the waste.<br />
Increase the frequency of door-to-door collection from every alternate day to daily wherever the service is not available by increasing its fleet of GhantaGaadis<br />
Based on a normative assessment, the capital cost of implementing<br />
the above actions is estimated at ` 9 crores during 2012 to 2015. The<br />
recurring O&M cost is estimated at ` 47 crores annually in 2016. In the<br />
long term, initiatives like energy generation from waste and increase<br />
in sale of manure from composting would increase revenues <strong>for</strong> NMC.<br />
Figure 41: Solid Waste<br />
Figure 42: Solid Waste Awareness Campaign in <strong>Nashik</strong><br />
31
PART IV: Strategies and Action <strong>Plan</strong><br />
<strong>City</strong> <strong>Sanitation</strong> <strong>Plan</strong> <strong>for</strong> <strong>Nashik</strong><br />
II. To initiate a comprehensive solid waste management, NMC should undertake the following actions:<br />
Prepare a vision <strong>for</strong> a Comprehensive Solid Waste Management Program<br />
With the target of achieving O & M cost recovery, NMC should, in consultation with GoM, incorporate bye-laws <strong>for</strong> <strong>for</strong>malising the policy<br />
a) Right to levy, collect and retain user charges. NMC should<br />
also be able to assign/transfer this right to a service provider<br />
through a contractual relationship.<br />
b)<br />
Articulate citizens’ duties with respect to maintaining a<br />
clean environment, and to fulfil obligations in<br />
implementing modern practices such as source<br />
c)<br />
Right to impose fines in case of non-compliance of citizens<br />
in their duties regarding sanitation.<br />
Based on a normative assessment, the capital cost of<br />
implementing the above actions is estimated at ` 0.5<br />
crores during 2012 to 2015.<br />
NEED<br />
32<br />
Segregation of MSW Scientific Disposal Cost recovery-SWM Collection Efficiency
PART IV: Strategies and Action <strong>Plan</strong><br />
<strong>City</strong> <strong>Sanitation</strong> <strong>Plan</strong> <strong>for</strong> <strong>Nashik</strong><br />
6: Governance and Institutional Framework<br />
<strong>Nashik</strong>’s governance and institutional framework has two main issues diffused accountability <strong>for</strong> the services,<br />
and inadequate staffing. To address these<br />
issues, a two-way approach would be required from GoM and NMC.<br />
GoM should undertake the following actions:<br />
a) GoM should actively support ULBs in implementing local level policy framework through model bye-laws and guidelines. The subjects that should be considered<br />
are as follows:<br />
Subjects <strong>for</strong> guidance manual:<br />
Public toilets configuration, sizing and operation<br />
Building regulation: Toilet sizing and specifications<br />
as part of the Building Code<br />
Subjects <strong>for</strong> Bye-laws:<br />
Groundwater management and rainwater harvesting<br />
Regulation, fixation and revision of user charges<br />
Connection and disconnection policy <strong>for</strong> water and sewerage connections<br />
On-site sanitation, decentralised treatment, and septage management<br />
b)<br />
GoM should undertake an organisation assessment of NMC<br />
NMC should undertake the following actions:<br />
a)<br />
Should strengthen the Health Department<br />
Give additional powers to the Health department such as repairs and<br />
maintenance up to ` 50 lakh per year with sanction from the Chief<br />
Engineer. Repairs above ` 50 lakh will be done by PWD as per existing<br />
practice.<br />
Appoint three deputy engineers in the Health Department <strong>for</strong> carrying<br />
out routine repairs and maintenance works.<br />
b) Consider a three-level monitoring and<br />
evaluation framework<br />
c)<br />
d)<br />
Implement training need assessment<br />
recommendations<br />
Formulate a comprehensive cost recovery<br />
and tariff policy <strong>for</strong> sanitation services to<br />
facilitate fixation, revision, and regulation of<br />
user charges <strong>for</strong> sanitation services<br />
First<br />
Level-Elected<br />
Municipal Council<br />
Second Level-<br />
Public Participation<br />
Third Level-<br />
Independent Evaluation<br />
33
PART IV: Strategies and Action <strong>Plan</strong><br />
<strong>City</strong> <strong>Sanitation</strong> <strong>Plan</strong> <strong>for</strong> <strong>Nashik</strong><br />
7: Financial Sustainability<br />
The NMC has low cost recovery which affects its financial sustainability. To address this issue, the NMC should implement the following action plan:<br />
Clarify cost recovery objectives and approach through a well-articulated and disseminated tariff policy in consultation with the GoM, and mechanisms /<br />
accountability <strong>for</strong> implementation as defined earlier.<br />
Implement a framework to track and disseminate in<strong>for</strong>mation on O&M costs of all sanitation services, particularly in the context of additional O&M costs arising as a<br />
result of implementation of ongoing and proposed projects under JNNURM.<br />
Align user charges in sanitation services with cost recovery targets enunciated in NMC’s Tariff Policy. In particular, implement the following actions towards<br />
improving cost recovery in the immediate term:<br />
a) Water Supply: Improve metering infrastructure to facilitate regular<br />
meter reading, <strong>for</strong>mulation of volumetric tariffs,<br />
and collection of user<br />
charges<br />
b) Sewerage: Implement a user charge framework <strong>for</strong> sewerage<br />
connections that are based on the volumetric usage of water<br />
c) Solid Waste management: Implement slab-based user charges to levy<br />
and collect differential levels of user charges from different categories<br />
of waste generators<br />
34
PART IV: Strategies and Action <strong>Plan</strong><br />
<strong>City</strong> <strong>Sanitation</strong> <strong>Plan</strong> <strong>for</strong> <strong>Nashik</strong><br />
A normative assessment of capital cost estimate across various sanitation components<br />
Phasing of Investment<br />
Capital Investment ( ` Lakh)<br />
Short<br />
Medium<br />
Long<br />
TOTAL<br />
Access to Public Toilets- <strong>for</strong> Slums and Floating population<br />
2,088<br />
-<br />
684<br />
2,772<br />
Water Supply<br />
8250<br />
2150<br />
0<br />
10400<br />
Waste water management<br />
3300<br />
1200<br />
0<br />
4500<br />
Storm Water Management<br />
8100<br />
200<br />
0<br />
8300<br />
Solid Waste Management<br />
2400<br />
1100<br />
0<br />
3500<br />
ISIP, Project Development and Capacity Building<br />
1350<br />
600<br />
600<br />
2550<br />
TOTAL<br />
25,488<br />
5,250<br />
1,284<br />
32,022<br />
35
PART IV: Strategies and Action <strong>Plan</strong><br />
<strong>City</strong> <strong>Sanitation</strong> <strong>Plan</strong> <strong>for</strong> <strong>Nashik</strong><br />
The estimated O&M costs <strong>for</strong> sanitation service delivery effectively translate to about ` 300 per month per household and suggest that 100% O&M cost recovery is achievable<br />
through cross subsidy to lower-income households and leveraging other potential means of revenue realization including revenues from waste recovery and from recycling<br />
/ re-use of waste water.<br />
O&M COST<br />
2012<br />
2016<br />
2021<br />
2031<br />
2041<br />
Water Supply<br />
4,417<br />
6,563<br />
10,525<br />
26,273<br />
60,324<br />
Waste Water Management<br />
2,466<br />
3,641<br />
5,755<br />
14,358<br />
33,060<br />
SWM<br />
3,108<br />
4,675<br />
7,842<br />
21,532<br />
54,612<br />
Toilets<br />
1,580<br />
1,371<br />
931<br />
1,071<br />
1,959<br />
TOTAL ( ` In Lakh)<br />
11,570<br />
16,250<br />
25,053<br />
63,234<br />
149,955<br />
Annual <strong>Sanitation</strong> O&M Cost ( ` per capita)<br />
718<br />
840<br />
1,031<br />
1,699<br />
2,859<br />
Monthly <strong>Sanitation</strong> O&M Cost ( ` per capita)<br />
60<br />
70<br />
86<br />
142<br />
238<br />
Monthly O&M cost ( ` per household)<br />
299<br />
350<br />
430<br />
708<br />
1,191<br />
36
<strong>City</strong> <strong>Sanitation</strong> Task Force<br />
Sr. No.<br />
Designation & Affiliation<br />
Name<br />
1.<br />
2.<br />
3.<br />
4.<br />
5.<br />
6.<br />
7.<br />
8.<br />
9.<br />
10.<br />
11.<br />
12.<br />
13.<br />
14.<br />
15.<br />
16.<br />
17.<br />
18.<br />
19.<br />
20.<br />
21.<br />
22.<br />
Mayor, NMC<br />
Deputy Mayor, NMC<br />
Commissioner, NMC<br />
President Standing Committee<br />
Leader of House<br />
Leader of Opposition, NMC<br />
<strong>City</strong> Engineer<br />
Superintending Engineer<br />
Medical Officer of Health (MoH)<br />
Executive Engineer (Mechanical)<br />
Public representative<br />
Public representative<br />
Public representative<br />
Pollution Control Board<br />
Journalist, <strong>Nashik</strong><br />
Industry Representative<br />
Principal, J.D.C Bytco IMSR,<br />
NGO Representative<br />
Representative, Industrial Association, <strong>Nashik</strong><br />
Representative, Maharashtra University of Health Sciences, <strong>Nashik</strong><br />
Representative, Sulbah International, <strong>Nashik</strong><br />
Representative, Union of Sanitary Workers <strong>Nashik</strong><br />
Mrs. Nayana Gholap<br />
Prof. Devyani Farandhe<br />
Mr. B.D. Sanap<br />
Mr. Sanjay Sable<br />
Mr. Sudhakar Budguar<br />
Dr. Hemlata Patil<br />
Mr. Sunil Khune,<br />
Mr. R.K. Pawar<br />
Dr. Kondiram Pawar<br />
Mr. S. S. Magare<br />
Dr. Mamata Patil<br />
Mr. Gurumit Singh Bagga<br />
Mr. Bhagwan Bhage,<br />
Regional Officer<br />
Mr. Sanjay Pathak<br />
Mr. Lokesh Shevade<br />
Dr. (Mrs.) A. A. Verulkar<br />
Mr. Milind Babar<br />
NIMA<br />
Vice Chancellor
About GIZ<br />
Deutsche Gesellschaft für Technische Zusammenarbeit (GTZ) GmbH (German Technical Cooperation) changed its name to<br />
The Deutsche Gesellschaft für Internationale Zusammenarbeit (GIZ) GmbH on 1 January 2011. It also merged with among<br />
others, InWEnt – Capacity Building International, Germany.<br />
It is owned by the German Government and works in the field of international cooperation <strong>for</strong> sustainable development. GIZ is<br />
also engaged in international education work around the globe and currently operates in more than 130 countries worldwide.<br />
GIZ in India<br />
Germany has been cooperating with India by providing expertise through the organisations now <strong>for</strong>ming GIZ <strong>for</strong> more than 50<br />
years. GIZ's joint ef<strong>for</strong>ts with the partners in India are addressing India's priority of sustainable and inclusive growth.<br />
Designed by : www.dbuddy.net