City Sanitation Plan for Nashik - SuSanA
City Sanitation Plan for Nashik - SuSanA
City Sanitation Plan for Nashik - SuSanA

Create successful ePaper yourself
Turn your PDF publications into a flip-book with our unique Google optimized e-Paper software.
PART III: <strong>Sanitation</strong> Mapping<br />
<strong>City</strong> <strong>Sanitation</strong> <strong>Plan</strong> <strong>for</strong> <strong>Nashik</strong><br />
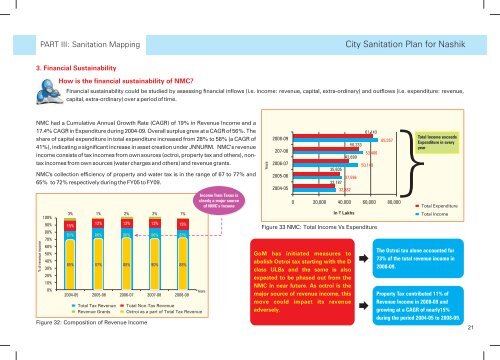
3. Financial Sustainability<br />
How is the financial sustainability of NMC?<br />
Financial sustainability could be studied by assessing financial inflows (i.e. income: revenue, capital, extra-ordinary) and outflows (i.e. expenditure: revenue,<br />
capital, extra-ordinary) over a period of time.<br />
NMC had a Cumulative Annual Growth Rate (CAGR) of 19% in Revenue Income and a<br />
17.4% CAGR in Expenditure during 2004-09. Overall surplus grew at a CAGR of 56%. The<br />
share of capital expenditure in total expenditure increased from 28% to 58% (a CAGR of<br />
41%), indicating a significant increase in asset creation under JNNURM. NMC’s revenue<br />
income consists of tax incomes from own sources (octroi, property tax and others), nontax<br />
incomes from own sources (water charges and others) and revenue grants.<br />
NMC's collection efficiency of property and water tax is in the range of 67 to 77% and<br />
65% to 72% respectively during the FY05 to FY09.<br />
% of revenue income<br />
100%<br />
90%<br />
80%<br />
70%<br />
60%<br />
50%<br />
40%<br />
30%<br />
20%<br />
10%<br />
0%<br />
3% 1% 2% 2% 1%<br />
12% 12% 12%<br />
15% 15%<br />
81%<br />
86% 86% 86% 83%<br />
85% 87% 88% 90% 88%<br />
2004-05 2005-06 2006-07 2007-08 2008-09<br />
Total Tax Revenue<br />
Revenue Grants<br />
Figure 32: Composition of Revenue Income<br />
Total Non-Tax Revenue<br />
Octroi as a part of Total Tax Revenue<br />
Income from Taxes is<br />
clearly a major source<br />
of NMC’s Income<br />
Years<br />
Years<br />
2008-09<br />
207-08<br />
2006-07<br />
2005-06<br />
2004-05<br />
35,605<br />
37,596<br />
32,187<br />
32,882<br />
0 20,000 40,000 60,000 80,000<br />
In ` Lakhs<br />
50,233<br />
42,699<br />
61,143<br />
53,406<br />
50,149<br />
Figure 33 NMC: Total Income Vs Expenditure<br />
GoM has initiated measures to<br />
abolish Octroi tax starting with the D<br />
class ULBs and the same is also<br />
expected to be phased out from the<br />
NMC in near future. As octroi is the<br />
major source of revenue income, this<br />
move could impact its revenue<br />
adversely.<br />
65,357<br />
}Total Income exceeds<br />
Expenditure in every<br />
year<br />
Total Expenditure<br />
Total Income<br />
The Octroi tax alone accounted <strong>for</strong><br />
73% of the total revenue income in<br />
2008-09.<br />
Property Tax contributed 11% of<br />
Revenue Income in 2008-09 and<br />
growing at a CAGR of nearly15%<br />
during the period 2004-05 to 2008-09.<br />
21