Global cost-benefit analysis of water supply and sanitation ... - SuSanA
Global cost-benefit analysis of water supply and sanitation ... - SuSanA
Global cost-benefit analysis of water supply and sanitation ... - SuSanA

You also want an ePaper? Increase the reach of your titles
YUMPU automatically turns print PDFs into web optimized ePapers that Google loves.
493 Guy Hutton et al. | <strong>Global</strong> <strong>cost</strong>-<strong>benefit</strong> <strong>analysis</strong> <strong>of</strong> <strong>water</strong> <strong>supply</strong> <strong>and</strong> <strong>sanitation</strong> interventions Journal <strong>of</strong> Water <strong>and</strong> Health | 05.4 | 2007<br />
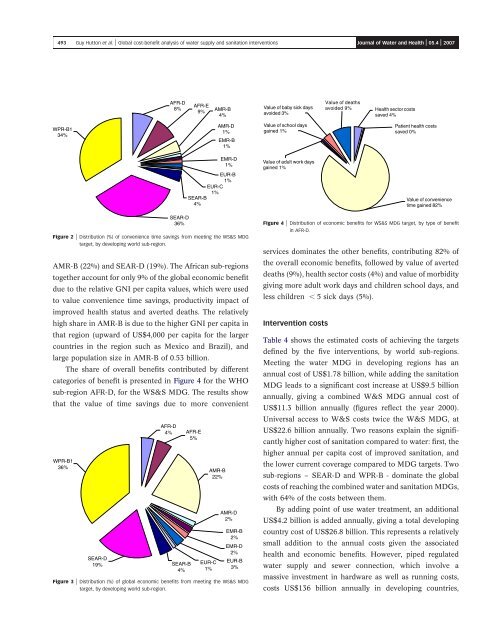
Figure 2 | Distribution (%) <strong>of</strong> convenience time savings from meeting the WS&S MDG<br />
target, by developing world sub-region.<br />
AMR-B (22%) <strong>and</strong> SEAR-D (19%). The African sub-regions<br />
together account for only 9% <strong>of</strong> the global economic <strong>benefit</strong><br />
due to the relative GNI per capita values, which were used<br />
to value convenience time savings, productivity impact <strong>of</strong><br />
improved health status <strong>and</strong> averted deaths. The relatively<br />
high share in AMR-B is due to the higher GNI per capita in<br />
that region (upward <strong>of</strong> US$4,000 per capita for the larger<br />
countries in the region such as Mexico <strong>and</strong> Brazil), <strong>and</strong><br />
large population size in AMR-B <strong>of</strong> 0.53 billion.<br />
The share <strong>of</strong> overall <strong>benefit</strong>s contributed by different<br />
categories <strong>of</strong> <strong>benefit</strong> is presented in Figure 4 for the WHO<br />
sub-region AFR-D, for the WS&S MDG. The results show<br />
that the value <strong>of</strong> time savings due to more convenient<br />
Figure 3 | Distribution (%) <strong>of</strong> global economic <strong>benefit</strong>s from meeting the WS&S MDG<br />
target, by developing world sub-region.<br />
Figure 4 | Distribution <strong>of</strong> economic <strong>benefit</strong>s for WS&S MDG target, by type <strong>of</strong> <strong>benefit</strong><br />
in AFR-D.<br />
services dominates the other <strong>benefit</strong>s, contributing 82% <strong>of</strong><br />
the overall economic <strong>benefit</strong>s, followed by value <strong>of</strong> averted<br />
deaths (9%), health sector <strong>cost</strong>s (4%) <strong>and</strong> value <strong>of</strong> morbidity<br />
giving more adult work days <strong>and</strong> children school days, <strong>and</strong><br />
less children , 5 sick days (5%).<br />
Intervention <strong>cost</strong>s<br />
Table 4 shows the estimated <strong>cost</strong>s <strong>of</strong> achieving the targets<br />
defined by the five interventions, by world sub-regions.<br />
Meeting the <strong>water</strong> MDG in developing regions has an<br />
annual <strong>cost</strong> <strong>of</strong> US$1.78 billion, while adding the <strong>sanitation</strong><br />
MDG leads to a significant <strong>cost</strong> increase at US$9.5 billion<br />
annually, giving a combined W&S MDG annual <strong>cost</strong> <strong>of</strong><br />
US$11.3 billion annually (figures reflect the year 2000).<br />
Universal access to W&S <strong>cost</strong>s twice the W&S MDG, at<br />
US$22.6 billion annually. Two reasons explain the significantly<br />
higher <strong>cost</strong> <strong>of</strong> <strong>sanitation</strong> compared to <strong>water</strong>: first, the<br />
higher annual per capita <strong>cost</strong> <strong>of</strong> improved <strong>sanitation</strong>, <strong>and</strong><br />
the lower current coverage compared to MDG targets. Two<br />
sub-regions – SEAR-D <strong>and</strong> WPR-B - dominate the global<br />
<strong>cost</strong>s <strong>of</strong> reaching the combined <strong>water</strong> <strong>and</strong> <strong>sanitation</strong> MDGs,<br />
with 64% <strong>of</strong> the <strong>cost</strong>s between them.<br />
By adding point <strong>of</strong> use <strong>water</strong> treatment, an additional<br />
US$4.2 billion is added annually, giving a total developing<br />
country <strong>cost</strong> <strong>of</strong> US$26.8 billion. This represents a relatively<br />
small addition to the annual <strong>cost</strong>s given the associated<br />
health <strong>and</strong> economic <strong>benefit</strong>s. However, piped regulated<br />
<strong>water</strong> <strong>supply</strong> <strong>and</strong> sewer connection, which involve a<br />
massive investment in hardware as well as running <strong>cost</strong>s,<br />
<strong>cost</strong>s US$136 billion annually in developing countries,