Traffic Statistics Jan-Sep 2003 - Swiss
Traffic Statistics Jan-Sep 2003 - Swiss
Traffic Statistics Jan-Sep 2003 - Swiss
You also want an ePaper? Increase the reach of your titles
YUMPU automatically turns print PDFs into web optimized ePapers that Google loves.
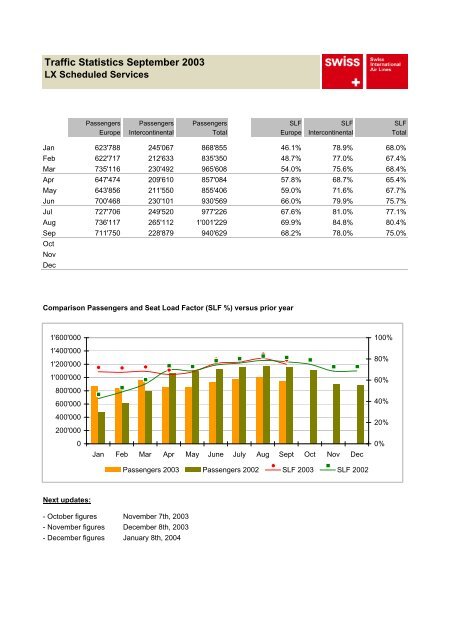
<strong>Traffic</strong> <strong>Statistics</strong> <strong>Sep</strong>tember <strong>2003</strong><br />
LX Scheduled Services<br />
Passengers Passengers Passengers SLF SLF SLF<br />
Europe Intercontinental Total Europe Intercontinental Total<br />
<strong>Jan</strong> 623'788 245'067 868'855 46.1% 78.9% 68.0%<br />
Feb 622'717 212'633 835'350 48.7% 77.0% 67.4%<br />
Mar 735'116 230'492 965'608 54.0% 75.6% 68.4%<br />
Apr 647'474 209'610 857'084 57.8% 68.7% 65.4%<br />
May 643'856 211'550 855'406 59.0% 71.6% 67.7%<br />
Jun 700'468 230'101 930'569 66.0% 79.9% 75.7%<br />
Jul 727'706 249'520 977'226 67.6% 81.0% 77.1%<br />
Aug 736'117 265'112 1'001'229 69.9% 84.8% 80.4%<br />
<strong>Sep</strong> 711'750 228'879 940'629 68.2% 78.0% 75.0%<br />
Oct 0 0 0 0.0% 0.0% 0.0%<br />
Nov 0 0 0 0.0% 0.0% 0.0%<br />
Dec 0 0 0 0.0% 0.0% 0.0%<br />
Comparison Passengers and Seat Load Factor (SLF %) versus prior year<br />
1'600'000<br />
1'400'000<br />
1'200'000<br />
1'000'000<br />
800'000<br />
600'000<br />
400'000<br />
200'000<br />
0<br />
<strong>Jan</strong> Feb Mar Apr May June July Aug <strong>Sep</strong>t Oct Nov Dec<br />
Passengers <strong>2003</strong> Passengers 2002 SLF <strong>2003</strong> SLF 2002<br />
100%<br />
80%<br />
60%<br />
40%<br />
20%<br />
0%<br />
Next updates:<br />
- October figures November 7th, <strong>2003</strong><br />
- November figures December 8th, <strong>2003</strong><br />
- December figures <strong>Jan</strong>uary 8th, 2004
<strong>Traffic</strong> <strong>Statistics</strong> <strong>Sep</strong>tember <strong>2003</strong><br />
European and Intercontinental <strong>Traffic</strong> Development<br />
Passengers and Seat Load Factor (SLF%) European Business<br />
Comparison versus prior year<br />
1'200'000<br />
1'000'000<br />
800'000<br />
600'000<br />
400'000<br />
200'000<br />
0<br />
<strong>Jan</strong> Feb Mar Apr May Jun Jul Aug <strong>Sep</strong> Oct Nov Dec<br />
Passengers Europe <strong>2003</strong> Passengers Europe 2002<br />
SLF Europe <strong>2003</strong> SLF Europe 2002<br />
100%<br />
80%<br />
60%<br />
40%<br />
20%<br />
0%<br />
Passengers and Seat Load Factor (SLF%) Intercontinental Business<br />
Comparison versus prior year<br />
400'000<br />
350'000<br />
300'000<br />
250'000<br />
200'000<br />
150'000<br />
100'000<br />
50'000<br />
0<br />
<strong>Jan</strong> Feb Mar Apr May Jun Jul Aug <strong>Sep</strong> Oct Nov Dec<br />
Passengers Intercontinental <strong>2003</strong> Passengers Intercontinental 2002<br />
SLF Intercontinental August 7th, <strong>2003</strong> <strong>2003</strong><br />
SLF Intercontinental 2002<br />
100%<br />
80%<br />
60%<br />
40%<br />
20%<br />
0%
<strong>Traffic</strong> <strong>Statistics</strong> <strong>Jan</strong>uary <strong>Jan</strong>uary 2002 <strong>2003</strong><br />
LX Scheduled Services<br />
<strong>Jan</strong>uary<br />
Cumulative<br />
<strong>2003</strong> 2002 <strong>2003</strong> 2002<br />
Number of Passengers 1)<br />
Europe 623'788 477'227 30.7% 623'788 477'227 30.7%<br />
Intercontinental 245'067 0 245'067 0<br />
Total 868'855 477'227 82.1% 868'855 477'227 82.1%<br />
Flights<br />
Europe 17'314 15'335 12.9% 17'314 15'335 12.9%<br />
Intercontinental 1'836 0 1'836 0<br />
Total 19'150 15'335 24.9% 19'150 15'335 24.9%<br />
Available Seat km (ASK, in mio)<br />
Europe 1'043 773 35.0% 1'043 773 35.0%<br />
Intercontinental 2'094 0 2'094 0<br />
Total 3'136 773 305.9% 3'136 773 305.9%<br />
Revenue Passenger km (RPK, in mio)<br />
Europe 480 329 46.0% 480 329 46.0%<br />
Intercontinental 1'651 0 1'651 0<br />
Total 2'131 329 548.0% 2'131 329 548.0%<br />
Seat Load Factor (SLF, %) 2)<br />
Europe 46.1% 42.6% 3.5% 46.1% 42.6% 3.5%<br />
Intercontinental 78.9% - 78.9% -<br />
Total 68.0% 42.6% 25.4% 68.0% 42.6% 25.4%<br />
Freight Load Factor Volume (FLF, %) 3)<br />
Intercontinental 77.9% 0 83.4% 0<br />
Freight Tonnes Kilometers (FTK, in 1000)<br />
Intercontinental 106'301 0 106'301 0<br />
1) Revenue Passengers<br />
2) SLF = RPK / ASK<br />
deviation in % pts<br />
3) deviation in % pts
<strong>Traffic</strong> <strong>Statistics</strong> <strong>Jan</strong>uary February 2002 <strong>2003</strong><br />
LX Scheduled Services<br />
February<br />
Cumulative<br />
<strong>2003</strong> 2002 <strong>2003</strong> 2002<br />
Number of Passengers 1)<br />
Europe 622'717 621'865 0.1% 1'246'505 621'865 100.4%<br />
Intercontinental 212'633 0 457'700 0<br />
Total 835'350 621'865 34.3% 1'704'205 621'865 174.0%<br />
Flights<br />
Europe 16'171 15'898 1.7% 33'485 15'898 110.6%<br />
Intercontinental 1'642 0 3'478 0<br />
Total 17'813 15'898 12.0% 36'963 15'898 132.5%<br />
Available Seat km (ASK, in mio)<br />
Europe 957 928 3.2% 2'000 928 115.6%<br />
Intercontinental 1'875 0 3'968 0<br />
Total 2'832 928 205.3% 5'968 928 543.3%<br />
Revenue Passenger km (RPK, in mio)<br />
Europe 466 452 3.2% 947 452 109.5%<br />
Intercontinental 1'443 0 3'094 0<br />
Total 1'910 452 322.6% 4'041 452 794.2%<br />
Seat Load Factor (SLF, %) 2)<br />
Europe 48.7% 48.7% 0.0% 47.3% 48.7% -1.4%<br />
Intercontinental 77.0% - 78.0% -<br />
Total 67.4% 48.7% 18.7% 67.7% 48.7% 19.0%<br />
Freight Load Factor Volume (FLF, %) 3)<br />
Intercontinental 86.0% 0 83.6% 0<br />
Freight Tonnes Kilometers (FTK, in 1000)<br />
Intercontinental 108'934 0 215'235 0<br />
1) Revenue Passengers<br />
2) SLF = RPK / ASK<br />
deviation in % pts<br />
3) deviation in % pts
<strong>Traffic</strong> <strong>Statistics</strong> March <strong>2003</strong><br />
LX Scheduled Services<br />
March<br />
Cumulative<br />
<strong>2003</strong> 2002 <strong>2003</strong> 2002<br />
Number of Passengers 1)<br />
Europe 735'116 792'601 -7.3% 1'981'621 1'891'693 4.8%<br />
Intercontinental 230'492 0 688'192 0<br />
Total 965'608 792'601 21.8% 2'669'813 1'891'693 41.1%<br />
Flights<br />
Europe 17'770 17'593 1.0% 51'255 48'826 5.0%<br />
Intercontinental 1'819 0 5'297 0<br />
Total 19'589 17'593 11.3% 56'552 48'826 15.8%<br />
Available Seat km (ASK, in mio)<br />
Europe 1'044 1'105 -5.5% 3'044 2'805 8.5%<br />
Intercontinental 2'087 0 6'056 0<br />
Total 3'132 1'105 183.5% 9'100 2'805 224.4%<br />
Revenue Passenger km (RPK, in mio)<br />
Europe 563 623 -9.6% 1'510 1'404 7.6%<br />
Intercontinental 1'578 0 4'672 0<br />
Total 2'141 623 243.6% 6'182 1'404 340.3%<br />
Seat Load Factor (SLF, %) 2)<br />
Europe 54.0% 56.4% -2.5% 49.6% 50.1% -0.5%<br />
Intercontinental 75.6% - 77.2% -<br />
Total 68.4% 56.4% 12.0% 67.9% 50.1% 17.9%<br />
Freight Load Factor Volume (FLF, %) 3)<br />
Intercontinental 87.4% 0 83.9% 0<br />
Freight Tonnes Kilometers (FTK, in 1000)<br />
Intercontinental 120'393 0 335'628 0<br />
1) Revenue Passengers<br />
2) SLF = RPK / ASK<br />
deviation in % pts<br />
3) deviation in % pts
<strong>Traffic</strong> <strong>Statistics</strong> April <strong>2003</strong><br />
LX Scheduled Services<br />
April<br />
Cumulative<br />
<strong>2003</strong> 2002 <strong>2003</strong> 2002<br />
Number of Passengers 1)<br />
Europe 647'474 823'402 -21.4% 2'629'095 2'715'095 -3.2%<br />
Intercontinental 209'610 237'170 -11.6% 897'802 237'170 278.5%<br />
Total 857'084 1'060'572 -19.2% 3'526'897 2'952'265 19.5%<br />
Flights<br />
Europe 14'025 17'419 -19.5% 65'280 66'245 -1.5%<br />
Intercontinental 1'727 1'852 -6.7% 7'024 1'852 279.3%<br />
Total 15'752 19'271 -18.3% 72'304 68'097 6.2%<br />
Available Seat km (ASK, in mio)<br />
Europe 867 1'087 -20.3% 3'911 3'892 0.5%<br />
Intercontinental 2'010 2'075 -3.1% 8'066 2'075 288.8%<br />
Total 2'877 3'162 -9.0% 11'977 5'967 100.7%<br />
Revenue Passenger km (RPK, in mio)<br />
Europe 501 627 -20.1% 2'011 2'031 -1.0%<br />
Intercontinental 1'381 1'570 -12.0% 6'054 1'570 285.5%<br />
Total 1'882 2'197 -14.3% 8'065 3'601 124.0%<br />
Seat Load Factor (SLF, %) 2)<br />
Europe 57.8% 57.6% 0.2% 51.4% 52.2% -0.8%<br />
Intercontinental 68.7% 75.7% -7.0% 75.1% 75.7% -0.6%<br />
Total 65.4% 69.5% -4.1% 67.3% 60.4% 7.0%<br />
Freight Load Factor Volume (FLF, %) 3)<br />
Intercontinental 82.6% 79.2% 3.4% 83.8% 79.2% 4.6%<br />
Freight Tonnes Kilometers (FTK, in 1000)<br />
Intercontinental 116'773 104'220 12.0% 452'401 104'220 334.1%<br />
1) Revenue Passengers<br />
2) SLF = RPK / ASK<br />
deviation in % pts<br />
3) deviation in % pts
<strong>Traffic</strong> <strong>Statistics</strong> May <strong>2003</strong><br />
LX Scheduled Services<br />
May<br />
Cumulative<br />
<strong>2003</strong> 2002 <strong>2003</strong> 2002<br />
Number of Passengers 1)<br />
Europe 643'856 849'032 -24.2% 3'272'951 3'564'127 -8.2%<br />
Intercontinental 211'550 242'124 -12.6% 1'109'352 479'294 131.5%<br />
Total 855'406 1'091'156 -21.6% 4'382'303 4'043'421 8.4%<br />
Flights<br />
Europe 14'297 18'121 -21.1% 79'577 84'366 -5.7%<br />
Intercontinental 1'715 1'918 -10.6% 8'739 3'770 131.8%<br />
Total 16'012 20'039 -20.1% 88'316 88'136 0.2%<br />
Available Seat km (ASK, in mio)<br />
Europe 846 1'129 -25.0% 4'757 5'021 -5.2%<br />
Intercontinental 1'936 2'165 -10.6% 10'002 4'240 135.9%<br />
Total 2'782 3'294 -15.5% 14'759 9'261 59.4%<br />
Revenue Passenger km (RPK, in mio)<br />
Europe 499 656 -23.9% 2'510 2'686 -6.6%<br />
Intercontinental 1'386 1'611 -14.0% 7'440 3'181 133.9%<br />
Total 1'885 2'266 -16.8% 9'950 5'867 69.6%<br />
Seat Load Factor (SLF, %) 2)<br />
Europe 59.0% 58.1% 0.9% 52.8% 53.5% -0.7%<br />
Intercontinental 71.6% 74.4% -2.8% 74.4% 75.0% -0.7%<br />
Total 67.7% 68.8% -1.1% 67.4% 63.4% 4.1%<br />
Freight Load Factor Volume (FLF, %) 3)<br />
Intercontinental 85.5% 80.2% 5.3% 84.0% 79.7% 4.3%<br />
Freight Tonnes Kilometers (FTK, in 1000)<br />
Intercontinental 110'594 116'131 -4.8% 562'995 220'351 155.5%<br />
1) Revenue Passengers<br />
2) SLF = RPK / ASK<br />
deviation in % pts<br />
3) deviation in % pts
<strong>Traffic</strong> <strong>Statistics</strong> June <strong>2003</strong><br />
LX Scheduled Services<br />
June<br />
Cumulative<br />
<strong>2003</strong> 2002 <strong>2003</strong> 2002<br />
Number of Passengers 1)<br />
Europe 700'468 871'989 -19.7% 3'973'419 4'436'116 -10.4%<br />
Intercontinental 230'101 254'207 -9.5% 1'339'453 733'501 82.6%<br />
Total 930'569 1'126'196 -17.4% 5'312'872 5'169'617 2.8%<br />
Flights<br />
Europe 13'978 17'799 -21.5% 93'555 102'165 -8.4%<br />
Intercontinental 1'686 1'863 -9.5% 10'425 5'633 85.1%<br />
Total 15'664 19'662 -20.3% 103'980 107'798 -3.5%<br />
Available Seat km (ASK, in mio)<br />
Europe 828 1'099 -24.7% 5'585 6'120 -8.7%<br />
Intercontinental 1'892 2'100 -9.9% 11'894 6'339 87.6%<br />
Total 2'719 3'199 -15.0% 17'479 12'459 40.3%<br />
Revenue Passenger km (RPK, in mio)<br />
Europe 546 681 -19.8% 3'056 3'367 -9.2%<br />
Intercontinental 1'511 1'692 -10.7% 8'951 4'873 83.7%<br />
Total 2'057 2'373 -13.3% 12'007 8'240 45.7%<br />
Seat Load Factor (SLF, %) 2)<br />
Europe 66.0% 62.0% 4.0% 54.7% 55.0% -0.3%<br />
Intercontinental 79.9% 80.6% -0.7% 75.3% 76.9% -1.6%<br />
Total 75.7% 74.2% 1.5% 68.7% 66.1% 2.6%<br />
Freight Load Factor Volume (FLF, %) 3)<br />
Intercontinental 84.5% 86.0% -1.5% 84.0% 81.8% 2.2%<br />
Freight Tonnes Kilometers (FTK, in 1000)<br />
Intercontinental 106'280 128'052 -17.0% 669'275 348'403 92.1%<br />
1) Revenue Passengers<br />
2) SLF = RPK / ASK<br />
deviation in % pts<br />
3) deviation in % pts
<strong>Traffic</strong> <strong>Statistics</strong> July <strong>2003</strong><br />
LX Scheduled Services<br />
July<br />
Cumulative<br />
<strong>2003</strong> 2002 <strong>2003</strong> 2002<br />
Number of Passengers 1)<br />
Europe 727'706 886'661 -17.9% 4'701'125 5'322'777 -11.7%<br />
Intercontinental 249'520 271'995 -8.3% 1'588'973 1'005'496 58.0%<br />
Total 977'226 1'158'656 -15.7% 6'290'098 6'328'273 -0.6%<br />
Flights<br />
Europe 14'286 18'448 -22.6% 107'841 120'613 -10.6%<br />
Intercontinental 1'771 1'924 -8.0% 12'196 7'557 61.4%<br />
Total 16'057 20'372 -21.2% 120'037 128'170 -6.3%<br />
Available Seat km (ASK, in mio)<br />
Europe 850 1'117 -23.9% 6'435 7'237 -11.1%<br />
Intercontinental 2'015 2'171 -7.2% 13'909 8'510 63.4%<br />
Total 2'865 3'287 -12.9% 20'343 15'747 29.2%<br />
Revenue Passenger km (RPK, in mio)<br />
Europe 575 709 -18.9% 3'631 4'076 -10.9%<br />
Intercontinental 1'633 1'793 -8.9% 10'584 6'666 58.8%<br />
Total 2'207 2'502 -11.8% 14'215 10'742 32.3%<br />
Seat Load Factor (SLF, %) 2)<br />
Europe 67.6% 63.5% 4.1% 56.4% 56.3% 0.1%<br />
Intercontinental 81.0% 82.6% -1.6% 76.1% 78.3% -2.2%<br />
Total 77.1% 76.1% 0.9% 69.9% 68.2% 1.7%<br />
Freight Load Factor Volume (FLF, %) 3)<br />
Intercontinental 83.7% 83.7% 0.0% 84.0% 82.3% 1.7%<br />
Freight Tonnes Kilometers (FTK, in 1000)<br />
Intercontinental 99'370 120'594 -17.6% 768'645 468'997 63.9%<br />
1) Revenue Passengers<br />
2) SLF = RPK / ASK<br />
deviation in % pts<br />
3) deviation in % pts
<strong>Traffic</strong> <strong>Statistics</strong> August <strong>2003</strong><br />
LX Scheduled Services<br />
August<br />
Cumulative<br />
<strong>2003</strong> 2002 <strong>2003</strong> 2002<br />
Number of Passengers 1)<br />
Europe 736'117 885'074 -16.8% 5'437'242 6'207'851 -12.4%<br />
Intercontinental 265'112 287'683 -7.8% 1'854'085 1'293'179 43.4%<br />
Total 1'001'229 1'172'757 -14.6% 7'291'327 7'501'030 -2.8%<br />
Flights<br />
Europe 13'864 18'390 -24.6% 121'705 139'003 -12.4%<br />
Intercontinental 1'803 1'930 -6.6% 13'999 9'487 47.6%<br />
Total 15'667 20'320 -22.9% 135'704 148'490 -8.6%<br />
Available Seat km (ASK, in mio)<br />
Europe 847 1'115 -24.1% 7'282 8'352 -12.8%<br />
Intercontinental 2'034 2'168 -6.2% 15'943 10'678 49.3%<br />
Total 2'881 3'284 -12.3% 23'224 19'030 22.0%<br />
Revenue Passenger km (RPK, in mio)<br />
Europe 592 711 -16.7% 4'223 4'787 -11.8%<br />
Intercontinental 1'725 1'871 -7.8% 12'309 8'537 44.2%<br />
Total 2'317 2'581 -10.3% 16'531 13'324 24.1%<br />
Seat Load Factor (SLF, %) 2)<br />
Europe 69.9% 63.7% 6.2% 58.0% 57.3% 0.7%<br />
Intercontinental 84.8% 86.3% -1.5% 77.2% 79.9% -2.7%<br />
Total 80.4% 78.6% 1.8% 71.2% 70.0% 1.2%<br />
Freight Load Factor Volume (FLF, %) 3)<br />
Intercontinental 79.7% 82.1% -2.4% 83.7% 82.2% 1.5%<br />
Freight Tonnes Kilometers (FTK, in 1000)<br />
Intercontinental 97'449 112'189 -13.1% 866'094 581'186 49.0%<br />
1) Revenue Passengers<br />
2) SLF = RPK / ASK<br />
deviation in % pts<br />
3) deviation in % pts
<strong>Traffic</strong> <strong>Statistics</strong> <strong>Sep</strong>tember <strong>2003</strong><br />
LX Scheduled Services<br />
<strong>Sep</strong>tember<br />
Cumulative<br />
<strong>2003</strong> 2002 <strong>2003</strong> 2002<br />
Number of Passengers 1)<br />
Europe 711'750 886'302 -19.7% 6'148'992 7'094'153 -13.3%<br />
Intercontinental 228'879 267'131 -14.3% 2'082'964 1'560'310 33.5%<br />
Total 940'629 1'153'433 -18.4% 8'231'956 8'654'463 -4.9%<br />
Flights<br />
Europe 13'288 17'959 -26.0% 134'993 156'962 -14.0%<br />
Intercontinental 1'676 1'859 -9.8% 15'675 11'346 38.2%<br />
Total 14'964 19'818 -24.5% 150'668 168'308 -10.5%<br />
Available Seat km (ASK, in mio)<br />
Europe 811 1'080 -24.9% 8'092 9'432 -14.2%<br />
Intercontinental 1'878 2'089 -10.1% 17'821 12'767 39.6%<br />
Total 2'689 3'169 -15.1% 25'913 22'199 16.7%<br />
Revenue Passenger km (RPK, in mio)<br />
Europe 553 689 -19.8% 4'776 5'476 -12.8%<br />
Intercontinental 1'465 1'760 -16.7% 13'774 10'297 33.8%<br />
Total 2'018 2'449 -17.6% 18'549 15'773 17.6%<br />
Seat Load Factor (SLF, %) 2)<br />
Europe 68.2% 63.8% 4.4% 59.0% 58.1% 1.0%<br />
Intercontinental 78.0% 84.2% -6.2% 77.3% 80.6% -3.4%<br />
Total 75.0% 77.3% -2.3% 71.6% 71.0% 0.5%<br />
Estimate Freight Load Factor Volume (FLF, %) 3)<br />
Intercontinental 85.0% 86.9% -1.9% 83.0%<br />
Estimate Freight Tonnes Kilometers (FTK, in 1000)<br />
Intercontinental 103'777 111'190 -6.7% 969'871 692'376 40.1%<br />
1) Revenue Passengers<br />
2) SLF = RPK / ASK<br />
deviation in % pts<br />
3) deviation in % pts
<strong>Traffic</strong> <strong>Statistics</strong> October <strong>2003</strong><br />
LX Scheduled Services<br />
October<br />
Cumulative<br />
<strong>2003</strong> 2002 <strong>2003</strong> 2002<br />
Number of Passengers 1)<br />
Europe 847'411 7'941'564<br />
Intercontinental 269'482 1'829'792<br />
Total 1'116'893 9'771'356<br />
Flights<br />
Europe 18'446 175'408<br />
Intercontinental 1'924 13'270<br />
Total 20'370 188'678<br />
Available Seat km (ASK, in mio)<br />
Europe 1'091 10'523<br />
Intercontinental 2'124 14'891<br />
Total 3'214 25'414<br />
Revenue Passenger km (RPK, in mio)<br />
Europe 647 6'123<br />
Intercontinental 1'763 12'060<br />
Total 2'411 18'183<br />
Seat Load Factor (SLF, %) 2)<br />
Europe 59.3% 58.2%<br />
Intercontinental 83.0% 81.0%<br />
Total 75.0% 71.5%<br />
Freight Load Factor Volume (FLF, %) 3)<br />
Intercontinental 87.9% 83.7%<br />
Freight Tonnes Kilometers (FTK, in 1000)<br />
Intercontinental 121'872 814'248<br />
1) Revenue Passengers<br />
2) SLF = RPK / ASK<br />
deviation in % pts<br />
3) deviation in % pts
<strong>Traffic</strong> <strong>Statistics</strong> November <strong>2003</strong><br />
LX Scheduled Services<br />
November<br />
Cumulative<br />
<strong>2003</strong> 2002 <strong>2003</strong> 2002<br />
Number of Passengers 1)<br />
Europe 671'034 8'612'598<br />
Intercontinental 234'764 2'064'556<br />
Total 905'798 10'677'154<br />
Flights<br />
Europe 17'443 192'851<br />
Intercontinental 1'800 15'070<br />
Total 19'243 207'921<br />
Available Seat km (ASK, in mio)<br />
Europe 1'025 11'548<br />
Intercontinental 2'019 16'910<br />
Total 3'044 28'458<br />
Revenue Passenger km (RPK, in mio)<br />
Europe 506 6'629<br />
Intercontinental 1'579 13'639<br />
Total 2'085 20'268<br />
Seat Load Factor (SLF, %) 2)<br />
Europe 49.4% 57.4%<br />
Intercontinental 78.2% 80.7%<br />
Total 68.5% 71.2%<br />
Freight Load Factor Volume (FLF, %) 3)<br />
Intercontinental 86.1% 84.0%<br />
Freight Tonnes Kilometers (FTK, in 1000)<br />
Intercontinental 115'990 930'238<br />
1) Revenue Passengers<br />
2) SLF = RPK / ASK<br />
deviation in % pts<br />
3) deviation in % pts
<strong>Traffic</strong> <strong>Statistics</strong> December <strong>2003</strong><br />
LX Scheduled Services<br />
December<br />
Cumulative<br />
<strong>2003</strong> 2002 <strong>2003</strong> 2002<br />
Number of Passengers 1)<br />
Europe 655'714 9'268'312<br />
Intercontinental 236'885 2'301'441<br />
Total 892'599 11'569'753<br />
Flights<br />
Europe 16'866 209'717<br />
Intercontinental 1'826 16'896<br />
Total 18'692 226'613<br />
Available Seat km (ASK, in mio)<br />
Europe 1'009 12'557<br />
Intercontinental 2'053 18'963<br />
Total 3'061 31'520<br />
Revenue Passenger km (RPK, in mio)<br />
Europe 511 7'141<br />
Intercontinental 1'591 15'230<br />
Total 2'102 22'371<br />
Seat Load Factor (SLF, %) 2)<br />
Europe 50.7% 56.9%<br />
Intercontinental 77.5% 80.3%<br />
Total 68.7% 71.0%<br />
Freight Load Factor Volume (FLF, %) 3)<br />
Intercontinental 83.8% 84.0%<br />
Freight Tonnes Kilometers (FTK, in 1000)<br />
Intercontinental 110'052 1'040'290<br />
1) Revenue Passengers<br />
2) SLF = RPK / ASK<br />
deviation in % pts<br />
3) deviation in % pts


