Traffic Statistics Jan-Sep 2003 - Swiss
Traffic Statistics Jan-Sep 2003 - Swiss
Traffic Statistics Jan-Sep 2003 - Swiss

You also want an ePaper? Increase the reach of your titles
YUMPU automatically turns print PDFs into web optimized ePapers that Google loves.
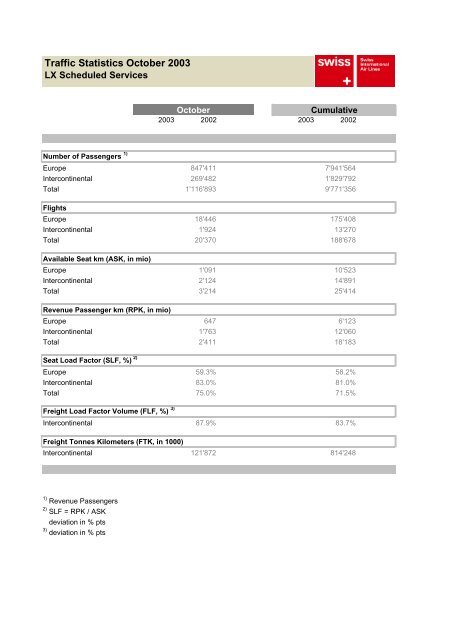
<strong>Traffic</strong> <strong>Statistics</strong> October <strong>2003</strong><br />
LX Scheduled Services<br />
October<br />
Cumulative<br />
<strong>2003</strong> 2002 <strong>2003</strong> 2002<br />
Number of Passengers 1)<br />
Europe 847'411 7'941'564<br />
Intercontinental 269'482 1'829'792<br />
Total 1'116'893 9'771'356<br />
Flights<br />
Europe 18'446 175'408<br />
Intercontinental 1'924 13'270<br />
Total 20'370 188'678<br />
Available Seat km (ASK, in mio)<br />
Europe 1'091 10'523<br />
Intercontinental 2'124 14'891<br />
Total 3'214 25'414<br />
Revenue Passenger km (RPK, in mio)<br />
Europe 647 6'123<br />
Intercontinental 1'763 12'060<br />
Total 2'411 18'183<br />
Seat Load Factor (SLF, %) 2)<br />
Europe 59.3% 58.2%<br />
Intercontinental 83.0% 81.0%<br />
Total 75.0% 71.5%<br />
Freight Load Factor Volume (FLF, %) 3)<br />
Intercontinental 87.9% 83.7%<br />
Freight Tonnes Kilometers (FTK, in 1000)<br />
Intercontinental 121'872 814'248<br />
1) Revenue Passengers<br />
2) SLF = RPK / ASK<br />
deviation in % pts<br />
3) deviation in % pts