Traffic Statistics Jan-Sep 2003 - Swiss
Traffic Statistics Jan-Sep 2003 - Swiss
Traffic Statistics Jan-Sep 2003 - Swiss

Create successful ePaper yourself
Turn your PDF publications into a flip-book with our unique Google optimized e-Paper software.
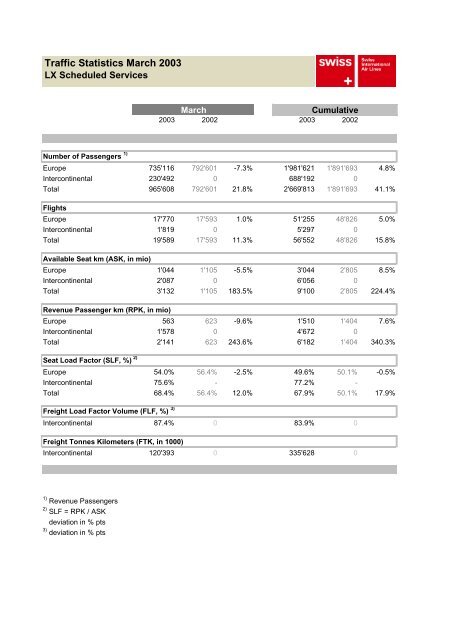
<strong>Traffic</strong> <strong>Statistics</strong> March <strong>2003</strong><br />
LX Scheduled Services<br />
March<br />
Cumulative<br />
<strong>2003</strong> 2002 <strong>2003</strong> 2002<br />
Number of Passengers 1)<br />
Europe 735'116 792'601 -7.3% 1'981'621 1'891'693 4.8%<br />
Intercontinental 230'492 0 688'192 0<br />
Total 965'608 792'601 21.8% 2'669'813 1'891'693 41.1%<br />
Flights<br />
Europe 17'770 17'593 1.0% 51'255 48'826 5.0%<br />
Intercontinental 1'819 0 5'297 0<br />
Total 19'589 17'593 11.3% 56'552 48'826 15.8%<br />
Available Seat km (ASK, in mio)<br />
Europe 1'044 1'105 -5.5% 3'044 2'805 8.5%<br />
Intercontinental 2'087 0 6'056 0<br />
Total 3'132 1'105 183.5% 9'100 2'805 224.4%<br />
Revenue Passenger km (RPK, in mio)<br />
Europe 563 623 -9.6% 1'510 1'404 7.6%<br />
Intercontinental 1'578 0 4'672 0<br />
Total 2'141 623 243.6% 6'182 1'404 340.3%<br />
Seat Load Factor (SLF, %) 2)<br />
Europe 54.0% 56.4% -2.5% 49.6% 50.1% -0.5%<br />
Intercontinental 75.6% - 77.2% -<br />
Total 68.4% 56.4% 12.0% 67.9% 50.1% 17.9%<br />
Freight Load Factor Volume (FLF, %) 3)<br />
Intercontinental 87.4% 0 83.9% 0<br />
Freight Tonnes Kilometers (FTK, in 1000)<br />
Intercontinental 120'393 0 335'628 0<br />
1) Revenue Passengers<br />
2) SLF = RPK / ASK<br />
deviation in % pts<br />
3) deviation in % pts